Article

Responses of Soil and Microbial C:N:P Stoichiometry to Vegetation Succession in a Karst Region of Southwest China

1
College of Agronomy, Hunan Agricultural University, Changsha 410128, China
2
Key Laboratory for Agro-ecological Processes in Subtropical Region, Institute of Subtropical Agriculture, Chinese Academy of Sciences, Changsha 410125, China
3
Huanjiang Observation and Research Station for Karst Ecosystem, Chinese Academy of Sciences, Huanjiang 547100, China
*
Author to whom correspondence should be addressed.
Forests 2019, 10(9), 755; https://doi.org/10.3390/f10090755
Submission received: 2 July 2019 / Revised: 16 August 2019 / Accepted: 25 August 2019 / Published: 2 September 2019
(This article belongs to the Section Forest Ecophysiology and Biology)

Abstract

:
Spontaneous vegetation succession after agricultural abandonment is a general phenomenon in many areas of the world. As important indicators of nutrient status and biogeochemical cycling in ecosystems, the stoichiometry of key elements such as carbon (C), nitrogen (N) and phosphorous (P) in soil and microbial biomass, and their responses to vegetation recolonization and succession after agricultural abandonment remain poorly understood. Here, based on a space-for-time substitution approach, surface soil samples (0–15 cm) were collected from four vegetation types, e.g., tussock grassland, shrubland, secondary forest, and primary forest, which represent four successional stages across this region. All samples were examined C, N and P concentrations and their ratios in soil and microbial biomass. The results showed that soil organic C and total N content increased synchronously but total soil P did not remarkably change along a progressive vegetation succession. Consequently, soil C:P and N:P ratios increased while C:N ratio stayed almost unchanged during vegetation succession. Soil microbial biomass C (SMBC) and microbial biomass N (SMBN) concentrations elevated while SMBP did not significantly change during vegetation succession. Unlike the soil C:N:P stoichiometry, however, microbial C:N and C:P ratios were significantly or marginally significantly greater in grassland than in the other three successional stages, while microbial N:P did not significantly vary across the four successional stages. Overall, the present study demonstrated that soil and microbial stoichiometry responded differently to secondary vegetation succession in a karst region of subtropical China.

1. Introduction

Carbon (C), Nitrogen (N) and Phosphorus (P) are three fundamental elements that constitute living organisms, and the biogeochemical cycles of C, N and P are tightly coupled. Since Redfield reported a relatively consistent atomic ratio of C:N:P (106:16:1) in both planktonic biomass and marine waters [1], ecological stoichiometry, which focuses on the balance of multiple chemical elements in ecological interactions, is of growing interest worldwide. C:N:P stoichiometry is also generally used as a powerful indicator of biogeochemical cycles and nutrient status in ecosystems [2,3]. Shifts in the C:N:P stoichiometry may exert strong influences on ecosystem structures, processes, and functioning [4,5,6,7].
Above- and belowground components of ecosystems are closely linked and interconnected [8,9]. For example, the stoichiometry of C, N, and P in the soil could greatly determine aboveground vegetation community structure and growth status [10], while in turn vegetation can affect soil C:N:P stoichiometry through the input of litterfall and root exudate [11]. The response of soil C:N:P stoichiometry to the vegetation change is quite complex [12], largely depending on climatic characteristics, soil initial nutrient status, and vegetation type [13]. As a key ecosystem component, soil microorganisms play a central role in mediating soil organic matter mineralization, biogeochemical cycling, and thus affect ecosystem productivity [14]. Microbial stoichiometry has been considered to override its biomass as a regulator of biogeochemical cycling [15]. It has been shown that the average molar C:N:P ratio in the soil microbial biomass is well-constrained to 60:7:1 throughout global terrestrial ecosystems, indicating soil microorganisms are strictly homeostatic (i.e., microorganism stoichiometry is independent from resource stoichiometry) [2]. However, this concept has frequently been challenged by studies showing strong stoichiometric plasticity in the soil microbial biomass (between 11:1:1 and 93:10:1) across various ecosystem types [16,17]. Hitherto, the relationships between C:N:P stoichiometry in the soil and soil microorganisms have far from been completely understood [18].
Karst landscape is a critical component of the earth’s surface system. Southwest China, where covering about 51 million ha of contiguous outcropped carbonate rock area, is one of the largest karst area in the world. During the period between 1949 and the end of the 1970s, intensive human disturbances, e.g., deforestation to reclaim land for food production, led to severe rocky desertification in the karst areas of Southwest China [19]. In order to recover and improve the ecological environment, China has launched several nationwide ecological restoration projects since the 1970s, including the Natural Forest Protection Project, the Grain to Green Project, and the Karst Rocky Desertification Restoration Project [20,21,22]. In this context, vegetation restoration following agricultural land abandonment via afforestation or natural regeneration represents a general change of land use and land cover in the karst region of Southwest China. The karst region of Southwest China is also becoming a new hotspot for C sequestration in the world [23].
Generally, plant communities typically shift stage by stage from grass-dominated to shrub-dominated and then to arbor-dominated during the process of ecological succession [24,25]. However, the rate of vegetation succession may be greatly constrained by soil nutrient status, e.g., N and P [26]. Previous studies have demonstrated significant effects of vegetation succession on C sequestration [27,28], N stock [29], microbial community [30,31], and biogeochemical processes [32,33,34]. Furthermore, Zhang et al. [35] found that plant community foliar N:P increased as succession proceeded from the grassland to the secondary and primary forest communities. Although the stoichiometric characteristics of plant communities could largely be influenced by stoichiometry of the habitat [36], few studies have directly examined the stoichiometric characteristics of C, N, and P in the soil and soil microbial biomass and their relationships in response to vegetation succession in karst ecosystems [37].
A better understanding of the correlations between C:N:P stoichiometry in the soil and microorganisms along vegetation succession is important for assessing nutrient limitation of ecosystem processes and then developing appropriate management strategies to enhance the sustainability of karst ecosystems. Currently, one of the greatest controversies is whether microorganisms are strictly homeostatic (where microorganism stoichiometry is independent from resource stoichiometry) or non-homeostatic (where microorganism stoichiometry is controlled by substrate stoichiometry). In the present study, we hypothesized that (1) the stoichiometric ratio of soil or soil microorganisms would increase along with vegetation succession in the karst region of Southwest China, as soil organic C and N accumulated rapidly during vegetation restoration while soil P changed slightly [29]; (2) The C:N:P stoichiometry in the soil microbial biomass would also increase along the vegetation succession, due to changes in the substrate availability, i.e., microbial C:N:P stoichiometry is non-homeostatic.

2. Materials and Methods
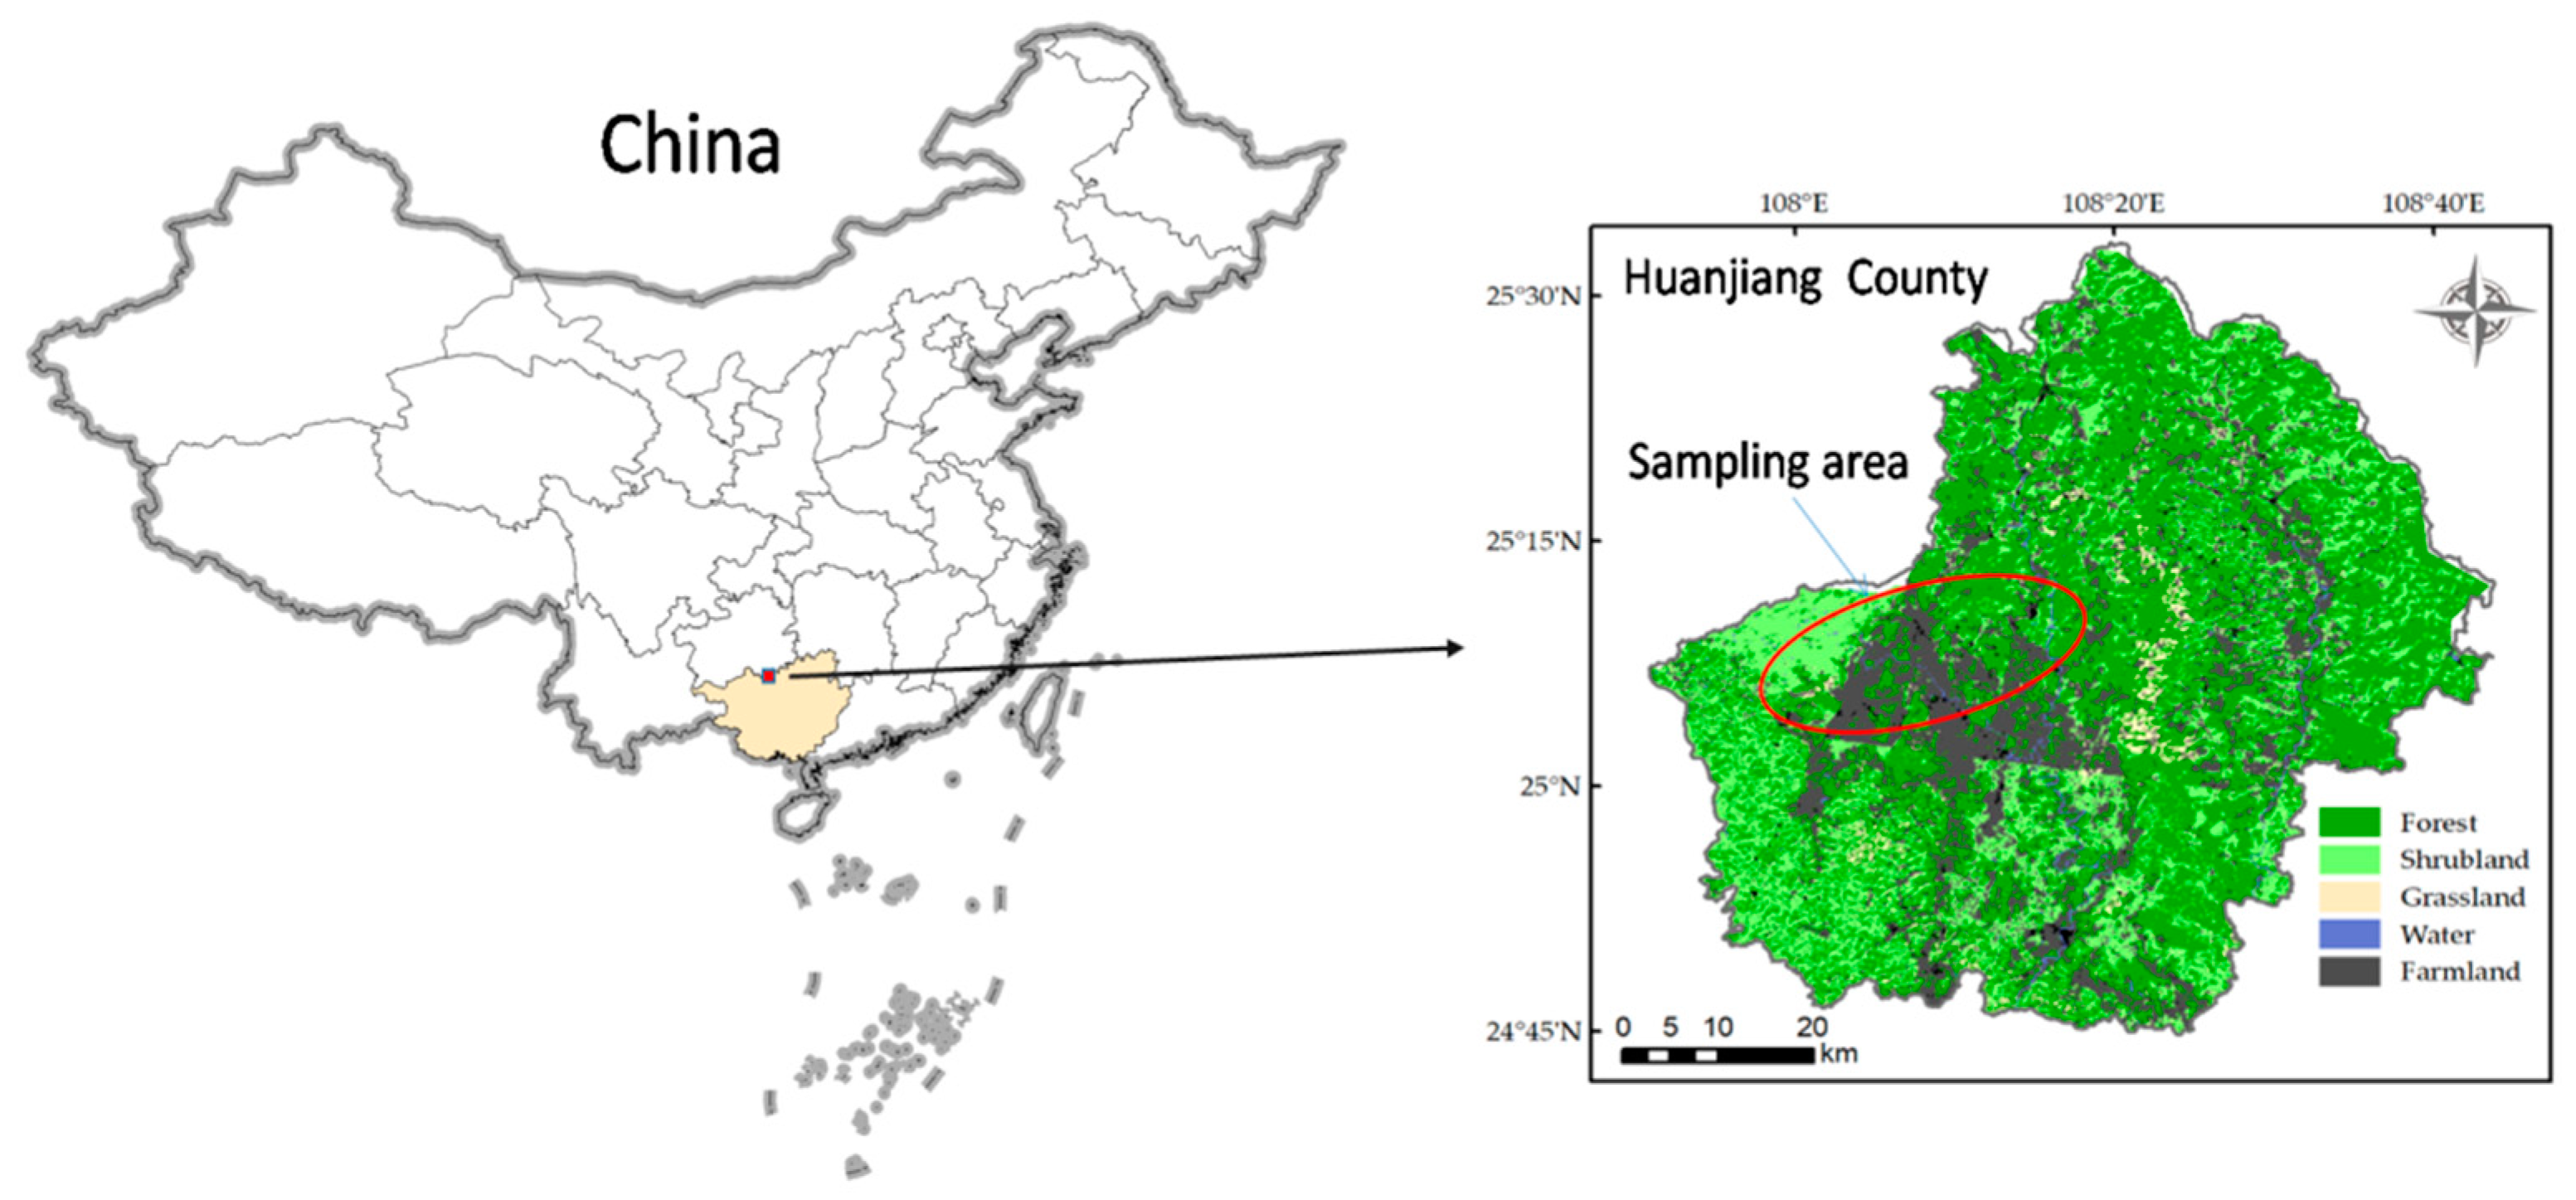
2.1. Study Region

This study was conducted in Maonan county (23°40′ N–25°25′ N, 107°35′ E–108°30′ E) in the northwest of Guangxi Zhuang Autonomous Region, Southwest China (Figure 1), which belongs to subtropical monsoon climate with mean annual air temperature of 17.8–21.1 °C. The mean annual precipitation ranges from 1346 to 1640 mm, and the time from April to September is recognized as the wet season and that from October to March is the dry season. The area has typical karst landscape, with gentle valleys surrounded by steep hills. The soil is categorized as Leptosols according to the FAO classification system [38].

2.2. Soil Sampling

An approach of space-for-time substitution was adopted in the study. Grassland, shrubland and secondary forest, which naturally regenerates from maize-soybean fields, were selected to represent three post-agricultural successional stages with a primary forest as reference. The land use history for grassland, shrubland and secondary forest was obtained by interviewing local residents. The duration of agricultural abandonment approximately ranged from 5 to 10 years, 10 to 20 years and 30 to 50 years for grassland, shrubland, and secondary forest, respectively. The stand characteristics are presented in Table 1.
The field sampling was carried out between the mid of May and early June in 2017. Six sampling sites were selected for each vegetation type, and a plot of 20 m × 20 m was established at each sampling site. The distance for each sampling sites ranged from 500 m to 2 km. Surface soil samples (0–15 cm), which is the layer always with the highest organic matter content and greatest microbial activity through the soil profile, were collected with a stainless-steel auger (5 cm in diameter). We collected 10 soil cores randomly at each plot and mixed thoroughly to form a composite sample. Fresh soil samples were stored in a cool box until transported to the laboratory. After transporting to the laboratory, the fresh soils were hand-sorted to remove roots and stones and sieved to pass a 2 mm mesh. A subsample of the fresh soil was stored at 4 °C for analysis of soil microbial biomass. The other subsample of fresh soil was further air-dried and ground to pass through a 0.25 mm sieve for measurements of soil organic carbon (SOC), total soil N (TN) and total soil P (TP).

2.3. Chemical Analysis

The SOC was determined by wet oxidation with KCr2O7 + H2SO4 and titrate with FeSO4 [39]. The TN was determined by an elemental analyzer (EA 3000, EuroVector, Italy). The TP was measured by a colorimetric method after acid digestion with a H2SO4 + HClO4 solution [40]. Soil microbial biomass C (SMBC), soil microbial biomass N (SMBN), and soil microbial biomass P (SMBP) were analyzed by the chloroform fumigation-extraction method [41,42].

2.4. Data Analysis

In the study, the ratios of soil and microbial biomass C:N, C:P, and N:P were calculated on a molar basis. Statistical analyses were conducted with SPSS v. 19.0 (SPSS Inc., Chicago, IL, USA). Differences in C, N and P stoichiometric ratios in soil and microbial biomass among various successional stages were examined using a one-way analysis of variance (ANOVA) with Tukey’s post-hoc test. Pearson’s correlation was used to identify the relationships between stoichiometric ratios of C:N, C:P and N:P in the soil and microbial biomass. All reported significant differences in this study are at p < 0.05 unless otherwise stated.

3. Results

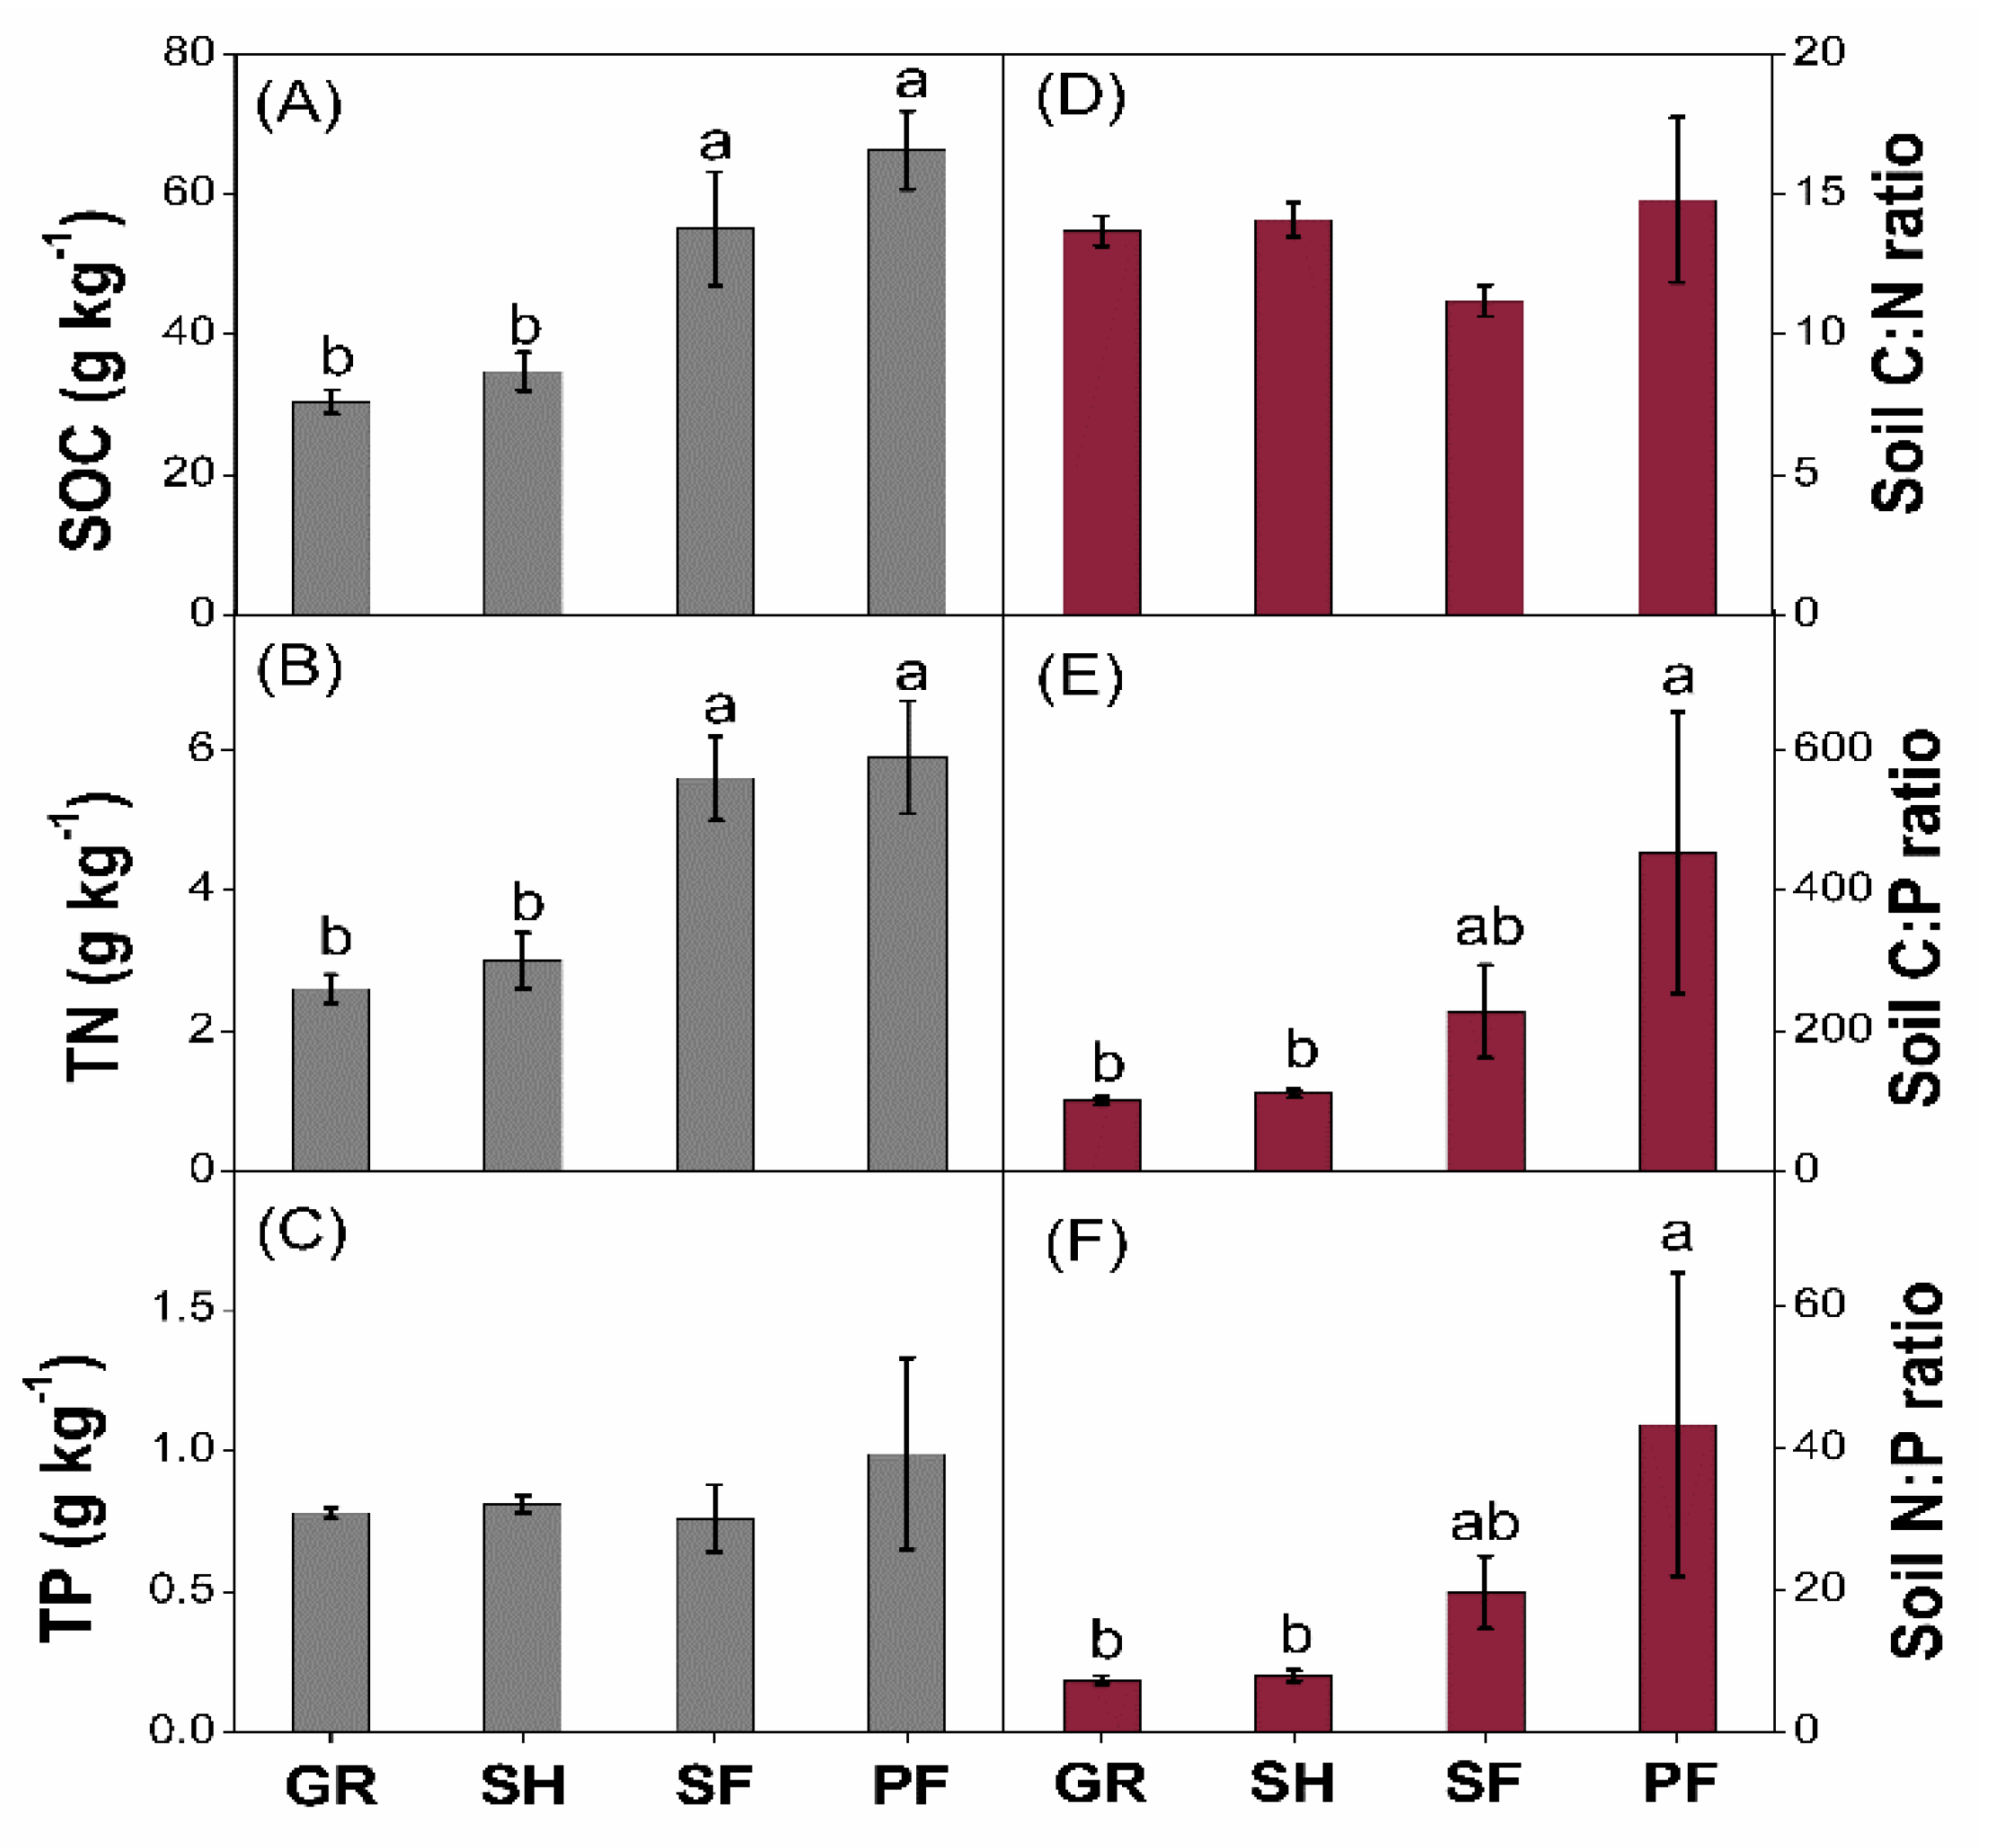
3.1. Soil C:N:P Stoichiometry

Both the SOC and TN concentrations were significantly greater in secondary and primary forests than those in shrublands and grasslands (Figure 2A,B), while TP did not significantly differ among vegetation types (Figure 2C). No significant variation was observed in soil C:N ratio under different vegetation types (Figure 2D). The patterns for soil C:P and N:P ratio were similar, both of which were greater in primary forest relative to grassland and shrubland (Figure 2E,F).

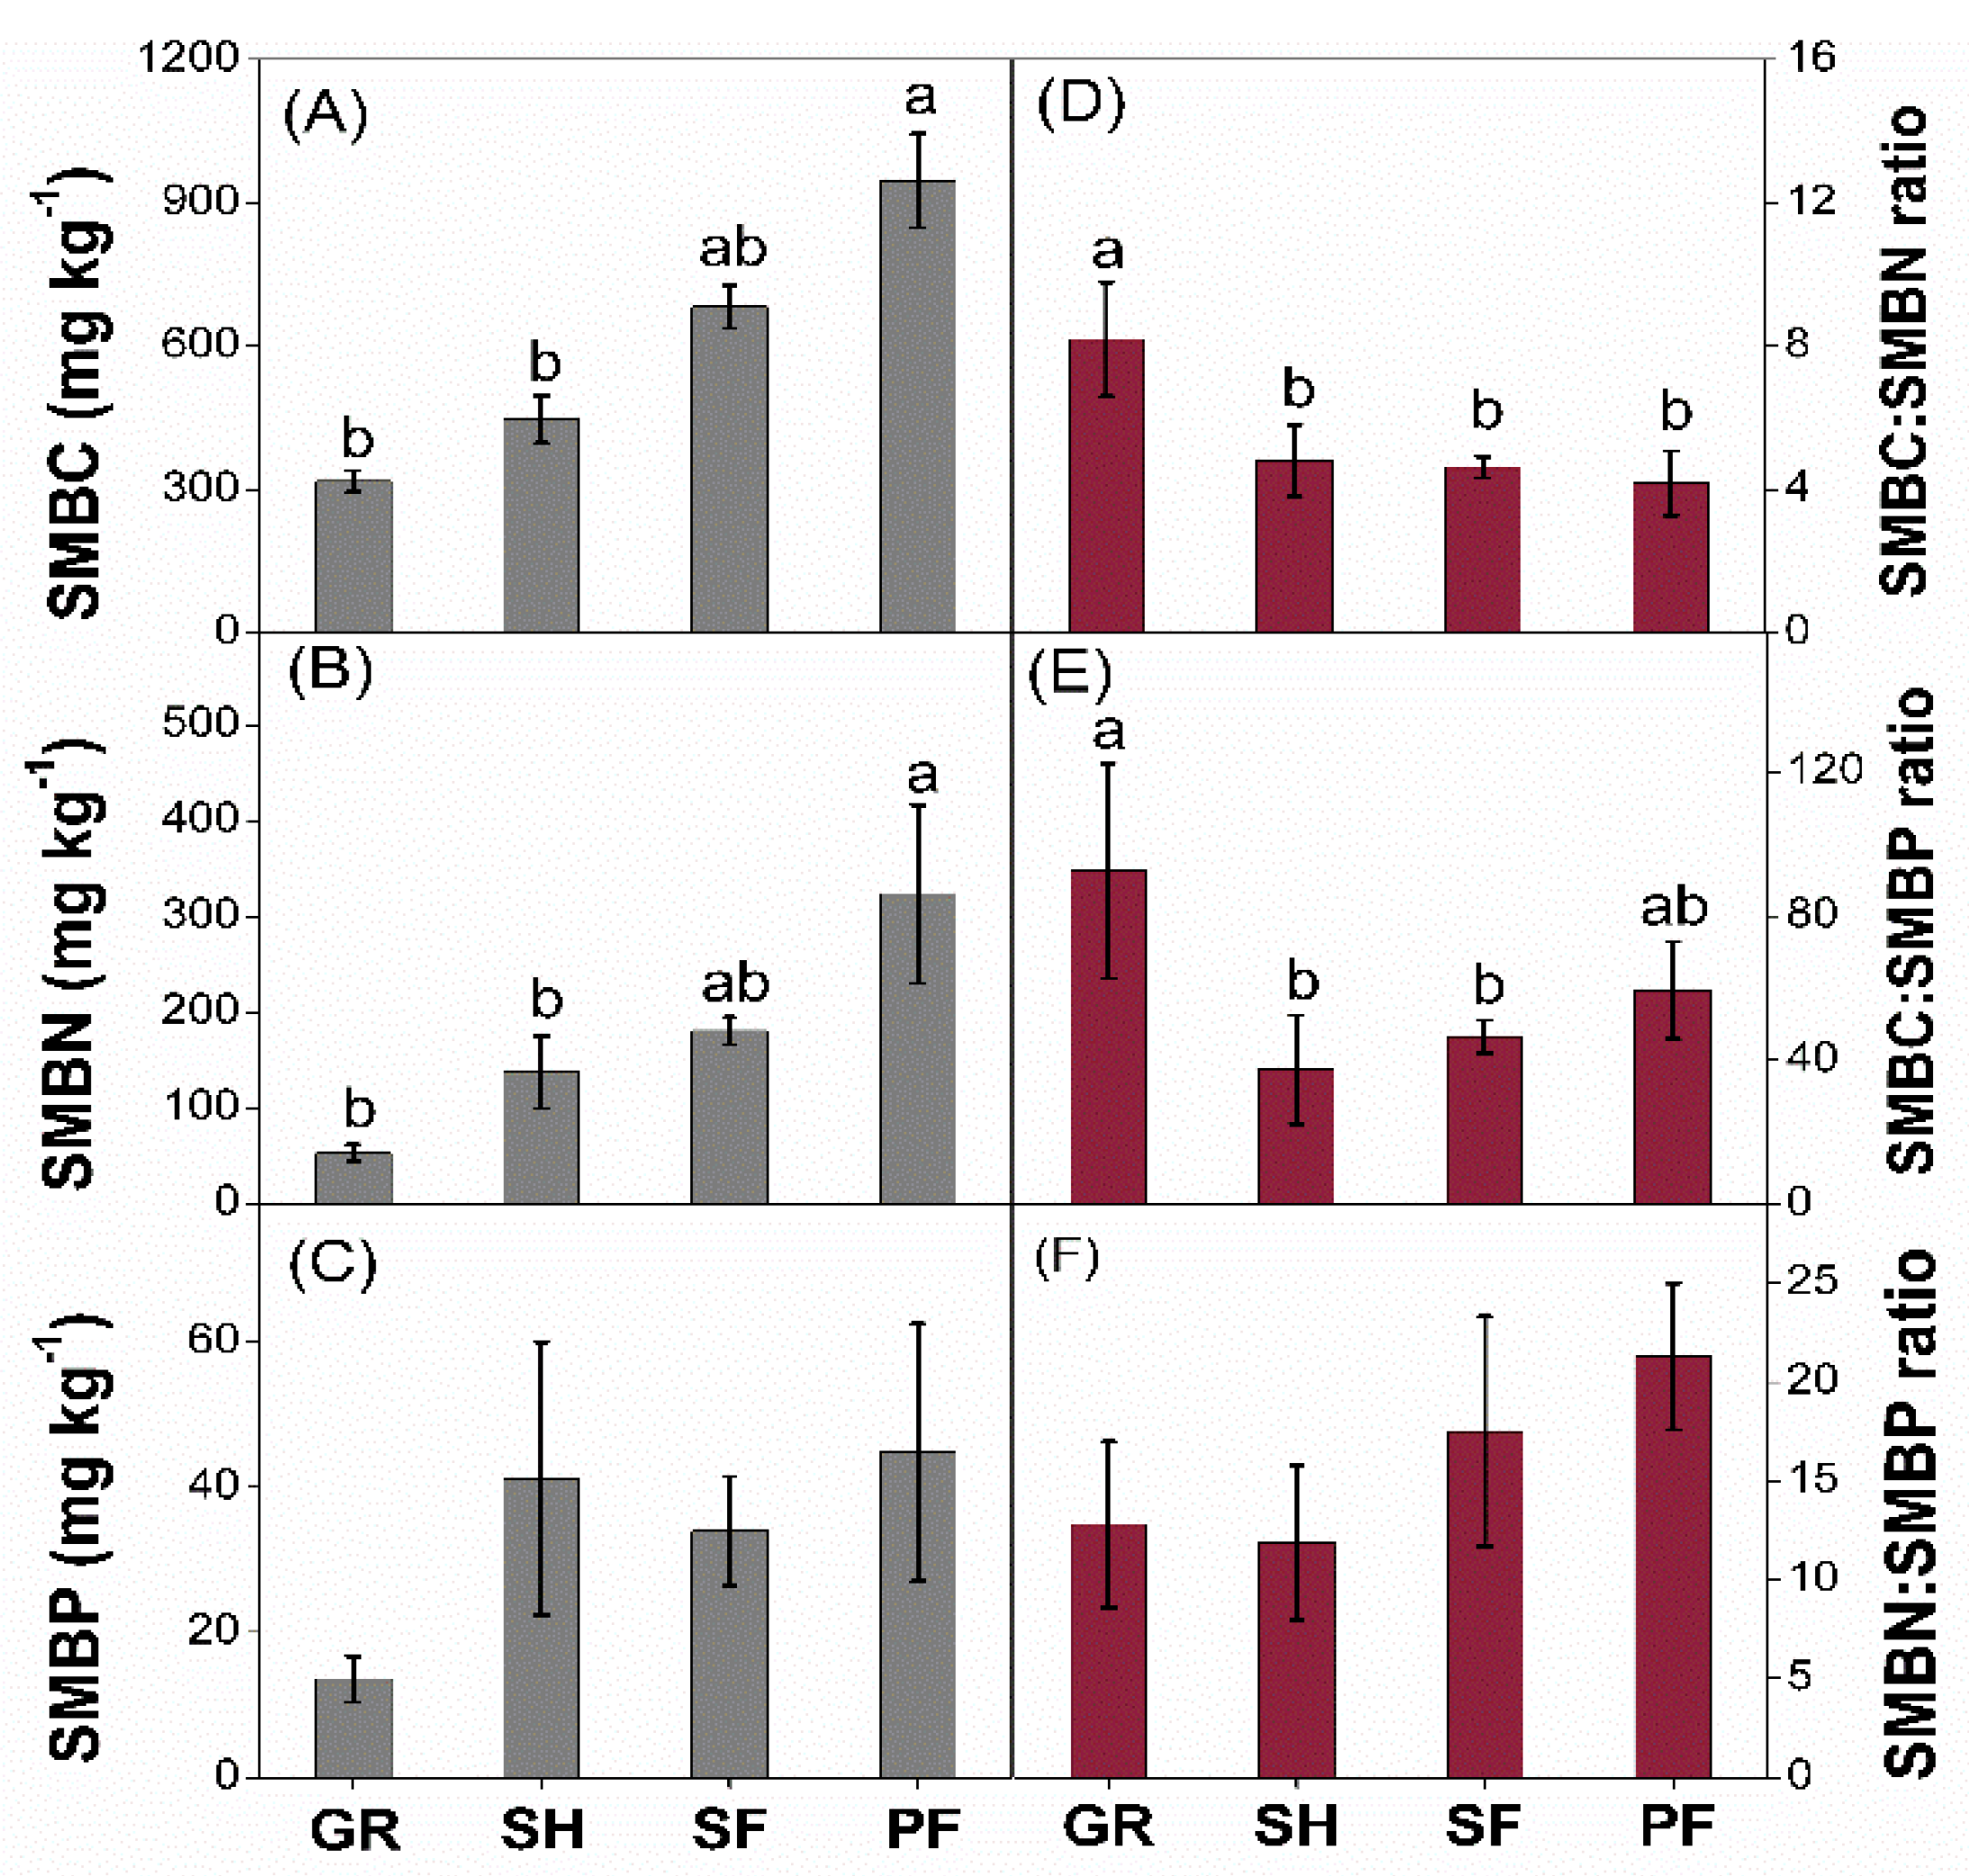
3.2. Microbial C:N:P Stoichiometry

Both SMBC and SMBN concentration exhibited an increasing trend along a progressive succession of secondary vegetation, i.e., from grassland to shrubland and then to forest (Figure 3A,B). SMBP concentration was slightly lower in grassland, but no statistical difference was found across the four vegetation types (Figure 3C). The SMBC:SMBN ratio was significantly greater in grassland than that in shrubland, secondary forest and primary forest, and no significant difference was observed among the latter three vegetation types (Figure 3D). The SMBC:SMBP ratio was significantly higher in grassland relative to shrubland and secondary forest (Figure 3E). The SMBN:SMBP ratio did not significantly vary among various vegetation types (Figure 3F).

3.3. Relationships between Soil and Microbial C:N:P Stoichiometry

According to the results of correlation analysis, SOC was highly correlated with TN, but did not correlate significantly with TP (Table 2). TP was significantly correlated with SMBC, as well as SMBN and SMBP (p < 0.05). Soil C:P ratio and N:P ratio was strongly correlated (p < 0.01, Table 2). In addition, SMBC:SMBN ratio and SMBC:SMBP ratio, as well as SMBC:SMBP ratio and SMBN:SMBP ratio, were significantly correlated (p < 0.05). In terms of relationships between soil and microbial C:N:P stoichiometry, a significant relationship was found only between soil N:P ratio and SMBN:SMBP ratio (p < 0.05).

4. Discussion

4.1. Vegetation Succession Effects on Soil C:N:P Stoichiometry

Vegetation often plays an important role in mediating the C:N:P ratios in soil by absorbing/releasing these elements from/to soil. Our study demonstrated that soil C:N:P ratios varied along a progressive succession of secondary vegetation in the karst region of Southwest China (Figure 2), supporting our hypothesis that vegetation succession after agricultural abandonment has a deep influence on soil nutrient status and biogeochemical cycling. Soil organic C and total N concentration increased synchronously during vegetation succession in the soil layer 0–15 cm. The remarkable increase of soil N after agricultural abandonment in this region could likely be attributed to biological N fixation. In addition, parent bedrocks might also be a potential contributor of N in this region [29,33]. In this study, total soil P did not significantly vary after agricultural abandonment, similar to the findings of Wang et al. [43] who showed that there was no significant change in total soil P during 50 years vegetation restoration on Loess Plateau. In spite of vegetation change, the soil C:N ratio varied in a narrow range (11.2–14.8) (Figure 2D). This was in agreement with Li et al. [44] who observed soil C:N ratios were well-constrained (6.9–14.6) in subtropical ecosystems in China. However, soil C:P (100.5–453.9) and N:P (7.4–43.4) ratios had a greater range of values than C:N ratio. Furthermore, both soil C:P and N:P ratios exhibited an increasing trend and highest in primary forest (Figure 2E,F), indicating P limitation would be exacerbated as succession proceeds. Consistently, Zhang et al. [35] also suggested that, based on the plant community foliar N:P, nutrient limitation would change from N-limited in grassland to N and P co-limited in shrubland, and then to P-limited in secondary and primary forests during secondary succession in karst ecosystems. In addition, other studies also stressed the possible P deficiencies during the vegetation restoration in karst ecosystems [45].

4.2. Vegetation Succession Effects on Microbial C:N:P Stoichiometry

In comparison with C:N:P stoichiometry in the bulk soil, nutrient concentrations and stoichiometric characteristics in microbial biomass have generally been considered more effective and sensitive indicators of soil fertility and nutrient limitation [6,46]. The SMBC:SMBN ratio measured in this study ranged from 4.2 to 8.2 across successional stages, consistent with Hu et al. [37] who reported the SMBC:SMBN ratio ranged from 6.5 to 8.1, with a mean value of 7.3 in reforested land in the same region. Our results were also close to an average microbial C:N ratio of 8.6 at the global scale [2]. Being different from changes in the concentrations of SMBC and SMBN, i.e., increasing with progressive vegetation succession, both SMBC:SMBN ratio and SMBC:SMBP ratio were highest in grassland (Figure 3D,E). This could have resulted from the disproportionate increase of SMBC, SMBN, and SMBP during the process of secondary succession.
In contrast to Li et al. [44] who found significant correlation between soil C:P ratio and SMBC:SMBP ratio, we found a significant correlation (r = 0.54, p < 0.05) between the soil N:P ratio and SMBN:SMBP ratio, while the relationships were not evident between soil C:N ratio and SMBC:SMBN ratio as well as between soil C:P ratio and SMBC:SMBP ratio. Li et al. [44] suggested that elemental stoichiometry in the soil microbial biomass of the terrestrial ecosystems in southern subtropical China was possibly non-homeostatic, since C:N:P stoichiometry was found to correlate between microbes and the soil environment. In addition, many other studies also revealed that microbial C:N:P stoichiometry is flexible in response to environmental change [16,17,37]. Variations in microbial C:N:P stoichiometry under changing environmental conditions might be ascribed to shifts in microbial community structure, as species differ in C:N:P ratios [17,18,47]. Generally, fungi have a higher C:N ratio relative to bacteria [48]. Moreover, microorganisms are able to take up resources in excess and to store them in the form of e.g., glycogen or polyphosphates, resulting in variations in their biomass C:N:P ratio [46,49,50].

5. Conclusions

Overall, in accordance with our hypotheses, both the soil and microbial C:N:P stoichiometry varied along a progressive vegetation succession after agricultural abandonment in a karst region of southwest China, suggesting an impact of vegetation succession on soil nutrient status. Specifically, soil C and N increased synchronously along with vegetation succession, resulting in an insignificant variation in soil C:N ratio. In addition, total soil P responded weakly to vegetation succession, leading to an increase in soil C:P and N:P ratio along vegetation succession. The increased C:P and N:P ratios in soil suggested P limitation would exacerbate during vegetation succession. Consistent with contents of soil C, N and P, both concentrations of SMBC and SMBN increased along with vegetation succession while SMBP concentration did not significantly differ across various successional stages. Unlike the soil C:N:P stoichiometry, however, SMBC:SMBN and SMBC:SMBP ratios were significantly or marginally significantly greater in grassland than other successional stages while SMBN:SMBP did not significantly vary across all the successional stages. The present study reveals a different response of soil and microbial stoichiometry to secondary vegetation succession in a karst region of subtropical China. Further investigation is required to uncover the associated ecological factors and underlying mechanisms for shaping these patterns of soil and microbial C:N:P stoichiometry.

Author Contributions

Funding acquisition, W.P.; investigation, H.D.; Supervision, W.P. and Q.X.; data analysis, M.S.; writing-original draft, M.S.; writing-review & editing, M.S. and Q.X.

Funding

This work was funded by the National Key Research and Development Plan of China (2016YFC0502405), National Natural Science Foundation of China (31770495), Guangxi Provincial Program of Science and Technology of China (2016AB12095, AB17129009).

Acknowledgments

We thank the anoymous reviewers for their constructive suggestions to improve this manuscript.

Conflicts of Interest

The authors declare no conflict of interest.

References

  1. Redfield, A.C. The biological control of chemical factors in the environment. Am. Sci. 1958, 46, 205–221. [Google Scholar]
  2. Cleveland, C.C.; Liptzin, D. C:N:P stoichiometry in soil: Is there a “Redfield ratio” for the microbial biomass? Biogeochemistry 2007, 85, 235–252. [Google Scholar] [CrossRef]
  3. Tian, H.; Chen, G.; Zhang, C.; Melillo, J.M.; Hall, C.A.S. Pattern and variation of C:N:P ratios in China’s soils: A synthesis of observational data. Biogeochemistry 2010, 98, 139–151. [Google Scholar] [CrossRef]
  4. Mooshammer, M.; Wanek, W.; Schnecker, J.; Wild, B.; Leitner, S.; Hofhansl, F.; Bloechl, A.; Haemmerle, I.; Frank, A.H.; Fuchslueger, L.; et al. Stoichiometric controls of nitrogen and phosphorus cycling in decomposing beech leaf litter. Ecology 2012, 93, 770–782. [Google Scholar] [CrossRef] [PubMed]
  5. Penuelas, J.; Sardans, J.; Rivas-Ubach, A.; Janssens, I.A. The human-induced imbalance between C, N and P in Earth’s life system. Glob. Chang. Biol. 2012, 18, 3–6. [Google Scholar] [CrossRef]
  6. Sardans, J.; Rivas-Ubach, A.; Penuelas, J. The C:N:P stoichiometry of organisms and ecosystems in a changing world: A review and perspectives. Perspect. Plant. Ecol. 2012, 14, 33–47. [Google Scholar] [CrossRef]
  7. Fan, H.; Wu, J.; Liu, W.; Yuan, Y.; Hu, L.; Cai, Q. Linkages of plant and soil C:N:P stoichiometry and their relationships to forest growth in subtropical plantations. Plant. Soil 2015, 392, 127–138. [Google Scholar] [CrossRef]
  8. Lambers, H.; Mougel, C.; Jaillard, B.; Hinsinger, P. Plant-microbe-soil interactions in the rhizosphere: An evolutionary perspective. Plant. Soil 2009, 321, 83–115. [Google Scholar] [CrossRef]
  9. Abbott, L.K.; Tang, C.; Reuter, D. Soil-plant-microbe interactions from microscopy to field practice. Plant. Soil 2011, 348, 1–5. [Google Scholar] [CrossRef] [Green Version]
  10. Bui, E.N.; Henderson, B.L. C:N:P stoichiometry in Australian soils with respect to vegetation and environmental factors. Plant. Soil 2013, 373, 553–568. [Google Scholar] [CrossRef]
  11. Zechmeister-Boltenstern, S.; Keiblinger, K.M.; Mooshammer, M.; Penuelas, J.; Richter, A.; Sardans, J.; Wanek, W. The application of ecological stoichiometry to plant-microbial-soil organic matter transformations. Ecol. Monogr. 2015, 85, 133–155. [Google Scholar] [CrossRef]
  12. Zhou, Y.; Boutton, T.W.; Wu, X.B. Soil C:N:P stoichiometry responds to vegetation change from grassland to woodland. Biogeochemistry 2018, 140, 341–357. [Google Scholar] [CrossRef]
  13. Zhao, F.; Sun, J.; Ren, C.; Kang, D.; Deng, J.; Han, X.; Yang, G.; Feng, Y.; Ren, G. Land use change influences soil C, N, and P stoichiometry under ‘Grain-to-Green Program’ in China. Sci. Rep. 2015, 5, 10195. [Google Scholar]
  14. Van der Heijden, M.G.A.; Bardgett, R.D.; van Straalen, N.M. The unseen majority: Soil microbes as drivers of plant diversity and productivity in terrestrial ecosystems. Ecol. Lett. 2008, 11, 296–310. [Google Scholar] [CrossRef] [PubMed]
  15. Buchkowski, R.W.; Schmitz, O.J.; Bradford, M.A. Microbial stoichiometry overrides biomass as a regulator of soil carbon and nitrogen cycling. Ecology 2015, 96, 1139–1149. [Google Scholar] [CrossRef] [PubMed] [Green Version]
  16. Tischer, A.; Potthast, K.; Hamer, U. Land-use and soil depth affect resource and microbial stoichiometry in a tropical mountain rainforest region of southern Ecuador. Oecologia 2014, 175, 375–393. [Google Scholar] [CrossRef] [PubMed]
  17. Chen, Y.L.; Chen, L.Y.; Peng, Y.F.; Ding, J.Z.; Li, F.; Yang, G.B.; Kou, D.; Liu, L.; Fang, K.; Zhang, B.B.; et al. Linking microbial C:N:P stoichiometry to microbial community and abiotic factors along a 3500-km grassland transect on the Tibetan Plateau. Glob. Ecol. Biogeogr. 2016, 25, 1416–1427. [Google Scholar] [CrossRef]
  18. Fanin, N.; Fromin, N.; Buatois, B.; Haettenschwiler, S. An experimental test of the hypothesis of non-homeostatic consumer stoichiometry in a plant littermicrobe system. Ecol. Lett. 2013, 16, 764–772. [Google Scholar] [CrossRef]
  19. Wang, S.J.; Liu, Q.M.; Zhang, D.F. Karst rocky desertification in southwestern China: Geomorphology, landuse, impact and rehabilitation. Land Degrad. Dev. 2004, 15, 115–121. [Google Scholar] [CrossRef]
  20. Yin, R.; Yin, G. China’s Primary Programs of Terrestrial Ecosystem Restoration: Initiation, Implementation, and Challenges. Environ. Manag. 2010, 45, 429–441. [Google Scholar] [CrossRef]
  21. Shi, S.; Han, P. Estimating the soil carbon sequestration potential of China’s Grain for Green Project. Glob. Biogeochem. Cycles 2014, 28, 1279–1294. [Google Scholar] [CrossRef]
  22. Lu, F.; Hu, H.; Sun, W.; Zhu, J.; Liu, G.; Zhou, W.; Zhang, Q.; Shi, P.; Liu, X.; Wu, X.; et al. Effects of national ecological restoration projects on carbon sequestration in China from 2001 to 2010. Proc. Natl. Acad. Sci. USA 2018, 115, 4039–4044. [Google Scholar] [CrossRef] [PubMed] [Green Version]
  23. Tong, X.; Brandt, M.; Yue, Y.; Horion, S.; Wang, K.; Keersmaecker, W.D.; Feng, T.; Schurgers, G.; Xiao, X.; Luo, Y. Increased vegetation growth and carbon stock in China karst via ecological engineering. Nat. Sustain. 2018, 1, 44–50. [Google Scholar] [CrossRef]
  24. Zhang, J.T. Succession analysis of plant communities in abandoned croplands in the eastern Loess Plateau of China. J. Arid Environ. 2005, 63, 458–474. [Google Scholar] [CrossRef]
  25. Wen, L.; Song, T.; Du, H.; Wang, K.; Peng, W.; Zeng, F.; Zeng, Z.; He, T. The succession characteristics and its driving mechanism of plant community in karst region, Southwest China. Acta Ecol. Sin. 2015, 35, 5822–5833. [Google Scholar]
  26. Niinemets, U.; Kull, K. Co-limitation of plant primary productivity by nitrogen and phosphorus in a species-rich wooded meadow on calcareous soils. Acta Oecol. 2005, 28, 345–356. [Google Scholar] [CrossRef]
  27. Liu, S.; Zhang, W.; Wang, K.; Pan, F.; Yang, S.; Shu, S. Factors controlling accumulation of soil organic carbon along vegetation succession in a typical karst region in Southwest China. Sci. Total Environ. 2015, 521, 52–58. [Google Scholar] [CrossRef]
  28. Xiao, K.; He, T.; Chen, H.; Peng, W.; Song, T.; Wang, K.; Li, D. Impacts of vegetation restoration strategies on soil organic carbon and nitrogen dynamics in a karst area, Southwest China. Ecol. Eng. 2017, 101, 247–254. [Google Scholar] [CrossRef]
  29. Wen, L.; Li, D.; Yang, L.; Luo, P.; Chen, H.; Xiao, K.; Song, T.; Zhang, W.; He, X.; Chen, H.; et al. Rapid recuperation of soil nitrogen following agricultural abandonment in a karst area, southwest China. Biogeochemistry 2016, 129, 341–354. [Google Scholar] [CrossRef]
  30. Zhu, H.; He, X.; Wang, K.; Su, Y.; Wu, J. Interactions of vegetation succession, soil bio-chemical properties and microbial communities in a Karst ecosystem. Eur. J. Soil Biol. 2012, 51, 1–7. [Google Scholar] [CrossRef]
  31. Zhao, C.; Long, J.; Liao, H.; Zheng, C.; Li, J.; Liu, L.; Zhang, M. Dynamics of soil microbial communities following vegetation succession in a karst mountain ecosystem, Southwest China. Sci. Rep. 2019, 9, 2160. [Google Scholar] [CrossRef] [PubMed]
  32. Zhang, K.; Cheng, X.; Dang, H.; Ye, C.; Zhang, Y.; Zhang, Q. Linking litter production, quality and decomposition to vegetation succession following agricultural abandonment. Soil Biol. Biochem. 2013, 57, 803–813. [Google Scholar] [CrossRef]
  33. Xiao, K.; Li, D.; Wen, L.; Yang, L.; Luo, P.; Chen, H.; Wang, K. Dynamics of soil nitrogen availability during post-agricultural succession in a karst region, southwest China. Geoderma 2018, 314, 184–189. [Google Scholar] [CrossRef]
  34. Song, M.; He, T.; Chen, H.; Wang, K.; Li, D. Dynamics of soil gross nitrogen transformations during post-agricultural succession in a subtropical karst region. Geoderma 2019, 341, 1–9. [Google Scholar] [CrossRef]
  35. Zhang, W.; Zhao, J.; Pan, F.; Li, D.; Chen, H.; Wang, K. Changes in nitrogen and phosphorus limitation during secondary succession in a karst region in southwest China. Plant. Soil 2015, 391, 77–91. [Google Scholar] [CrossRef]
  36. Gusewell, S. N:P ratios in terrestrial plants: Variation and functional significance. New Phytol. 2004, 164, 243–266. [Google Scholar] [CrossRef]
  37. Hu, N.; Li, H.; Tang, Z.; Li, Z.; Li, G.; Jiang, Y.; Hu, X.; Lou, Y. Community size, activity and C:N stoichiometry of soil microorganisms following reforestation in a Karst region. Eur. J. Soil Biol. 2016, 73, 77–83. [Google Scholar] [CrossRef]
  38. WRB. World Reference Base for Soil Resources; FAO, ISRIC, ISSS: Rome, Italy, 2006. [Google Scholar]
  39. Lu, R. Methods of Soil Science and Agricultural Chemistry Analysis; China Agriculture Press: Beijing, China, 2000. (In Chinese) [Google Scholar]
  40. John, M.K. Colorimetric determination of phosphorus in soil and plant materials with ascorbic acid. Soil Sci. 1970, 109, 214–220. [Google Scholar] [CrossRef]
  41. Brookes, P.C.; Powlson, D.S.; Jenkinson, D.S. Measurement of microbial biomass phosphorus in soil. Soil Biol. Biochem. 1982, 14, 319–329. [Google Scholar] [CrossRef]
  42. Wu, J.; Joergensen, R.G.; Pommerening, B.; Chaussod, R.; Brookes, P.C. Measurement of soil microbial biomass C by fumigation-extraction-an automated procedure. Soil Biol. Biochem. 1990, 22, 1167–1169. [Google Scholar] [CrossRef]
  43. Wang, B.; Liu, G.B.; Xue, S.; Zhu, B. Changes in soil physico-chemical and microbiological properties during natural succession on abandoned farmland in the Loess Plateau. Environ. Earth Sci. 2011, 62, 915–925. [Google Scholar] [CrossRef]
  44. Li, Y.; Wu, J.; Liu, S.; Shen, J.; Huang, D.; Su, Y.; Wei, W.; Syers, J.K. Is the C:N:P stoichiometry in soil and soil microbial biomass related to the landscape and land use in southern subtropical China? Glob. Biogeochem. Cycles 2012, 26, GB4002. [Google Scholar] [CrossRef]
  45. Du, Y.; Pan, G.; Li, L.; Hu, Z.; Wang, X. Leaf N/P ratio and nutrient reuse between dominant species and stands: Predicting phosphorus deficiencies in Karst ecosystems, southwestern China. Environ. Earth Sci. 2011, 64, 299–309. [Google Scholar] [CrossRef]
  46. Heuck, C.; Weig, A.; Spohn, M. Soil microbial biomass C:N:P stoichiometry and microbial use of organic phosphorus. Soil Biol. Biochem. 2015, 85, 119–129. [Google Scholar] [CrossRef]
  47. Ren, C.; Zhao, F.; Kang, D.; Yang, G.; Han, X.; Tong, X.; Feng, Y.; Ren, G. Linkages of C:N:P stoichiometry and bacterial community in soil following afforestation of former farmland. For. Ecol. Manag. 2016, 376, 59–66. [Google Scholar] [CrossRef]
  48. Strickland, M.S.; Rousk, J. Considering fungal: Bacterial dominance in soils—Methods, controls, and ecosystem implications. Soil Biol. Biochem. 2010, 42, 1385–1395. [Google Scholar] [CrossRef]
  49. Wilson, W.A.; Roach, P.J.; Montero, M.; Baroja-Fernandez, E.; Jose Munoz, F.; Eydallin, G.; Viale, A.M.; Pozueta-Romero, J. Regulation of glycogen metabolism in yeast and bacteria. FEMS Microbiol. Rev. 2010, 34, 952–985. [Google Scholar] [CrossRef] [Green Version]
  50. Achbergerova, L.; Nahalka, J. Polyphosphate-an ancient energy source and active metabolic regulator. Microb. Cell Fact. 2011, 10, 63. [Google Scholar] [CrossRef]
Figure 1. The location of the study area.
Forests 10 00755 g001
Figure 2. Changes in SOC (A), TN (B), TP (C), and stoichiometric ratios of soil C:N (D), C:P (E) and N:P (F). along vegetation succession in a karst region of southwest China. GR = grassland, SH = shrubland, SF = secondary forest, and PF = primary forest. Values are the means ± SE (n = 6). Different lowercases on the column denote significant difference between successional stages at p < 0.05.
Forests 10 00755 g002
Figure 3. Variations in SMBC (A), SMBN (B), SMBP (C), and stoichiometric ratios of SMBC:SMBN (D), SMBC:SMBP (E) and SBMN:SMBP (F) along vegetation succession in a karst region of southwest China. GR = grassland, SH = shrubland, SF = secondary forest, and PF = primary forest. Values are the means ± SE (n = 6). Different lowercases on the column denote significant difference between successional stages at p < 0.05.
Forests 10 00755 g003
Table 1. The plot characteristics of the four successional stages in a karst region of Southwest China.
Vegetation TypeCanopy Cover (%)Community Height (m)Dominant SpeciesAltitude (m)Slope (o)
Grassland 74.2 ± 5.51.6 ± 0.5Ischaemum indicum, Imperata cylindrical, Murdannia triquetra287–30726.3 ± 5.5
Shrubland82.5 ± 2.72.2 ± 0.4Vitex negundo, Rhus chinensis294–30928.9 ± 6.8
Secondary forest 77.5 ± 4.16.8 ± 0.7Alangium chinense, Itoa orientalis292–35630.7 ± 7.2
Primary forest88.4 ± 3.88.5 ± 0.5Biota orientalis, Sinosideroxylon pedunculatum376–57834.5 ± 4.5
Table 2. Pearson’s correlations coefficients (r) between the concentrations of C, N, P, and their stoichiometric ratios in the soil and microbial biomass.
SOCTNTPSMBCSMBNSMBPSoil C:NSoil C:PSoil N:PSMBC:SMBNSMBC:SMBPSMBN:SMBP
SOC10.78 **0.360.360.68 **0.360.220.330.28−0.45 *−0.330.06
TN 1−0.020.010.22−0.01−0.43 *0.55 **0.55 **−0.49 *−0.380.21
TP 10.77 **0.58 **0.46 *0.53 **−0.57 **−0.58 **0.180.10−0.26
SMBC 10.65 **0.330.56 **−0.18−0.200.230.32−0.02
SMBN 10.73 **0.66 **0.01−0.03−0.36−0.160.07
SMBP 10.55 **−0.15−0.19−0.28−0.39−0.42 *
Soil C:N 1−0.31−0.390.130.21−0.19
Soil C:P 10.99 **−0.32−0.140.31
Soil N:P 1−0.30−0.130.54 *
SMBC:SMBN 10.48 *−0.30
SMBC:SMBP 10.41 *
SMBN:SMBP 1
* and ** indicate correlation is significant at p < 0.05 and p < 0.01, respectively.

