Centralization of the Global REDD+ Financial Network and Implications under the New Climate Regime


Abstract
:1. Introduction
1.1. Background
1.2. Conceptual Background: Global Governance Network and the Global REDD+ Financial Network
1.2.1. Global Governance Network
1.2.2. Global REDD+ Financial Networks
Actors: Donors and Recipients
Centralization or Decentralization of Global REDD+ Financial Network
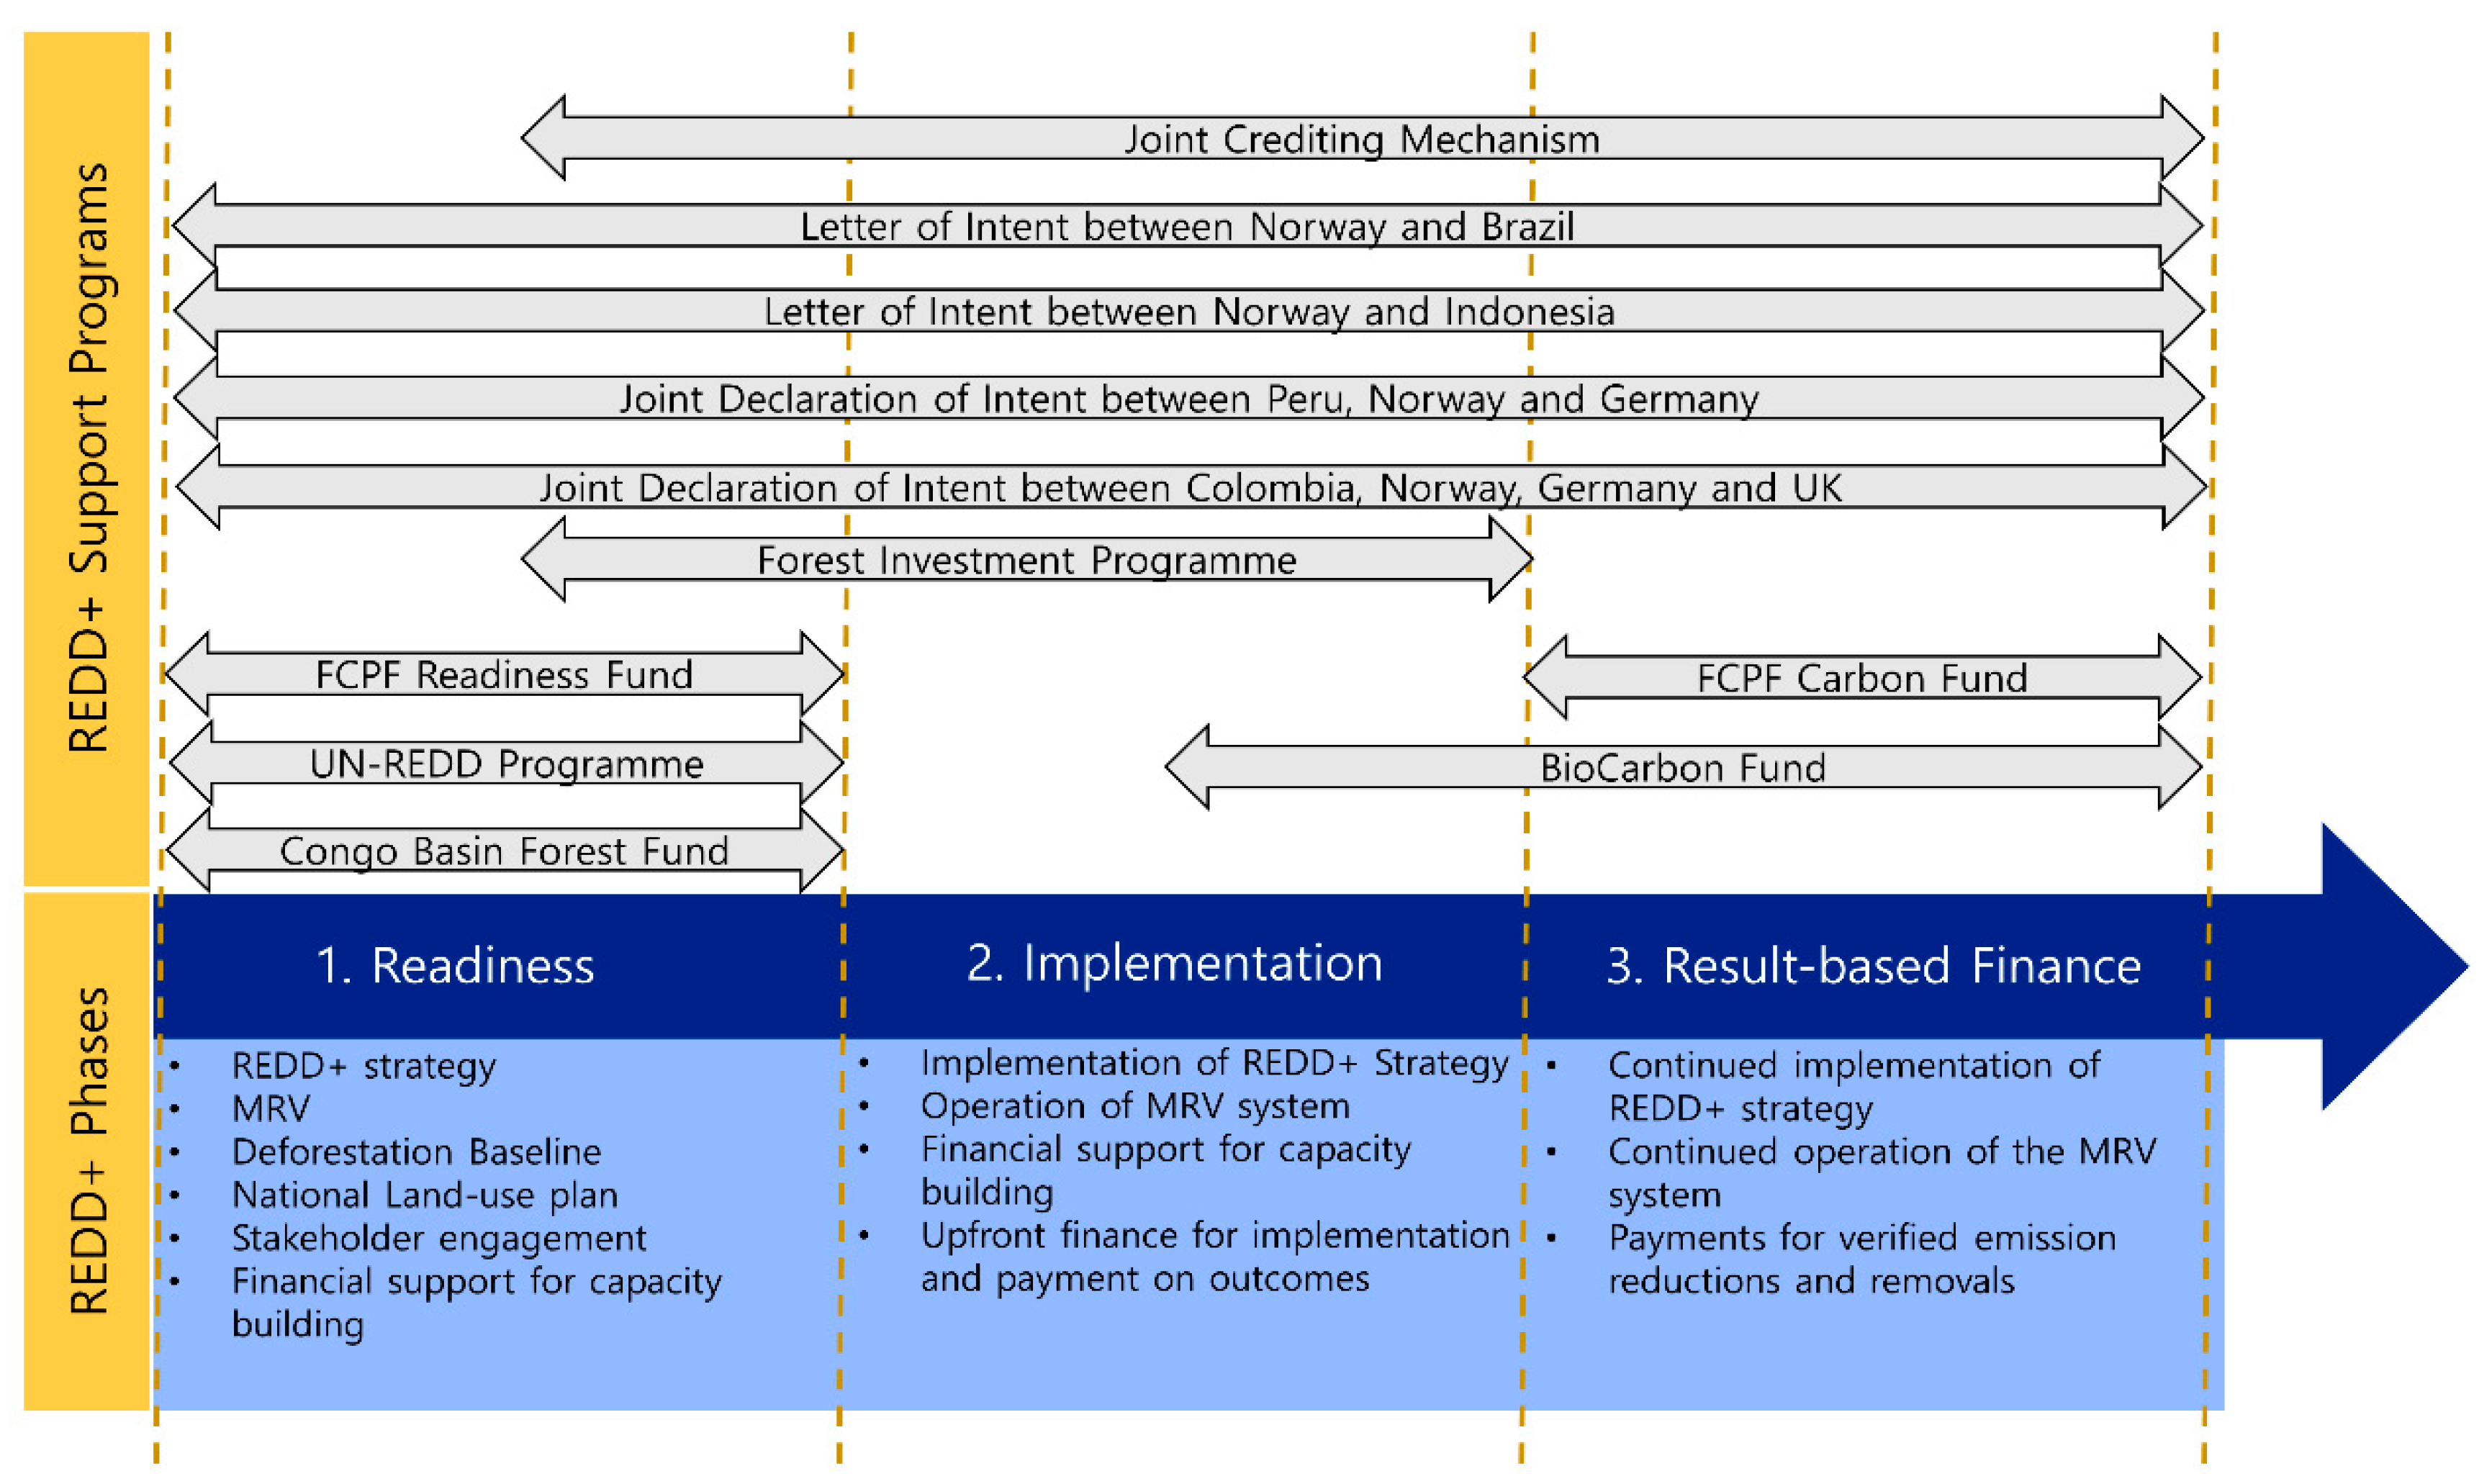
REDD+ Phases and Financial Support
2. Materials and Methods
2.1. Data Sources
2.2. Social Network Analysis
3. Results
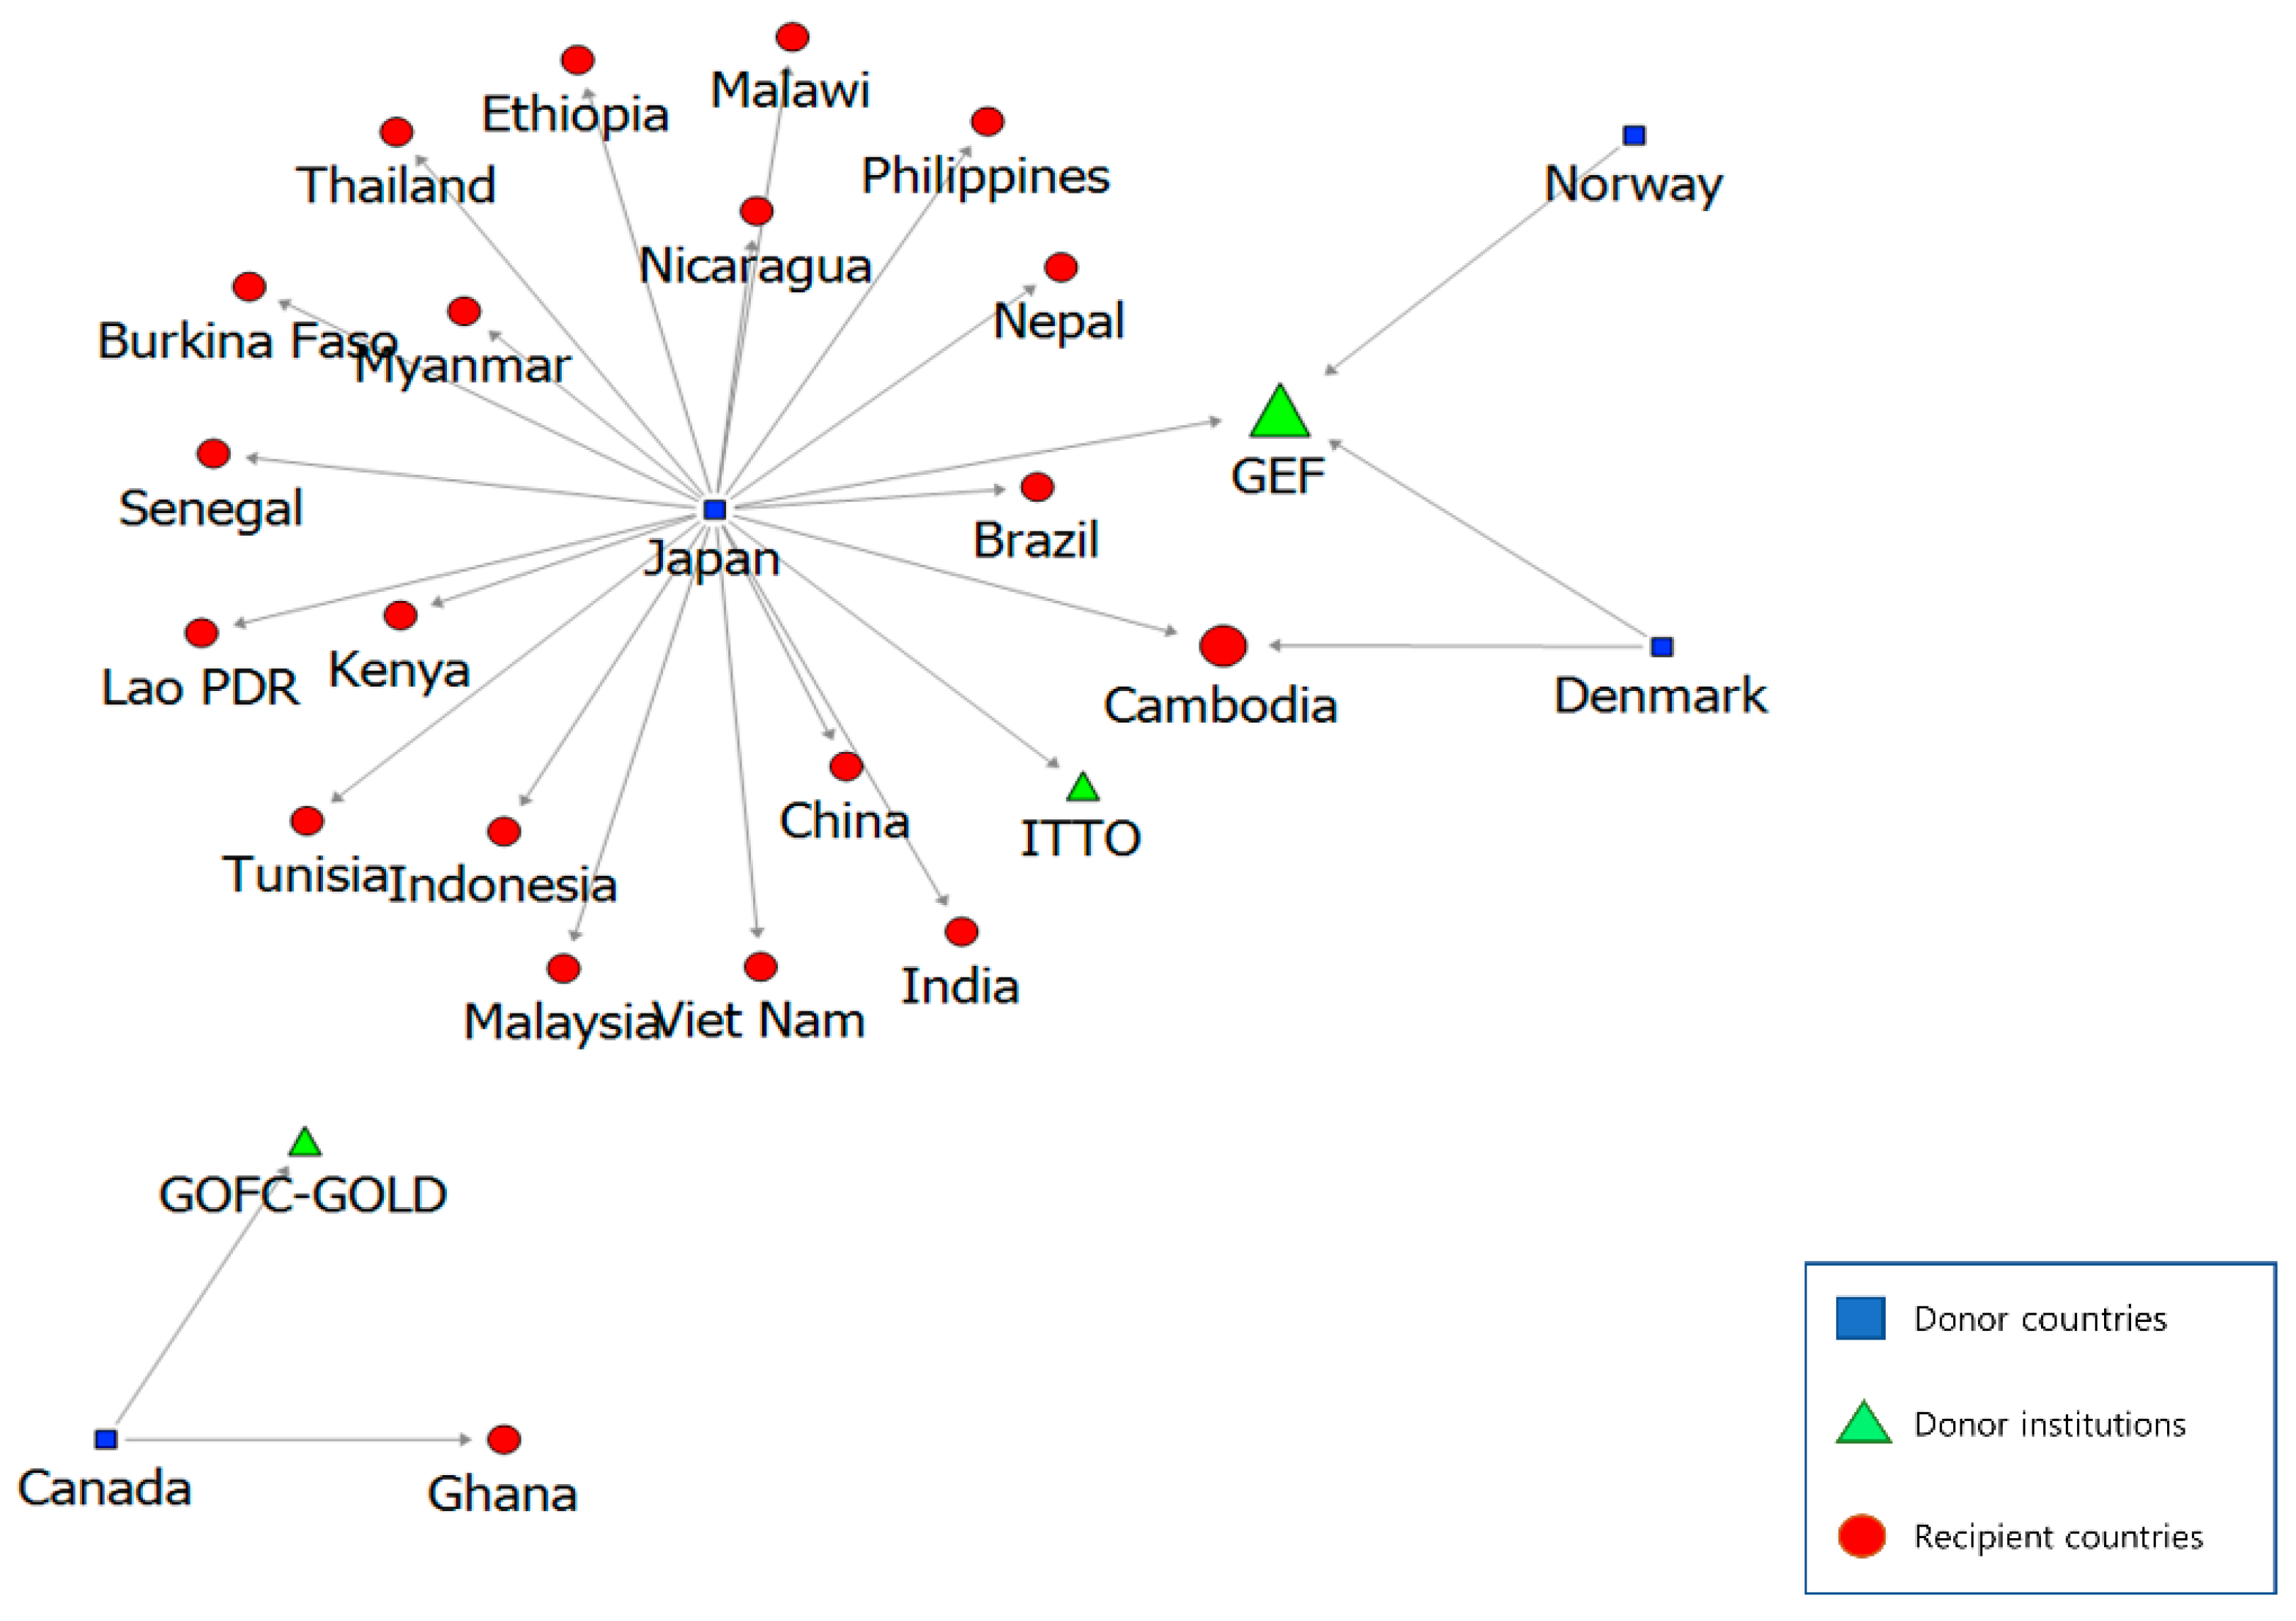
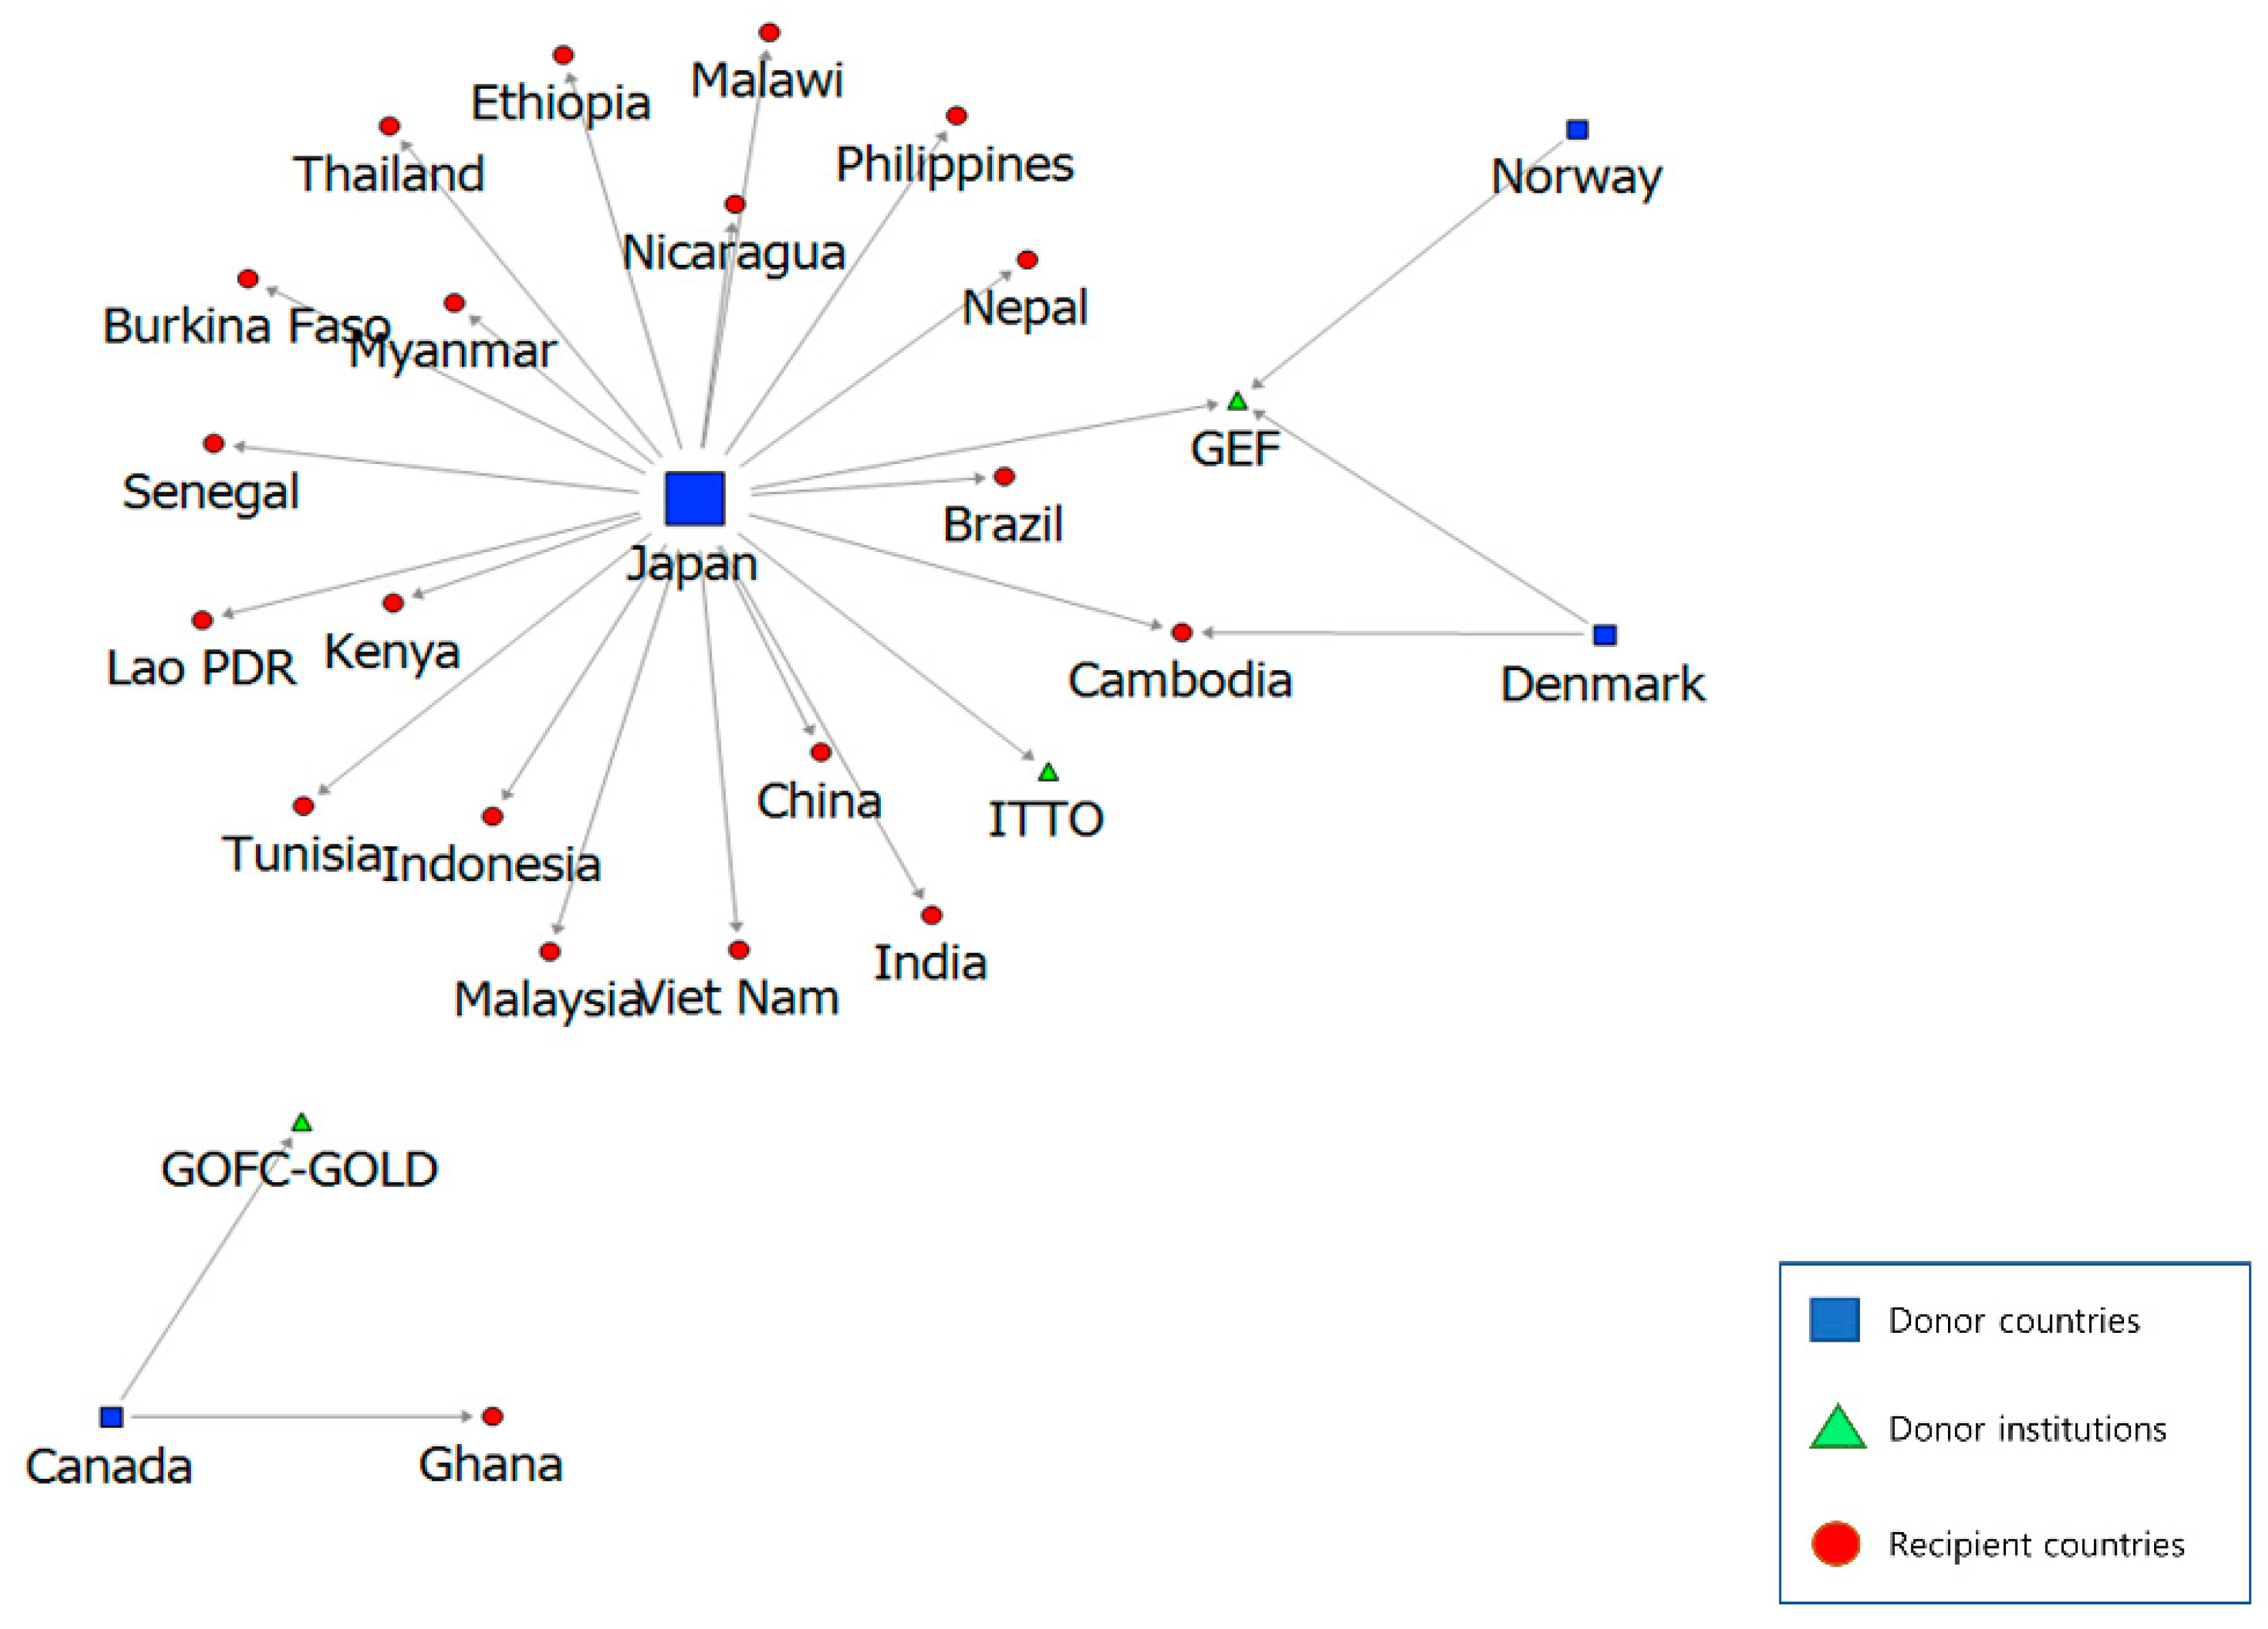
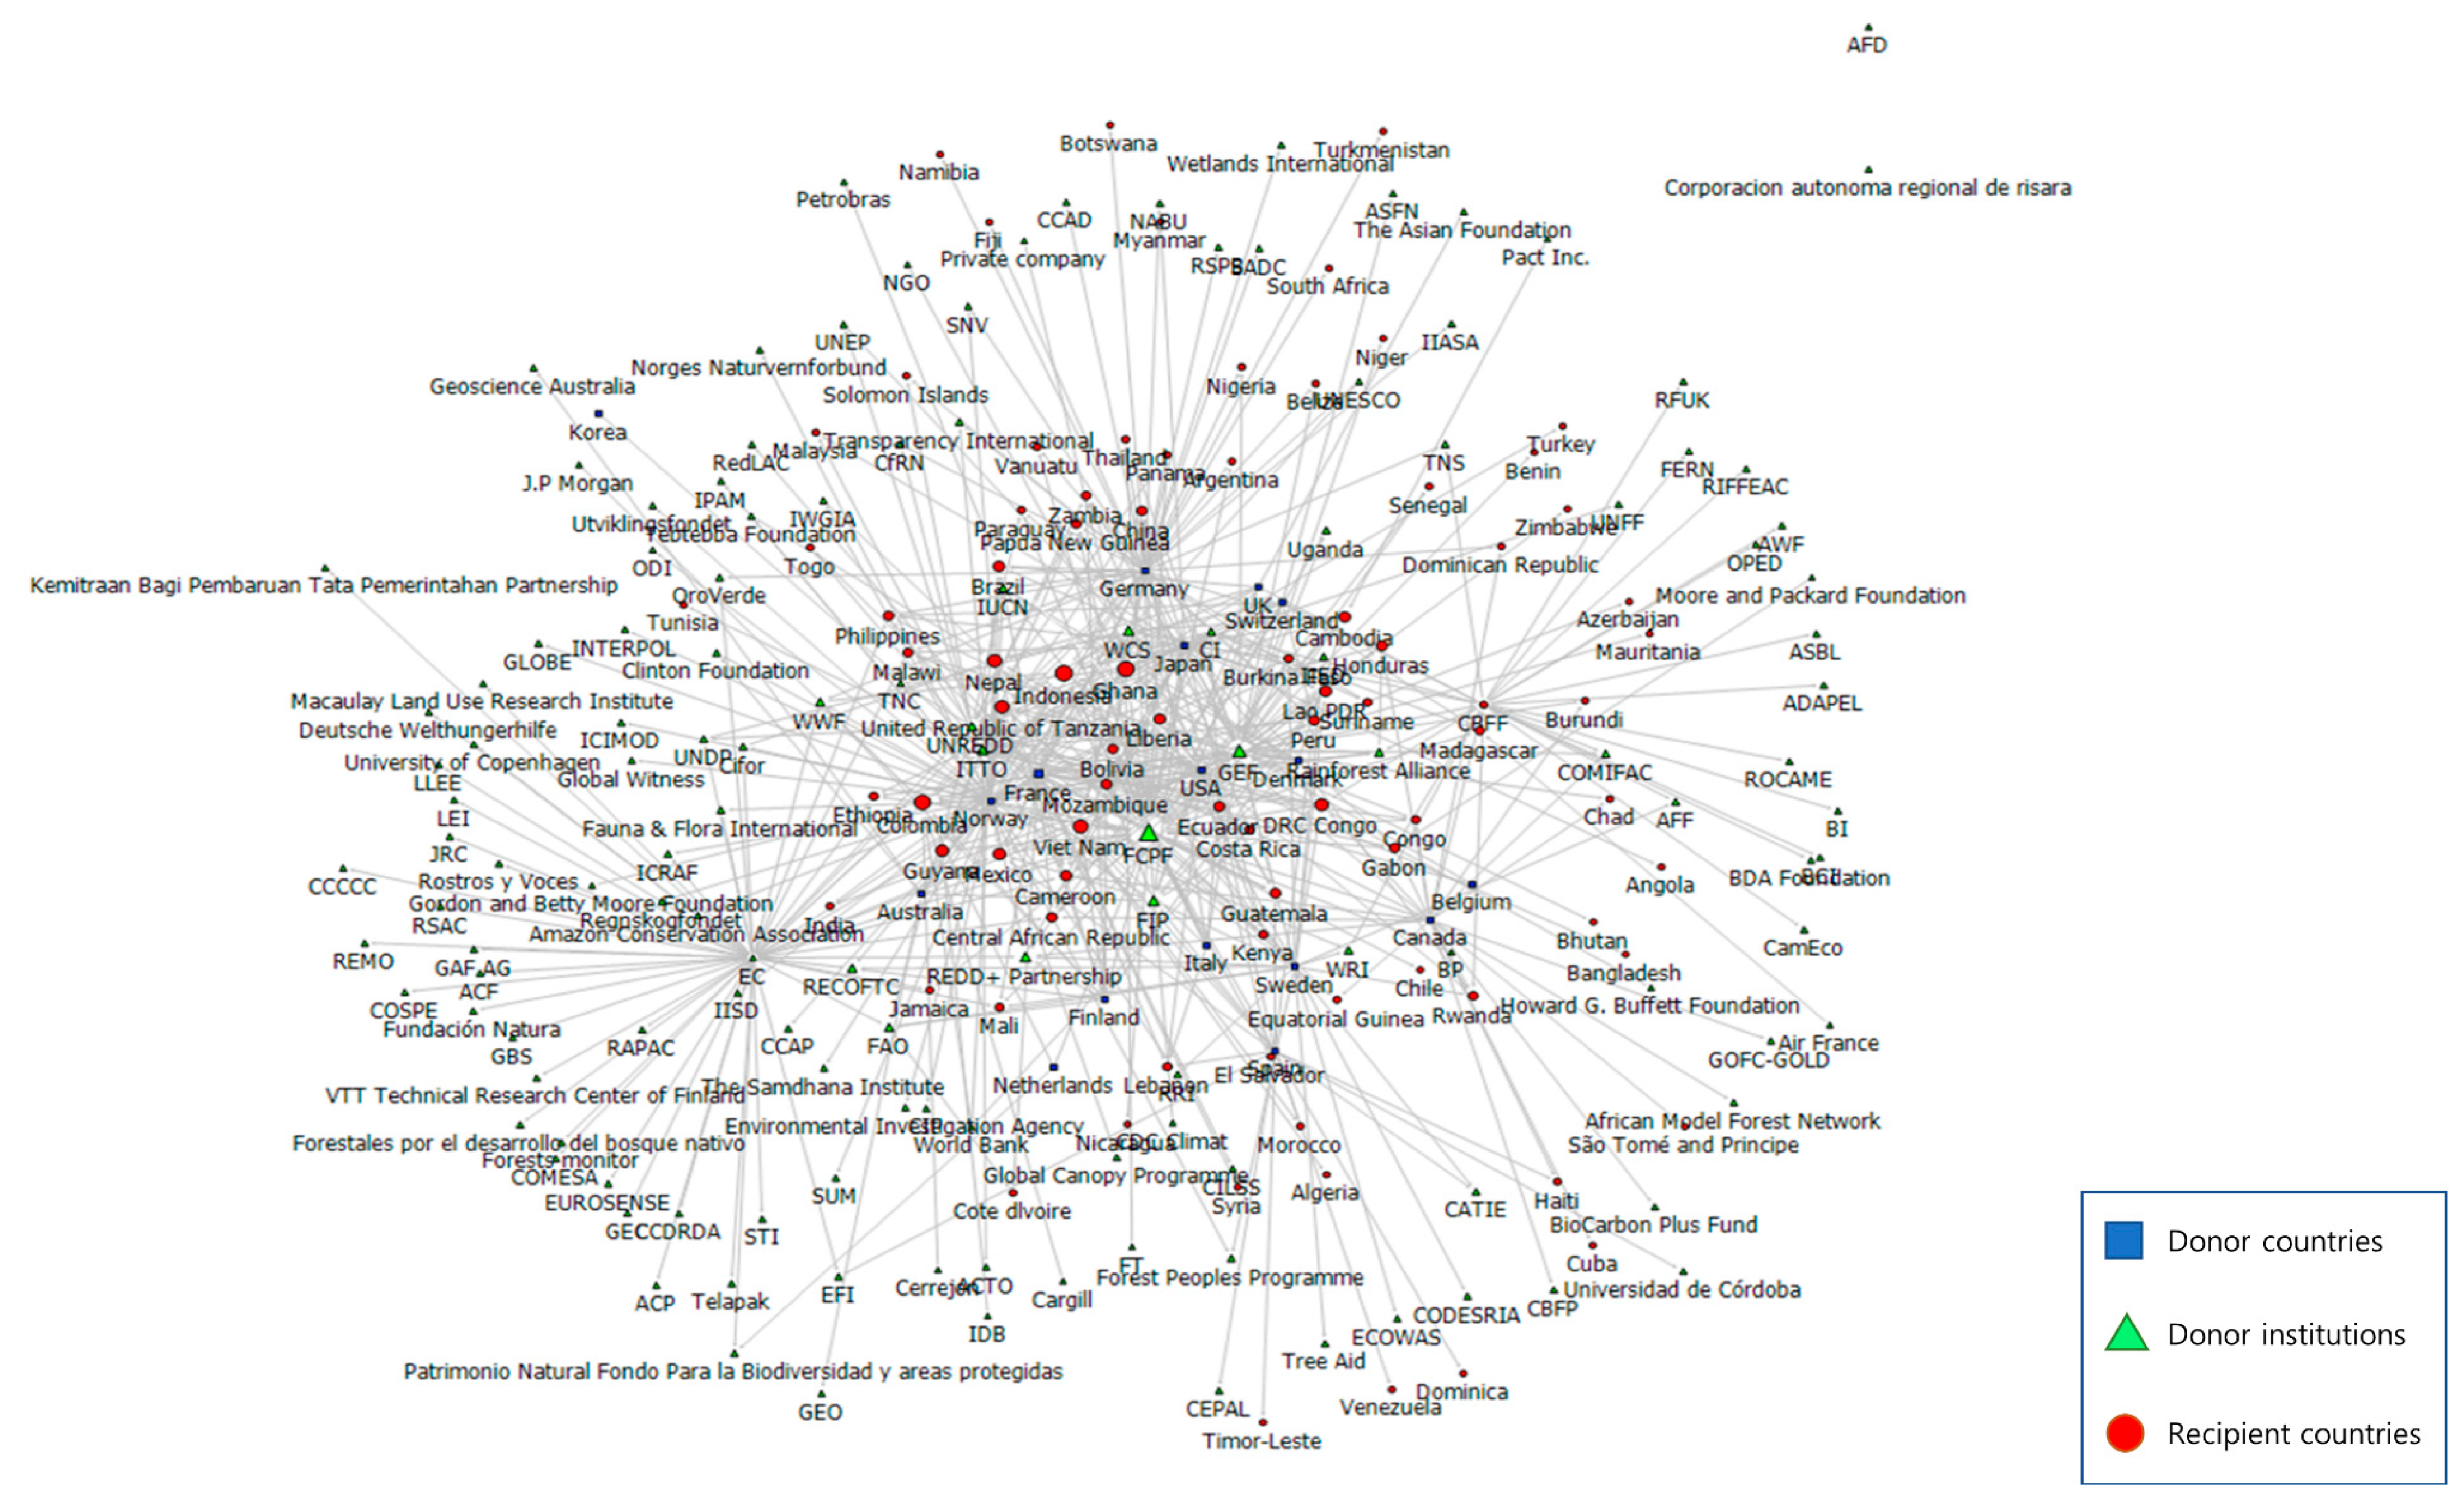
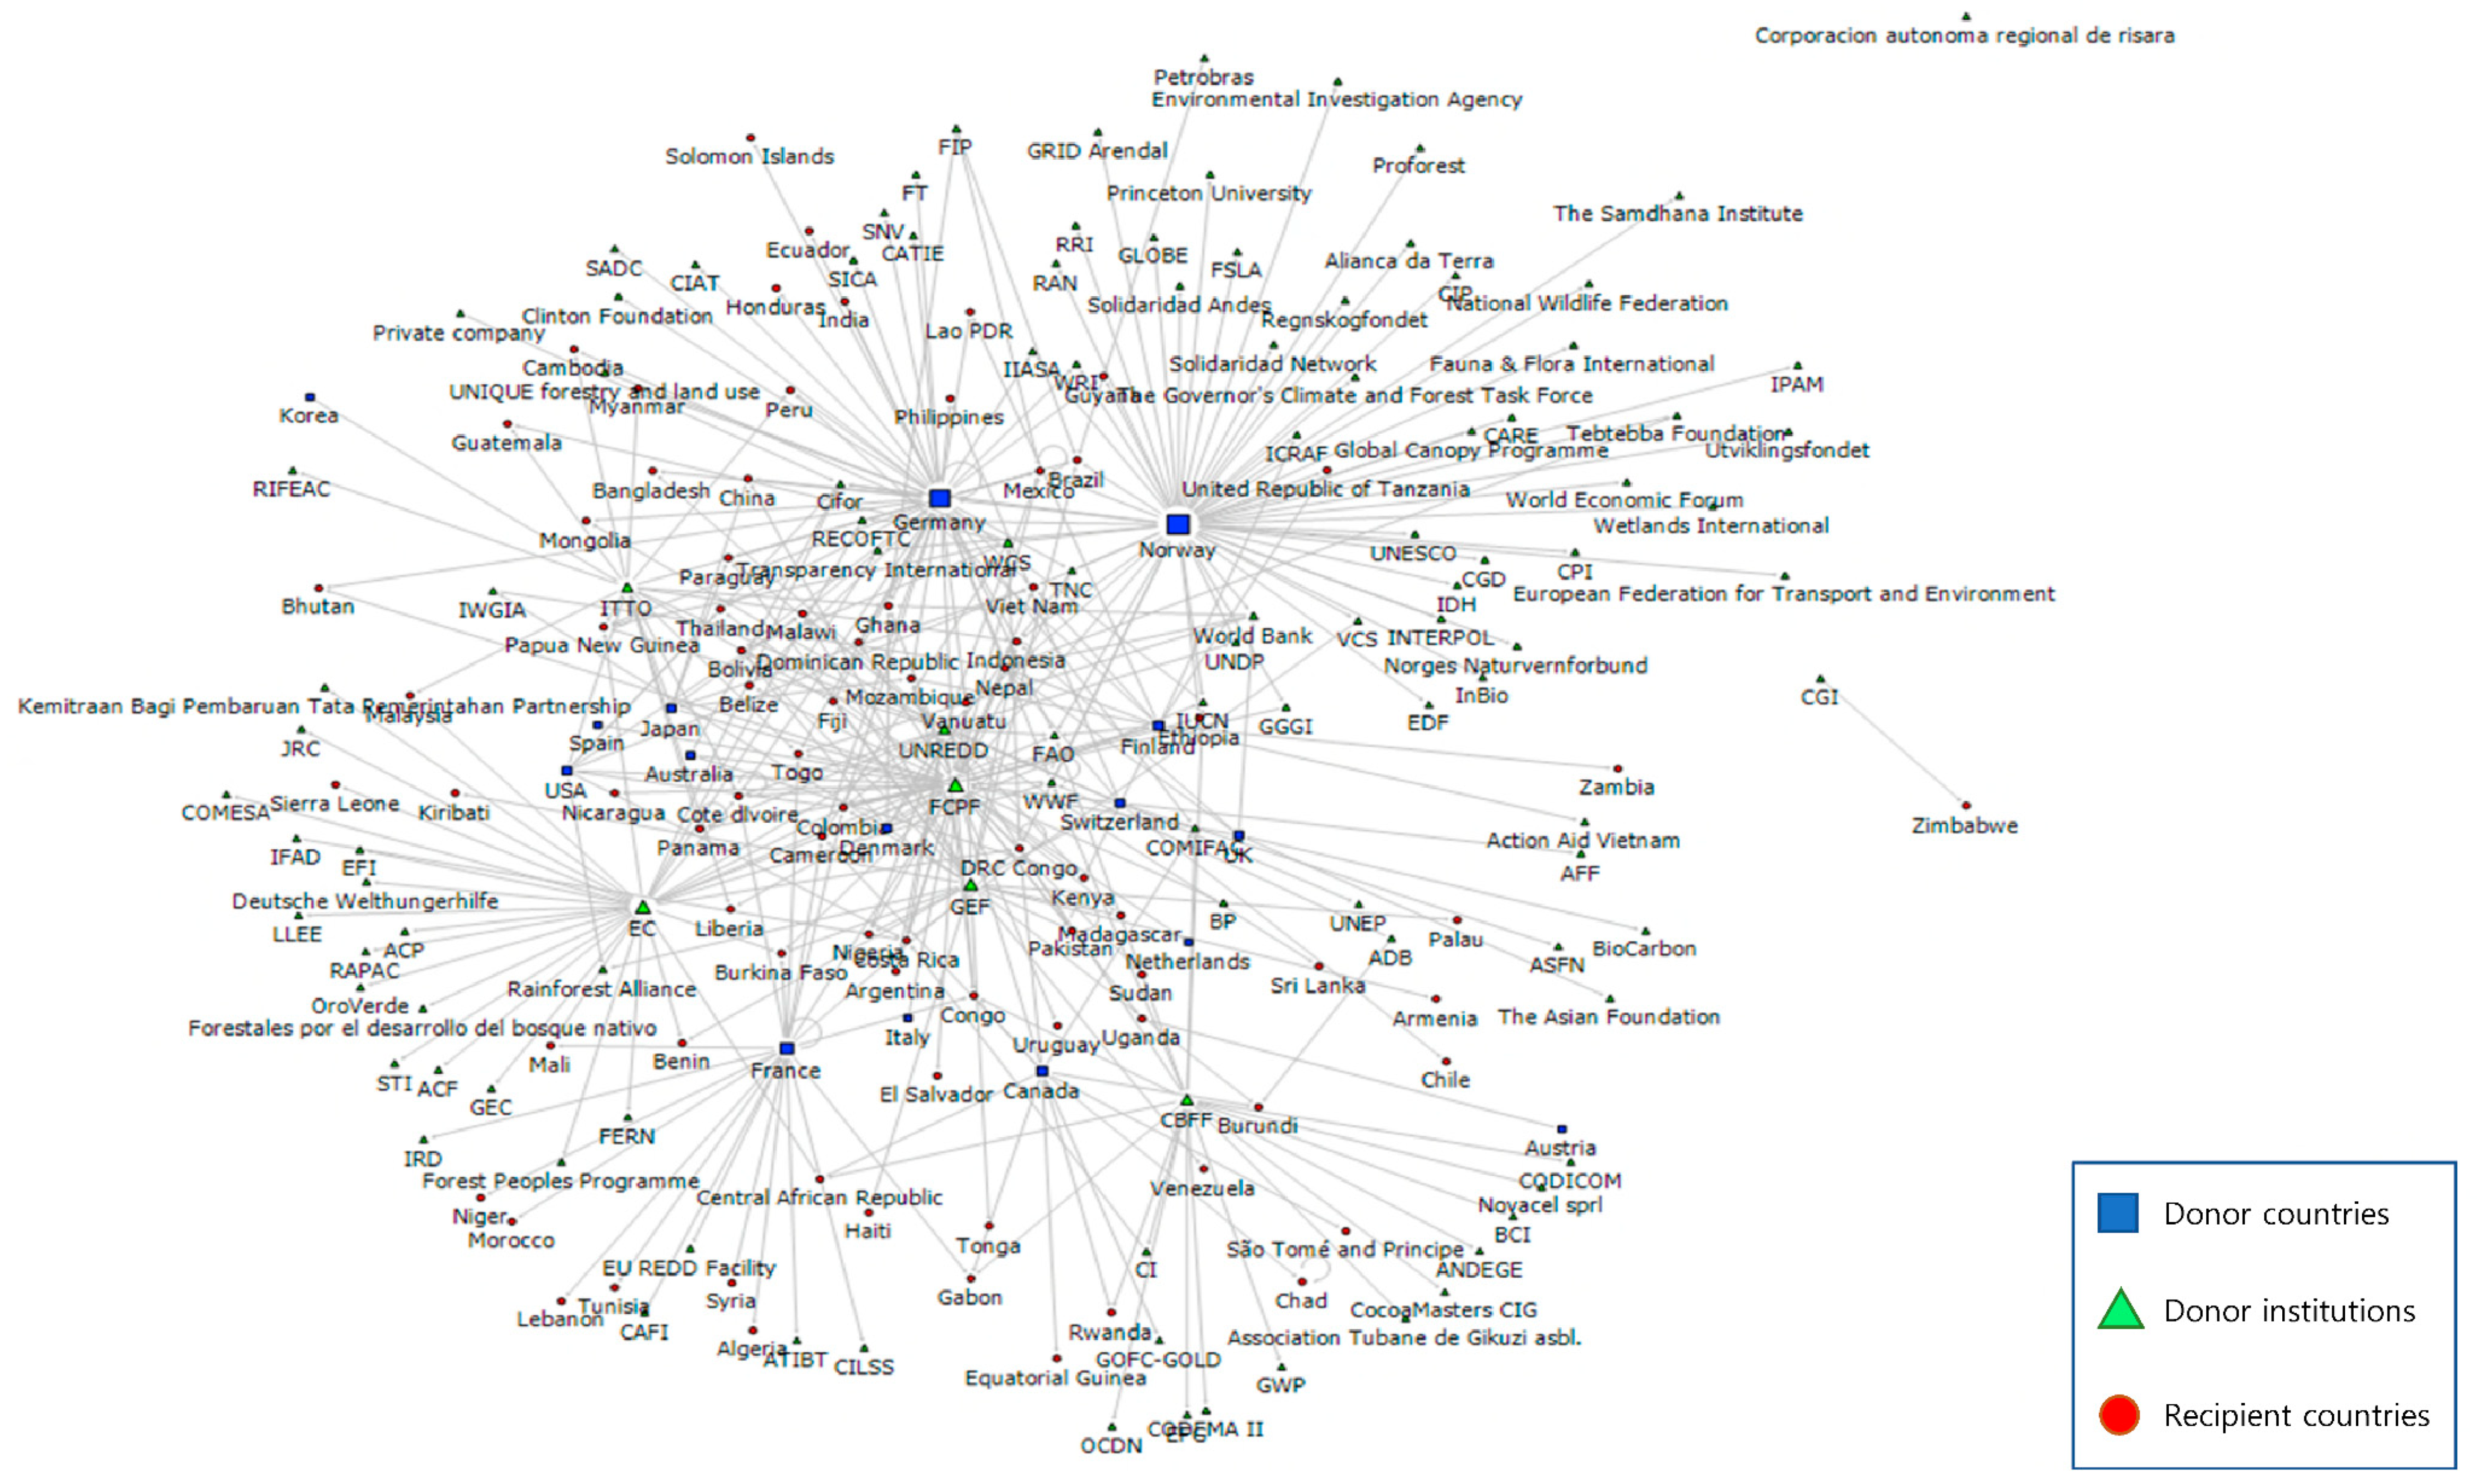
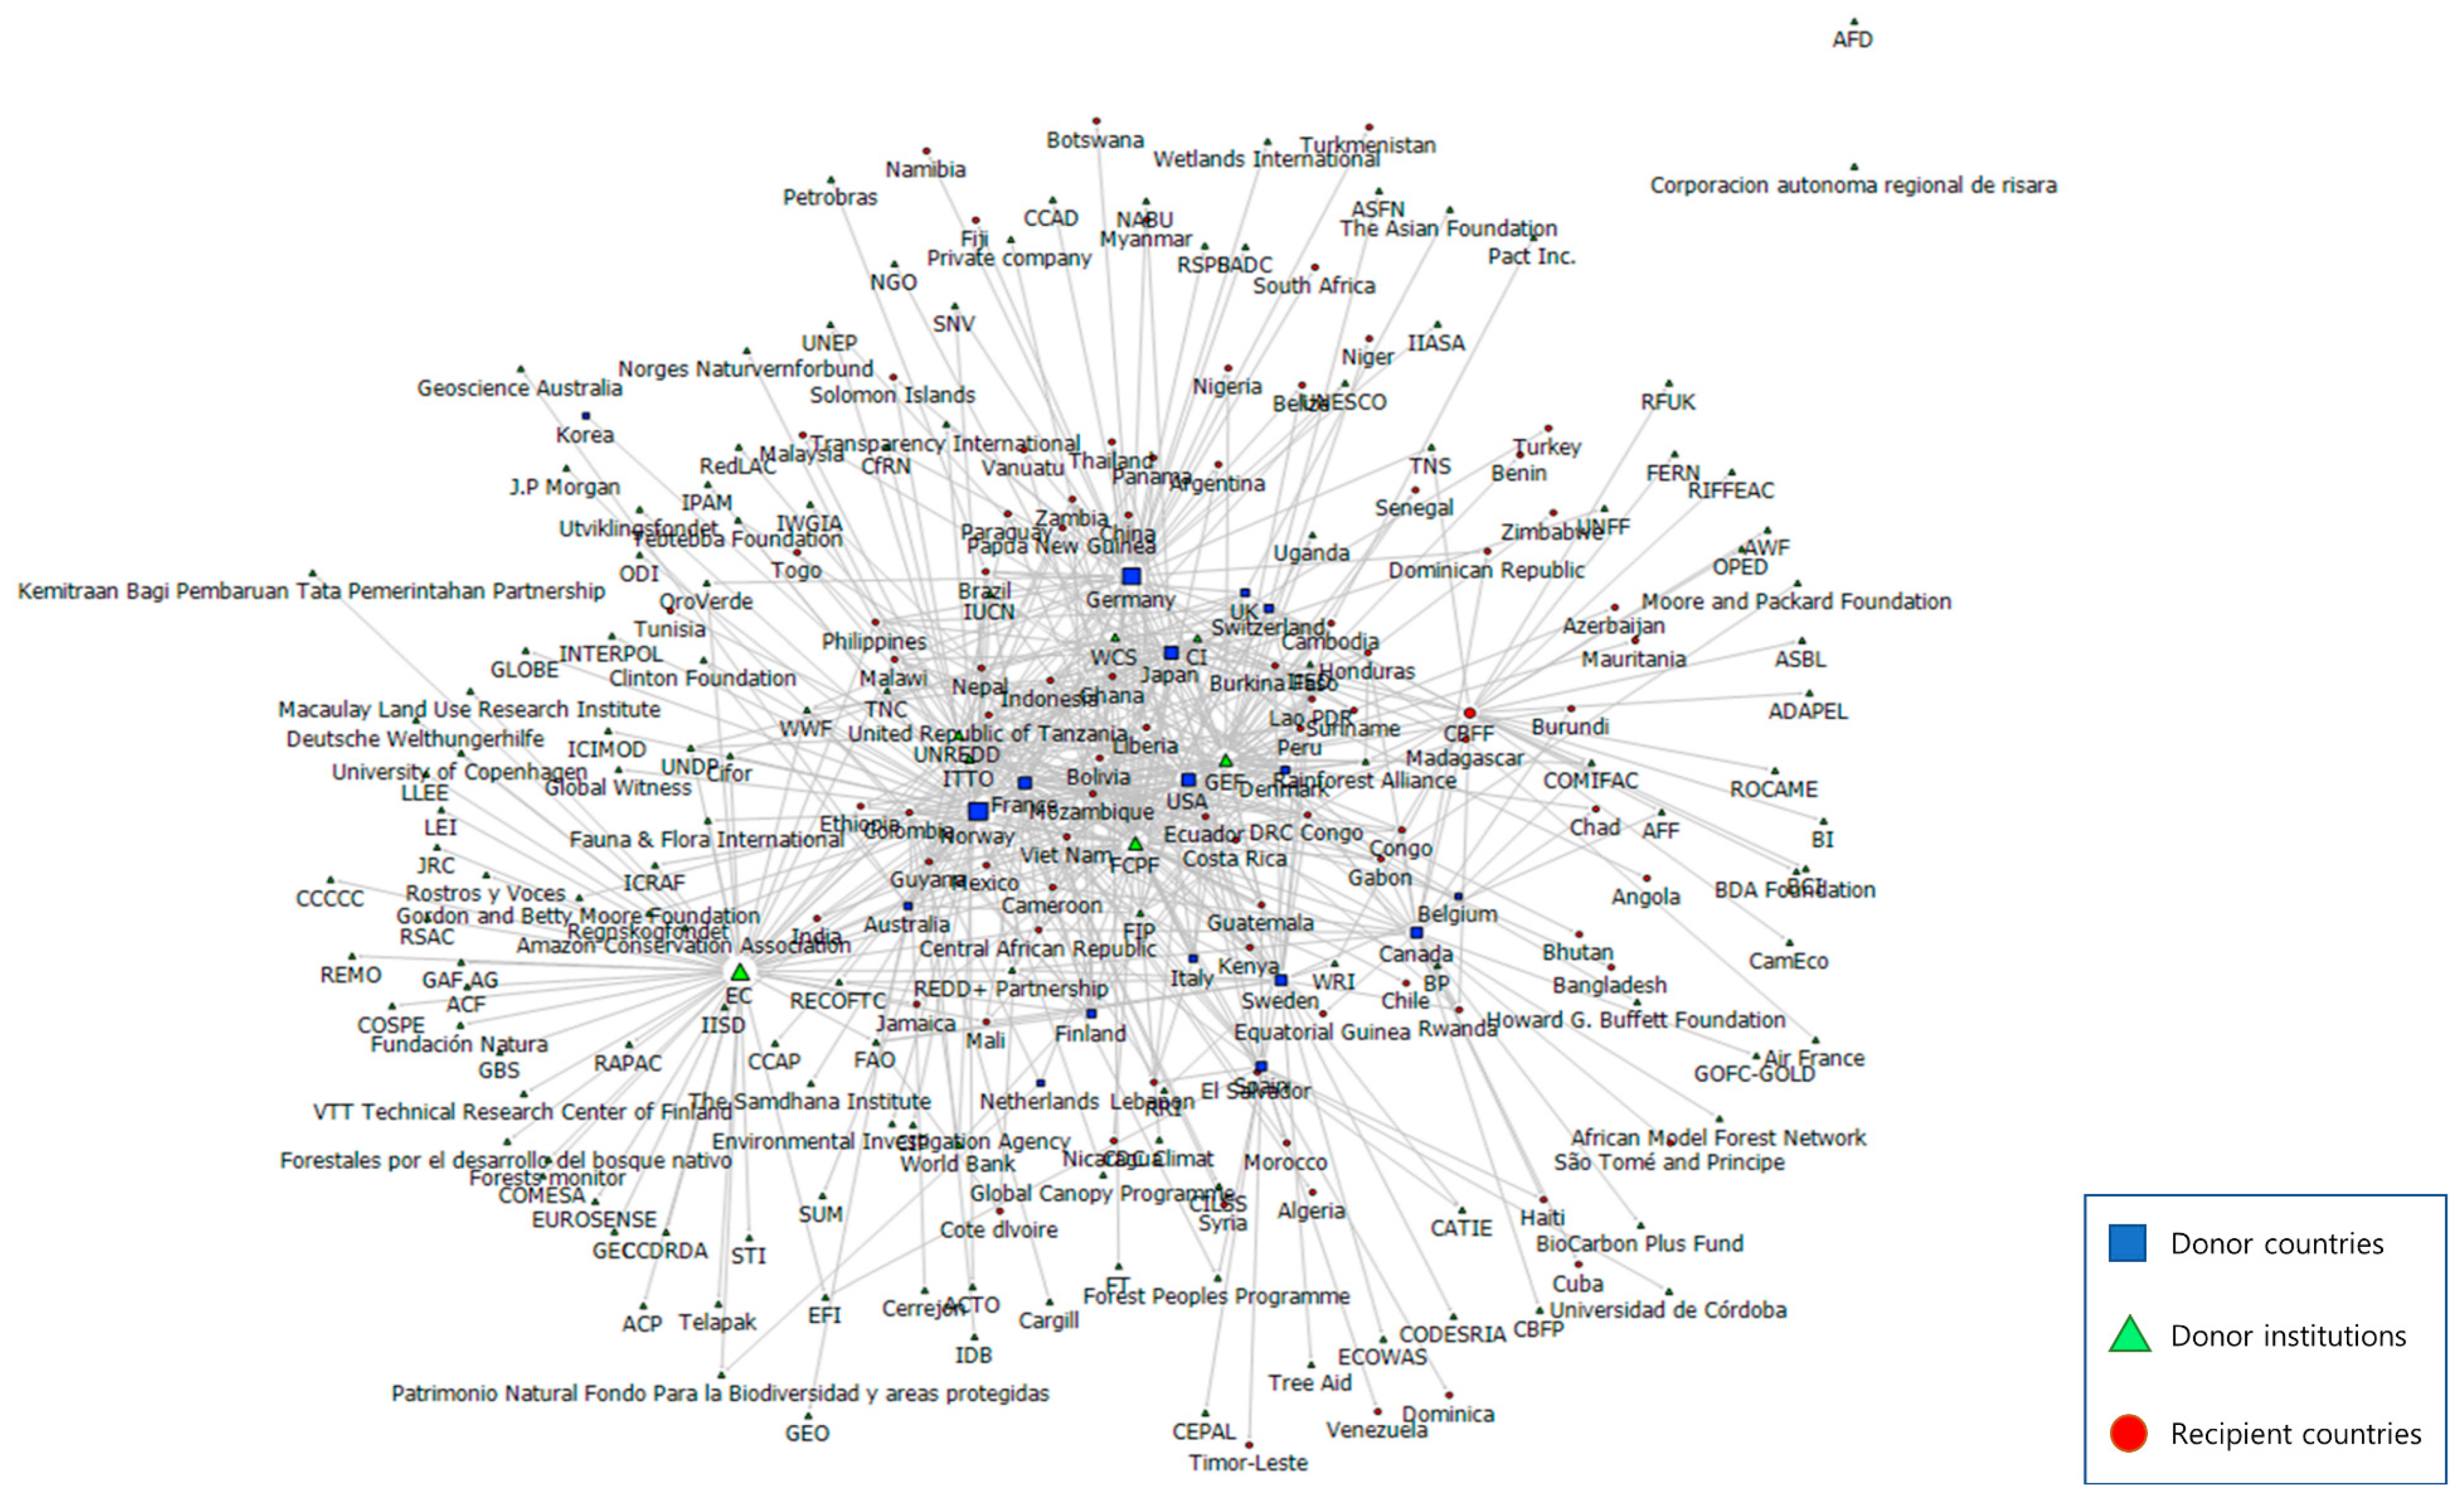
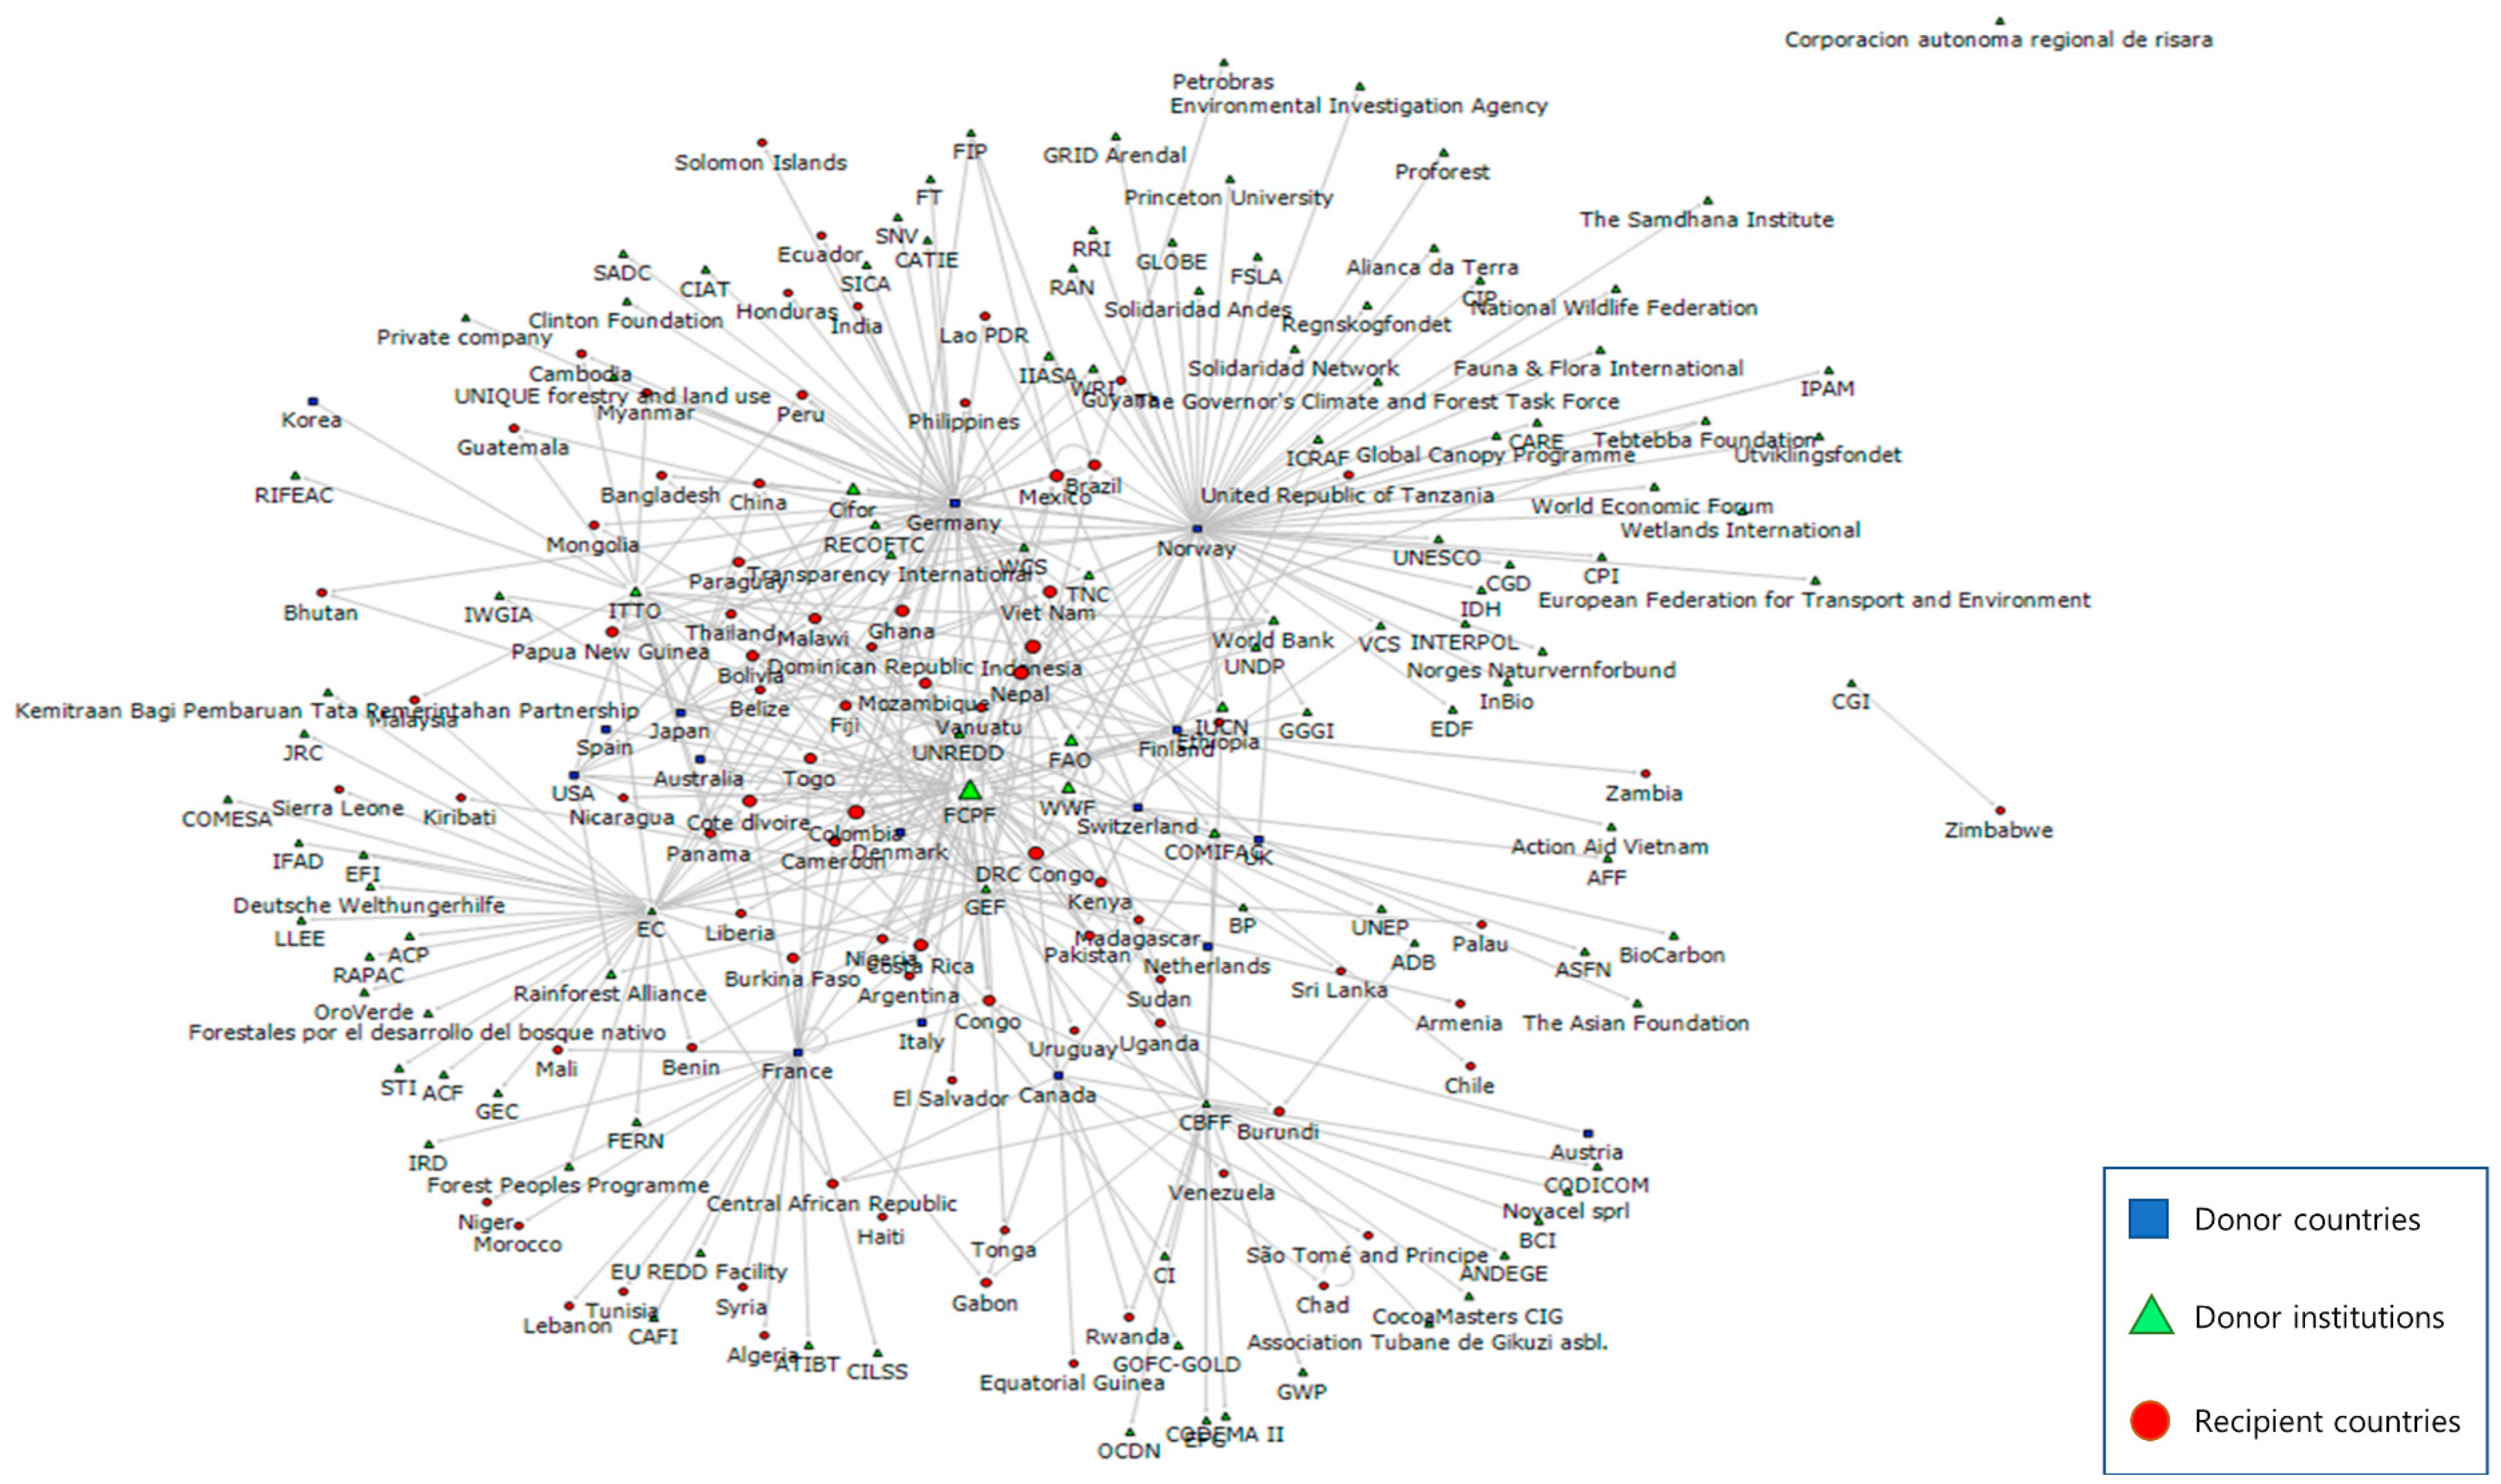
3.1. Network Graph
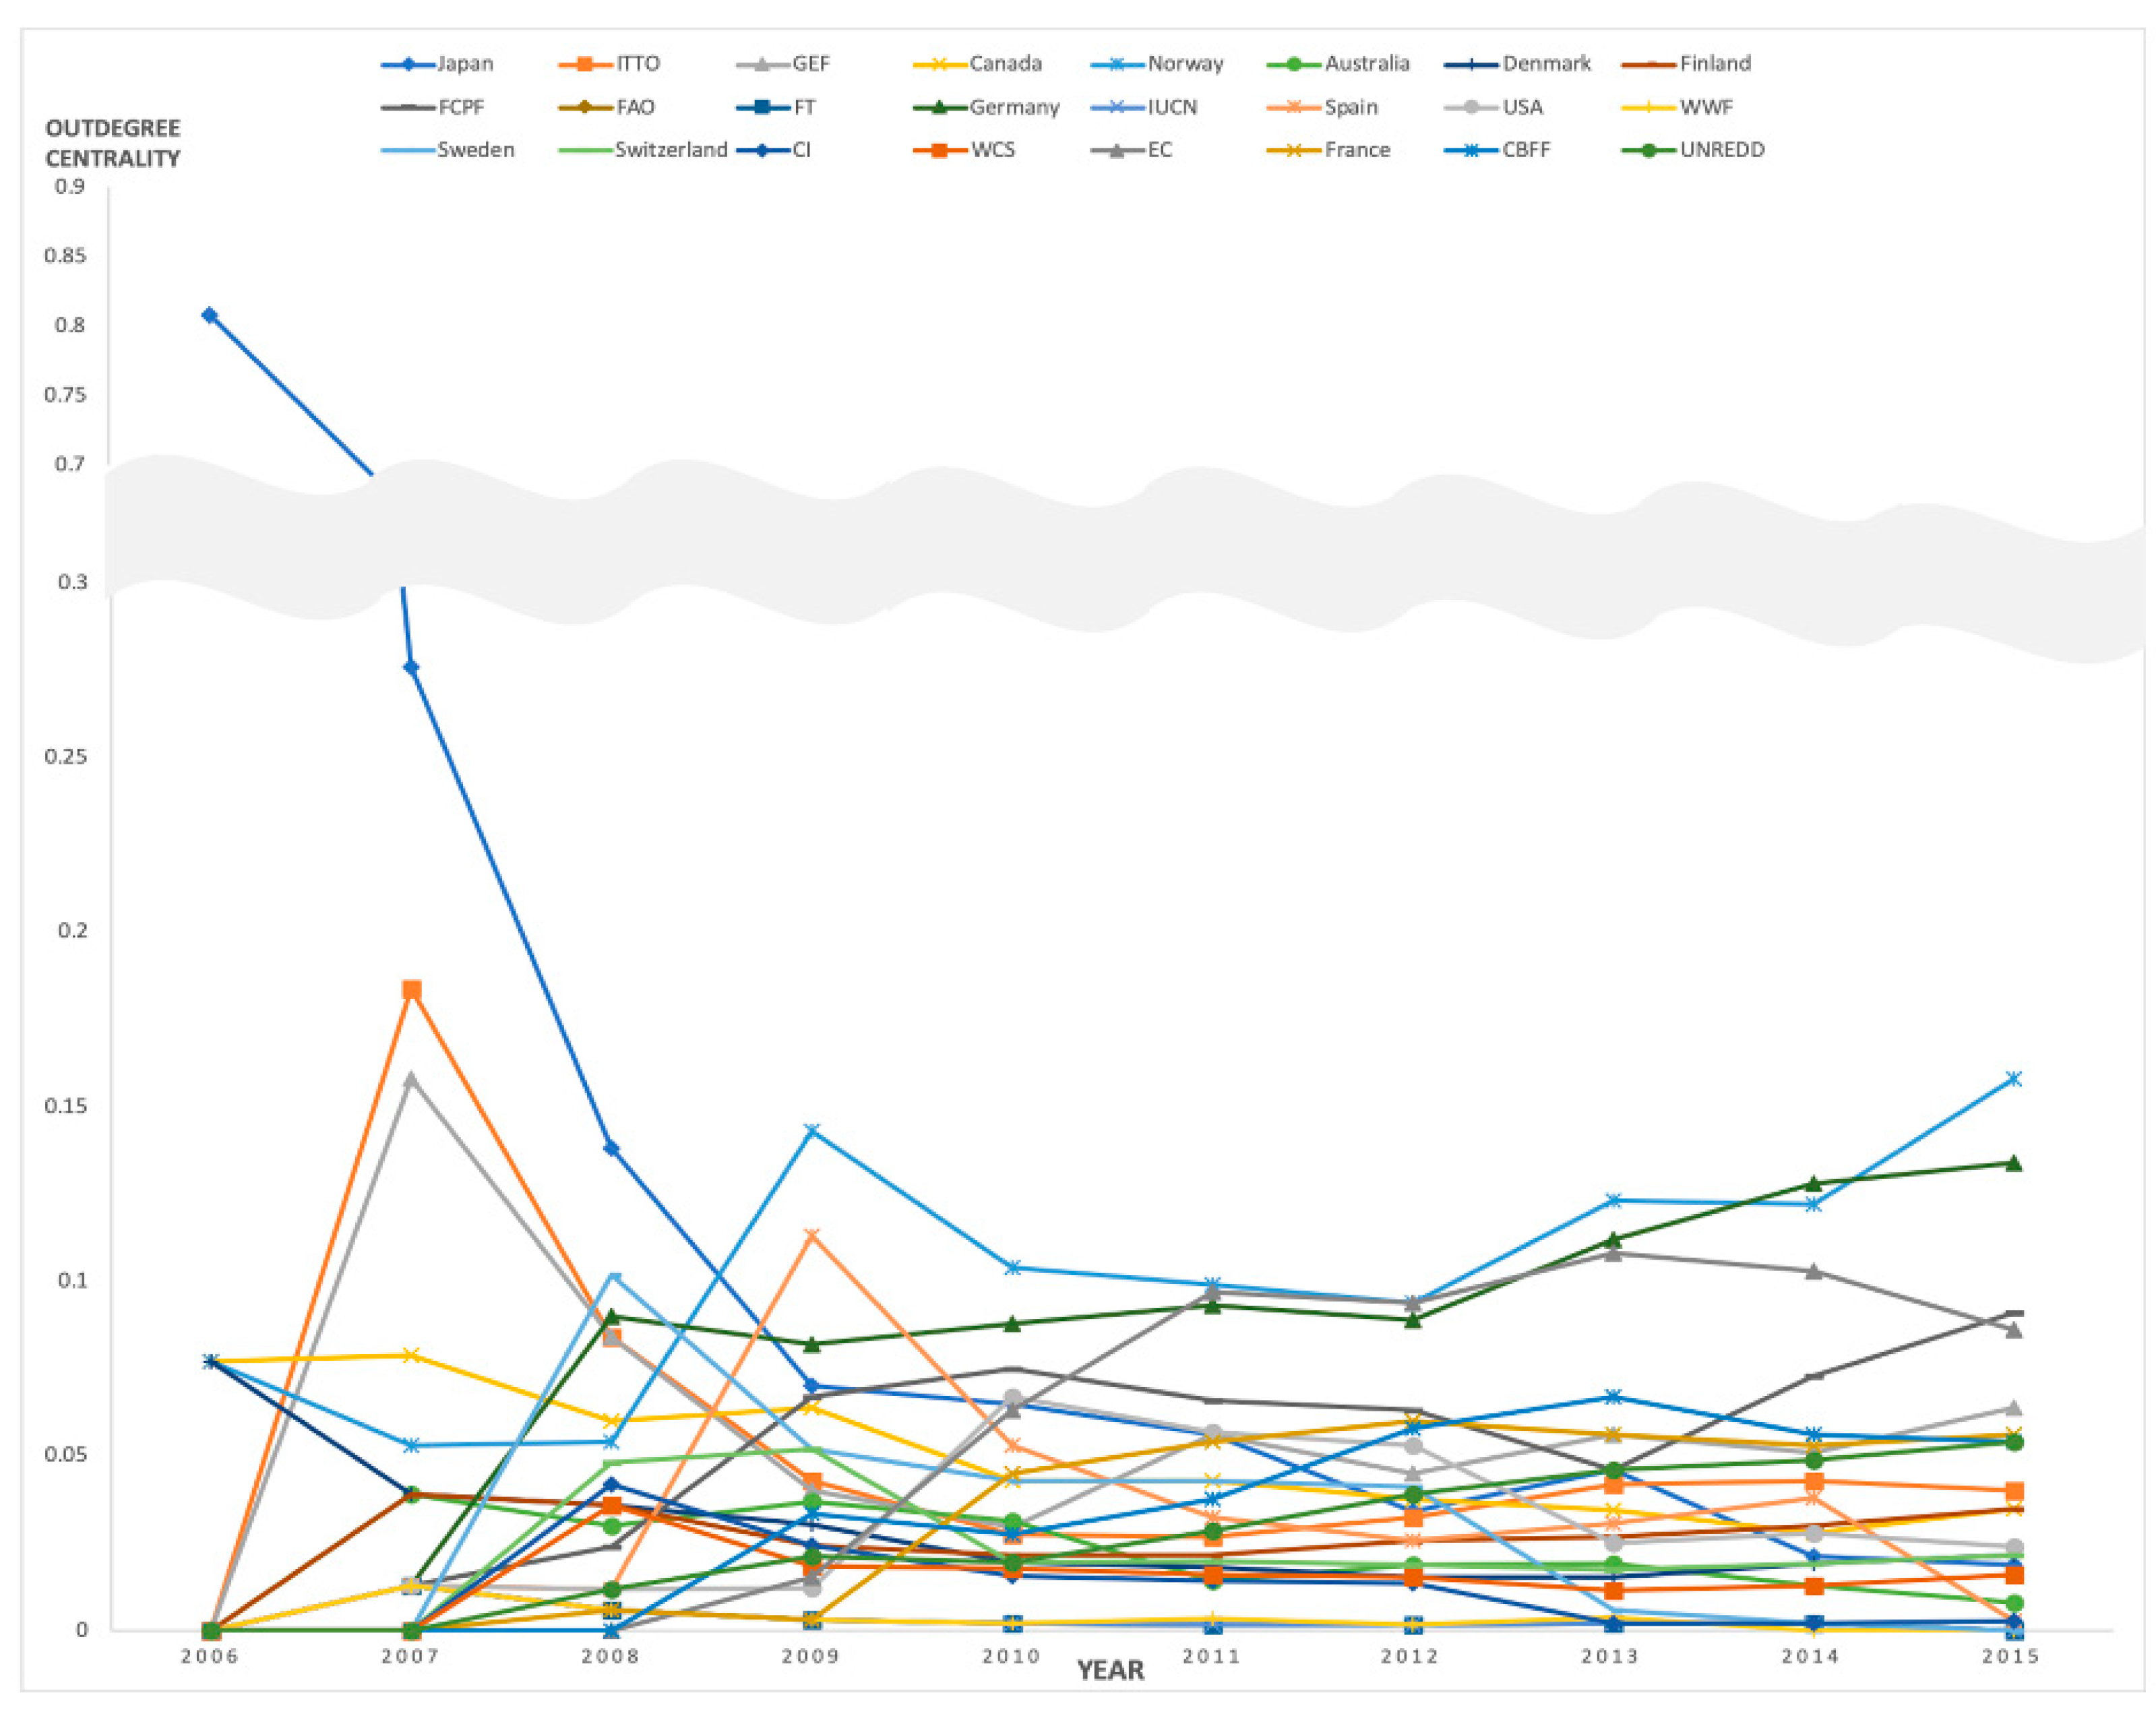
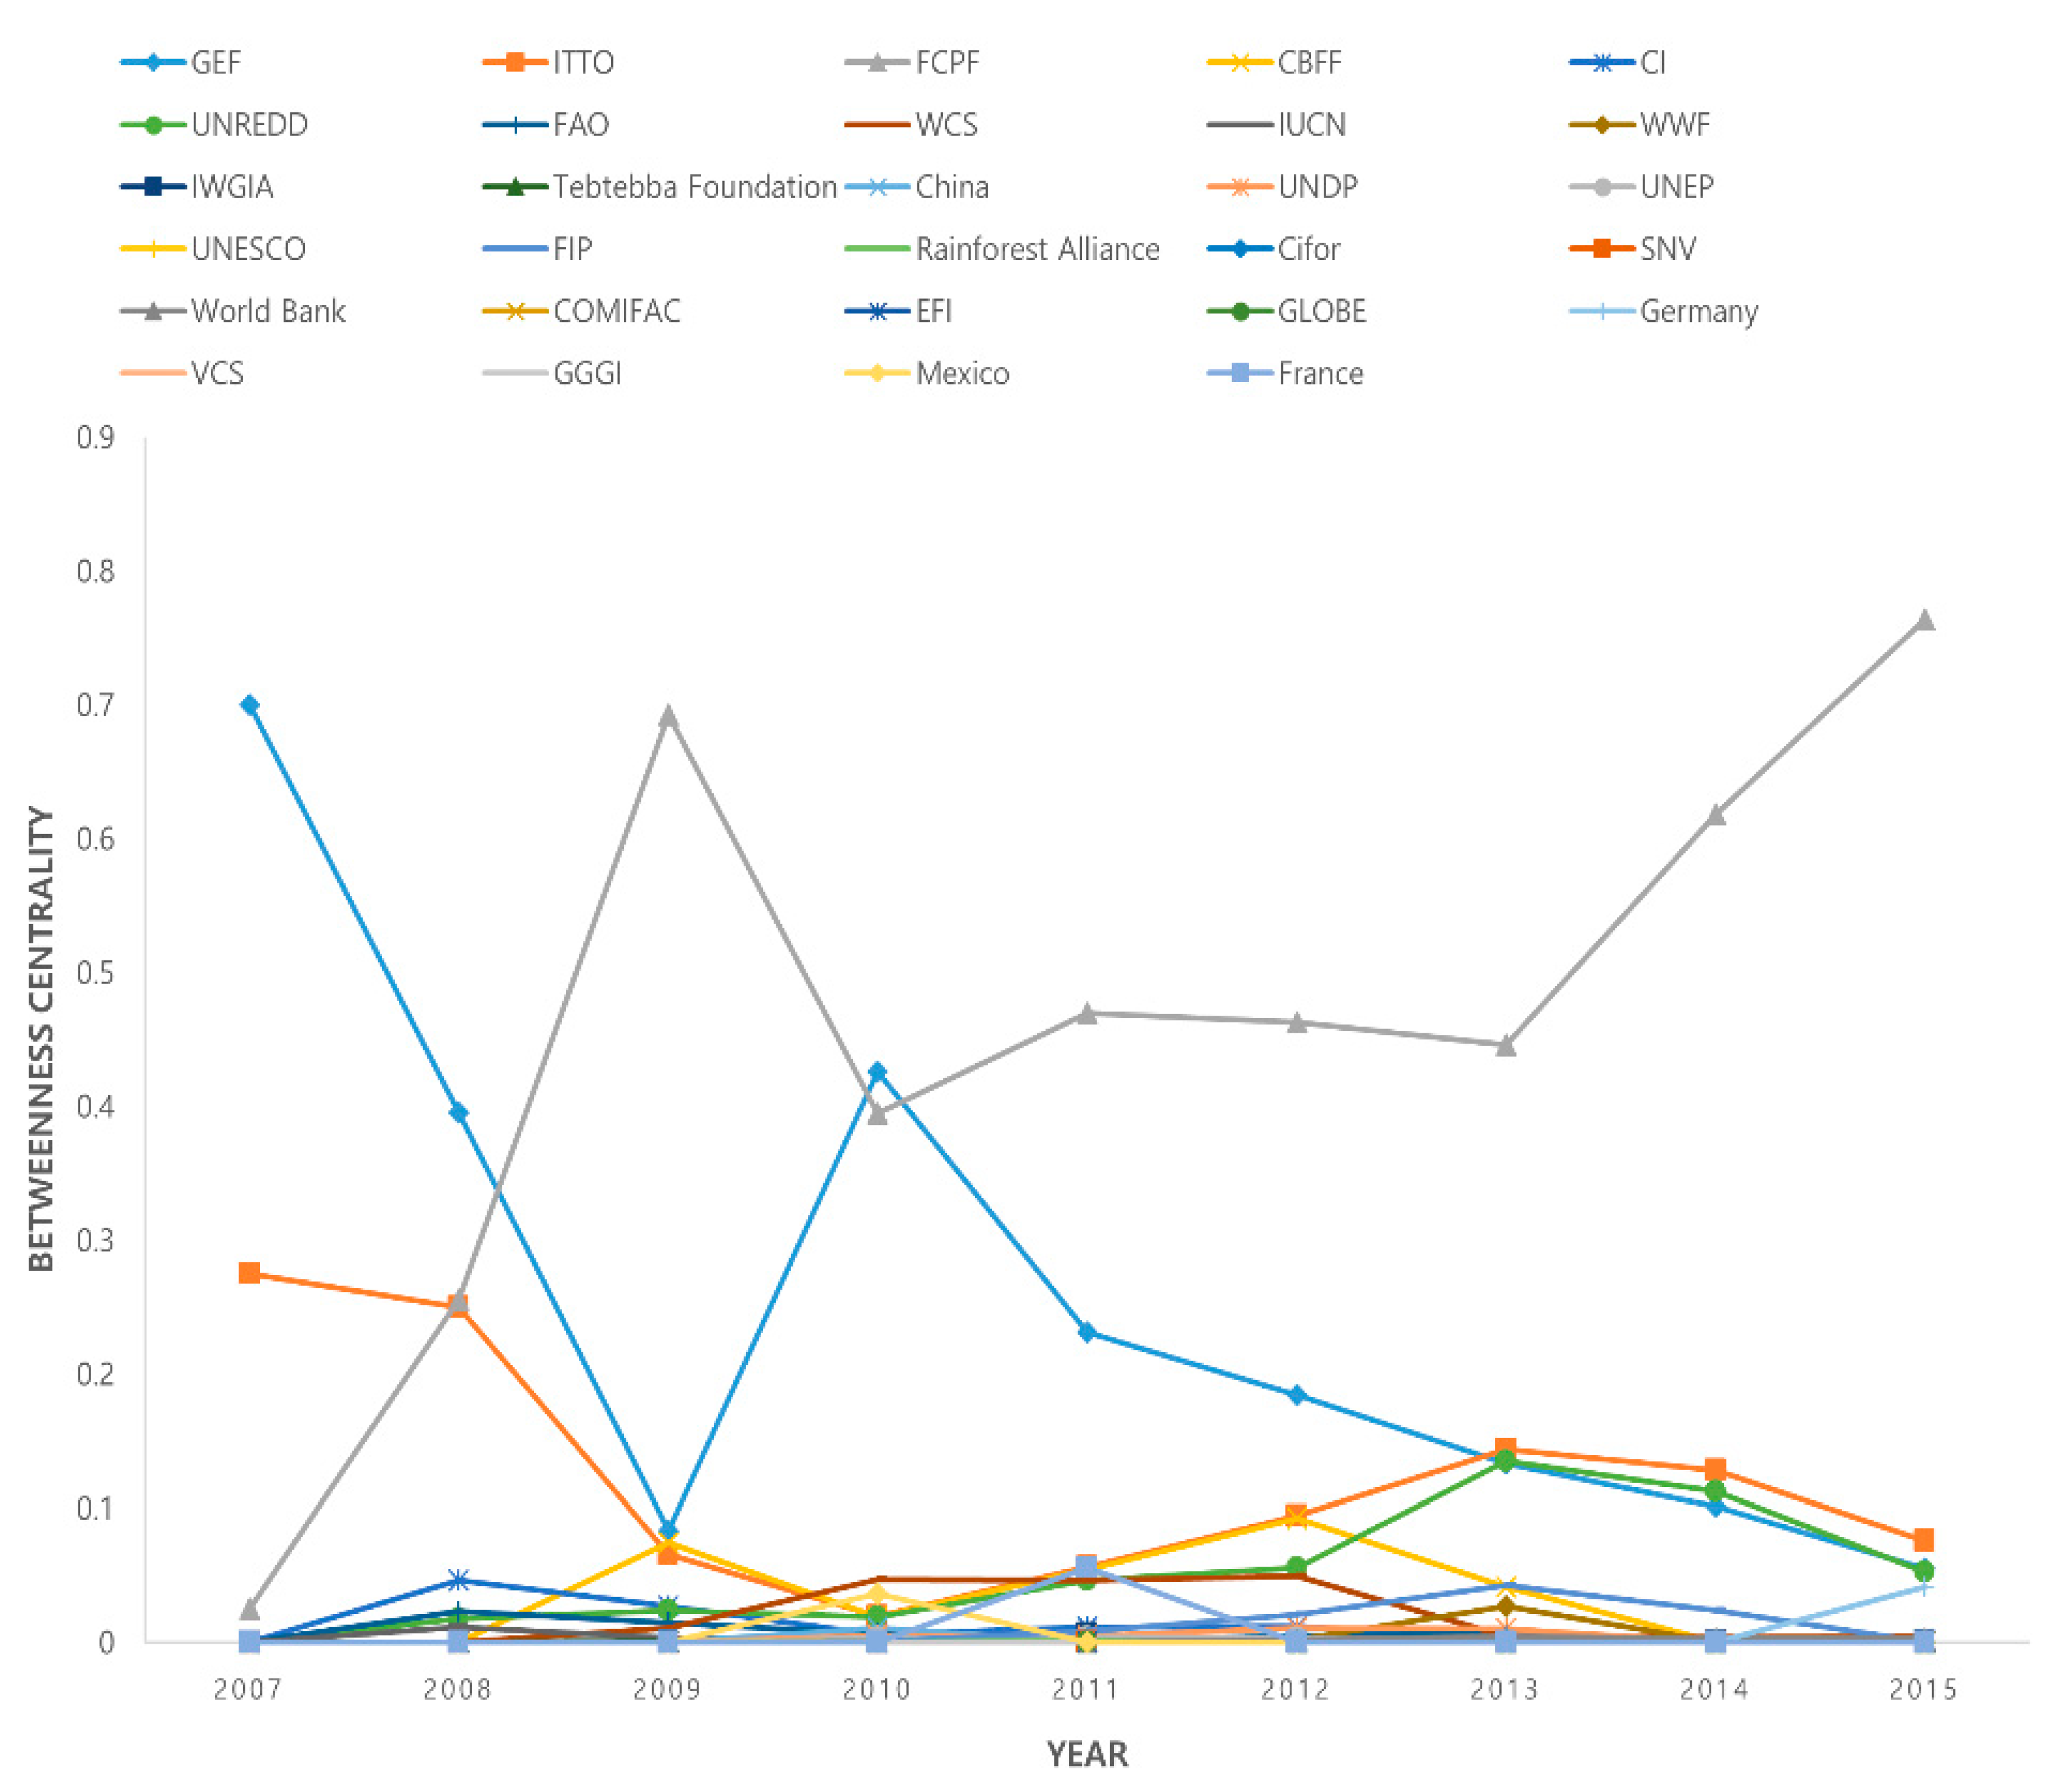
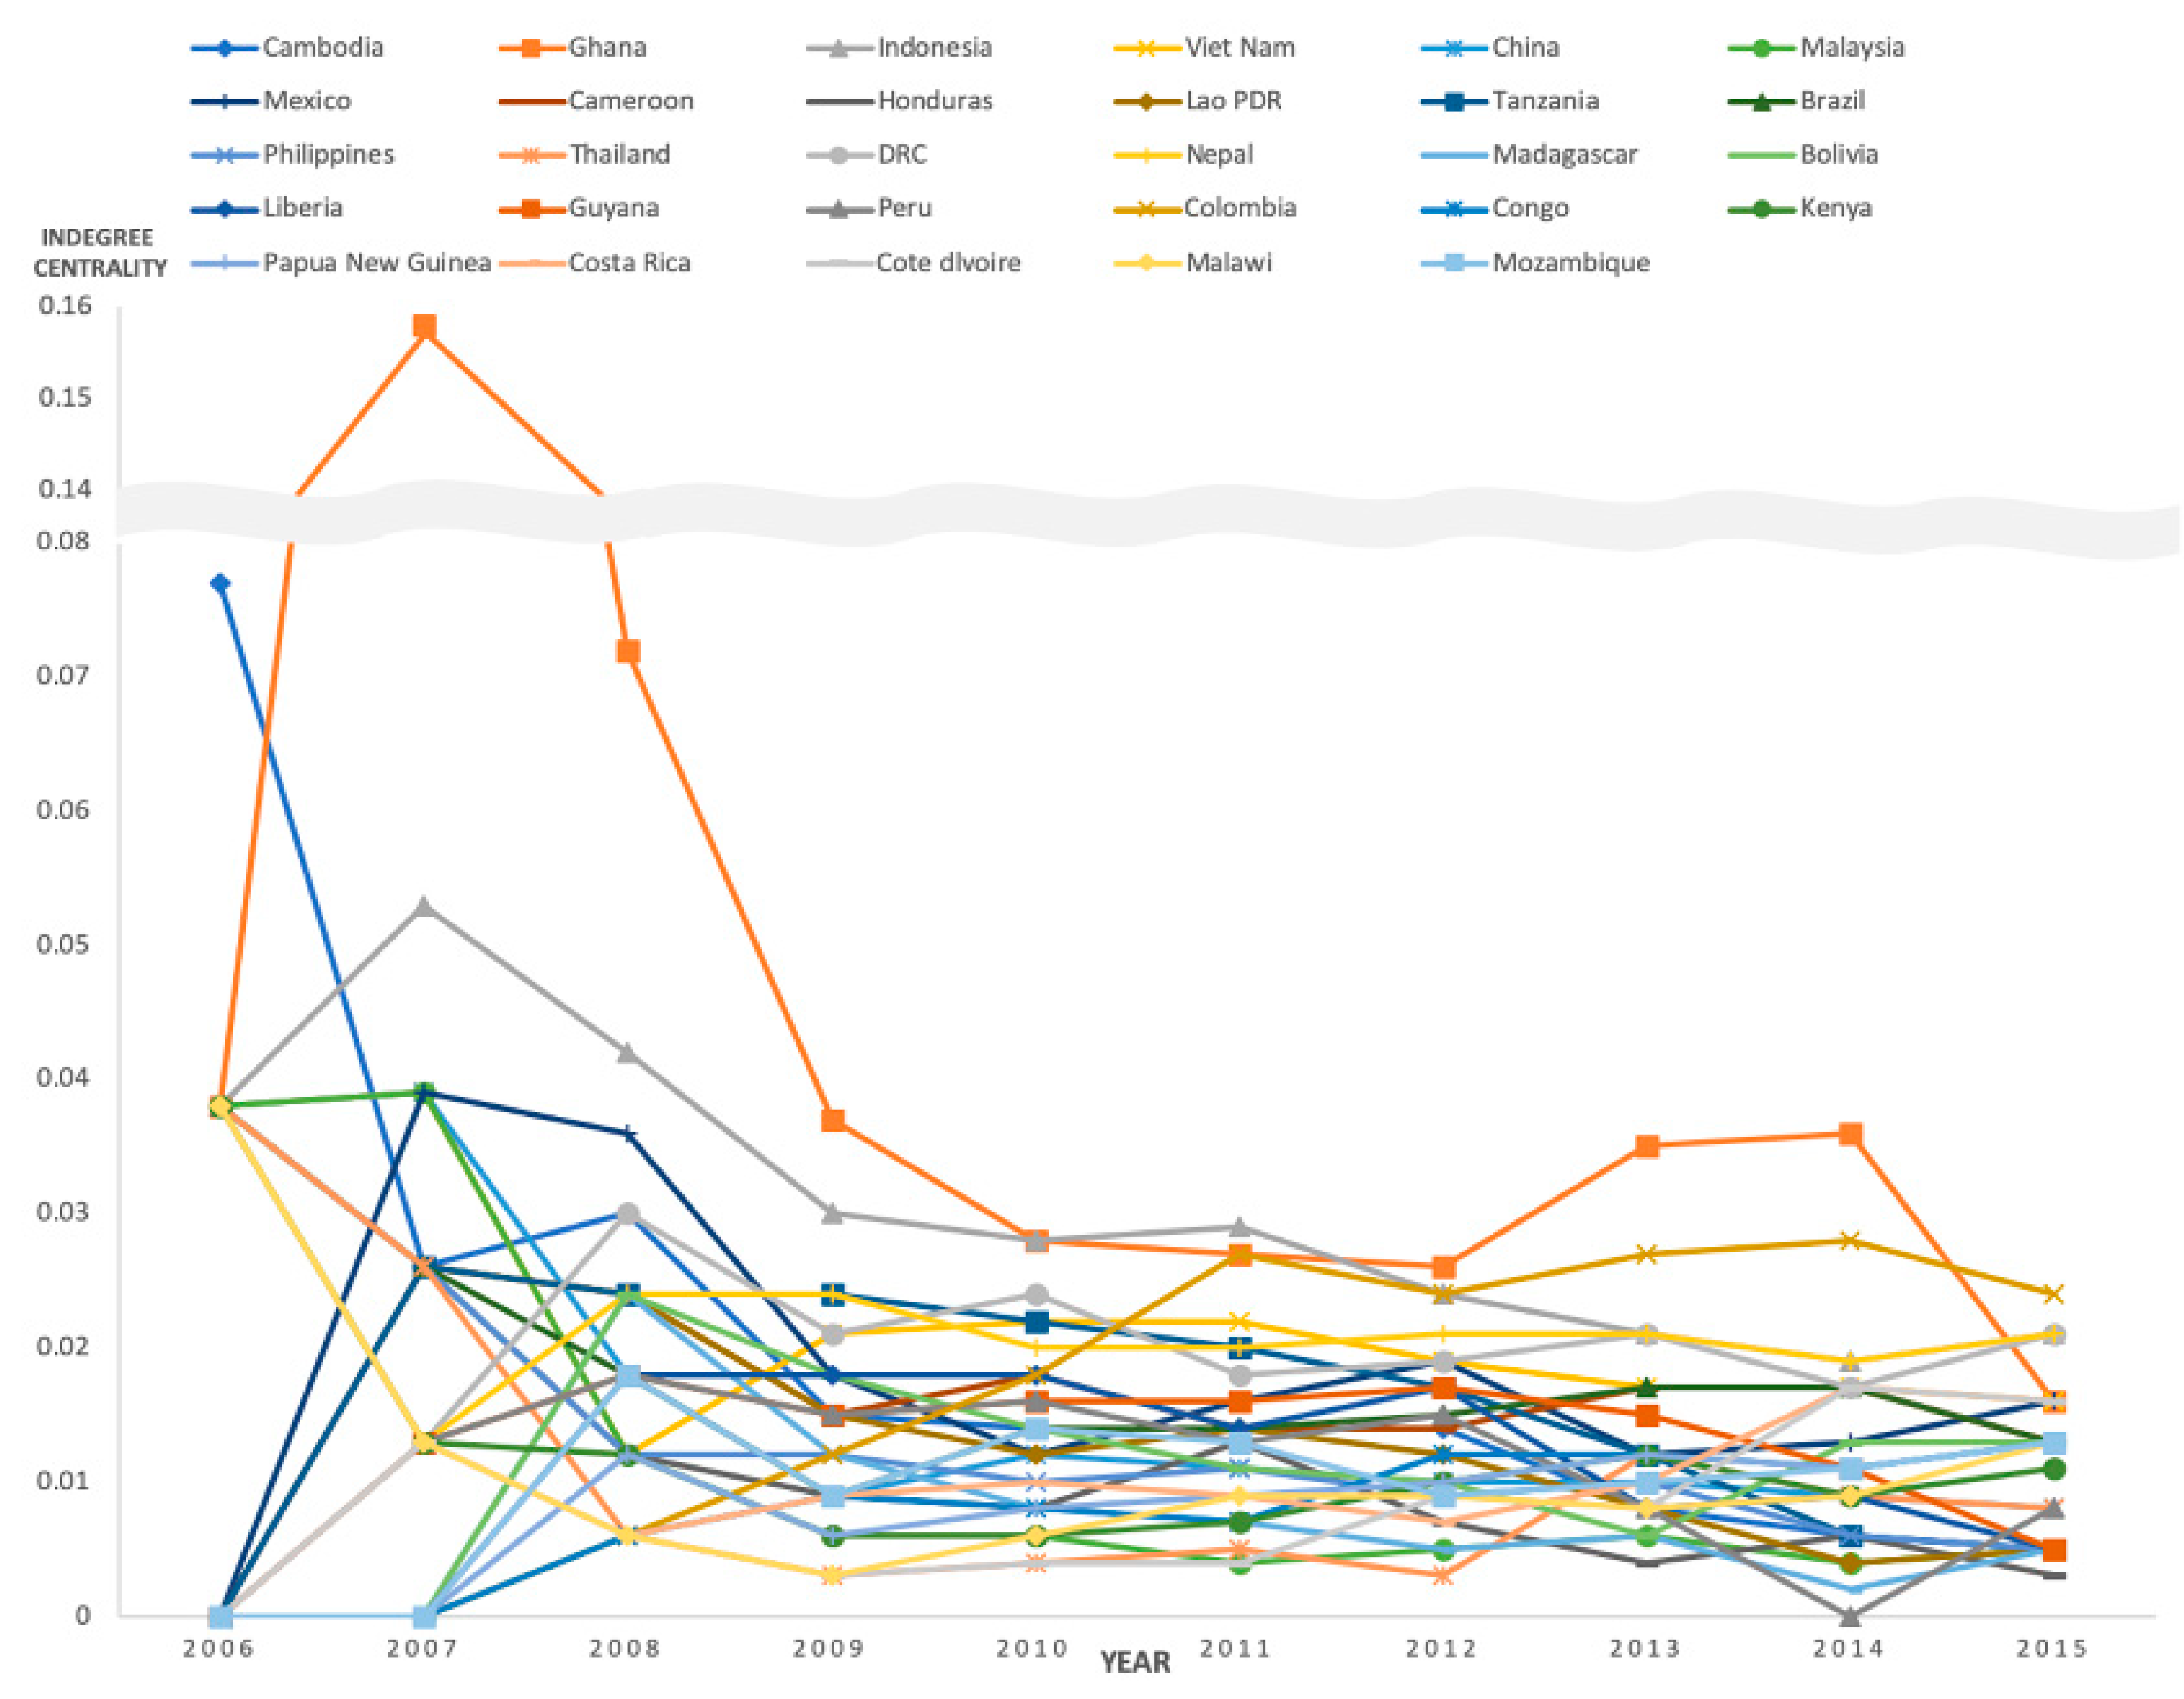
3.2. Centralities
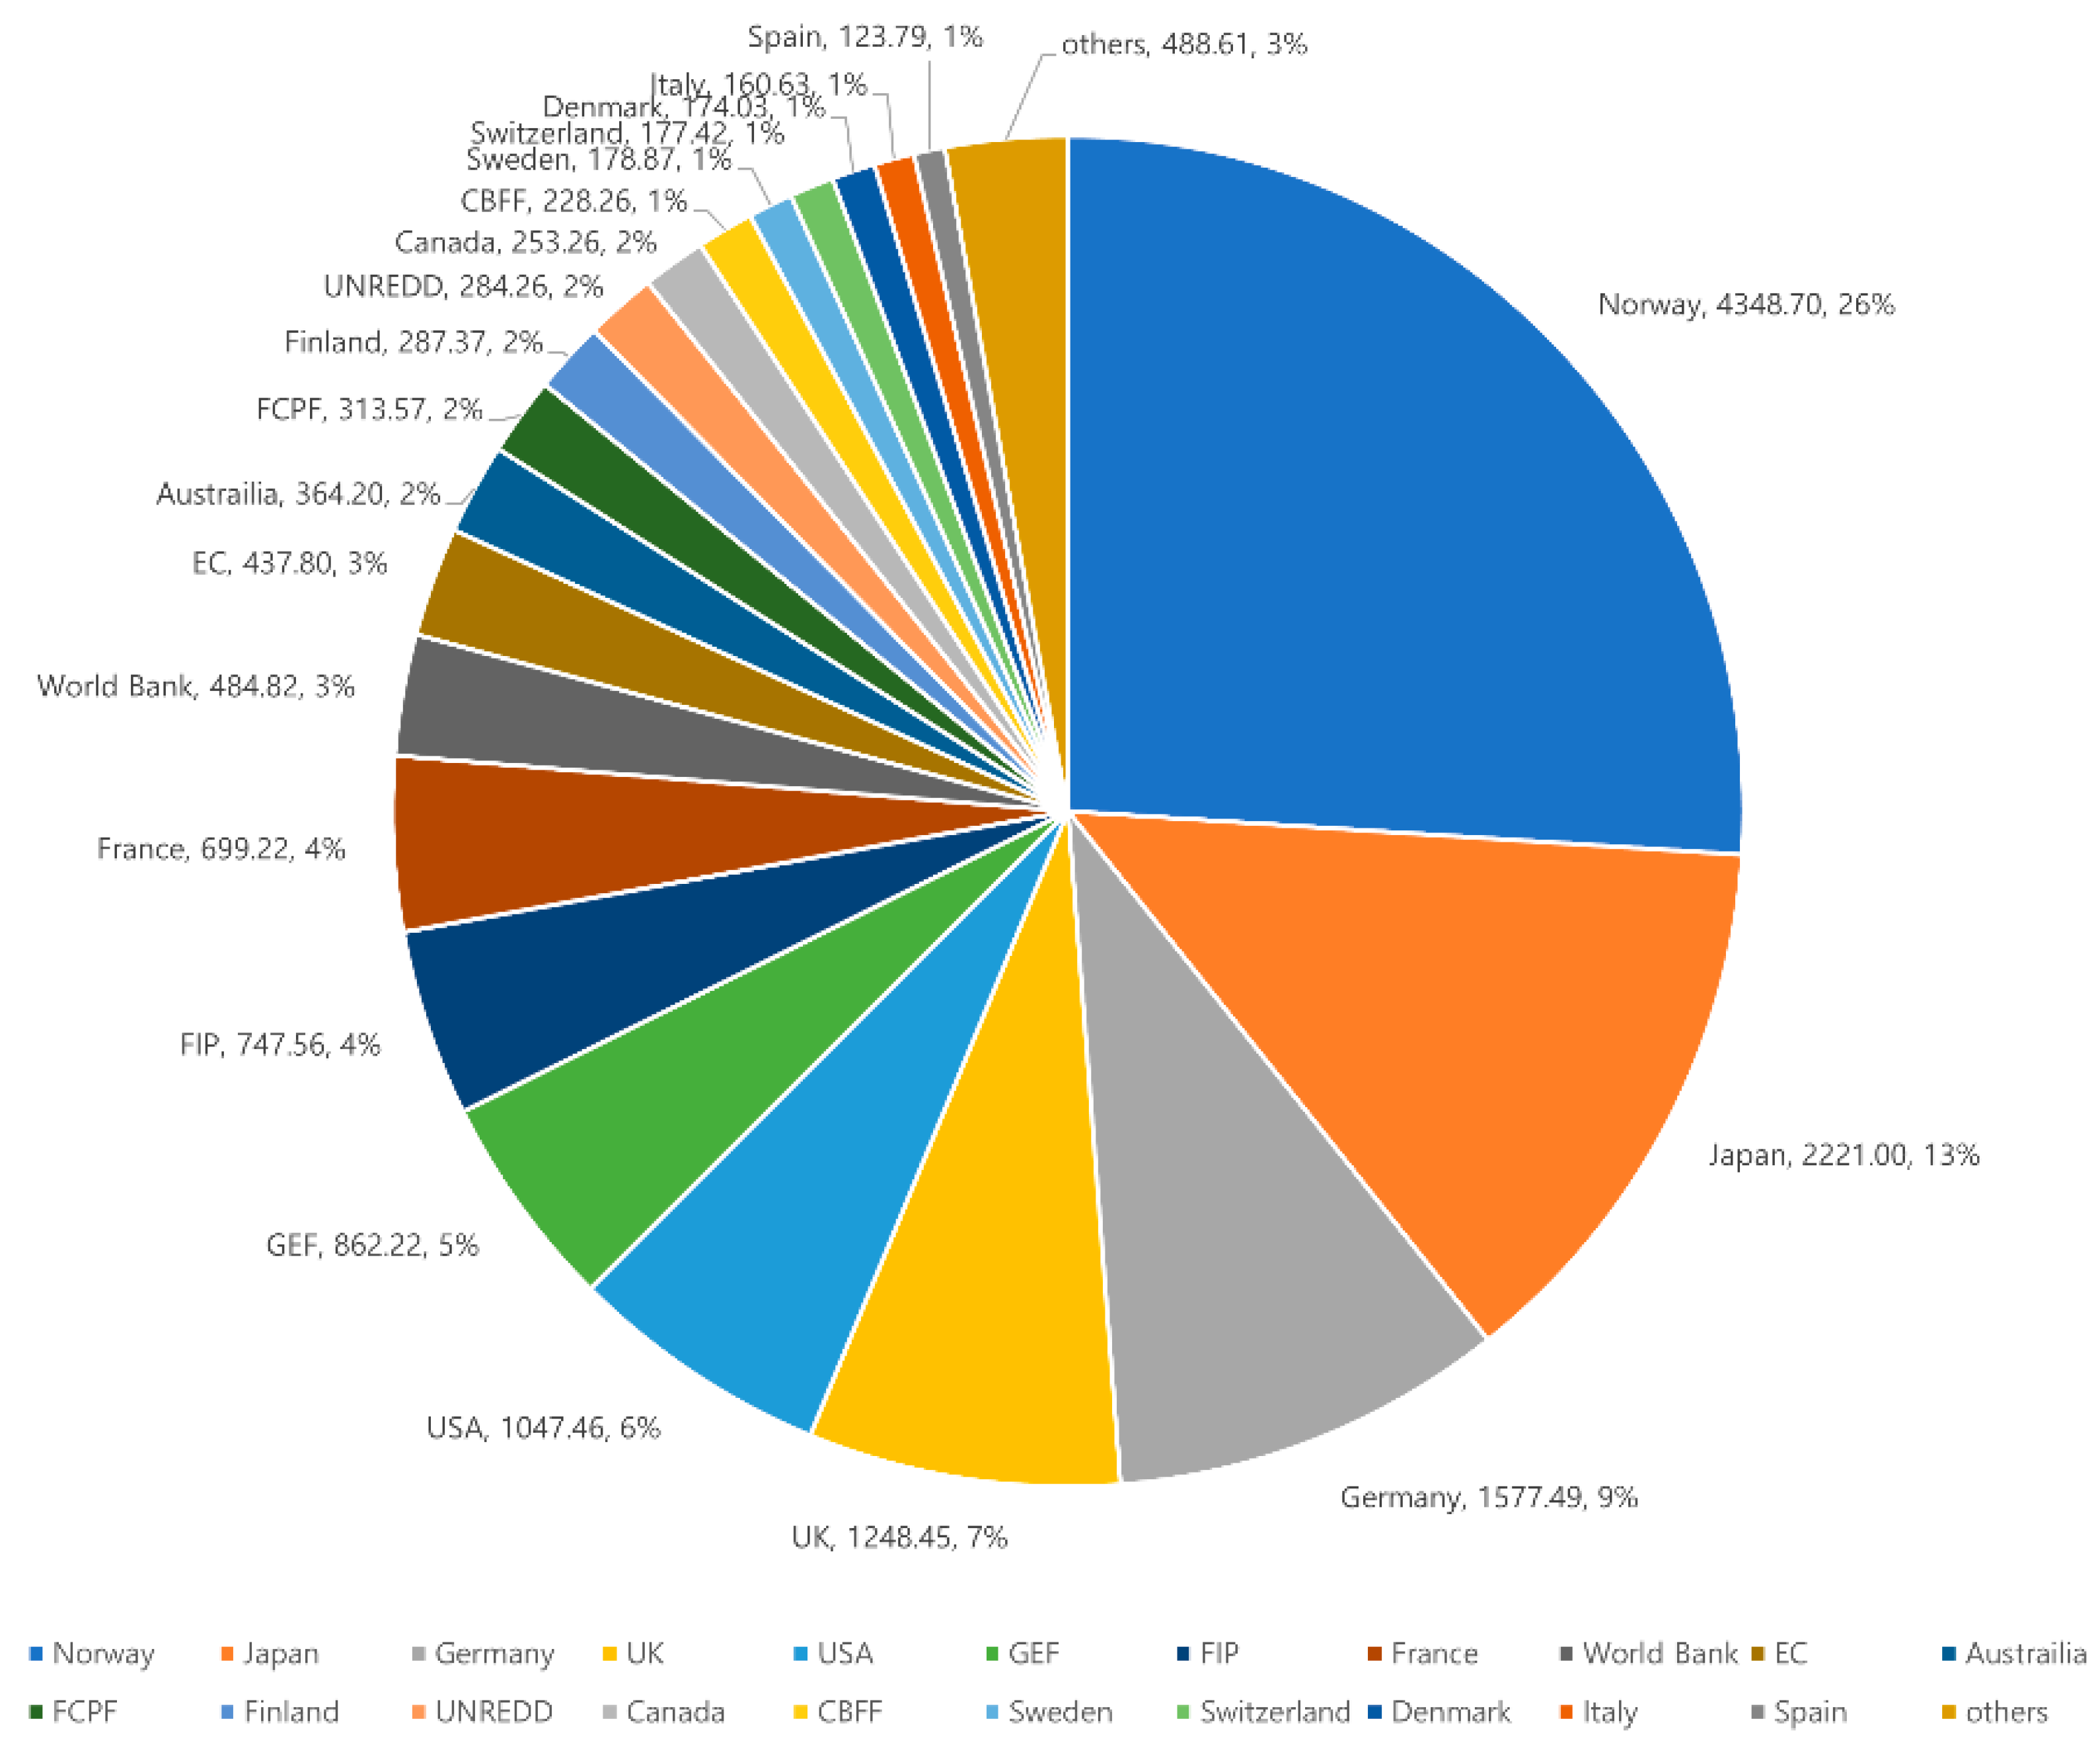
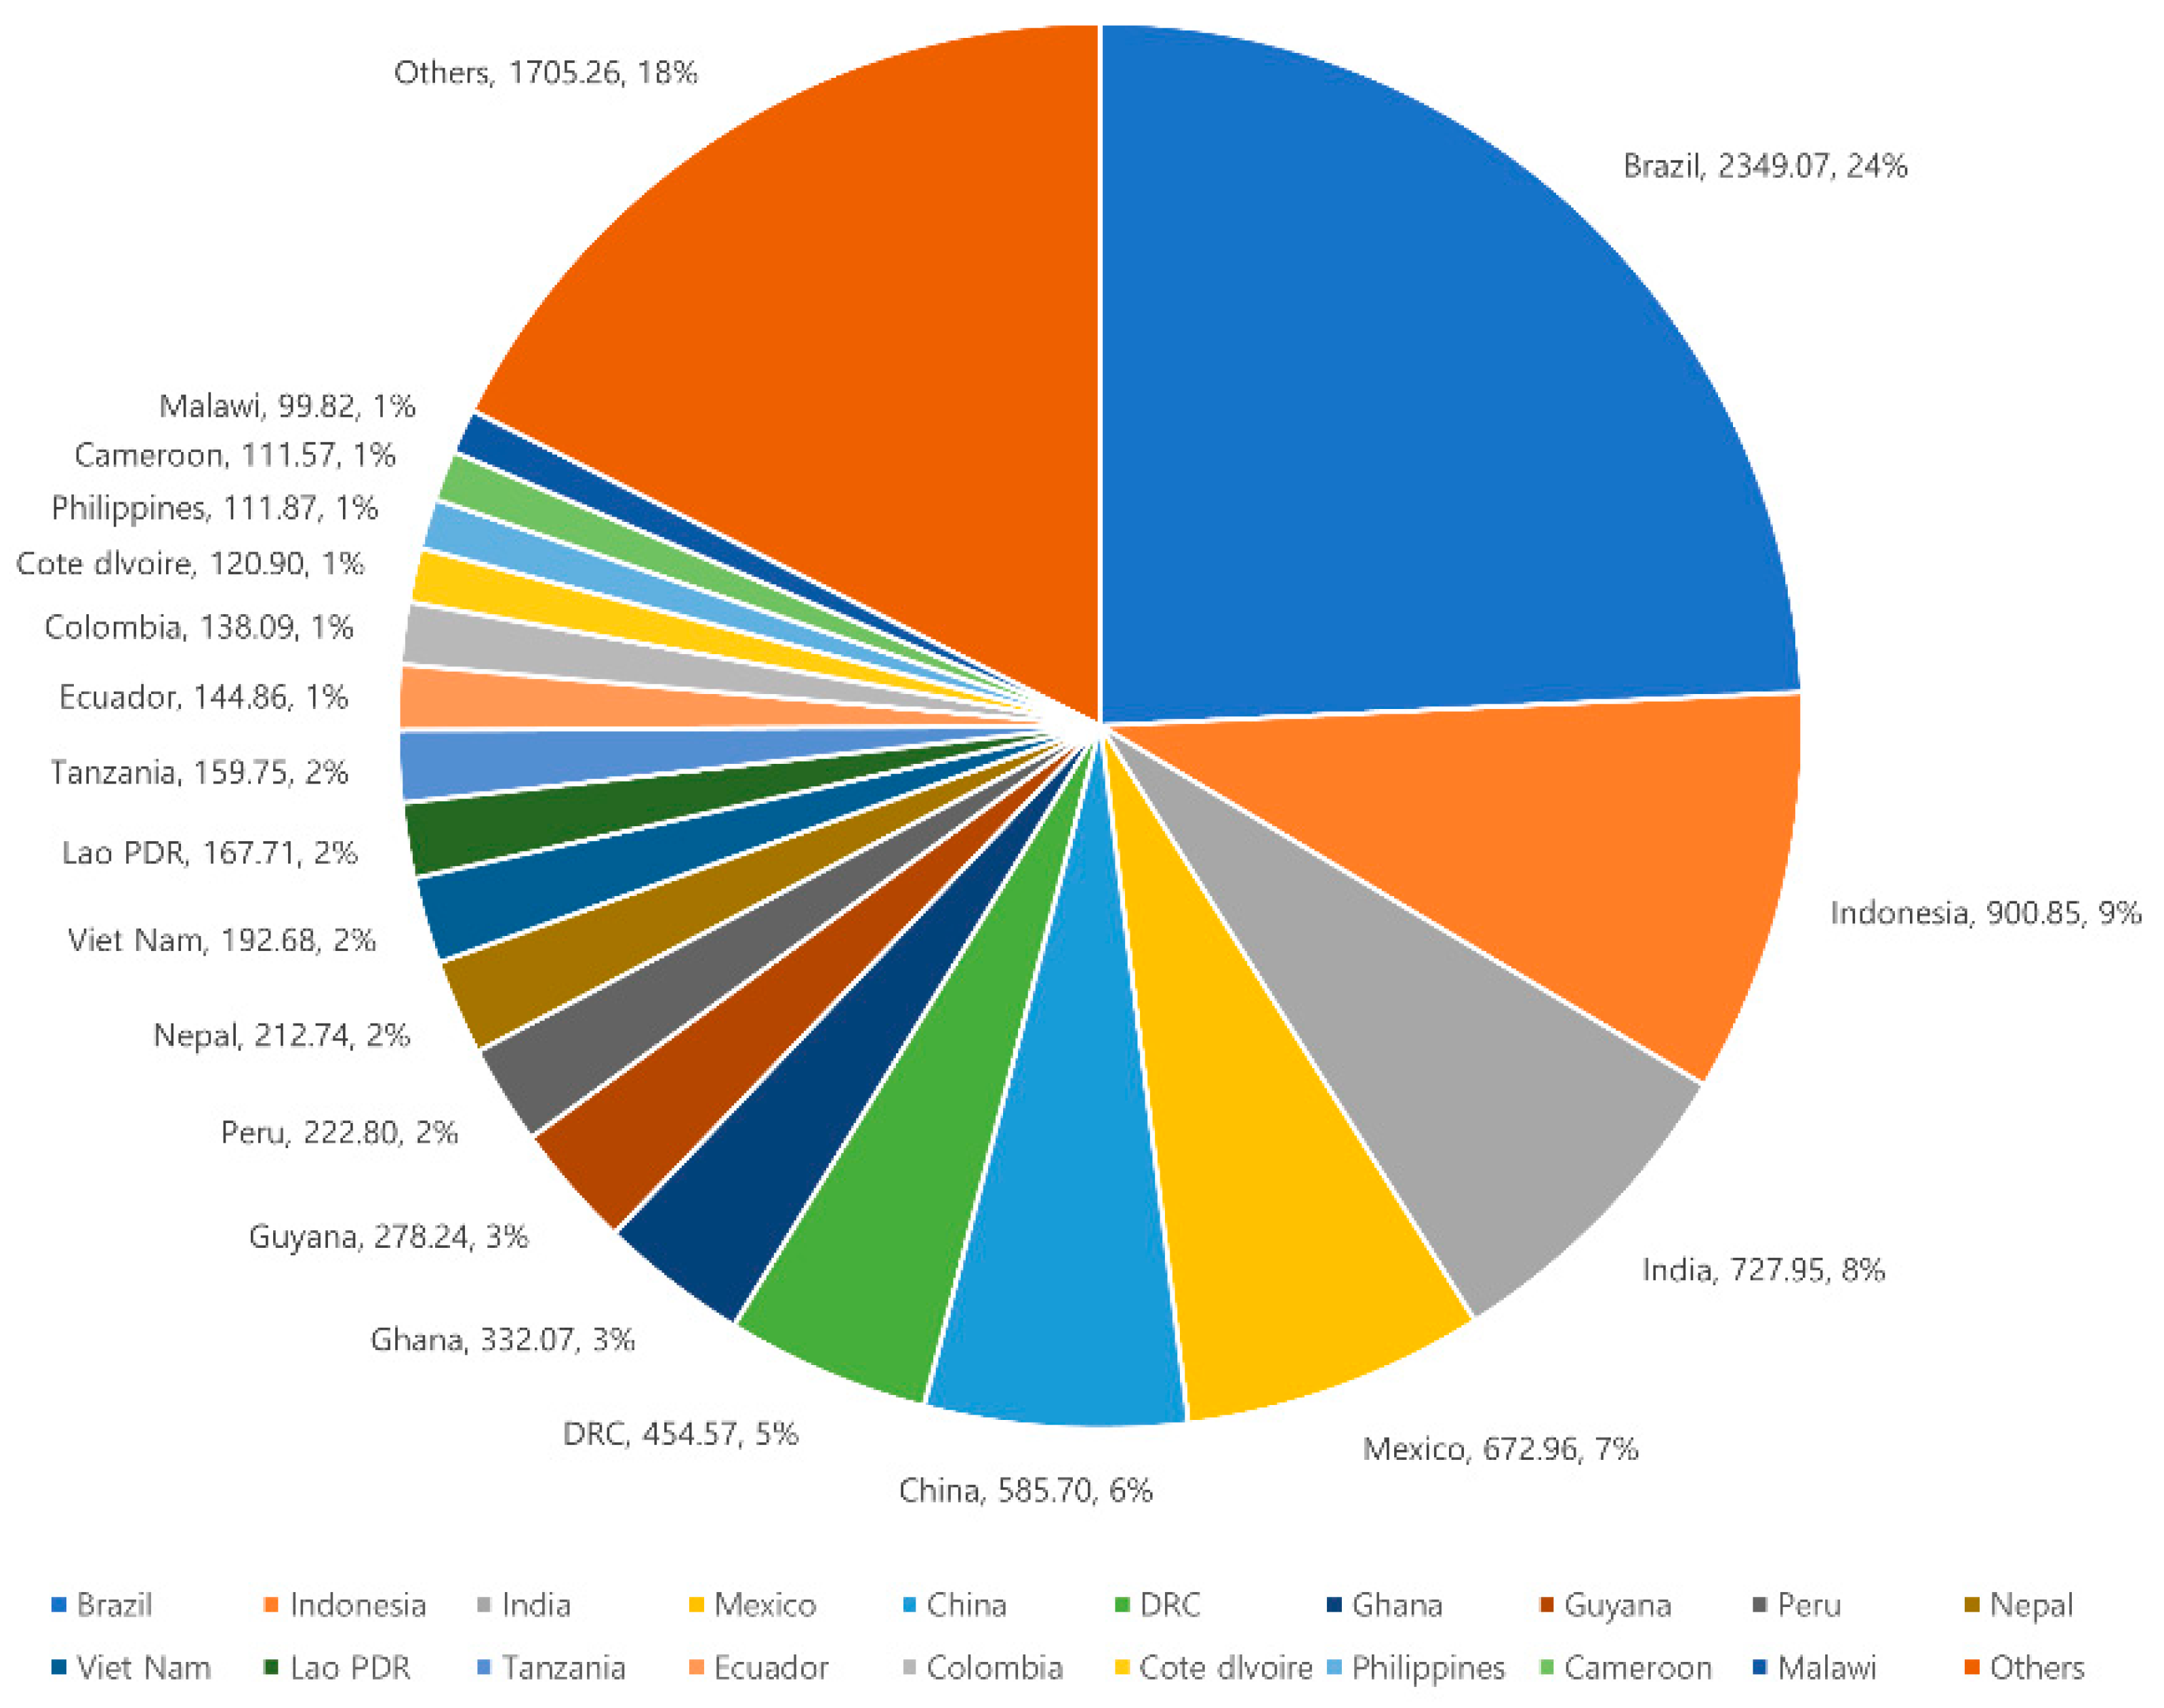
3.3. Analysis of Total Committed Fund
4. Discussion and Conclusions
Author Contributions
Funding
Conflicts of Interest
References
- Baumgartner, R.J. Sustainable development goals and the forest sector—A complex relationship. Forests 2019, 10, 152. [Google Scholar] [CrossRef]
- UNFCCC Secretariat. Key Decisions Relevant for Reducing Emissions from Deforestation and Forest Degradation in Developing Countries (REDD+); UNFCCC Secretariat: Geneva, Switzerland, 2014. [Google Scholar]
- Angelsen, A. REDD+ as result-based aid: General lessons and bilateral agreements of Norway. Rev. Dev. Econ. 2017, 21, 237–264. [Google Scholar] [CrossRef]
- Creed, A.; Nakhooda, S. REDD+ Finance Delivery: Lessons from Early Experience; Overseas Development Institute: London, UK, 2011. [Google Scholar]
- UNFCCC. Second Voluntary Meeting on the Coordination of Support for the Implementation of Activities Referred to in Decision 1/CP.16, Paragraph 70 (REDD+); UNFCCC: Geneva, Switzerland, 2015. [Google Scholar]
- UNFCCC. Third Voluntary Meeting on the Coordination of Support for the Implementation of Activities Referred to in Decision 1/CP.16, Paragraph 70 (REDD+); UNFCCC: Geneva, Switzerland, 2016. [Google Scholar]
- UNFCCC. Fourth Voluntary Meeting on the Coordination of Support for the Implementation of Activities Referred to in Decision 1/CP.16, Paragraph 70 (REDD+); UNFCCC: Geneva, Switzerland, 2017. [Google Scholar]
- Streck, C. Financing REDD+: Matching needs and ends. Curr. Opin. Environ. Sustain. 2012, 4, 628–637. [Google Scholar] [CrossRef]
- Norman, M.; Nakhooda, S. The State of REDD+ Finance; Center for Global Development Working Paper; Center for Global Development: Washington, DC, USA; London, UK, 2015; p. 378. [Google Scholar]
- Gallemore, C.; Munroe, D.K. Centralization in the global avoided deforestation collaboration network. Glob. Environ. Change 2013, 23, 1199–1210. [Google Scholar] [CrossRef]
- Commission on Global Governance. Our Global Neighborhood: The Report of the Commission on Global Governance; Oxford University Press: Oxford, UK; New York, NY, USA, 1995; ISBN 978-0-19-827997-6. [Google Scholar]
- Webber, M.; Croft, S.; Howorth, J.; Terriff, T.; Krahmann, E. The governance of European security. Rev. Int. Stud. 2004, 30, 3–26. [Google Scholar] [CrossRef]
- Eilstrup-Sangiovanni, M. Global governance networks. In The Oxford Handbook of Political Networks; Victor, J.N., Montgomery, A.H., Lubell, M., Eds.; Oxford University Press: Oxford, UK, 2016; ISBN 978-0-19-022821-7. [Google Scholar]
- Biermann, F.; Pattberg, P.; van Asselt, H.; Zelli, F. The fragmentation of global governance architectures: A framework for analysis. Glob. Environ. Polit. 2009, 9, 14–40. [Google Scholar] [CrossRef]
- Robins, G.; Bates, L.; Pattison, P. Network governance and environmental management: Conflict and cooperation. Publ. Adm. 2011, 89, 1293–1313. [Google Scholar] [CrossRef]
- The Architecture of Global Environmental Governance: Pros and Cons of Multiplicity. Available online: http://www.centerforunreform.org/?q=node/234 (accessed on 11 June 2019).
- Den Besten, J.W.; Arts, B.; Verkooijen, P. The evolution of REDD+: An analysis of discursive-institutional dynamics. Environ. Sci. Policy 2014, 35, 40–48. [Google Scholar] [CrossRef]
- Thompson, M.C.; Baruah, M.; Carr, E.R. Seeing REDD+ as a project of environmental governance. Environ. Sci. Policy 2011, 14, 100–110. [Google Scholar] [CrossRef]
- Forest Carbon Partnership Facility. Available online: https://www.forestcarbonpartnership.org/ (accessed on 10 June 2019).
- UN-REDD Programme. Available online: https://www.un-redd.org/ (accessed on 10 June 2019).
- Central African Forest Initiative (CAFI). Available online: http://www.cafi.org/ (accessed on 10 June 2019).
- COMIFAC: Commission of Central African Forests. Available online: https://comifac.org/en (accessed on 10 June 2019).
- International Centre for Integrated Mountain Development (ICIMOD). Available online: http://www.icimod.org/ (accessed on 10 June 2019).
- Norway’s International Climate and Forest Initiative (NICFI). Available online: https://norad.no/en/front/thematic-areas/climate-change-and-environment/norways-international-climate-and-forest-initiative-nicfi/ (accessed on 12 June 2019).
- GIZ REDD Early Movers—Tools and Instruments. Available online: https://www.giz.de/en/worldwide/33356.html (accessed on 12 June 2019).
- Countries | REDD+ Reducing Emissions from Deforestation and Forest Degradation | Food and Agriculture Organization of the United Nations. Available online: http://www.fao.org/redd/countries/en/ (accessed on 12 June 2019).
- GCF. GCF in Brief: REDD+. Available online: https://www.greenclimate.fund/publications/gcf-in-brief-redd- (accessed on 12 June 2019).
- Dong Ho, L. The Current Status of Development Supports for Overseas Sub-National REDD+ and Its Implications; National Institute of Forest Science: Seoul, Korea, 2018.
- UK DECC. An International Climate Fund Business Case for DECC Investment in the BioCarbon Fund and the Forest Carbon Partnership Facility—Carbon Fund; UK DECC: London, UK, 2014. [Google Scholar]
- FAO. The Voluntary REDD+ Database; Downloaded 11 February 2016; FAO: Rome, Italy, 2016. [Google Scholar]
- Gómez, R.; Hernandez, M. Colombia: Seguimiento al Financiamiento para REDD+ Período 2009–2014. For. Trends 2016. [Google Scholar]
- Piña, C.M.; Flores, J.O. México: Seguimiento al Financiamiento para REDD+ 2009–2012. For. Trends 2013. [Google Scholar]
- Moull, K.; Olander, J. Ecuador: Seguimiento al Financiamiento para REDD+ Período 2013–2014. For. Trends 2016. [Google Scholar]
- Mbot’ekola, G.K.; Michel, B. Democratic Republic of Congo: Mapping REDD+ Finance Flows 2009–2014. For. Trends 2016. [Google Scholar]
- Agyei, K.; Asare, R.A. Ghana: Mapping REDD+ Finance Flows 2009–2014. For. Trends 2016. [Google Scholar]
- Gutiérrez, M.C. Peru: Seguimiento al Financiamiento para REDD+ Período 2009–2014. For. Trends 2016. [Google Scholar]
- Swiss Agency for Development and Cooperation. Climate Change: Swiss Fast Start Financing from Public Sources (ODA); Swiss Agency for Development and Cooperation: Bern, Switzerland, 2013. [Google Scholar]
- Government of Canada. Canada’s Fast-Start Financing: Delivering on Our Copenhagen Commitment; Government of Canada: Ottawa, ON, Canada, 2013.
- Hafner-Burton, E.M.; Kahler, M.; Montgomery, A.H. Network analysis for international relations. Int. Org. 2009, 63, 559–592. [Google Scholar] [CrossRef]
- Guerra, F.; Isailovic, M.; Widerberg, O.; Patterberg, P. Mapping the Institutional Architecture of Global Forest Governance; IVM Institute for Environmental Studies: Amsterdam, The Netherlands, 2015. [Google Scholar]
- Gallemore, C.; Jespersen, K. Transnational markets for sustainable development governance: The case of REDD+. World Dev. 2016, 86, 79–94. [Google Scholar] [CrossRef]
- Wasserman, S.; Faust, K. Social Network Analysis: Methods and Applications; Structural Analysis in the Social Sciences; Cambridge University Press: Cambridge, UK; New York, NY, USA, 1994; ISBN 978-0-521-38269-4. [Google Scholar]
- R Core Team. R: A Language and Environment for Statistical Computing; (Version: 3.5.3); R Foundation for Statistical Computing: Vienna, Austria, 2017. [Google Scholar]
- Cyram. Netminer 4; Cyram: Seongnam-si, Gyeong-gi, Korea, 2017. [Google Scholar]
- Angelsen, A. WIDER Working Paper No. 2013/135 REDD+ as Performance-Based aid: General Lessons and Bilateral Agreements of Norway; UNU-WIDER: Helsinki, Finland, 2013; p. 27. [Google Scholar]
- Parker, C.; Cranford, M.; Roe, S.; Manandhar, U. REDD+ prospects in LDCs. Clim. Focus 2013. [Google Scholar]


© 2019 by the authors. Licensee MDPI, Basel, Switzerland. This article is an open access article distributed under the terms and conditions of the Creative Commons Attribution (CC BY) license (http://creativecommons.org/licenses/by/4.0/).
Share and Cite
Kim, D.-h.; Kim, D.-h.; Lee, D.-H.; Park, S.; Kim, S.-i. Centralization of the Global REDD+ Financial Network and Implications under the New Climate Regime. Forests 2019, 10, 753. https://doi.org/10.3390/f10090753
Kim D-h, Kim D-h, Lee D-H, Park S, Kim S-i. Centralization of the Global REDD+ Financial Network and Implications under the New Climate Regime. Forests. 2019; 10(9):753. https://doi.org/10.3390/f10090753
Chicago/Turabian StyleKim, Do-hun, Dong-hwan Kim, Dong-Ho Lee, Sunjoo Park, and Seong-il Kim. 2019. "Centralization of the Global REDD+ Financial Network and Implications under the New Climate Regime" Forests 10, no. 9: 753. https://doi.org/10.3390/f10090753
APA StyleKim, D.-h., Kim, D.-h., Lee, D.-H., Park, S., & Kim, S.-i. (2019). Centralization of the Global REDD+ Financial Network and Implications under the New Climate Regime. Forests, 10(9), 753. https://doi.org/10.3390/f10090753