Article

Implications of Selective Harvesting of Natural Forests for Forest Product Recovery and Forest Carbon Emissions: Cases from Tarai Nepal and Queensland Australia

by
Bishnu Hari Poudyal
,
Tek Narayan Maraseni
* and
Geoff Cockfield
Centre for Sustainable Agricultural Systems, University of Southern Queensland, Queensland 4350, Australia
*
Author to whom correspondence should be addressed.
Forests 2019, 10(8), 693; https://doi.org/10.3390/f10080693
Submission received: 5 July 2019 / Revised: 12 August 2019 / Accepted: 13 August 2019 / Published: 15 August 2019
(This article belongs to the Special Issue Forest Carbon Inventories and Management)

Abstract

:
Selective logging is one of the main natural forest harvesting approaches worldwide and contributes nearly 15% of global timber needs. However, there are increasing concerns that ongoing selective logging practices have led to decreased forest product supply, increased forest degradation, and contributed to forest based carbon emissions. Taking cases of natural forest harvesting practices from the Tarai region of Nepal and Queensland Australia, this study assesses forest product recovery and associated carbon emissions along the timber production chain. Field measurements and product flow analysis of 127 commercially harvested trees up to the exit gate of sawmills and interaction with sawmill owners and forest managers reveal that: (1) Queensland selective logging has less volume recovery (52.8%) compared to Nepal (94.5%) leaving significant utilizable volume in the forest, (2) Stump volume represents 5.5% of total timber volume in Nepal and 3.9% in Queensland with an average stump height of 43.3 cm and 40.1 cm in Nepal and Queensland respectively, (3) Average sawn timber output from the harvested logs is 36.3% in Queensland against 61% in Nepal, (4) Nepal and Queensland leave 0.186 Mg C m−3 and 0.718 Mg C m−3 on the forest floor respectively, (5) Each harvested tree damages an average of five plant species in Nepal and four in Queensland predominantly seedlings in both sites, and (6) Overall logging related total emissions in Queensland are more than double (1.099 Mg C m−3) those in Nepal (0.488 Mg C m−3). We compared these results with past studies and speculated on possible reasons for and potential implications of these results for sustainable forest management and reducing emissions from deforestation and forest degradation.

1. Introduction

Forests are renewable natural resources that provide multiple goods and services to fulfil societal and environmental wants and needs. Efficient forest production and wise and balanced use are therefore crucial to sustain the supply of these resources. However, numerous challenges exist for efficient forest utilisation, mostly because of the resource trade-offs [1] coupled with ongoing forest harvesting policies and practices [2]. As one of the dominant natural forest harvesting practices, selective logging contributes nearly 15% of the global timber needs [3,4,5] and is therefore of global concern to ensure sustainability of global forest benefits. Although only the trees that have a commercial value are removed under this approach, it is argued that insufficient attention has been paid to efficient management of selective logging practices, leading to forest degradation [6], thereby reducing forest product supply [7], increasing forest carbon emissions [8] and deterioration of wildlife habitat [3]. An assessment of these harvesting practices in a specific context is therefore important to understand their possible implications and to encourage policy makers and forest managers to act for better forest management outcomes.
The amount of forest products recovered from forest harvesting operations is one of the key indicators used to assess the socio-economic and environmental effectiveness of natural forest management. Specifically, timber volume recovery is one of the key determinants of financial attractiveness in forest management [5,9]. Although the level of such effectiveness is defined according to the needs and socio-economic livelihoods of the local people and the political, environmental and market settings of a specific context [10,11,12,13,14], optimizing societal and environmental benefits from forest products (goods and services) has been increasingly important in the context of mitigation of and adaptation to a changing climate [15,16,17,18,19]. However, the current body of knowledge focuses largely on harvesting impacts on forest growth and tree regeneration dynamics [20] and long-term stocks of timber, biomass and carbon [5,21]. Limited attention is given to recovery rates of harvested products and carbon emissions along the timber value chain from mature forest stands [9,22] in both developing and developed countries [7,23,24,25,26,27]. Recent studies show increased attention being paid to logging-related forest carbon emissions from selective logging in relation to reducing emissions from deforestation and forest degradation (REDD+) perspectives [15,18,20]. However, these are confined to a few specific examples and comparative studies between developed and developing countries are still lacking.
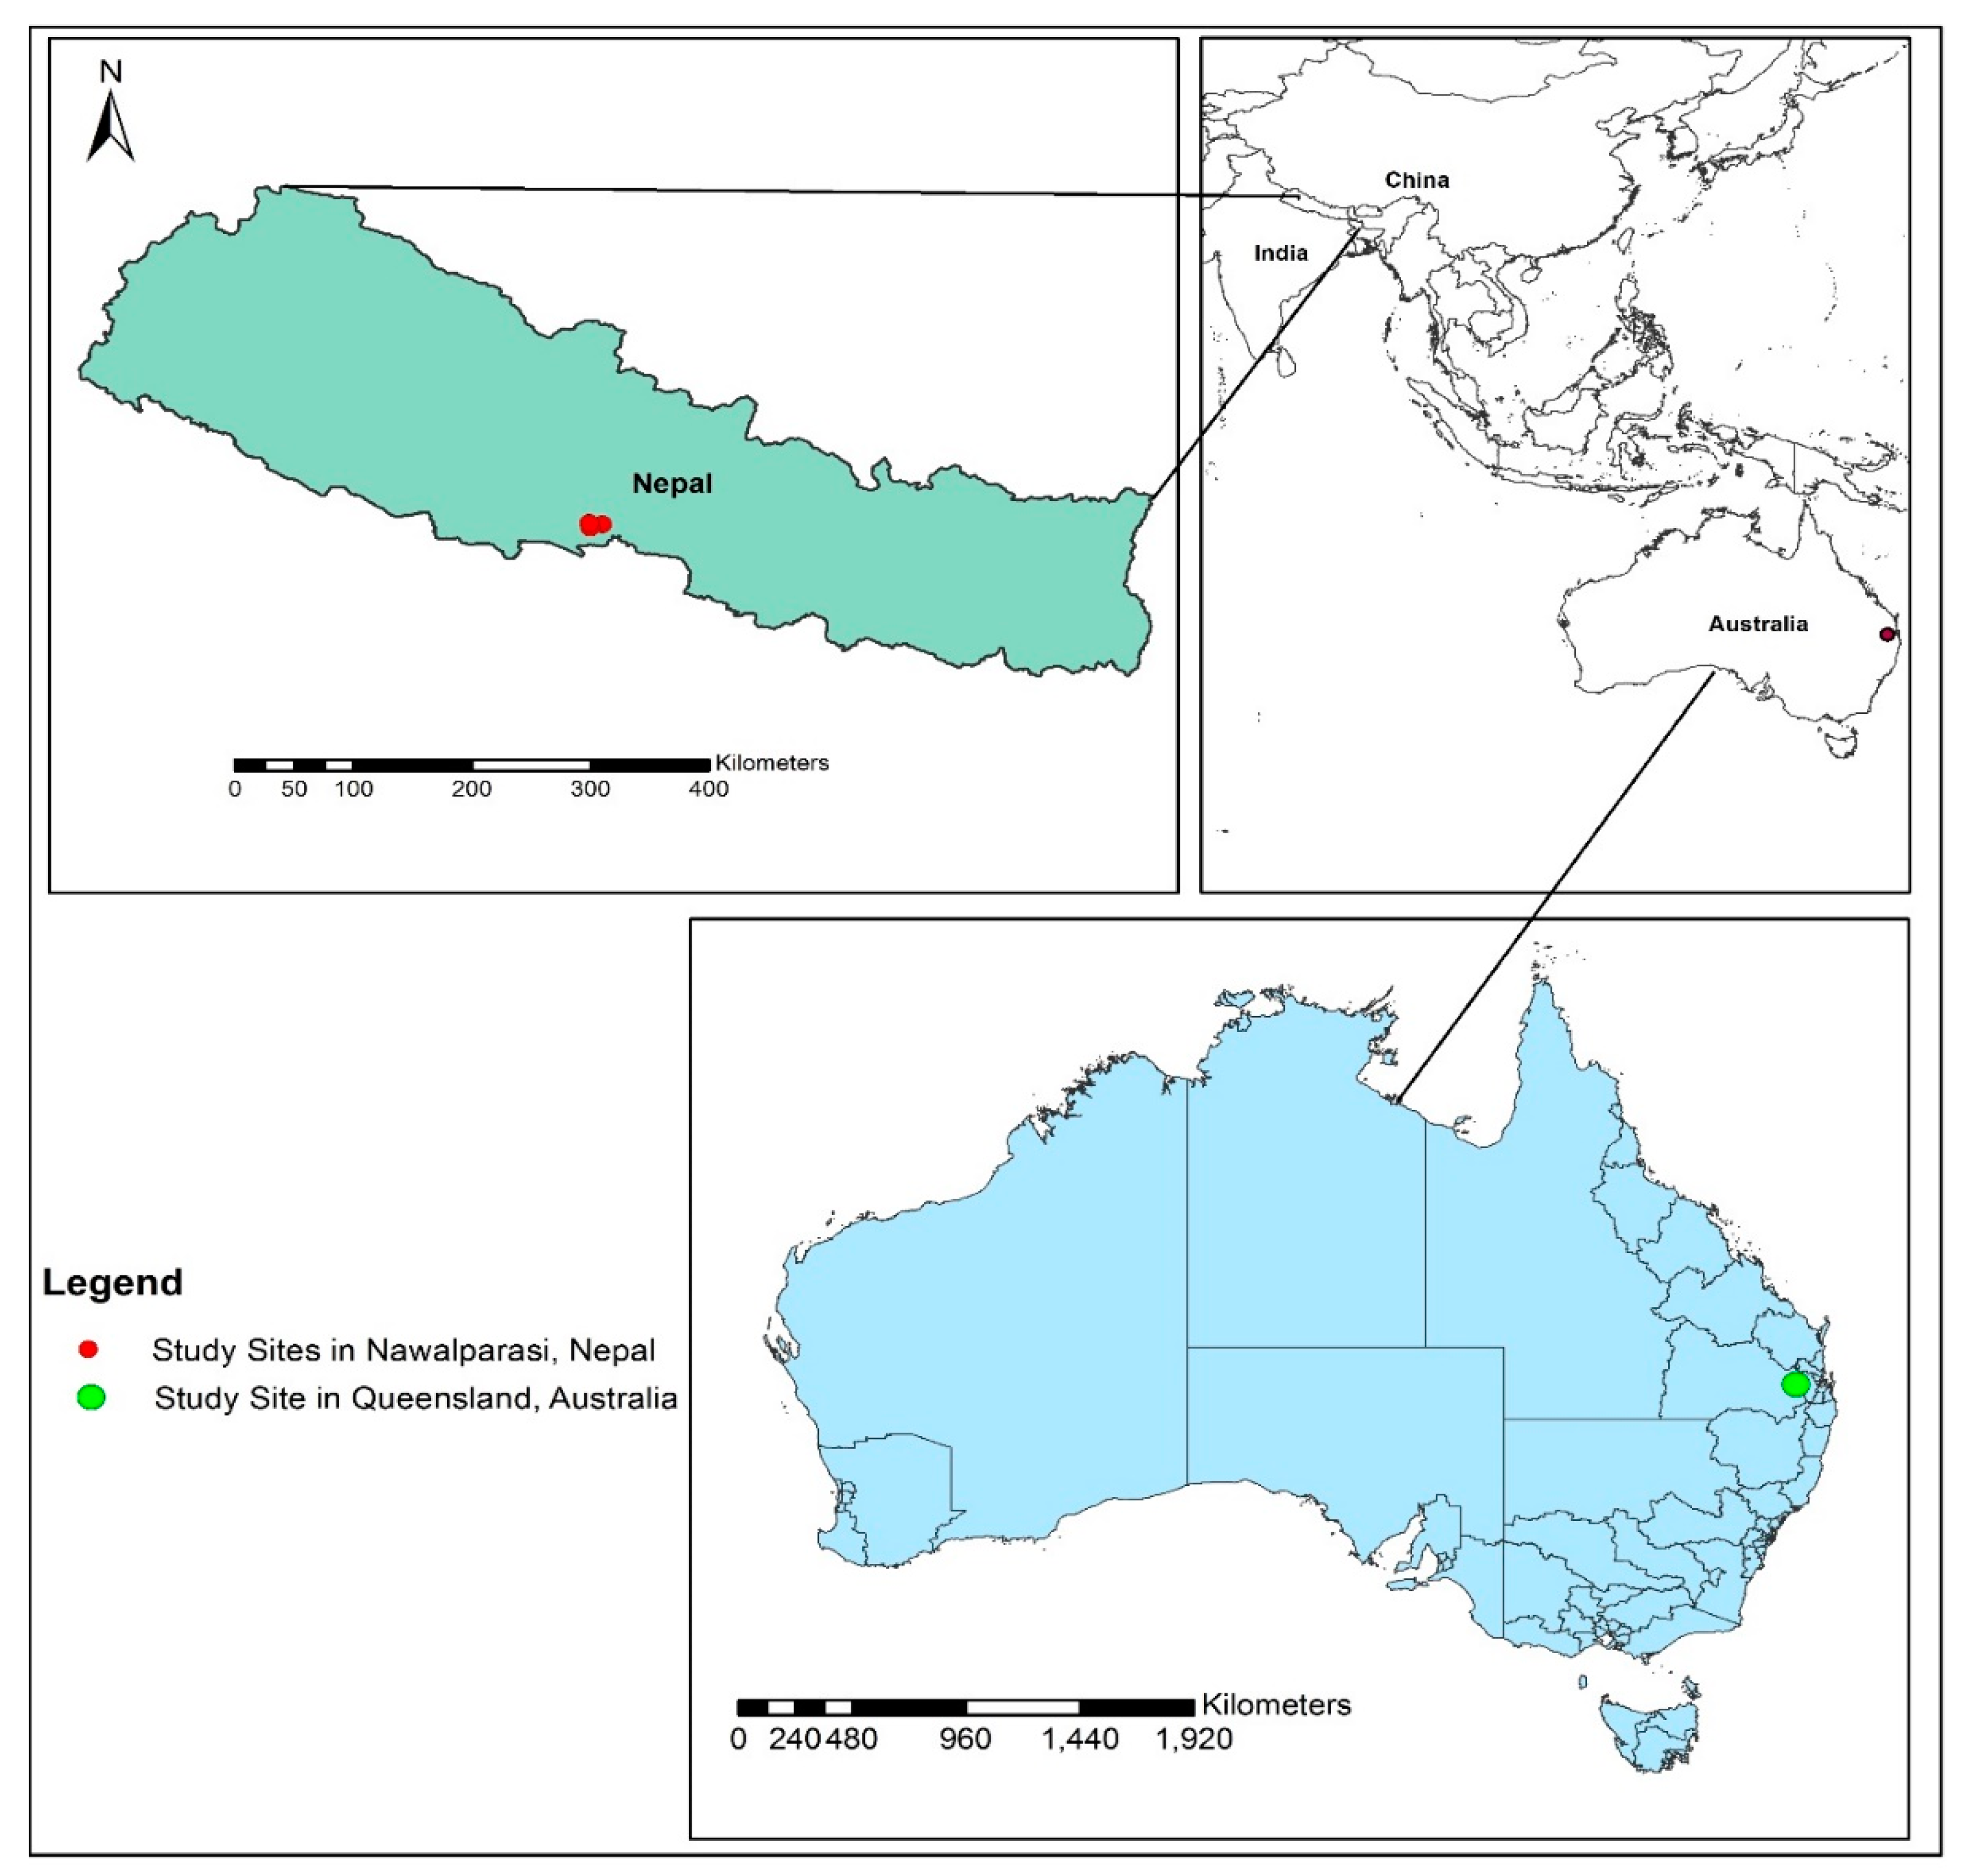
This paper presents the cases of Queensland Australia and the Tarai forest of Nepal, highlighting the recovery and utilization of forest products, as well as associated harvesting damages and its implications for forest-based carbon emissions under selective logging. In so doing, we aim to answer three key questions: (a) What is the forest product volume recovery and utilization percentage after tree harvest? (b) What is the average rate of damage from harvesting to neighbouring tree species? and finally (c) What are the implications of current harvesting practices for carbon stock potential of harvested wood products along the production chain? Exploration of these questions is important for the following reasons. First, the study will inform policy makers on the amount of recovered forest products and highlight the potential implications of current practices for forest-based carbon mitigation potential. For Nepal, this would be the first study of this kind and therefore fills the knowledge gap on forest product recovery along the forest production chain. For Queensland, the study will add value to quantifying the harvesting wastages in Spotted gum-dominated private forests and will contribute to addressing the issues of increased harvesting related wastage in the forests [27,28].
Second, the assessment offers empirical evidence as to whether existing forest harvesting systems (policies and practices) need modification to respond to national and global challenges for maintaining demand for wood products as well as conserving other forest ecosystem services. Such actions will support the sustainability of wood-based industries in both countries [29,30] with additional positive impacts on industry profits, carbon benefits, state revenue, and employment and income to the State and the local communities. Finally, exploration of the separate cases of forest management practices in two different economies opens up avenues to share better practices and areas of potential improvement in forest product utilisation, thereby enhancing the role of forests in climate change mitigation.

2. Materials and Methods

2.1. Study Sites

Data for the study were gathered from the Tarai region of Nepal and the Southeast region of Queensland. The case study site in Nepal is rich in commercially high-value natural forests dominated by Sal (Shorea robusta) [31] whereas the Queensland site is rich in high-value native hardwood timber with a dominance of Spotted gum (Corymbia maculata) [32]. Specifically, the Nawalparasi district of Nepal and the Withcott area of Queensland were selected for study, considering the availability of ongoing forest harvesting blocks (Figure 1). Since the primary objective of the study was to assess the immediate implications of forest operations on forest product recovery and associated carbon emissions, we selected areas where forest harvesting had already been assigned to the tree harvesting individuals/loggers.

2.2. Data Collection and Analysis

2.2.1. Field Measurements

In both harvest sites, we measured tree diameter at breast height (DBH—measured at 1.3 m from the tree base and in case of buttresses at that point, up to where bole circumference is relatively clear) and estimated the total tree height (H) of the marked trees (marking was done by the local level forest officials of the Nepal government in the Nepal site and by the harvester himself in the Queensland site) at crown level as these two are the key parameters to determine volume, biomass and carbon of individual tree species [33,34]. Likewise, we recorded the species name, number and location of the tree to be harvested so that the trees that were marked for felling could be identified and measured after their felling, including the incidental damage they inflicted on the neighbouring trees and undergrowth. Altogether, we measured 72 harvested trees of seven species (Shorea robusta—55, Sissoo (Dalbergia sissoo)—6, Kusum (Schleichera oleosa)—5, Asna (Terminalia tomentosa)—3, Piyari (Buchanania latifolia)—2, Banjhi (Anogeissus latifolia)—2 and Barro (Terminalia belerica)—1) from two community forests and one national forest in Nepal and 55 Spotted gum trees from a privately owned natural forest in Queensland. Detailed measurements carried out on these felled trees were: (i) stump height of the felled tree, (ii) mid-point diameter of the stump height to minimize the effect of taper, (iii) length and diameters in three sections (large end (dl)), centre of the log (dm) and small end (ds) of each log, and (iv) length and diameter of tops and branches (up to 10 cm diameter) of the harvested trees. All the measurements were taken over bark in both sites.

2.2.2. Calculation of Wood Product Volume Recovery

Based on the field measurements of two key tree measurement parameters, i.e., DBH and height of the standing trees, we estimated the standing tree volume. Then volume of stump, volume of individual log of each tree and woody volume of top head and branches with diameter more than 10 cm was calculated separately. The individual volume of the standing tree was obtained using specific allometric equations in both study sites. In Nepal, we used the equation L n ( V ) = a + b l n   ( d ) + c l n ( h ) (Ln = natural log base, V = Volume in m3, d = diameter at breast height in cm, h = height of tree in meters, a, b and c are coefficients depending on species) [35] and the volume obtained was validated with the local volume table of that specific species in that particular location [36]. In the case of Queensland, we estimated the volume using the equation V = ( 0.15843 + 0.62113 × H 0.0062485 × H 2 ) × ( B   A 0.00929 ) (where, V = Volume in m3, H = Height of the tree in meter, and BA = basal area in square meters) for Spotted gum [37].
The volume of individual tree sections after felling was calculated separately. First, the volume of the logs was calculated using Newton’s formula; V = 0.00007854 ( D s 2 + 4 D m + D l 2 ) L / 6 ) (where, V = Log Volume, 0.00007854 is the conversion factor in m3, Ds = Small end diameter, Dm = Mid Diameter, Dl = Large end diameter, L = Length of the log) considering its superior accuracy [38]. Then, stump volume, branch volume and volume of the remaining top parts with 10 cm diameter limit were calculated using the same Newton’s formula. The remaining parts of each harvested tree after separating commercial logs were measured and the volume and biomass calculated. The volume of the stump was estimated by applying the general volume calculation formula V s = π d 2 h 4 (where, Vs = Stump volume in m3, d = mid height diameter of the stump in cm and h = stump height in cm). The recovered volume was analysed using the volume recovery index (VRI)—the ratio of harvested/extracted volume to actual volume [39,40] and presented in quantity and percentage.

2.2.3. Estimation of Sawn Wood Product Recovery

To explore the processing and use of recovered harvested wood products (HWPs), we calculated sawn wood recovery from the sawmills using two approaches. First, we carried out a sawmill survey and interviewed the owners/managers in the sites. Then, the response was verified with reference to earlier studies. In the case of Nepal, we gathered the actual wood product recovery data, taking random samples of log inputs and outputs for six weeks in a company-owned sawmill in the study site (Table 1).
This actual recovery rate was validated against the response of the four other private sawmillers who cited average recovery rate as 55%–65%, considering the recovery of A, B and C grades as 80%, 60% and 40%, respectively.
In the Queensland site, we conducted interviews with two sawmill owners and three harvesters who responded that there was 36%–40% sawn timber recovery for the hardwood species dominated by Spotted gum. To validate this response, we reviewed a number of references that assessed the recovery [27,28,41,42,43,44] of native hardwood forests. We referenced 36.3% sawn wood recovery according to the findings of Gavran, Burns, Hug, Frakes, and Gupta [43] after their extensive survey of sawmills in the region. This specific survey result was also cited by the Australian Biomass for Bioenergy Assessment [42]. Likewise, residues after the first stage of processing of sawn timber were estimated following similar methods.

2.2.4. Biomass and Carbon Estimation of Harvest Volume

After calculation of actual total harvest volume and recovered volume, we estimated the total biomass and carbon associated with that particular harvest. For this purpose, stem density is the key and a sensitive factor as this determines the tree biomass [45]. Therefore, the average density of a commercially matured tree of each species was cited in the earlier studies: Forest Resource Assessment of the Department of Forest Research and Survey (FRA/DFRS) [31], Sharma and Pukkala [35] in the case of Nepal and Maraseni [46] in Queensland. Since the harvested trees were mature (over 30 years of age), the density of Spotted gum in Queensland was taken as 802 kg per m3 [40]. Stump and stem biomass was obtained by multiplying the respective volume by the species density while the ratio of branches and foliage to the stem was adopted to estimate branch biomass and foliage biomass [35,44,46]. Total biomass of stump, stem, branches and foliage made up the total above-ground biomass of the tree. The below-ground biomass was estimated by applying standard international practice [47,48] and earlier studies of each species. This was 25% of the above-ground biomass in the case of Nepal [49] and 26% (0.259 root shoot ratio) in Queensland [46,50] assuming all the harvested trees are mature and healthy. Below-ground biomass was then added to the above-ground biomass to obtain total biomass. Extracted total biomass as well as the biomass left on the forest floor was then calculated based on the volume extracted and left on the forest floor. Mass of the carbon in that biomass was estimated using the standard carbon-biomass fraction of 0.47 as suggested by Intergovernmental Panel on Climate Change (IPCC) [48].

2.2.5. Estimation of Carbon in the Wood Production Chain of Harvested Wood Products (HWPs)

The Paris Agreement on Climate Change in 2016 allows stock and changes of carbon in harvested wood products (HWPs) to be calculated in carbon accounting [51]. Loss of total biomass due to timber harvesting is not considered now as direct carbon loss but is seen as a transfer of carbon from forest stock to the wood products [27]. Therefore, we assessed the changes in carbon stock along the processing chain up to the exit door of the sawmill (also known as primary wood products) using the material flow assessment technique [52]. Extracted volume and biomass from the forest floor and recovery percentage of sawn wood were used as the basis of estimating changes in carbon stock. The estimation method has been discussed above. Key disposal pathways were identified and estimated based on the interview responses of sawmill owners and the studies related to forest residue and carbon storage factors to HWP disposal in landfill [27].

2.2.6. Estimation of Logging Damage and Associated Emissions

Damage to the residual trees and undergrowth during logging operations is one of the key parameters used to judge the implications of selective logging and its sustainability [53,54]. Since our study primarily focuses on the implications of tree harvesting practice on biomass and carbon, we assessed the damage made by each harvested tree to neighbouring trees and undergrowth. The extent of damage was categorised as severe (>66% crown lost, broken bole, uprooted trees and poles and completely smashed and uprooted seedlings and saplings), medium (33%–66% crown lost, >100 cm2 bole bark removed, trees and poles and partially smashed shoots but roots of seedlings/saplings intact) and finally, normal (<33% crown lost, <100 cm2 bark removed, trees and poles pressed/affected during operations but can regrow immediately for seedlings/saplings) [55,56]. We measured DBH and height of the trees and poles of ≥10 cm DBH and their volume and biomass were calculated. For the purpose of our biomass and carbon calculation, severely damaged trees and poles were considered as 100% loss in biomass. For the medium damage category, biomass loss was estimated as 50% whereas normal damages were not considered for biomass calculation. The numbers of seedlings and saplings were counted and averaged to assess the damage to juveniles in each tree harvest in both sites.
To estimate the total logging emissions, we estimated the three different types of emission factors, i.e., extracted log emissions (ELE), emissions due to damaged biomass during the harvesting process (LDF) and emissions due to the infrastructure required for logging, including forest roads, skid trails and logging decks (LIF) as suggested by Pearson et al. [57]. However, we became more specific when estimating extracted log emissions (ELE), and considered changes in the carbon stock and carbon flow along the chain of HWPs rather than considering all the harvested forest biomass as the total carbon loss immediately after harvesting, that is, committed emissions [48,57]. The total emission factor (TEF) in Megagram carbon per cubic meter of harvested volume (Mg C m−3) was calculated as the sum of these three emission factors. Considering the scope of our study, we could not estimate the carbon emissions related to machineries, fuel and energy incurred in the harvesting and processing stage.
Extracted Log Emissions (ELE):
This category covers all emissions related to conversion of a tree into logs and wood products including the ultimate emissions in the wood product utilization chain. With data on the recovery and use of a forest product for a prolonged period, we considered the long-term carbon storage in HWPs after log extraction and then estimated the emissions along the chain [27]. In this process, we deducted the sawn timber recovery from the carbon stock in total extracted logs, assuming that the carbon stocked in those timbers will remain for at least another 46 years as both species are hardwood [46]. Hence, only the carbon stocks in the sawmill residues were considered in the extracted log emissions (ELE) calculation.
Logging Damage Factor (LDF):
The logging damage factor (LDF) represents the total emissions generated at the logging sites due to the accumulation of dead wood from the harvested trees as well as the associated damage to neighbouring vegetation resulting from tree felling [57]. This factor includes carbon in any part of the tree biomass (above-ground and below-ground) left on the forest floor (generally stumps and roots and the top parts of felled trees), tree species killed or severely damaged during harvesting and damage to neighbouring trees during felling activities [58]. This emission is calculated by subtracting the total biomass left on the forest floor and the incidentally damaged biomass from the total biomass of the felled trees.
Logging Infrastructure Factor (LIF):
This category reflects the emissions from the infrastructure built for the purpose of logging and hauling. Emissions from the dead biomass carbon associated with construction of forest roads, skidding trails and logging decks are included in this factor. These emissions are also considered as committed emissions and therefore accounted for in totality at the time of infrastructure development and presented as Mg C m−3 [57]. Since construction of forest roads and decking areas is considered to be deforestation [15], an area equal to deforestation by such infrastructure is multiplied by the average baseline carbon stocks in the sampled sites and is taken as the total emissions. However, for skid trail emissions, we enumerated all the trails, calculated the area (in km2) and then assessed tree mortality along those trails.

3. Results

3.1. Growth Parameters and Estimated Standing Volume

Average DBH and height of the harvested trees in Nepal and Queensland varied in a way that average DBH was higher in Nepal compared to Queensland but average height was higher in the Queensland site compared to the Nepal site. Likewise, the variation in size of the harvested trees was greater in Nepal’s case compared to the Queensland site. However, little difference was found in the average estimated standing volume per tree in the two sites, with 2.64 m3 and 2.34 m3 in Nepal and Queensland, respectively (Table 2).

3.2. Actual Volume and Tree Product Recovery

We found that the average stump height of harvested trees is higher in Nepal than in Queensland. However, the median length of the logs extracted was significantly less (1.85 m) in Nepal compared to the median log size in Queensland which is nearly four times longer (7.2 m). Measurements of every part of the tree after felling and calculation of the volume indicated that stump volume represented 5.5% (0.13 m3 per tree) in Nepal and nearly 3.9% (0.09 m3 per tree) in Queensland. Likewise, log volume in Nepal was 80.2% of total actual volume, significantly more than that of Queensland (52.8%), which affected the volume of the tops and branches. Out of the total volume of felled trees (176.9 m3 in Nepal and 124.5 m3 in Queensland), 94.5% and 52.8% was recovered, leaving 5.5% and 47.1% tree woody volume as forest residues (Table 3). The result showed that in the Nepal site, an average of 0.13 m3 woody volume was left on the forest floor from every tree harvested, whereas in Queensland 1.07 m3 was left per harvested tree.

3.3. Sawn Wood Recovery

The Nepal site recovered 61% of the total log volume input at the sawmill as the sawn wood volume whereas in the Queensland site 36.3% was recovered. Despite the better quality of logs in Queensland (all “A” category), the sawn wood return was less than that of Nepal. As a result, the ratio of odd-sized products including offcuts, woodchips and sawdust was higher in Queensland. More than half (63.7%) of the products were categorised as offcuts, odd-sized products, woodchips, and sawdust residue. In contrast, the site in Nepal produced 39.1% as odd-sized products and sawdust residue, as detailed in Table 4.

3.4. Stock and Recovery of Biomass and Carbon in Product Harvesting

Total (above-ground plus below-ground) biomass of commercially harvested trees (72 in Nepal and 55 in Queensland) was 273.7 and 163.6 tonnes, respectively. Results showed that Nepal extracted 73.3% of the total woody biomass from the forest floor in the form of sawlogs, top heads and branches, whereas Queensland extracted only 32.3% woody biomass in the form of sawlogs. The respective sites left 26.7% and 67.7% of the total biomass in the forest. Nepal left only the foliage, stumps and below-ground biomass in the forest whereas Queensland extracted only the sawlogs and left all other parts on the forest floor (Table 5). Accordingly, harvested sites of Nepal and Queensland extracted 73.3% and 29.4% of the total carbon stock leaving 34.4 tonnes and 52.07 tonnes, respectively.
Results show that Nepal left 0.21 tonnes (0.186 Mg) of carbon per m3 of extracted wood products in the forest while 0.79 tonnes (0.718 Mg) were left in the Queensland harvested site nearly four times higher than in the Nepal site.

3.5. Stock and Flow of Carbon in Log Processing

As stated in Section 3.4, total carbon stock in all the extracted products removed from the forest floor was 94.3 and 24.8 tonnes in Nepal and Queensland, respectively. Despite the higher recovery percentage from total extraction in Nepal, only the sawlogs are forwarded to the sawmill for further processing and the remaining products are sold from the logging yard primarily as fuelwood. Such logs in Nepal comprised only 44.1% of the total carbon while 32.3% was estimated in Queensland logs taken at the sawmill. Considering the carbon stocked in sawlogs as total input, average output of carbon stocked in sawn timber of Nepal was 61% while only 36.3% of the sawn timber was estimated as recovered in Queensland (Table 6).

3.6. Harvesting Damage and Associated Carbon Emissions

3.6.1. Damage to Neighbouring Trees and Undergrowth

In Nepal, a total 364 plants at different stages of growth were damaged during harvesting of 72 mature trees where the dominant species was Sal (Shorea robusta). Results revealed that seedlings were the most damaged category followed by saplings, poles and trees. On average, felling a mature tree damaged 3 to 4 seedlings and one sapling. Likewise, the damage harvest ratio for poles is 1 in 3 harvested whereas for trees it is 1 in 5 harvested (Table 7) in Nepal.
In the case of Queensland, altogether 188 plants at different stages were damaged during harvesting of 55 commercially mature trees of Spotted gum. Similar to Nepal, seedlings were most damaged with an average of 2.05 per harvested tree followed by saplings in harvest damage ratio of 1:1. However, damage to the trees was slightly higher (one damaged in four harvests) than damage to poles. Average damage to trees in the Queensland site was also higher than in Nepal (Table 7). While looking at the average per tree damage in the harvesting process, the site in Nepal shows more damage to neighbouring trees and undergrowth with five plants damaged per tree harvest compared to 3.42 plants in Queensland.

3.6.2. Logging Emissions from Each Site

As noted, we estimated total harvest related emissions taking three factors into account: log extraction, logging damage and logging infrastructure. Results revealed that all the emission factors except the infrastructure factor are higher in Queensland than in Nepal. Queensland has significantly higher (~four times that of Nepal) emissions due to excessive wastage of the tree products in the LDF category. The total emissions factor is almost double (1.099 Mg C m−3) in Queensland compared to Nepal (0.488 Mg C m−3) (Table 8).
In terms of proportionate distribution of total emissions, the Nepal site reflected less variation (within the range of 27.2% LIF to 38.8% LDF) compared to the Queensland site with significant variations from 8.8% in LIF to 71.4% in LDF. Emissions related to extracted products were close to 30% and 20% of the total emission factors in Nepal and Queensland, respectively. More than two thirds of the total emissions (71.4%) in Queensland are related to logging damage and wastage (Table 8). Overall, logging damage-related emissions represent the highest proportion in the two study sites.

4. Discussion

Variations in the range of DBH and the height of harvested trees in Nepal and Queensland could be due to differences in tree felling objectives. In Nepal, tree harvesting is not only for specific purposes such as supplying sawlogs, fencing poles, electricity poles as in Queensland. Since diseased, dying and decayed (3Ds) trees are the first priority in the case of selective logging in Nepal, the size of felled trees varies significantly. Further, fuelwood is important for peoples’ livelihoods and therefore, the big, straight trees are not the only targets. Since trees in Queensland were harvested for sawlogs, harvesters selected the mature, big healthy trees resulting in minimal variations in their dimensions.
Some studies have reported that the quantity of selective logging residue varies widely from one to five times the extracted timber indicating a recovery rate as low as 20% [60]. Although the extent of residue depends on the local conditions, researchers have often estimated a ratio of 1:1, that is, a cubic meter of residue for every cubic meter of extracted logs [61]. Table 9 summarises the findings of such studies.
Our result for Queensland (52.8%) is close to the findings of earlier studies in similar types of production forests in Australia. However, in the case of private native forests of Southeast Queensland (the current study site), Ngugi, Neldner, Ryan, Lewis, Li, Norman, and Mogilski [32] reported sawlog biomass recovery of only 41.4%, relatively lower than our recovery result. The main reason for the relatively higher recovery rate in our study in Queensland could be the selection of the specific species (Spotted gum) for sawlogs. Harvesters have selected the healthiest and straightest trees and left trees with minimum recovery potential untouched.
Some of the key reasons behind the significant difference in the product recovery rate in Nepal (94.5%) and Queensland (52.8%) could be: (i) differences in livelihood dependency on forest resources, (ii) market demand/standards and maturity in the marketing systems, (iii) costs associated with harvesting and processing, and (iv) royalty systems. Since fuelwood is the key source of energy for the majority of the Nepalese population [70,71], utilisation of small stems and the branches supports increased recovery of forest products with negligible wastage on the ground. Likewise, communities use small wood as supporting materials for growing vegetables and other agricultural products on their farm. In contrast, the market and its standards play a dominant role in Queensland. Since the timber market in Queensland is well developed and driven by specific standards, only the commercially saleable logs with particular market requirement (for example: straight bole, round cross section, minimal defects and standard length-minimum of 2.4 m with consecutive differences of 30 cm after that) are harvested [32]. This system is well-tailored to market demand and harvesting operations, exerting a direct impact on recovery rate and product maximization [72]. Moreover, value chain actors are well coordinated and play a key role in policy formulation and in driving practices on the ground [73]. In addition, timber-harvesting operations including transportation, processing and handling costs are much costlier in Queensland than in Nepal. The increased labour cost has been a significant issue influencing the overall timber production chain and recovery. Trees and logs with even minimal defects and minimum deviation in length beyond specific sizes are left on the forest floor because of the costs of handling and transportation. Finally, the royalty system in Queensland is more general and is the same for all hardwoods, not differentiating royalties paid for particular species. However, in Nepal a royalty system is different between species and therefore it has encouraged harvesters to maximize the product volume recovery.
Despite the fact that intensive whole tree harvesting, that is, stem plus harvesting residues, may have long term negative effects on soil fertility, tree growth and ecosystem functioning [74,75], optimisation of forest product recovery and utilization is equally important to incentivize the forest owners from an economic point of view and hence needs balanced strategies. The key concern is that the current amount of residues left in Queensland’s forests is even more than the quantity of biomass required maintaining environmental functioning of the forests. Ngugi, Neldner, Ryan, Lewis, Li, Norman and Mogilski [32] commented that current harvesting practices in Queensland’s native forests have left 22.6% of the additional commercially potential biomass even if we consider retaining 36% of the biomass on the forest floor is necessary for environmental purposes. Our results also support earlier studies [28,32] which found that the current amount of forest product recovery from private native forests in Queensland is lower than the optimum level. At the same time, there are significant opportunities for utilizing small wood products for the purpose of pulp, paper, small sized veneer or other bioenergy purposes. Prospects for utilizing forest residue as a source of biomass and bioenergy are being discussed in Australia, including Queensland [28,32,76], but are yet to materialize in policies and practices.
Extraction of 73.3% of total woody biomass from the forest indicates a greater potential for carbon to be locked in HWPs in the long run in Nepal. However, nearly 15% of the extracted biomass was used as fuelwood, leading to direct carbon loss within a year or two. Even within that scenario, 44.1% of the total estimated carbon in extracted products remains on the logs in Nepal compared to 32.3% in Queensland. Nearly a five times higher amount of carbon mass was left in the forests (per cubic meter of extracted timber volume) of Queensland compared to Nepal implying that the current policies and practices need attention to explore options to optimize utilization of harvested wood products and consideration of their role in carbon mitigation benefits.
Our findings indicate that the difference in sawn-wood recovery between the countries studied might be due to local practices, to different utilisation purposes, as well as to policies and standards. Sawn wood recovery after saw-milling varies with access to and use of sawing technology, the final products to be produced, local practices of using wood products and the quality of species [28,61]. Sawn wood recovery of Queensland’s hardwood species was found to be slightly lower than the national average for Australia of 40.2% [43]. Likewise, compared to the theoretical average sawn wood recovery of 42% to 50% in general [61] and average sawmill recovery rates of 50.8% in developing countries [77], our result in Nepal is slightly higher and in Queensland it is lower. Since the final products of the hardwood sawlogs are used primarily for building construction purposes in both countries, use of the products is guided by building codes and standards. For example, in Nepal, the size and quality of logs are relatively flexible due to the variation in size of wooden frames used in building construction compared to Queensland where building codes and standards are more specific and strict.
Likewise, carbon in harvested products is determined by the amount of residues after round wood log processing in a sawmill. We found that, 61% of the total log carbon in Nepal and 36.3% of the total log carbon in Queensland has the potential to be locked up for another 46 years [40,46]. Carbon stock in sawmill residues is considered to be the complete emissions due to the lack of exact data on the percentage of landfill and short-term uses of those residues. In this scenario, nearly 64% of the log carbon in Queensland and nearly 40% of the log carbon in Nepal will be emitted. However, discussions with sawmill owners and timber users reflect that such residues (mainly the chips and wood dust) are being used for gardens and vegetable farming as well as for animal husbandry.
Damage caused by logging is one of the key determinants of carbon emissions in logging operations and future recovery of harvested sites [78]. The overall logging damage to plant species in our studies was lower (5 and 3.4 plants damaged for each tree harvested in Nepal and Queensland respectively), compared to earlier studies that reported damage to 20 trees in Brazil [79], 11 trees in Gabon [55] and 7 trees in Congo [80]. The highest figure for damage to seedlings and saplings in these sites is associated with a higher level of regeneration in the harvested area. Nepal had an average of 21,649 seedlings and 1662 saplings per ha [31] whereas Queensland Spotted gum-dominated native forests hosted up to 2500 regenerating stems per ha [81]. The larger trees and minimum regeneration supported minimal damage to the undergrowth and neighbouring trees [53], whereas in Nepal, the reverse applied with higher regeneration and wider variance in harvested tree size (28–56 cm in DBH and 8–30 m in height). In addition to the amount of regeneration per ha, the higher rate of per tree damage to seedlings, saplings and poles in Nepal compared to Queensland could be attributed to a number of other factors including topography, harvesting techniques such as reduced impact logging—(RIL), and the skills and knowledge of harvesting operators. Harvesters/labourers in Nepal were relatively less aware of harvesting techniques compared to those in Queensland. Nepalese harvesters were working as seasonal labourers rather professional tree harvesters and were not trained in harvesting operations. In contrast, Queensland’s harvesters were well aware of the techniques of directional felling and damage minimization and had been engaged in the profession for the last 15 years.
Our results relating to total emission factors in Nepal (0.488 Mg C m−3) and Queensland (1.099 Mg C m−3) are lower than those reported for the countries listed below (Table 10). However, Queensland’s total emission factors are higher than those in the Republic of Congo (0.99 Mg C m−3) [57]. If we compare individual emission factors, we should find possible reasons behind the lower total emissions in our study. Extracted log emissions (ELE) and logging infrastructure emissions (LIF) play a critical role in lowering the emissions rate.
All the above studies measured the total extracted biomass as the committed emissions, but we considered the carbon stock contribution of harvested wood products in the long run and therefore the extracted log emissions (ELE) were relatively lower in our study. In addition, compared to the earlier studies that reported 0.24 to 0.98 Mg C m−3 [57], LIF in our case study sites was negligible (0.141 and 0.097 Mg C m−3 in Nepal and Queensland, respectively). This may be attributed to the specific field situation and level of mechanization on our sites. In Nepal, forest harvesting blocks were relatively smaller and were very close to the highway, so did not require many skidding trails or hauling roads. Further, a common logging deck was built and utilized for several harvesting blocks and therefore we shared the proportionate contribution of that deck for our sampled block. More precisely, harvesters used manual labour and small tractors to transport the harvested products with minimal infrastructure required. Likewise, in the case of Queensland, harvesters did not construct a separate harvesting deck as logs were piled on the open land adjacent to the forest on the same property, thus minimizing the LIF related emissions.
Emissions related to unextracted wood and incidental damage (LDF) (0.201 and 0.785 Mg C m−3 in Nepal and Queensland respectively) were relatively lower in the case of Nepal but within the range (0.50 and 1.23 Mg C m−3) of global studies in the case of Queensland. Similar to the findings of other studies [15,18,57], LDF has dominated the proportion of total emissions in both countries (38.8% in Nepal and 71.4% in Queensland). However, the proportion of emissions varies significantly between these two sites. The reason can primarily be attributed to the rate of forest product recovery. Higher amounts of forest residues on the ground in Queensland became the key determinant of this proportion.

Potential Implications on Sustainable Forest Management and REDD+

In line with the second commitment period of the Kyoto Protocol, the Paris Agreement in 2016 allowed accounting of HWPs carbon locked into different products based on the half-life of their end uses [51]. Moreover, scholars have suggested extending the idea of enhancing carbon stock from sustainable forest management activities to maximizing wood product extraction and utilisation [60]. Since the rate of forest product recovery along the wood production chain guides the level of carbon flux from selective logging operations, our findings will positively contribute to the manifestation of forest-based emission reduction initiatives such as REDD+ in Nepal and the emissions reduction fund (ERF) in Australia.
Our study reiterates that there is a huge potential to increase the forest product recovery rate in Queensland that not only contributes to the transfers and stocks of carbon in harvested products but also supports increased income, employment and sustainability of forest-based industries [32]. The harvesting related carbon is context-dependent, including the harvesting regime and the fate of ultimate wood products. Therefore, changes in the existing pattern of HWP recovery and use will have a significant impact on the carbon balance of Queensland’s private native forests. Revision of royalty rates for hardwood species and incentives to utilise small woods and biomass for bioenergy will help to improve the recovery rate in Queensland. Further, offering incentives to the sawmill owners, harvesters and farmers under the activities of the emission reduction fund (ERF) will enhance carbon lock-up in different forms of harvested products. In addition, demonstrations of existing potential through increased recovery and use of the forest residues support a lowering of the risks of forest fire and associated damage at the local level. More importantly, increased wood product recovery has the potential for carbon mitigation by substitution impacts for building materials as well as the production of pulp and paper [27]. For example, using logs as wooden electricity poles helps to reduce greenhouse gas emissions by a further 30% compared to using them as sawlogs [27].
Realizing this potential in policies and practices may also help to replace the importation of pulp and paper primarily from Southeast Asia that is increasingly impacted by increased forest degradation [27] and will eventually support mitigation of emissions on a global scale. Overall, the results of this study imply that increasing the recovery rate and utilizing biomass and bioenergy of wood residue will enhance the outcome of GHG benefits at least in Queensland, Australia.
For Nepal, our results have opened up an avenue for discussions on the trajectory of forest product biomass and carbon along the timber production chain. Primarily, the findings will help to estimate more accurately the actual logging related emissions as well as carbon stock in harvested wood products. These findings will be most relevant in the context where the country is in the process of implementing the Emission Reduction Program Document (ERPD) approved by the World Bank’s Forest Carbon Partnership Facility [83]. Because the sustainable management of community-based forests in the Tarai is the core objective of this document, our study provides a sound basis for identifying monetary and non-monetary carbon benefits to the state and the communities and sets the scene for materializing REDD+ processes. As highlighted in the results, the amount of carbon stocked in harvested wood products and the minimum level of logging emissions in harvesting processes could provide evidence to negotiate for the financial incentives through REDD+ initiatives. These will ultimately support communities who have proven themselves as the real forest stewards in sustainable management of forests. However, further detailed studies with rigorous sampling could help to identify and validate the product recovery and carbon flow in all of the forests of Tarai, especially with the use of the carbon-friendly harvesting techniques the country has had in place for many years.

5. Conclusions

Our study in two countries with different scales of economy and forest dependence but with a similar approach to native forest harvesting, that is, selective logging, indicates that ongoing harvesting practices of natural forests in Queensland are generating higher amounts of harvesting residues with minimum forest product recovery compared to Nepal. In Queensland, there are higher levels of mechanization and specific codes of practices and standards. However, the level of forest-dependence for socio-economic livelihoods, market demand and well-established market systems, together with costs associated with harvesting operations, processing and handling, the generalisation of royalty rates and more importantly, lack of options to utilise small wood products and biomass for bioenergy are factors in minimising the recovery of forest products. Since the existing recovery-rates have significant negative impacts on the timber product supply and carbon benefits, instituting new policies and practices to reverse the situation should be a priority. Revision of royalty rates for hardwood species and incentives to utilise small woods and biomass for bioenergy emission reduction fund (ERF) initiatives to sawmill owners, harvesters and farmers will enhance forest product recovery rates. In this way, they will lock carbon in different forms of harvested products. Although the result was better in both forest recovery and sawn wood recovery (while comparing the global average) in Nepal, the timely harvesting of mature trees and minimal damage to neighbouring plants may help to stock more carbon in harvested forest products as well as in the forest biomass. Detailed study and documentation of the role of current harvesting and utilisation practices could better support Nepal to promote its contribution in stocking carbon in HWPs and carbon-friendly harvesting practices so that the country could benefit from climate mitigation-related incentives such as REDD+.

Author Contributions

B.H.P., conceptualisation and writing; T.N.M., overall guidance and concept framing; G.C., overall guidance and concept framing.

Funding

This research work was supported by Office of the Research Graduate Studies (ORGS) of University of Southern Queensland, Australia as a part of the PhD study of the lead author. Student Research Grant under Hariyo Ban Program funded by USAID and implemented by WWF Nepal provided financial support carry out the field study in Nepal.

Acknowledgments

The authors would like to thank Office of the Research Graduate Studies (ORGS) of University of Southern Queensland and Hariyo Ban Program funded by USAID and implemented by WWF Nepal for their financial support during this study. We highly appreciate the respondents and the field team (Rick Green, Jack Green, Roshan Bhandari and Yubraj Acharya) for their time and support in both the study sites. We are grateful to Barbara Harmes and Susanne Holzknecht for their editorial support and appreciate the constructive comments from editors and reviewers, which helped to improve our manuscript and clarify the message.

Conflicts of Interest

The authors declare that there is no conflict of interest.

References

  1. Triviño, M.; Pohjanmies, T.; Mazziotta, A.; Juutinen, A.; Podkopaev, D.; Le Tortorec, E.; Mönkkönen, M. Optimizing management to enhance multifunctionality in a boreal forest landscape. J. Appl. Ecol. 2017, 54, 61–70. [Google Scholar] [CrossRef]
  2. Sloan, S.; Sayer, J.A. Forest Resources Assessment of 2015 shows positive global trends but forest loss and degradation persist in poor tropical countries. For. Ecol. Manag. 2015, 352, 134–145. [Google Scholar] [CrossRef] [Green Version]
  3. Martin, P.A.; Newton, A.C.; Pfeifer, M.; Khoo, M.; Bullock, J.M. Impacts of tropical selective logging on carbon storage and tree species richness: A meta-analysis. For. Ecol. Manag. 2015, 356, 224–233. [Google Scholar] [CrossRef] [Green Version]
  4. Poudyal, B.H.; Maraseni, T.; Cockfield, G. Evolutionary dynamics of selective logging in the tropics: A systematic review of impact studies and their effectiveness in sustainable forest management. For. Ecol. Manag. 2018, 430, 166–175. [Google Scholar] [CrossRef]
  5. Vidal, E.; West, T.A.; Putz, F.E. Recovery of biomass and merchantable timber volumes twenty years after conventional and reduced-impact logging in Amazonian Brazil. For. Ecol. Manag. 2016, 376, 1–8. [Google Scholar] [CrossRef]
  6. Shearman, P.; Bryan, J.; Laurance, W.F. Are we approaching ‘peak timber’ in the tropics? Biol. Conserv. 2012, 151, 17–21. [Google Scholar] [CrossRef]
  7. Irland, L.C. Timber Productivity Research Gaps for Extensive Forest Management. Small-Scale For. 2011, 10, 389–400. [Google Scholar] [CrossRef] [Green Version]
  8. Pearson, T.R.H.; Brown, S.; Murray, L.; Sidman, G. Greenhouse gas emissions from tropical forest degradation: An underestimated source. Carbon Balance Manag. 2017, 12, 3. [Google Scholar] [CrossRef]
  9. Putz, F.; Sist, P.; Fredericksen, T.; Dykstra, D. Reduced-impact logging: Challenges and opportunities. For. Ecol. Manag. 2008, 256, 1427–1433. [Google Scholar] [CrossRef]
  10. Enache, A.; Kühmaier, M.; Visser, R.; Stampfer, K. Forestry Operations in the European Mountains: A study of current practices and efficiency gaps. Scand. J. For. Res. 2016, 31, 412–427. [Google Scholar] [CrossRef]
  11. Cristan, R.; Aust, W.M.; Bolding, M.C.; Barrett, S.M.; Munsell, J.F.; Schilling, E. Effectiveness of forestry best management practices in the United States: Literature review. For. Ecol. Manag. 2016, 360, 133–151. [Google Scholar] [CrossRef] [Green Version]
  12. Ghaffariyan, M.R.; Acuna, M.; Brown, M. Analysing the effect of five operational factors on forest residue supply chain costs: A case study in Western Australia. Biomass Bioenergy 2013, 59, 486–493. [Google Scholar] [CrossRef]
  13. Norizah, K.; Mohd-Hasmadi, I.; Husna, S.; Chung, W. Log hauling productivity in timber harvesting operation in Peninsular Malaysia Forest. J. Trop. For. Sci. 2016, 28, 207–216. [Google Scholar]
  14. Porter-Bolland, L.; Ellis, E.A.; Guariguata, M.R.; Ruiz-Mallén, I.; Negrete-Yankelevich, S.; Reyes-García, V. Community managed forests and forest protected areas: An assessment of their conservation effectiveness across the tropics. For. Ecol. Manag. 2012, 268, 6–17. [Google Scholar] [CrossRef]
  15. Zalman, J.; Ellis, P.W.; Crabbe, S.; Roopsind, A. Opportunities for carbon emissions reduction from selective logging in Suriname. For. Ecol. Manag. 2019, 439, 9–17. [Google Scholar] [CrossRef]
  16. Roopsind, A.; Caughlin, T.T.; Van Der Hout, P.; Arets, E.; Putz, F.E. Trade-offs between carbon stocks and timber recovery in tropical forests are mediated by logging intensity. Glob. Chang. Biol. 2018, 24, 2862–2874. [Google Scholar] [CrossRef] [PubMed]
  17. Griscom, B.W.; Ellis, P.W.; Burivalova, Z.; Halperin, J.; Marthinus, D.; Runting, R.K.; Ruslandi; Shoch, D.; Putz, F.E. Reduced-impact logging in Borneo to minimize carbon emissions and impacts on sensitive habitats while maintaining timber yields. For. Ecol. Manag. 2019, 438, 176–185. [Google Scholar] [CrossRef]
  18. Ellis, P.W.; Gopalakrishna, T.; Goodman, R.C.; Putz, F.E.; Roopsind, A.; Umunay, P.M.; Zalman, J.; Ellis, E.A.; Mo, K.; Gregoire, T.G.; et al. Reduced-impact logging for climate change mitigation (RIL-C) can halve selective logging emissions from tropical forests. For. Ecol. Manag. 2019, 438, 255–266. [Google Scholar] [CrossRef]
  19. Chowdhary, C.; Conroy, W.; Gritten, D.; Pairojmahakij, R.; Poudyal, B.; Sapkota, L.; Triraganon, R. Integrated climate change adaptation: Towards an emancipatory community forestry-based approach. Int. For. Rev. 2017, 19, 24–40. [Google Scholar] [CrossRef]
  20. Carlson, B.S.; Koerner, S.E.; Medjibe, V.P.; White, L.J.; Poulsen, J.R. Deadwood stocks increase with selective logging and large tree frequency in Gabon. Glob. Chang. Biol. 2017, 23, 1648–1660. [Google Scholar] [CrossRef]
  21. Roopsind, A.; Wortel, V.; Hanoeman, W.; Putz, F.E. Quantifying uncertainty about forest recovery 32-years after selective logging in Suriname. For. Ecol. Manag. 2017, 391, 246–255. [Google Scholar] [CrossRef]
  22. Asner, G.P.; Pan, Y.; Knorr, W.; Durst, P.B.; Ma, H.O.; Abe, I.; Koh, L.P.; Putz, F.E.; Sasaki, N.; Lowe, A.J. Sustainable Management of Tropical Forests Can Reduce Carbon Emissions and Stabilize Timber Production. Front. Environ. Sci. 2016, 4, 354. [Google Scholar]
  23. Applegate, G.; Putz, F.E.; Snook, L.K. Who Pays for and Who Benefits from Improved Timber Harvesting Practices in the Tropics? Lessons Learned and Information Gaps; CIFOR: Bogor, Indonesia, 2004; ISBN 9793361425. [Google Scholar]
  24. Woldendorp, G.; Keenan, R.J. Coarse woody debris in Australian forest ecosystems: A review. Austral Ecol. 2005, 30, 834–843. [Google Scholar] [CrossRef]
  25. Raison, R.; Squire, R. Forest Management in Australia: Implications for Carbon Budgets; Department of Climage Change: Canberra, Australia, 2008. [Google Scholar]
  26. Davey, S.; Dunn, G. Australian Native Forest Commerciality; Australian Bureau of Agricultural and Resource Economics and Sciences: Canberra, Australia, 2014. [Google Scholar]
  27. Ximenes, F.; Bi, H.; Cameron, N.; Coburn, R.; Maclean, M.; Matthew, D.S.; Roxburgh, S.; Ryan, M.; Williams, J.; Ken, B. Carbon Stocks and Flows in Native Forests and Harvested Wood Products in SE Australia; PNC285-1112; Forest and Wood Products Australia Limited: Melbourne, Australia, 2016; p. 198. [Google Scholar]
  28. Lock, P.; Whittle, L. Future Opportunities for Using Forest and Sawmill Residues in Australia; Australian Bureau of Agricultural and Resource Economics and Sciences (ABARES): Canberra, Australia, 2018. [Google Scholar]
  29. Kile, G.; Nambiar, E.; Brown, A. The rise and fall of research and development for the forest industry in Australia. Aust. For. 2014, 77, 142–152. [Google Scholar] [CrossRef]
  30. Banjade, M.R. Discourse and discursive practices over timber in Nepal. J. For. Livelihood 2012, 10, 58–73. [Google Scholar] [CrossRef]
  31. Ngugi, M.R.; Neldner, V.J.; Ryan, S.; Lewis, T.; Li, J.; Norman, P.; Mogilski, M. Estimating potential harvestable biomass for bioenergy from sustainably managed private native forests in Southeast Queensland, Australia. For. Ecosyst. 2018, 5, 6. [Google Scholar] [CrossRef]
  32. Department of Forest Research and Survey. Terai Forests of Nepal (2010–2012); Forest Resource Assessment Nepal Project; Department of Forest Research and Survey: Babarmahal, Kathmandu, 2014. [Google Scholar]
  33. Picard, N.; Saint-André, L.; Henry, M. Manual for Building Tree Volume and Biomass Allometric Equations: From Field Measurement to Prediction; Food and Agricultural Organization of the United Nations, Rome, and Centre de Coopération Internationale en Recherche Agronomique pour le Développement, Montpellier: Rome, Italy, 2012; p. 215. [Google Scholar]
  34. Walker, S.M.; Pearson, T.R.H.; Casarim, F.M.; Harris, N.; Petrova, S.; Grais, A.; Swails, E.; Netzer, M.; Goslee, K.M.; Brown, S. Standard Operating Procedures for Terrestrial Carbon Measurement; Winrock International: Morrilton, AR, USA, 2012. [Google Scholar]
  35. Sharma, E.; Pukkala, T. Volume and Biomass Prediction Equations of Forest Trees of Nepal; Forest Survey and Statistical Division, Ministry of Forest and Soil Conservation: Kathmandu, Nepal, 1990. [Google Scholar]
  36. Shrestha, H.; Kafle, M.; Khanal, K.; Mandal, R. Developing local volume tables for three important tree species in Nawalparasi and Kapilvastu districts. Banko Janakari 2018, 27, 84–91. [Google Scholar] [CrossRef]
  37. Vanclay, J.; Henry, N.; McCormack, B.; Preston, R. Report of the Native Forest Resources Task Force; Queensland Department of Forestry: Brisbane, Australia, 1987. [Google Scholar]
  38. Li, C.; Barclay, H.; Hans, H.; Sidders, D. Estimation of Log Volumes: A Comparative Study; Natural Resources Canada, Canadian Forest Service, Canadian Wood Fibre Centre: Edmonton, AB, Canada, 2015. [Google Scholar]
  39. Mayaka, T.B.; Eba’A-Atyi, R.; Nkie, M.-C. On volume recovery index and implications for sustainable logging in Congo Basin. For. Ecol. Manag. 2014, 313, 292–299. [Google Scholar] [CrossRef]
  40. Maraseni, T.N.; Cockfield, G. Crops, cows or timber? Including carbon values in land use choices. Agric. Ecosyst. Environ. 2011, 140, 280–288. [Google Scholar] [CrossRef]
  41. Ximenes, F.A.; Gardner, W.D.; Marchant, J.F. Carbon Flow Following the Harvest of Blackbutt Trees and Their Conversion into Sawn Products. In Research Paper—State Forests of New South Wales; State Forests of New South Wales, Research and Development Division: West Pennant Hills, Australia, 2005; p. v, 38. [Google Scholar]
  42. QG. Queensland Technical Methods-Forestry; Australian Renewable Energy Agency (ARENA), Queensland Government: Brisbane, Australia, 2018. [Google Scholar]
  43. Gavran, M.; Burns, K.; Hug, B.; Frakes, I.; Gupta, M. ABARES National Wood Processing Survey 2012-13; ABARES Research Report; Australian Bureau of Agricultural and Resource Economics and Sciences: Canberra, Australia, 2014. [Google Scholar]
  44. Ximenes, F.A.; Gardner, W.D.; Richards, G.P. Total above-ground biomass and biomass in commercial logs following the harvest of spotted gum (Corymbia maculata) forests of SE NSW. Aust. For. 2006, 69, 213–222. [Google Scholar] [CrossRef]
  45. Polglase, P.; Snowdon, P.; Theiveyanathan, T.; Paul, K.; Raison, R.; Grove, T.; Rance, S. Calibration of the FullCAM Model to Eucalyptus Globulus and Pinus Radiata and Uncertainty Analysis; National Carbon Accounting System Technical Report; Australian Government: Canberra, Australia, 2004.
  46. Maraseni, T. Re-Evaluating Land Use Choices to Incorporate Carbon Values: A Case Study in the South Burnett Region of Queensland, Australia; University of Southern Queensland: Darling Heights, Australia, 2007. [Google Scholar]
  47. Eggleston, H.; Buendia, L.; Miwa, K.; Ngara, T.; Tanabe, K. IPCC Guidelines for National Greenhouse Gas Inventories; Institute for Global Environmental Strategies: Hayama, Japan, 2006. [Google Scholar]
  48. IPCC. 2013 Revised Supplementary Methods and Good Practice Guidance Arising from the Kyoto Protocol; The Intergovernmental Panel on Climate Change (IPCC): Geneva, Switzerland, 2014. [Google Scholar]
  49. Pandey, S.S.; Maraseni, T.N.; Cockfield, G. Carbon stock dynamics in different vegetation dominated community forests under REDD+: A case from Nepal. For. Ecol. Manag. 2014, 327, 40–47. [Google Scholar] [CrossRef]
  50. Maraseni, T.; Mitchell, C. An assessment of carbon sequestration potential of riparian zone of Condamine Catchment, Queensland, Australia. Land Use Policy 2016, 54, 139–146. [Google Scholar] [CrossRef]
  51. Krug, J.H. Accounting of GHG emissions and removals from forest management: A long road from Kyoto to Paris. Carbon Balance Manag. 2018, 13, 1. [Google Scholar] [CrossRef] [PubMed]
  52. Jasinevičius, G.; Lindner, M.; Cienciala, E.; Tykkyläinen, M. Carbon Accounting in Harvested Wood Products: Assessment Using Material Flow Analysis Resulting in Larger Pools Compared to the IPCC Default Method. J. Ind. Ecol. 2017, 22, 121–131. [Google Scholar] [CrossRef]
  53. Picard, N.; Gourlet-Fleury, S.; Forni, É. Estimating damage from selective logging and implications for tropical forest management. Can. J. For. Res. 2012, 42, 605–613. [Google Scholar] [CrossRef]
  54. Khai, T.C.; Mizoue, N.; Kajisa, T.; Ota, T.; Yoshida, S. Using a tree-based approach to evaluate logging damage in a tropical mixed deciduous forest of Myanmar: Comparison with cases in Cambodia. J. For. Res. 2017, 22, 185–190. [Google Scholar] [CrossRef]
  55. Medjibe, V.P.; Putz, F.E.; Starkey, M.P.; Ndouna, A.A.; Memiaghe, H.R. Impacts of selective logging on above-ground forest biomass in the Monts de Cristal in Gabon. For. Ecol. Manag. 2011, 262, 1799–1806. [Google Scholar] [CrossRef]
  56. Sist, P.; Nguyen-Thé, N. Logging damage and the subsequent dynamics of a dipterocarp forest in East Kalimantan (1990–1996). For. Ecol. Manag. 2002, 165, 85–103. [Google Scholar] [CrossRef]
  57. Pearson, T.R.H.; Brown, S.; Casarim, F.M. Carbon emissions from tropical forest degradation caused by logging. Environ. Res. Lett. 2014, 9, 034017. [Google Scholar] [CrossRef] [Green Version]
  58. Umunay, P.M.; Gregoire, T.G.; Gopalakrishna, T.; Ellis, P.W.; Putz, F.E. Selective logging emissions and potential emission reductions from reduced-impact logging in the Congo Basin. For. Ecol. Manag. 2019, 437, 360–371. [Google Scholar] [CrossRef]
  59. Pandey, S.S.; Cockfield, G.; Maraseni, T.N. Dynamics of carbon and biodiversity under REDD+ regime: A case from Nepal. Environ. Sci. Policy 2014, 38, 272–281. [Google Scholar] [CrossRef]
  60. Butarbutar, T.; Köhl, M.; Neupane, P.R. Harvested wood products and REDD+: Looking beyond the forest border. Carbon Balance Manag. 2016, 11, 4. [Google Scholar] [CrossRef] [PubMed]
  61. Koopmans, A.; Koppejan, J. Agricultural and forest residues-generation, utilization and availability. In Proceedings of the Regional Consultation on Modern Applications of Biomass Energy, Kuala Lumpur, Malaysia, 6–10 January 1997; Volume 6, p. 10. [Google Scholar]
  62. Dykstra, D.P.; Heinrich, R. Sustaining tropical forests through environmentally sound harvesting practices. Unasylva 1992, 43, 9–15. [Google Scholar]
  63. Numazawa, C.T.; Numazawa, S.; Pacca, S.; John, V.M. Logging residues and CO2 of Brazilian Amazon timber: Two case studies of forest harvesting. Resour. Conserv. Recycl. 2017, 122, 280–285. [Google Scholar] [CrossRef]
  64. Brown, S.; Casarim, F.; Grimland, S.; Pearson, T. Carbon Impacts from Selective Logging of Forests in Berau, East Kalimantan, Indonesia; Final Report to the Nature Conservancy; Winrock International: Arlington, VA, USA, 2011. [Google Scholar]
  65. Noack, D. Making better use of tropical timber resources. Tropl. For. Update 1995, 5, 12–13. [Google Scholar]
  66. Eshun, A.A. Logging Residue from the Tropical High Forests in the Western Region of Ghana. Ph.D. Thesis, University of Ghana, Accra, Ghana, 2000. [Google Scholar]
  67. Lasco, R.D.; MacDicken, K.G.; Pulhin, F.B.; Guillermo, I.Q.; Sales, R.F.; Cruz, R.V.O. Carbon stocks assessment of a selectively logged dipterocarp forest and wood processing mill in the Philippines. J. Trop. For. Sci. 2006, 18, 212–221. [Google Scholar]
  68. Ximenes, F.A.; Gardner, W.D.; Kathuria, A. Proportion of above-ground biomass in commercial logs and residues following the harvest of five commercial forest species in Australia. For. Ecol. Manag. 2008, 256, 335–346. [Google Scholar] [CrossRef]
  69. Meilby, H.; Smith-Hall, C.; Byg, A.; Larsen, H.O.; Nielsen, Ø.J.; Puri, L.; Rayamajhi, S. Are Forest Incomes Sustainable? Firewood and Timber Extraction and Productivity in Community Managed Forests in Nepal. World Dev. 2014, 64, S113–S124. [Google Scholar] [CrossRef]
  70. Christensen, M.; Rayamajhi, S.; Meilby, H. Balancing fuelwood and biodiversity concerns in rural Nepal. Ecol. Model. 2009, 220, 522–532. [Google Scholar] [CrossRef]
  71. Pokharel, S. An econometric analysis of energy consumption in Nepal. Energy Policy 2007, 35, 350–361. [Google Scholar] [CrossRef]
  72. Maraseni, T.; Cockfield, G.; Apan, A. Estimation of taper rates and volume of smaller-sized logs in spotted gum saw timber plantations in Southeast Queensland, Australia. South. For. 2007, 69, 169–173. [Google Scholar] [CrossRef]
  73. Montreal Process Implementation Group for Australia and National Forest Inventory Steering Committee. Australia’s State of the Forests Report 2018; Australian Bureau of Agricultural and Resource Economics and Sciences (ABARES): Canberra, Australia, 2018. [Google Scholar]
  74. Achat, D.; Deleuze, C.; Landmann, G.; Pousse, N.; Ranger, J.; Augusto, L. Quantifying consequences of removing harvesting residues on forest soils and tree growth—A meta-analysis. For. Ecol. Manag. 2015, 348, 124–141. [Google Scholar] [CrossRef]
  75. James, J.; Harrison, R. The Effect of Harvest on Forest Soil Carbon: A Meta-Analysis. Forests 2016, 7, 308. [Google Scholar] [CrossRef]
  76. Queensland Government. Queensland Biofutures: 10 Year Roadmap and Action Plan; Department of State Development, Manufacturing, Infrastructure and Planning, Queensland Government: Brisbane, Australia, 2016.
  77. Enters, T. Trash or Treasure? Logging and Mill Residues in Asia and the Pacific; FAO RAP Publication; Food and Agriculture Organisation of the United Nations: Bangkok, Thailand, 2001. [Google Scholar]
  78. Putz, F.E.; Zuidema, P.A.; Synnott, T.; Peña-Claros, M.; Pinard, M.A.; Sheil, D.; Vanclay, J.K.; Sist, P.; Gourlet-Fleury, S.; Griscom, B. Sustaining conservation values in selectively logged tropical forests: The attained and the attainable. Conserv. Lett. 2012, 5, 296–303. [Google Scholar] [CrossRef]
  79. Johns, J.S.; Barreto, P.; Uhl, C. Logging damage during planned and unplanned logging operations in the eastern Amazon. For. Ecol. Manag. 1996, 89, 59–77. [Google Scholar] [CrossRef]
  80. Brown, S.; Pearson, T.; Moore, N.; Parveen, A.; Ambagis, S.; Shoch, D. Impact of Selective Logging on the Carbon Stocks of Tropical Forests: Republic of Congo as a Case Study; Winrock International: Arlington, VA, USA, 2005; p. 21. [Google Scholar]
  81. Lewis, T.; Osborne, D.; Hogg, B.; Swift, S.; Ryan, S.; Taylor, D.; Macgregor-Skinner, J. Tree Growth Relationships and Silvicultural Tools to Assist Stand Management in Private Native Spotted Gum Dominant Forests in Queensland and Northern New South Wales; Forest & Wood Products Australia: Victoria, Australia, 2010. [Google Scholar]
  82. Goodman, R.C.; Aramburu, M.H.; Gopalakrishna, T.; Putz, F.E.; Gutiérrez, N.; Alvarez, J.L.M.; Aguilar-Amuchastegui, N.; Ellis, P.W. Carbon emissions and potential emissions reductions from low-intensity selective logging in southwestern Amazonia. For. Ecol. Manag. 2019, 439, 18–27. [Google Scholar] [CrossRef]
  83. Cadman, C.; Maraseni, T.N.; Ok-Ma, H.; Lopez-Casero, F. Five years of REDD+ governance: The use of market mechanisms as a response to anthropogenic climate change. For. Policy Econ. 2017, 79, 8–16. [Google Scholar] [CrossRef]
Figure 1. Study sites.
Forests 10 00693 g001
Table 1. Actual wood product recovery of Tarai Sal from a company-owned sawmill in Nepal.
SampleLog Input of Different Grades (m3)Average Sawn Timber Output (m3) *Sawn Timber Recovery PercentageBark and Edges (kg)Odd-Sized Product (kg)Sawdust (kg)
ABCTotal
Week 17.55.61417.1110.9666441727081189
Week 26.46.24.316.910.566239486251209.5
Week 36.58.95.520.912.7461440610671517
Week 46.211.258.325.7515.0358600815051640
Week 55.19.33.818.211.186138226001435
Week 63.57.93.114.58.78603068993984
Total35.2 (31%)49.16 (43.3%)29 (25.5%)113.3669.2566125,42454987974.5
Biomass99756.8 kg60945.28 kg61%25.49%5.51%7.99%
* Average sawn timber output was calculated considering 80%, 60 % and 40% recovery rate of A, B and C grades, respectively (Source: field survey April–May 2018).
Table 2. Measured growth variables and standing volume of study sites.
SiteDBH (cm) *Height (m) **Total Estimated Standing Volume (m3) (Over Bark Up to 10 cm Top Dia *** meter) Per Tree Estimated Standing Volume (m3)
MeanMinMaxStd. DevStd. Er (SE)MeanMinMaxStd. DevStd. Er (SE)
Nepal (N = 72)56.828.6105.119.42.220.78.430.35.10.6190.72.64
Queensland (N = 55)50.135.566.28.11.0924.319.232.42.90.4128.2.34
* DBH = Diameter at Breast Height (DBH) of a standing tree in cm measured over bark taken at the height of 1.3 m from the ground. ** Height = Total height of the standing tree in meter (m). *** Total overbark volume of the standing tree in m3 using the volume equation Exp (a + b × ln(DBH) + c × ln(H))/1000 [35] in the case of Nepal and two-way hardwood volume equation of Spotted gum [37] V = (0.1 58 43 + 0.62113 × H − 0.00 62 485 × H2) × (B A − 0.00929) for Southeast Queensland. Both studies provide volume up to 10 cm top diameter of the stem.
Table 3. Actual volume of the trees after felling and tree recovery percentage at each site.
SiteAverage Stump Height 1 (cm)Average Log LengthActual Volume (m3) after Felling (Numbers in Parentheses Represent the Percentage of Total Tree Volume)
Total Stump Volume 2 (m3)Total log Volume 3 (m3)Tops and Branch Volume 4 (m3)Total Volume of Felled Trees 5 (m3)Extracted Volume 6 (m3)Left over Volume (m3)
Nepal (N = 72)43.31.99.7 (5.5)141.9 (80.2)25.3 (14.3)176.9167.2 (94.5)9.7 (5.5)
Queensland (N = 55)40.16.94.9 (3.9)65.8 (52.8)53.7 (43.1)124.565.8 (52.8)58.6 (47.1)
Per treeNepal0.131.970.352.462.320.13
Queensland0.090.910.982.261.201.07
1 Height of the stump left on the ground after felling measured from its base. 2 Volume of the stump calculated based on the mid diameter of the stump (Over Bark) and total stump height π × (D2) × H/4 (D = Stump Diameter in cm, H = Stump Height in cm), and divided by 1,000,000 to convert into cubic meters. 3 Total log volume = Total volume of all logs (Over Bark) in cubic meter sectioned in different lengths as per the market requirement and local practice and calculated using Newton’s formula V = S1 + 4Sm + S2/6 × Log length where S1 = Cross sectional area of large end section, Sm = Cross sectional area of midsection and S2 = Cross sectional area of small end section). 4 Tops and Branch Volume = Volume of the remaining section of the felled tree after log separation measured to 10 cm of stem diameter (Over bark). 5 Total volume = Measured total merchantable volume of the harvested trees (Stump volume + log volume + Tops and Branches Volume) up to 10 cm top stem diameter. 6 Extracted total volume that includes all harvested products including tops and branches.
Table 4. Sawn wood recovery from the extracted logs in Nepal and Queensland sites.
SiteExtracted Log Volume (m3) (OB)Log Input of Different Grades (m3) *Average Sawn Timber Output (m3)Side Cuts/Odd Sized Products/Wood Chips/Sawdust (kg)
ABC
Nepal (N = 72)141.943.961.436.386.6 (61%)47,248.3 (39.1%)
Queensland (N = 55)65.83All As23.89 (36.3%) **33,630.8 (63.7%)
* Log inputs of A, B and C graded logs and output percentage in Nepal is estimated based on the proportion of the log input history of Sal-dominated Tarai hardwood species extracted from similar locations by sawmills operating in sites that are similar in terms of machinery, tools, techniques and level of expertise (as explained in the methodology section above). ** Average recovery of sawn timber in Queensland is based on earlier studies and surveys related to availability of forest processing residues from the eucalyptus hardwood species in general and Spotted gum in particular, from sawmills operating in South east Queensland [28,43]. These reports cited that sawn timber output of logs (70%–80% from Spotted gum species) is 36.3%, sawdust in the hardwood sawmills ranging from 11%–14% (sometimes 16%–25% including fine particles of wood residue) and the remainder as woodchips, hearts, offcuts and other fines. Therefore, for our analysis, we considered the minimum percentage (11%) in the case of sawdust.
Table 5. Total stock, extracted and left biomass and carbon in Nepal and old sites.
SiteBiomassCarbonCarbon (ton) Per m3 of Harvest Volume
Total Biomass (Above Ground + Below Ground) in Harvested Trees (tonnes) *Extracted (tonnes) **Left on the Forest Floor (tonnes) ***Total Carbon Stock (tonnes) ****Carbon in Extracted Products (tonnes)Carbon in Left Tree Parts (tonnes)Extracted (tonnes)Left Carbon (tonnes)
Nepal (N = 72)273.7200.6 (73.3%)73.1 (26.7%)128.694.3 (73.3%)34.4 (26.7%)0.560.21
Queensland (N = 55)163.652.8 (32.3%)126.9 (67.7%)76.924.8 (32.3%)52.07 (67.7%)0.380.79
* Total biomass of harvested trees including below-ground biomass. In both cases, the above-ground biomass is calculated as the product of above ground stem volume and base density of harvested tree species and then adding crown biomass using the proportion suggested by earlier studies [31,35] for Nepal and [44] for Queensland. Below-ground biomass is estimated as 25% of the stem biomass considering 0.25 root shoot ratio [59] for Nepal whereas it is taken as 0.26 for the Spotted gum in Queensland [46]. ** Total biomass removed from the forest floor after tree harvest (logs, top heads and branches in Nepal and logs only in Queensland). *** Total biomass left on the forest floor after tree harvest (Stumps, roots and foliage in Nepal and Stumps, roots, top heads, branches and foliage in Queensland). **** Total carbon stock is calculated by multiplying the total (both above-ground and below-ground) biomass by the carbon fraction 0.47.
Table 6. Flow of carbon in processing stage at sawmill in Nepal and Queensland sites.
SiteTotal Carbon in Extracted Products (tonnes)Carbon Stock in Logs Taken to the Sawmills (tonnes)Carbon Stock in Sawn Timber (tonnes)Carbon Stock in Side Cuts /Odd Sized Products/Wood Chips and Sawdust (tonnes)
Nepal (N = 72)94.3 (73.3%)56.8 (44.1%)34.7 (61%)22.3 (39.1%)
Queensland (N = 55)24.8 (32.3%)24.8 (32.3%)9.0 (36.3%)15.77 (63.7%)
Table 7. Harvesting damage to surrounding tree species in Nepal and Queensland.
Damage TypeSeedlings (Height < 1 m)Saplings (DBH a < 10 cm)Poles (10–20 cm DBH)Trees (>20 cm DBH)TotalAverage
NEP bQLD cNEPQLDNEPQLDNEPQLDNEPQLDNEPQLD
Severe1406843421010581981282.752.33
Medium3817122704261210.840.38
Normal69282366263104391.440.71
Total2471137850241215133641885.053.42
Average damage per harvested tree3.432.051.080.910.330.220.210.24
a: DBH—Diameter at Breast Height, b: NEP—Nepal, c: QLD—Queensland.
Table 8. Total emissions factor in Mg C per m3 of harvested volume.
SiteExtracted Log Emissions (ELE) *Logging Damage Factor (LDF) **Logging Infrastructure Factor (LIF) ***Total Emissions Factor (TEF) ****
Nepal (N = 72)0.176 (33.9%)0.201 (38.8%)0.141 (27.2%)0.488
Queensland (N = 55)0.217 (19.7%)0.785 (71.4%)0.097 (8.8%)1.099
* Extracted log emissions represent all emissions related to the extraction of forest products and conversion of logs into sawn timber/products. We calculated ELE as the sum of carbon stock in wastage/residue after sawn timber recovery and differences between total extracted products and sawlog input in sawmills, assuming that these products are used as fuelwood within a short time. ** LDF is the total dead biomass carbon left on the forest floor plus biomass carbon lost from the incidental damage to poles and trees with DBH ≥ 10 cm damaged severely (assuming 100% loss) and medium damage (assuming 50% carbon loss). *** LIF is the sum of three key components (forest road factor, skid trail factor and decking factor) calculated based on the area of damage due to the infrastructure and assuming the total carbon stock of that area if that was fully stocked based on the secondary sources. **** TIF is the total sum of all three components i.e., ELE, LDF and LIF.
Table 9. Forest product recovery rate reported by earlier studies.
Region/CountryForest product recovery rateHarvesting residueReported by
Asia50%1 m3 of residue in 1 m3 harvest (1:1)[61]
Asia–Pacific46%54%[62]
Latin America and the Caribbean56%44%[62]
Africa54%46%[62]
Tropical region (average)50%50%[62]
Brazilian Amazon34%1:2 (commercial stem: harvest residue)[63]
Kalimantan Indonesia48%52%[64]
Sarawak Malaysia54%46%[65]
Ghana70%30%[66]
Gabon75%25%[20]
The Philippines40%60%[67]
Queensland Australia (Spotted gum)41.4%58.6%[32]
NSW, Australia (Spotted gum) 57%43%[68]
Queensland, Australia (Black-butt)48%52%[27]
Queensland Spotted gum52.8%47.2%This Study
Nepal73.5% to 99%-[69]
Nepal, Tarai Sal-dominated forest94.5%5.5%This study
Table 10. Total Logging emissions from different countries.
Other StudiesThis Study
Peruvian AmazonIndonesiaGuyanaMexicoSurinameQueenslandNepal
Total Logging Emission1.55 Mg C m−31.49 Mg C m−32.33 Mg C m−31.52 Mg C m−32.44 Mg C m−31.099 Mg C m−30.488 Mg C m−3
Reported by[82][57][57][18][15]

