Article

A Weighted Mean Value Analysis to Identify Biological Pathway Activity Changes during Poplar Seed Germination

1
State Key Laboratory of Tree Genetics and Breeding (Northeast Forestry University), School of Forestry, Northeast Forestry University, Harbin 150040, China
2
School of Forestry, Northeast Forestry University, Harbin 150040, China
3
College of Life Science, Northeast Forestry University, Harbin 150040, China
*
Author to whom correspondence should be addressed.
Forests 2019, 10(8), 664; https://doi.org/10.3390/f10080664
Submission received: 17 June 2019 / Revised: 30 July 2019 / Accepted: 5 August 2019 / Published: 7 August 2019
(This article belongs to the Special Issue Forest Genetics and Tree Improvement)

Abstract

:
Poplar (Populus × xiaohei T. S. Hwang et Liang) is an excellent model plant, with a known genome sequence, for studying woody plant developmental processes, such as seed germination. Here, we report the transcriptional profiling of poplar seeds at five germination stages using RNA-Seq technology. We focused on identifying biological pathway activity changes during seed germination and transcription factors that play important roles in different stages. Among the 16 significantly changing clusters obtained using the STEM method, transcription was significantly enriched in five different clusters, 8, 21, 25, 27, and 35. The oxidative phosphorylation-related genes were only enriched in cluster 9, and expression patterns decreased in 6 and 24 HAI, while ubiquitin-dependent protein catabolic processes were only enriched in cluster 16, and expression patterns increased in 6 HAI. A weighted mean method analysis determined that most primary metabolism-associated categories, such as major carbohydrate metabolism, glycolysis, oxidative pentose phosphate, tricarboxylic acid cycle, lipid metabolism, nucleotide metabolism, amino acid metabolism, and protein metabolism, were elevated between 6 and 48 h after imbibition (HAI). ATP synthesis and C1 metabolism had highly active expression patterns between 0.75 and 48 HAI. The photosynthesis category-associated genes that were identified appeared highly active at 144 HAI. The homogenization of transcription factors in each cluster revealed that the HAP2, C3H zinc finger family, and C2C2(Zn) GATA transcription factors were present in relatively high numbers in cluster 8, while HAP5, Zn-finger (CCHC), FHA, and E2F/DP transcription factor families, as well as SNF7, were present in high numbers in cluster 25. Thus, we identified a series of biological pathway activity changes that occur, and transcription factors that are active, during poplar seed germination. Moreover, this study provides an integrated view of transcriptional regulation that can reveal the molecular events occurring during seed germination.

1. Introduction

Most flowering plants reproduce by seed germination. Seed germination is a crucial phase in the life cycle of higher plants because it disseminates the genetic information necessary for the next generation of plants to disperse, establish, develop and eventually reproduce to maintain the species [1,2,3]. Seed germination is a very complicated process, involving a series of molecular, physiological, and morphological changes during different periods. Seed germination starts with imbibition, when the seed takes in water from the soil [4]. On the basis of the fresh weight pattern during seed germination, the germination process is divided into three periods: Phase I, involving a rapid imbibition of water until all the matrices and cell contents are fully hydrated; phase II, a period of limited water uptake [5]; and phase III, involving an increasing water uptake accompanied by embryo axis elongation and the breakthrough of the covering layers to complete germination (visible germination) [4,5,6,7]. Afterwards, seeds enter a period of post-germination until the expansion of the first true leaf.
In recent years, seed germination has been studied extensively in a variety of plants, such as Arabidopsis thaliana, rice and soybean. Girke et al. (2000) [8] studied the Arabidopsis seed germination process and found approximately 2600 seed-specifically expressed genes. Howell et al. (2009) [9] found that over 2000 transcripts displayed unique, low-level expression patterns in dry seeds and had expression peaks at 1 or 3 h after imbibition (HAI). Le et al. (2010) [10] identified 289 seed-specific genes and 48 seed-specific transcription factor (TF) genes. These genes were activated at different developmental stages, implying potential roles in controlling germination-related stage-specific biological events. In broccoli (Brassica oleracea L. var. italica Planch.) seed germination, Gao et al. (2014) [11] identified 25 putative glucosinolate metabolism-related genes, which shared 62.04%–89.72% nucleotide sequence identity with the Arabidopsis orthologs. In particular, the expression level of myrosinase TGG2 after germination was 20–130 times greater than in dry seeds. However, there are relatively few studies on the seed germination of woody plants, for example, poplar. Zhang et al. (2015) [12] revealed, using proteomics, that the germination process of poplar seeds was significantly correlated with energy dependence, protein synthesis and degradation, and cell defense- and rescue-related pathways. Qu et al. (2019) [13] revealed patterns of changes in transcription and metabolism during the germination of poplar seeds and identified some genes that are closely related to primary metabolic changes through a targeted network correlation analysis. Zhang et al. (2019) [14] performed an integrative transcriptome analysis of three seed germination phases from P. euphratica and P. pruinosa and identified the specifically expressed genes in each phase, moreover, they found that the flavonoid and brassinosteroid pathways were significantly enriched under salinity stresses. There are no reports on TFs and active biological processes that play key roles in the germination of poplar seeds.
Poplar (Poplar simonii × Poplar nigra) is an excellent woody plant for studies on important developmental processes because it has a clear genomic sequences and is also a model tree species of woody plants. In this study, a second-generation digital gene expression profiling technology was used to study gene expression patterns in poplar seeds on a genome-wide level. The aims of the present study were to identify biological pathway activity changes during seed germination and to identify TFs that play an important role during different periods. Moreover, this study provides an integrated view of transcriptional regulation that can reveal the molecular events occurring during seed germination.

2. Materials and Methods

2.1. Experimental Conditions, Data Collection and Analysis

RNA-Seq raw data were previously collected and stored at the State Key Laboratory of Tree Genetics and Breeding (Northeast Forestry University). For experimental conditions, data quality, and other details refer to Qu et al. (2019) [13]. After sequencing, raw data were filtered to remove adaptor contamination and low quality reads. All clean reads were then mapped to the poplar genome downloaded from the phytozome website (https://phytozome.jgi.doe.gov/pz/portal.html) using the BWA-MEM alignment algorithm with default parameters [15]. The mapped reads of each gene model were extracted using SAMtools modules [16]. The differentially expressed genes (DEGs) were identified using edgeR with a false discovery rate threshold of less than 0.05 [17]. The gene expression levels were normalized using the trimmed mean of M-values method [18].

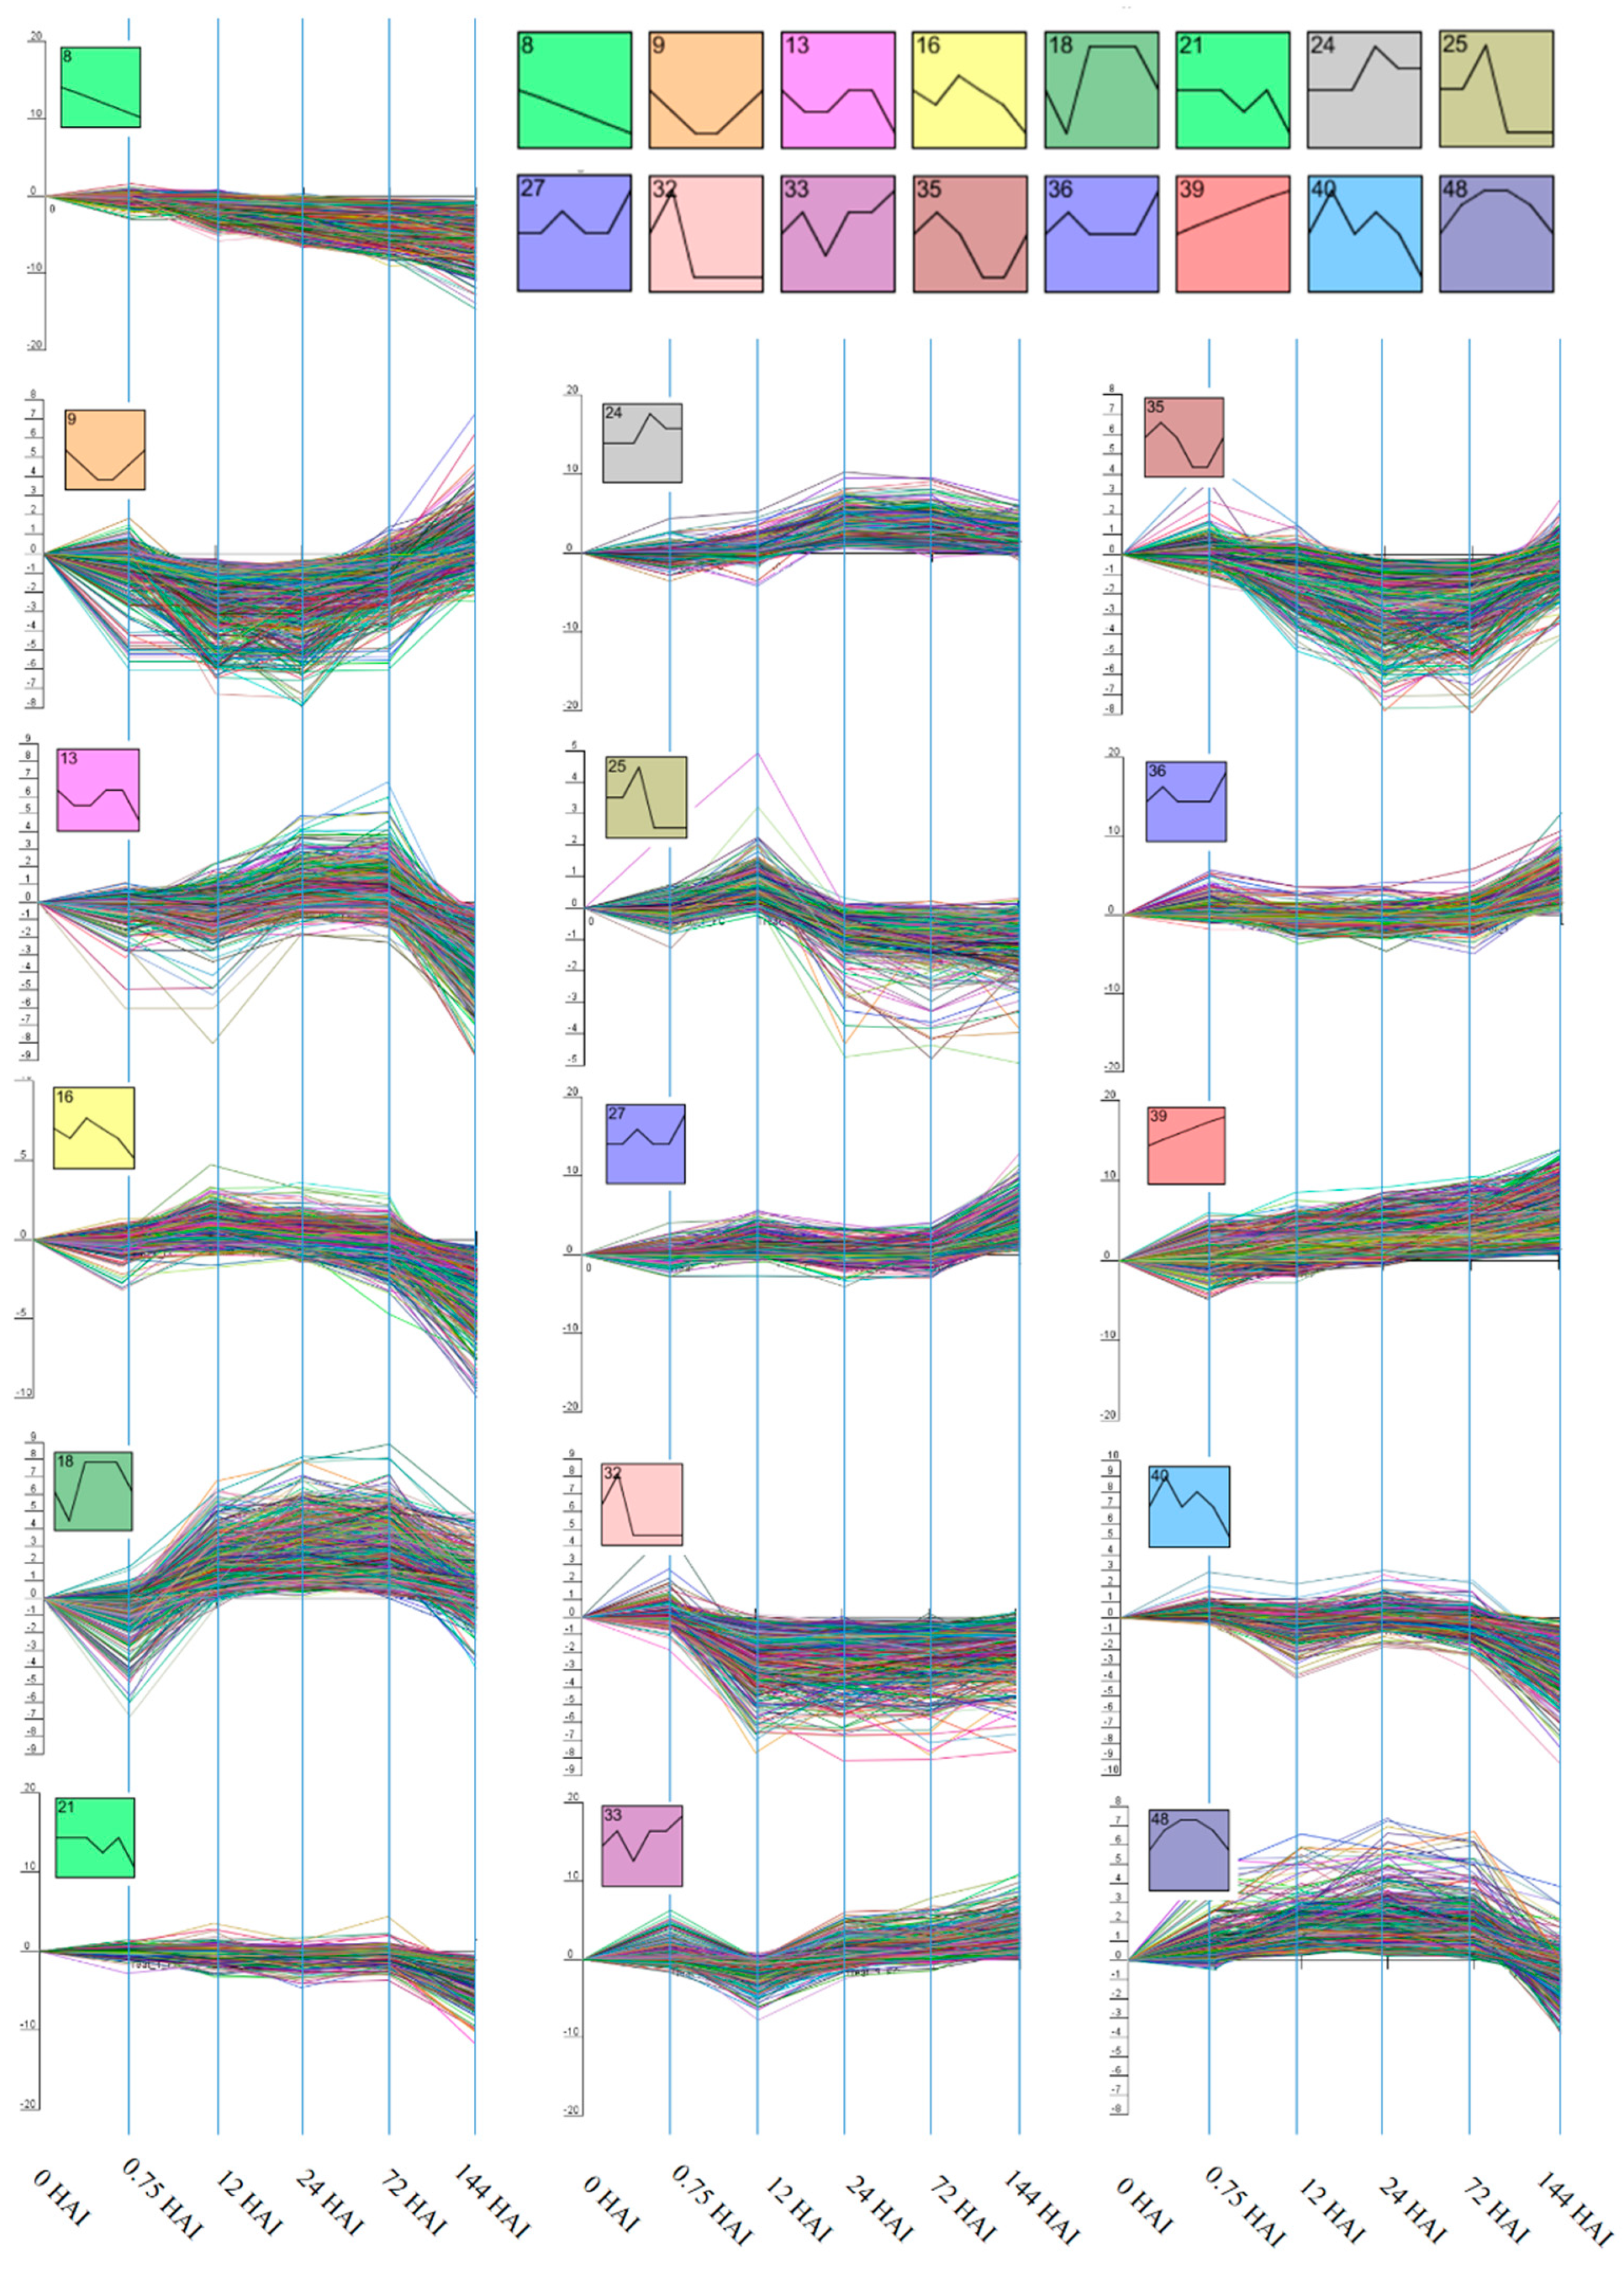
2.2. Clustering of Gene Expression Data

The cluster analysis and visualization of DEGs were achieved using the Short Time-series Expression Miner (STEM) software with default settings [19].

2.3. Gene Ontology (GO) Enrichment Analysis

AgriGO is an international standardized plant gene functional classification system that offers a dynamic-updated controlled vocabulary and a strictly defined concept to comprehensively describe the properties of genes and their products in plants [20]. To identify the enriched GO terms associated with DEGs via hypergeometric probability, we applied multiple testing using the p-value. GO terms with p-value < 0.05 were considered to be significantly enriched.

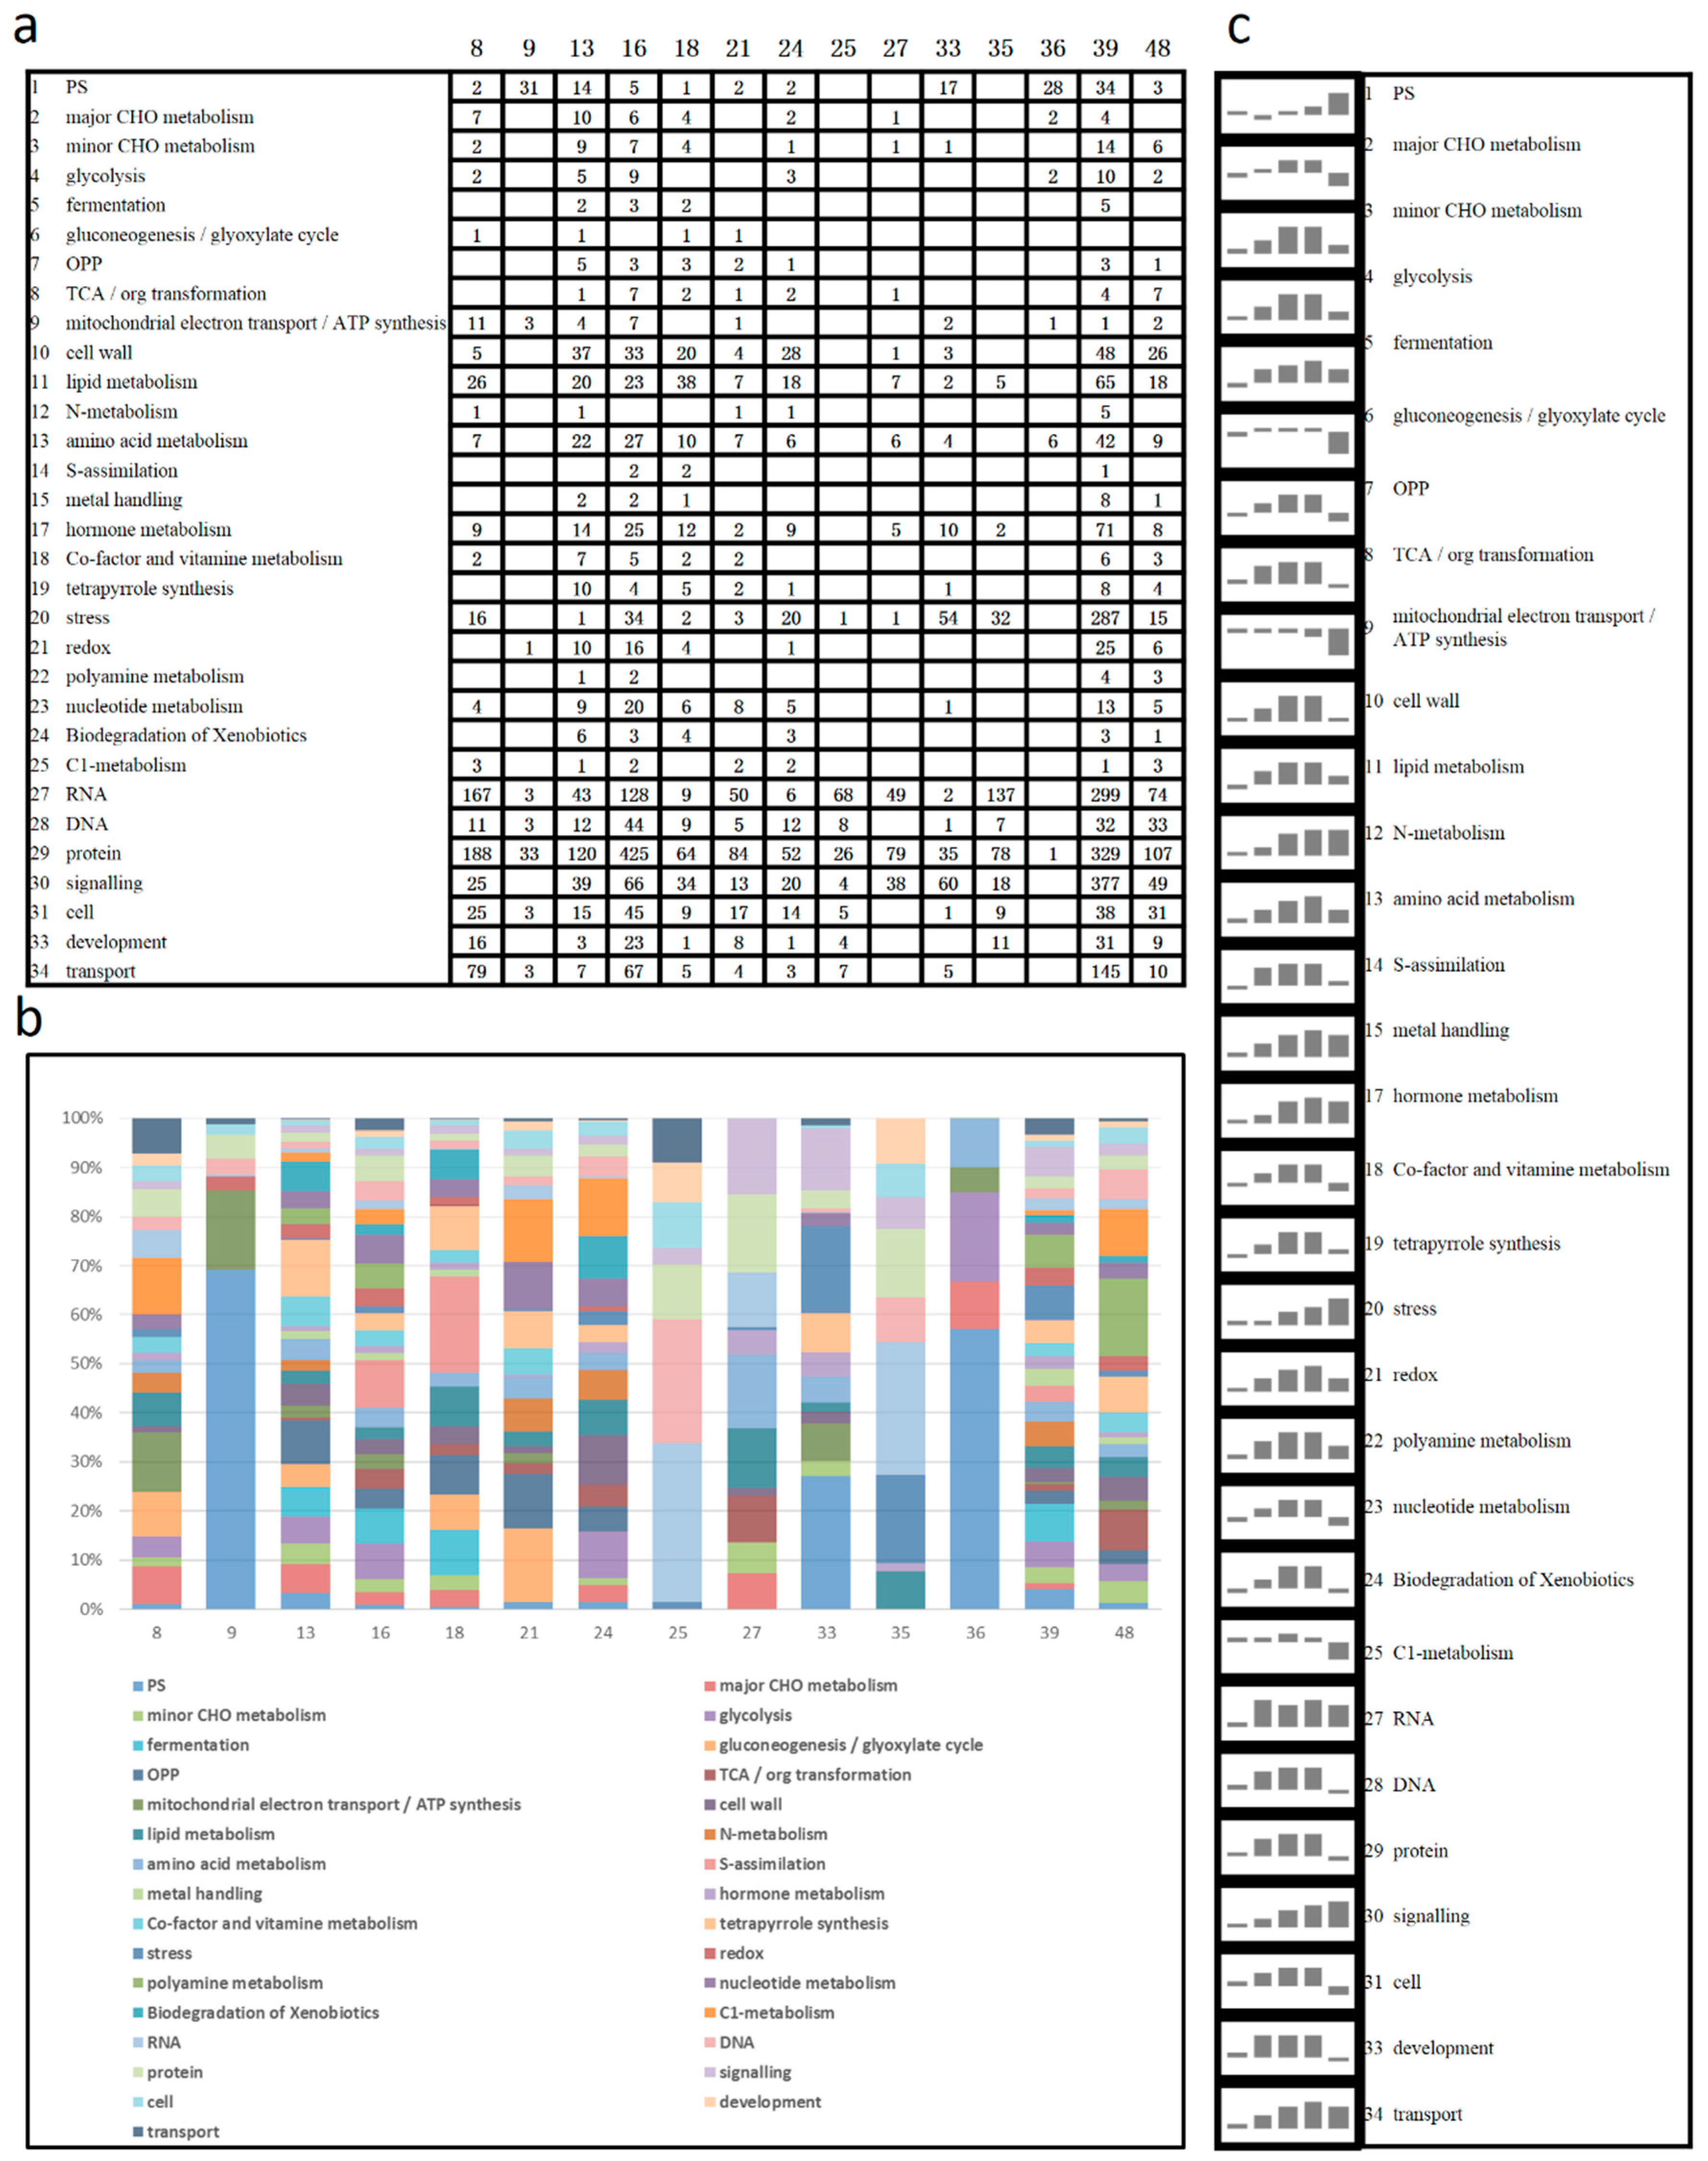
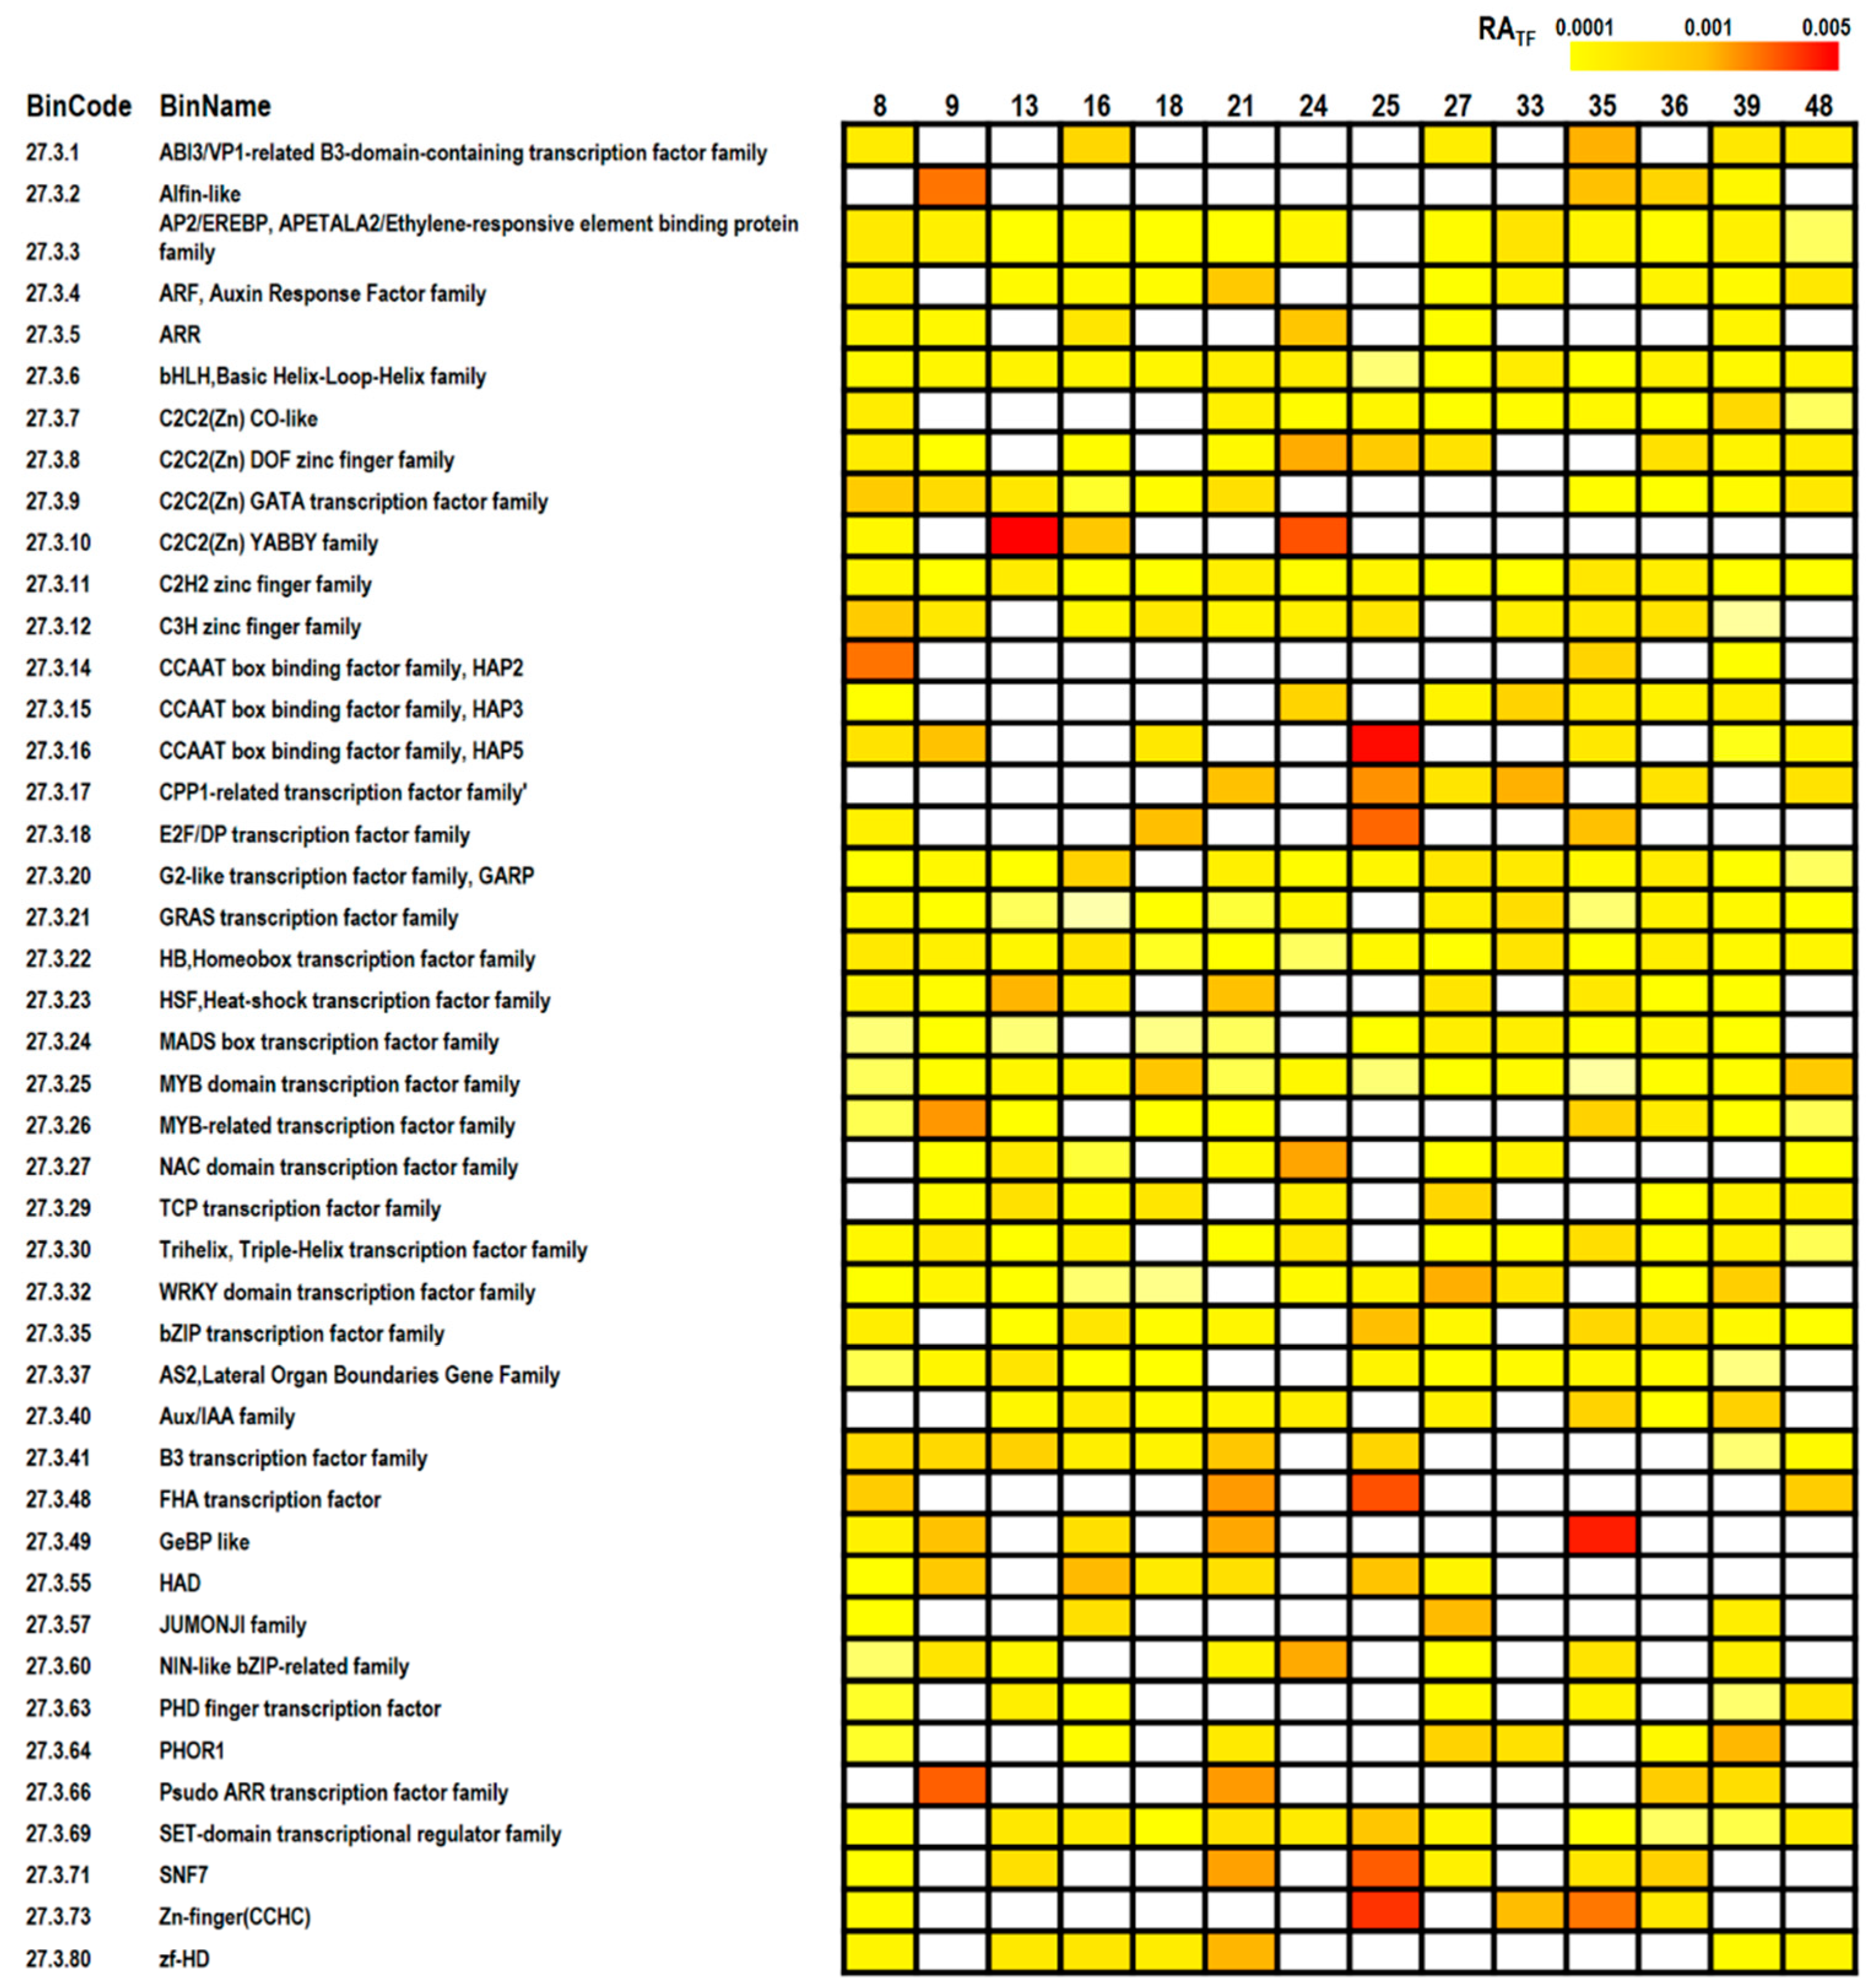
2.4. MapMan Analysis

MapMan software was used for screening TFs [21]. Similarly, all the functional categories, such as TF, were also generated based on the software’s analysis.

2.5. Pathway Activity

To study the activity levels of all candidate genes in a pathway, we introduced a measure of the weighted average expression value, as follows:
PA   =   1 i p i n i / n
where PA represents the activity in a pathway; ni represents the number of genes in ith cluster belonging to a pathway; and pi represents the average expression of the ith cluster.
The average number after homogenization was used to determine the distribution of different types of TFs in each cluster, as follows:
RATF = Ni/(Q × Ci)
where RA represents the TF numbers in a pathway in each cluster, Ni represents the number of members of the same TF group present in the ith cluster, Q represents the total number of TFs in all the significant clusters; and Ci represents the total number of TFs in the ith cluster.

3. Results

3.1. Cluster Analysis of DEGs

To reveal the variation among the DEGs, a STEM tool was used to cluster and visualize RNA-Seq expression profiles of 33,338 genes differentially expressed during seed germination at any given time point in the study (Table S1). STEM generates a series of potential profiles with respect to the direction and magnitude of expression, after which the enrichment of clusters is determined by comparing the distributions of observed groups with those expected in a random permutation [19,22,23]. Based on the expression patterns, profiles were classified into 50 categories. Figure 1 shows the gene expression profiles for the 16 clusters (clusters 8, 9, 13, 16, 18, 21, 24, 25, 27, 32, 33, 35, 36, 39, 40, and 48) found to be significant (p-value ≤ 0.05) out of 50 possible clusters. Approximately 8.6% of the total number of genes clustered belonged to cluster 8, ~4.4% to cluster 9, ~4.2% to cluster 13, ~7.5% to cluster 16, ~3.3% to cluster 18, ~3.2% to cluster 21, ~2.6% to cluster 24, ~1.8% to cluster 25, ~4.2% to cluster 27, ~2.6% to cluster 32, ~2.6% to cluster 33, ~3.8% to cluster 35, ~4.8% to cluster 36, ~12.9% to cluster 39, ~2% to cluster 40, and ~3.4% to cluster 48.
A visual inspection of the clusters revealed clear expression responses for the majority of the genes during poplar seed germination. The expression patterns of clusters 8 and 39 increased or decreased during the whole germination process. Clusters 9, 24, 25, 32, and 48 had expression patterns that increased or decreased in certain stages. Clusters 21, 36, 27, 16, 13, 35, 18, 33, and 40 had expression patterns with two or more peaks or valleys that increased or decreased during all the germination stages. Specifically, cluster 21 had valleys at 24 and 144 HAI, while cluster 13 had valleys at 0.75, 6, and 144 HAI. On the contrary, cluster 36 had peaks at 0.75 and 144 HAI, while cluster 27 had peaks at 6 and 144 HAI. The complexity of the expression patterns and the high level of clustering suggested that seed germination is a complex process.

3.2. GO Enrichment Analysis

To gain further insights into the biological processes, molecular functions and cellular locations associated with the observed changes, we performed a GO enrichment analysis for each of the significant clusters (Figure 2, Table S2). First, we identified a core set of biological processes that were significantly enriched among the 16 clusters. Some terms were enriched in more than one cluster, such as transcription (GO: 0006350), which was significantly enriched in five different clusters, 8, 21, 25, 27, and 35. However, other biological processes appeared to be associated with a certain expression profile. The oxidative phosphorylation-related genes were only enriched in cluster 9, while ubiquitin-dependent protein catabolic processes were only enriched in cluster 16. Clusters 32 and 40 did not have any significant enrichment, so they are not shown in Figure 2 nor discussed below. This indicates that different biological processes have different regulatory patterns, and that there are even different regulatory patterns within the same biological process during seed germination.
In addition to the most prevalent biological processes of the proteins encoded by the genes in these expression profiles, the enrichment study also provided an insight into the cellular localizations. Clusters 8, 9, 13, 16, and 21 are strongly enriched with genes encoding proteins that are targeted to the ribosome and ribonucleoprotein complex, while clusters 9, 27, and 33 appear to be correlated with the ubiquitin ligase complex. Cluster 16 is enriched for genes encoding the mitochondrial lumen (Figure 2). This result indicates that different components of the cell have considerably varied responses during different periods of seed germination.
The enrichment of molecular functions allowed us to further understand the seed germination processes that belong to different clusters. Genes encoding RNA polymerase activity-related proteins were enriched in clusters 8 and 16, while translation elongation factor activity was only enriched in cluster 16. Helicase activity was enriched in cluster 25, and in clusters 35 and 48, albeit to smaller extents. The GO terms related to GTPase activity and DNA polymerase activity were enriched in clusters 21 and 48, respectively (Figure 2).

3.3. Pathway Analyses

To understand the significance of these distinct patterns in transcript abundance changes, three types of analyses were conducted, with each providing a different insight into the molecular basis of the germination process in poplar. The first analysis was performed using MapMan tools to determine which functional categories were found in different significant clusters. The MapMan analysis revealed that a variety of functional categories were affected during the germination process and many of them belonged to different clusters. For example, there were 10 genes encoding major carbohydrate (CHO) metabolism categories in cluster 13, and 6 in cluster 16. There were 42 genes encoding amino acid metabolism categories in cluster 39, which was more than the number of genes in the other clusters. In addition, many genes from the same pathway were distributed among multiple clusters, such as genes encoding mitochondrial electron transport appeared in clusters 8, 9, 13, 16, 21, 33, 36, 39, and 48, and similar situations were presented for other pathways. This analysis showed that gene regulation, in the same functional category, has different regulatory modes (Figure 3a).
Second, to measure the proportions of different functional categories in each cluster, the frequency of transcripts in each functional category was calculated as the number of genes in each cluster divided by the background gene number (the number of genes in this functional category compared with the whole poplar genome). The sum of all the frequency values in each cluster was then defined as 100% for homogenization. Thus, we determined the relative proportion of each functional category in each cluster. We determined that the proportions of major CHO metabolism-, mitochondrial electron transport/ATP synthesis-, C1-metabolism-, and gluconeogenesis/glyoxylate cycle-associated genes were relatively high in cluster 8, while the proportions of S-assimilation-, fermentation-, tetrapyrrole synthesis-, and oxidative pentose phosphate (OPP)-associated genes were relatively high in cluster 18. Other clustering results are presented in Figure 3b and Table S3.
Third, the transcriptional level expression profile changes in each functional category were investigated during germination. Here, a weighted average method was used to determine the transcriptional profiles in each functional category. The results are shown in Figure 3c and Table S4. The average expression patterns of most primary metabolism-associated categories, such as major CHO metabolism, glycolysis, OPP, tricarboxylic acid cycle, lipid metabolism, nucleotide metabolism, amino acid metabolism, and protein, appear elevated between 6 and 48 HAI. Other categories, such as ATP synthesis and C1 metabolism, showed highly active expression patterns between 0.75 and 48 HAI. The photosynthesis category-associated genes that were found appeared highly active at 144 HAI. This was not surprising because photosynthesis occurs after the cotyledons have unfolded (Figure 3c).
To gain further insights into the distribution characteristics of different types of TFs in each cluster, a TF comparative analysis was performed to assess the types and quantities of TFs in different clusters. As shown in Figure 4, cluster 8 had a relatively high number of HAP2, C3H zinc finger family, and C2C2(Zn) GATA TFs while cluster 25 had a relatively high number of HAP5, Zn-finger (CCHC), FHA and E2F/DP TFs, as well as SNF7.

4. Discussion

This study provided a comprehensive profile of the transcriptome during seed germination in the woody model plant poplar and used the weighted mean method to determine the activity changes in the related biological pathways at the transcriptional level. In addition, a uniform number of TFs in each cluster allowed us to understand which TFs are more important in a cluster. Unlike previous studies, we mainly focused on two aspects. First, the activity changes in a certain pathway during the different stages of seed germination using different clusters were determined. The weighted mean algorithm was used to eliminate deviations in expression patterns and differences in gene numbers from different clusters. Second, DEGs with a statistical difference of p < 0.05 were defined as significantly different. There was no requirement that the expression multiple be greater than two to avoid missing some significant DEGs. These two foci of the activity changes are different from those of previous studies.
MapMan was used to annotate genes in different clusters. The MapMan analysis revealed that biological pathway-related genes are located in different clusters and the distribution number varies. To measure the transcriptional trend of a biological pathway during the germination of poplar seeds, we used a weighted average method to compare the expression levels of genes from the same biological process in different clusters. The results are shown in Figure 3c. Many primary metabolism-related biological pathways, such as major CHO metabolism, glycolysis, OPP, tricarboxylic acid cycle, lipid metabolism, amino acid metabolism, nucleotide, and protein, showed increasing trends between 6 and 48 HAI. We believe that this period is the most active transcriptional stage of poplar seed germination.
The OPP pathway is closely related to seed germination [24,25]. In Pinus laricio, the OPP pathway is inhibited in seeds that were exposed to phenol [26]. In Arabidopsis, the 6-phosphate-glucose dehydrogenase) and 6-phosphogluconate dehydrogenase activities in the OPP pathway increased during germination until radicle protrusion [27], and OPP-related transcripts were overrepresented at the first hour of imbibition [28]. In our study, OPP-related gene expression was very high between 6 and 48 HAI; therefore, we speculate that the OPP pathway is very important to poplar seed germination.
TFs play an important role during different stages of poplar seed germination, and five TF types are specifically expressed during certain germination stages. However, no closely related transcription factors were found in other stages of poplar seed germination [13]. In this study, the TF families that underwent significant changes during the germination processes of poplar seeds are shown in Figure 4. We used the homogenization mean method to determine their proportions in different clusters. Periods of high expression were discovered based on the cluster expression patterns. We found that there are more alfin-like, HAP5, Gebp, and HAP2 TFs in clusters 9, 25, 35, and 8, respectively. These TFs were not previously associated with the germination of poplar seeds. We speculate that these transcription factors should play an important role in the clusters to which they belong, and play an important role in regulation during the period of high expression of the cluster. This study revealed a more comprehensive list of TFs that function during the different stages of poplar seed germination.

5. Conclusions

In conclusion, poplar seed germination is a very complex process in which significant changes of various macromolecular substances, such as mRNAs, occur. Our study provides important insights into the dynamic changes in transcript levels and reveals the biological processes that play an important role in each stage of seed germination. We also provide candidate TFs involved in poplar seed germination. The results lay a foundation for further research elucidating the molecular mechanisms of poplar seed germination.

Supplementary Materials

The following are available online at https://www.mdpi.com/1999-4907/10/8/664/s1, Table S1: Differential gene IDs and their expression levels during poplar seed germination processes. Table S2: Gene ontology entries significantly enriched for each cluster and their p-values. Table S3: Relative proportions of functional categories in each cluster. Table S4: Weighted average method used to determine the transcriptional profiles in each functional category.

Author Contributions

Conceptualization, C.Q. and G.-J.L.; Methodology, C.Q.; Software, J.C.; Validation, Y.Z., S.Z., and J.Y.; Formal Analysis, Z.X.; Writing-Original Draft Preparation, X.Z.; Writing-Review & Editing, C.Y.; Visualization, J.C.; Supervision, G.-J.L.; Funding Acquisition, G.-J.L.

Funding

This work was supported by the Fundamental Research Funds for the Central Universities (2572017CA01) and the National Natural Science Foundation of China (grant numbers 31570648 and 31600534) and The 111 project (B16010).

Conflicts of Interest

The authors declare no competing financial interests.

References

  1. Nonogaki, H.; Bassel, G.W.; Bewley, J.D. Germination-Still a mystery. Plant Sci. 2010, 179, 574–581. [Google Scholar] [CrossRef]
  2. Kamran, M.; Imran, Q.; Khatoon, A.; Lee, I.J.; Rehman, S. Effect of plant extracted smoke and reversion of abscisic acid stress on lettuce. Pak. J. Bot. 2013, 45, 1541–1549. [Google Scholar]
  3. Nambara, E.; Nonogaki, H. Seed biology in the 21st century: Perspectives and new directions. Plant Cell Physiol. 2012, 53, 1–4. [Google Scholar] [CrossRef]
  4. Bewley, J.D. Seed germination and dormancy. Plant Cell 1997, 9, 1055. [Google Scholar] [CrossRef]
  5. Bove, J.; Jullien, M.; Grappin, P. Functional genomics in the study of seed germination. Genome Biol. 2001, 3, 1001–1002. [Google Scholar] [CrossRef]
  6. Manz, B.; Müller, K.; Kucera, B.; Volke, F.; Leubner-Metzger, G. Water uptake and distribution in germinating tobacco seeds investigated in vivo by nuclear magnetic resonance imaging. Plant Physiol. 2005, 138, 1538–1551. [Google Scholar] [CrossRef]
  7. Finch-Savage, W.E.; Leubner-Metzger, G. Seed dormancy and the control of germination. New Phytol. 2006, 171, 501–523. [Google Scholar] [CrossRef]
  8. Girke, T.; Todd, J.; Ruuska, S.; White, J.; Benning, C.; Ohlrogge, J. Microarray analysis of developing Arabidopsis seeds. Plant Physiol. 2000, 124, 1570–1581. [Google Scholar] [CrossRef]
  9. Howell, K.A.; Narsai, R.; Carroll, A.; Ivanova, A.; Lohse, M.; Usadel, B.; Millar, A.H.; Whelan, J. Mapping metabolic and transcript temporal switches during germination in rice highlights specific transcription factors and the role of RNA instability in the germination process. Plant Physiol. 2009, 149, 961–980. [Google Scholar] [CrossRef]
  10. Le, B.H.; Cheng, C.; Bui, A.Q.; Wagmaister, J.A.; Henry, K.F.; Pelletier, J.; Kwong, L.; Belmonte, M.; Kirkbride, R.; Horvath, S. Global analysis of gene activity during Arabidopsis seed development and identification of seed-specific transcription factors. Proc. Natl. Acad. Sci. USA 2010, 107, 8063–8070. [Google Scholar] [CrossRef]
  11. Gao, J.; Yu, X.; Ma, F.; Li, J. RNA-seq analysis of transcriptome and glucosinolate metabolism in seeds and sprouts of broccoli (Brassica oleracea var. italic). PLoS ONE 2014, 9, e88804. [Google Scholar] [CrossRef]
  12. Zhang, H.; Wang, W.Q.; Liu, S.J.; Moller, I.M.; Song, S.Q. Proteome Analysis of Poplar Seed Vigor. PLoS ONE 2015, 10, e0132509. [Google Scholar] [CrossRef]
  13. Qu, C.; Zuo, Z.; Cao, L.; Huang, J.; Sun, X.; Zhang, P.; Yang, C.; Li, L.; Xu, Z.; Liu, G. Comprehensive Dissection of Transcript and Metabolite Shifts during Seed Germination and Post-Germination Stages in Poplar. BMC Plant Biol. 2019, 19, 279. [Google Scholar] [CrossRef]
  14. Zhang, C.; Luo, W.; Li, Y.; Zhang, X.; Bai, X.; Niu, Z.; Zhang, X.; Li, Z.; Wan, D. Transcriptomic Analysis of Seed Germination Under Salt Stress in Two Desert Sister Species (Populus euphratica and P. pruinosa). Front. Genet. 2019, 10, 231. [Google Scholar] [CrossRef]
  15. Li, H. Aligning sequence reads, clone sequences and assembly contigs with BWA-MEM. Arxiv Prepr. Arxiv 2013, 1303, 3997. [Google Scholar]
  16. Li, H.; Handsaker, B.; Wysoker, A.; Fennell, T.; Ruan, J.; Homer, N.; Marth, G.; Abecasis, G.; Durbin, R. The Sequence Alignment/Map format and SAMtools. Bioinformatics 2009, 25, 2078–2079. [Google Scholar] [CrossRef] [Green Version]
  17. Robinson, M.D.; McCarthy, D.J.; Smyth, G.K. Edger: A Bioconductor package for differential expression analysis of digital gene expression data. Bioinformatics 2010, 26, 139–140. [Google Scholar] [CrossRef]
  18. Robinson, M.D.; Oshlack, A. A scaling normalization method for differential expression analysis of RNA-seq data. Genome Biol. 2010, 11, R25. [Google Scholar] [CrossRef]
  19. Ernst, J.; Bar-Joseph, Z. STEM: A tool for the analysis of short time series gene expression data. BMC Bioinform. 2006, 7, 191. [Google Scholar] [CrossRef]
  20. Du, Z.; Zhou, X.; Ling, Y.; Zhang, Z.; Su, Z. Agrigo: A GO analysis toolkit for the agricultural community. Nucleic Acids Res. 2010, 64–70. [Google Scholar] [CrossRef]
  21. Thimm, O.; Bläsing, O.; Gibon, Y.; Nagel, A.; Meyer, S.; Krüger, P.; Selbig, J.; Müller, L.A.; Rhee, S.Y.; Stitt, M. Mapman: A user-driven tool to display genomics data sets onto diagrams of metabolic pathways and other biological processes. Plant J. 2004, 37, 914–939. [Google Scholar] [CrossRef]
  22. Ernst, J.; Nau, G.J.; Bar-Joseph, Z. Clustering short time series gene expression data. Bioinformatics 2005, 21, 59–168. [Google Scholar] [CrossRef]
  23. Balazadeh, S.; Schildhauer, J.; Araujo, W.L.; Munne-Bosch, S.; Fernie, A.R.; Proost, S.; Humbeck, K.; Mueller-Roeber, B. Reversal of senescence by N resupply to N-starved Arabidopsis thaliana: Transcriptomic and metabolomic consequences. J. Exp. Bot. 2014, 65, 3975–3992. [Google Scholar] [CrossRef]
  24. Swamy, P.; Sandhyarani, C. Contribution of the pentose phosphate pathway and glycolytic pathway to dormancy breakage and germination of peanut (Arachis hypogaea L.) seeds. J. Exp. Bot. 1986, 37, 80–88. [Google Scholar] [CrossRef]
  25. Gahan, P.B.; Dawson, A.L.; Black, M.; Chapman, J.M. Localization of Glucose-6-phosphate Dehydrogenase Activity in Seeds and its Possible Involvement in Dormancy Breakage. Ann. Bot. 1986, 57, 791–799. [Google Scholar] [CrossRef]
  26. Muscolo, A.; Panuccio, M.; Sidari, M. The effect of phenols on respiratory enzymes in seed germination. Plant Growth Regul. 2001, 35, 31–35. [Google Scholar] [CrossRef]
  27. Hare, P.D.; Cress, W.A.; van Staden, J. A regulatory role for proline metabolism in stimulating Arabidopsis thaliana seed germination. Plant Growth Regul. 2003, 39, 41–50. [Google Scholar] [CrossRef]
  28. Dekkers, B.J.W.; Pearce, S.; van Bolderen-Veldkamp, R.P.; Marshall, A.; Widera, P.; Gilbert, J.; Drost, H.G.; Bassel, G.W.; Muller, K.; King, J.R.; et al. Transcriptional Dynamics of Two Seed Compartments with Opposing Roles in Arabidopsis Seed Germination. Plant Physiol. 2013, 163, 205–215. [Google Scholar] [CrossRef] [Green Version]
Figure 1. Poplar transcripts grouped according to temporal expression profiles. Differentially expressed genes obtained from RNA-Seq transcriptome studies were divided into 16 distinct significant temporal profiles using STEM software. Each of the profiles is represented in a different plot, having mean expression ratios (log2) for each of the assigned transcripts at each time point.
Forests 10 00664 g001
Figure 2. GO analysis of the differentially expressed genes in each cluster. Using p-value < 0.05 as the criterion, the overrepresented GO terms (biological process; cellular component; molecular function), in each cluster were selected using the agriGO analysis tool. The color depth is proportional to enrichment.
Forests 10 00664 g002
Figure 3. Pathway analysis of the differentially expressed genes in each cluster. (a) Pathway analysis of the type of gene in each cluster. The numbers in the boxes indicate the numbers of genes in the functional category. (b) The proportions of the numbers of genes in the different functional categories in each cluster after homogenization. (c) The average weighting method was used to calculate the gene expression activity of each pathway.
Forests 10 00664 g003
Figure 4. Presence of transcription factors in each cluster. The color depth indicates the abundance of transcription factors of different classes in the clusters.
Forests 10 00664 g004

