Abstract
Forest health is an important aspect of sustainable forest management. The practical significance of health assessments of forest ecosystems is becoming more and more prominent because good knowledge about the health level of forests and the causes of unhealthy forests enables the identification of proper actions for enhancing sustainable development of forest ecosystems. This paper evaluated the health status of the forest ecosystem of Mount Taishan using the spatial analysis technique of GIS (Geographic Information System) and local forest inventory data. A comprehensive indicator system that reflects the health status of forestsin the study areawas established. Based on this indicator system, the health level of each sub-compartment of the forests in the study area was assessed. The results show that the high-quality grade forest (80.4 ha) and healthy grade forest (2671 ha) accounted for only 23.5% of the total forest area of Mount Taishan. About 60.5% of Mount Taishan forest was in a sub-health status. The area of unhealthy forests was 1865 ha (accounting for 16% of the total forest area), of which about 98 ha was inextremely unhealthy conditions.Asmore than two-thirds of the forests in Mount Taishan are in a sub-health or unhealthy state, effective measures for improving forest health are in urgent need in the study area.
1. Introduction
Forests ecosystems are an essential natural resource basis for human wellbeing. They are socioeconomically and ecologically important ecosystems that are exposed to a variety of natural and anthropogenic stressors [1,2,3,4]. As a forest management concept, forest ecosystem health is receiving increasing attention all over the world [5,6,7,8]. For example, forest health is currently assessed in Europe (ICP Forests monitoring program) [9]. When assessing the conditions of forest ecosystems and forest health, both the production of forest products and many other important attributes of forest ecosystems, such as species assemblage, vegetation structure, and biomass should be considered [10].
China is a country with relatively scarce forest resources. The per capita forest area in China is 0.128 hectares, which is about one-fifth of the world average. The forest coverage rate in China is 21.7%, which is about two-thirds of the world average [11,12]. To increase the quantity of forest resources has been one of the strategic goals of the Chinese forest sector in the past five decades. A number of national forestry programs (such as the three-north protection forest program, the grain for green program, and the natural forest protection program) have been launched since the late 1970s. Between 1981 and 2018, the total forest area, as well as the total growing stock of timber, nearly doubled. The total area of planted forests in China has now reached 69.3 million hectares, ranking first in the world. However, planted forests in developing economies face great challenges [13]. Forest plantations in China are mostly even-aged forests. There are many problems in the health of these forest ecosystems [14].
Mount Taishan is one of China’s Five Great Mountains—a world natural and cultural heritage, a world-class scenic spotin China, a Sino-US cooperative forest health demonstration site, and an international demonstration forest park. The forest vegetation type of Mount Taishan belongs to warm temperate deciduous broad-leaved forest. This vegetation is a typical representative of plant communities in warm temperate deciduous broad-leaved forest belts in Northern China and has important ecological and social service functions. Most forests in Mount Taishan were planted in the late 1950s, with a characteristic of high density, simple structure, and poor soil conditions. Overall, the forests have weak ecosystem service functions, and are subject to a high risk of damage by pests and diseases. Therefore, an evaluation of the health status of the Mount Taishan forest ecosystem is of great significance for guiding future forest management practice.
Establishing an index system is a commonly adopted first stepin forest health evaluation. At present, forest ecosystem health assessment focuses mainly on three aspects: vitality, organizational structure, and resilience [12]. Different indicators are established for different research purposes. For instance, for the management of forest fires, Doaneet al. [15] analyzed the health status of US State-owned forests based on forest stand density, tree species composition, ratio of growth rate to mortality, and ratio of growth to harvest volume. Costanza et al. [16] established an indicator system based on vitality, organizational structure, and resilience; Patel et al. [17] established an indicator system based on damage to forests. Bussotti et al. re-analyzed the historical dataset of crown conditions in Italian forests from 1997 to 2014 to identify ecological and structural factors that influence tree crown defoliation, highlighting in a special manner the role of tree diversity [9]. Mortenson et al. evaluated tree mortality rates, changes in the density of recently-dead trees, and the amount of insect and disease damage on live trees from comprehensive forest inventories and they found that dwarf mistletoe and drought-stress were significant predictors of red fir mortality [18]. An interactive tool called the Forest Health Index (FHI) has been developed for the Roaring Fork watershed of Colorado based on ecological integrity, public health and safety, ecosystem services, and sustainable use and management [19]. Several forest ecosystem health indicator systems have also been presented in Chinese literature [20,21,22]. The system proposed by Kong et al. [20] builds on a large number of factors related to soil animals and, thus, the system emphasizes soil health conditions. Li and Zheng [21] as well Lu et al. [22] used a composite structure index approach to establish an index system which relies mainly on community structure indicators and ignores other indicators that need to be considered. Wu et al. developed an index system for both the land areas where an ecological service is produced and areas that benefit from the ecological service, and these areas are linked by small watersheds that were extracted using the hydrological analysis function in Arc GIS 10.2 [23]. Health distance method is another way to evaluate forest health. Chen [24] proposed this method that can quantitatively evaluate the health of forest ecosystems from the community scale to even larger scales. The method has certain operability, but it could be difficult to find a suitable undisturbed forest for comparison with the one to be assessed. In addition, some scholars used the ecological indicator assessment method to diagnose the health of forest ecosystems. For instance, as xylophagous insects are often present in sub-health and weak trees, Wang et al. [25] proposed the idea of using the presence of xylophagous insects to diagnose and evaluate forest health.The method is fast and efficient. However, the evaluation result is relatively one-sided. Villa-Castillo and Wagner examined the relationship between changes occurring in ground beetle assemblages and changes in forest stands at several levels of disturbance, and then determined specific indicator species or assemblagesfor each experimental forest [26]. Potter and Koch used a set of more than 100,000 forest inventory plots across the conterminous United States to test whether community phylogenetic structure was significantly clustered. They believed that their results could have implications for broad-scale forest health monitoring [27].
In this study we established a comprehensive evaluation indicator system in accordance with the specific characteristics of the forest in Mount Taishan. Using local forest survey data and the spatial analysis technique of GIS, we evaluated the overall health level of the Mount Taishan forest. The paper provides a method and basis for monitoring the health status of Mount Taishan forest resources to support sustainable forest management decision-making.
2. Material and Methods
2.1. Study Area
Mount Taishan is located in Tai’an City, Shandong Province. The forest coverage rate in Mount Taishan is more than 80%, most of the forest is owned by the State and managed by a State-owned forest farm. The total area of the State-owned Forest Farm is 11,732.96 ha.
The stratum of Mount Taishan is made up of mixed rock, mixed granite and various gneiss, with some igneous rock penetration. The soil types of Mount Taishan are mainly brown soil, cinnamon soil, and mountain meadow soil.
The climate of Mount Taishan is warm temperate semi-humid monsoon climate. As the altitude rises, the temperature gradually decreases. The mountain foot is a warm temperate zone and the top is a mid-temperate zone.
Mount Taishan is rich in vegetation and the main tree species are pine, arborvitae, and oak. Pines account for a large proportion. The tree species distribution can be seen from Figure 1, which was provided by Mount Taishan management committee.
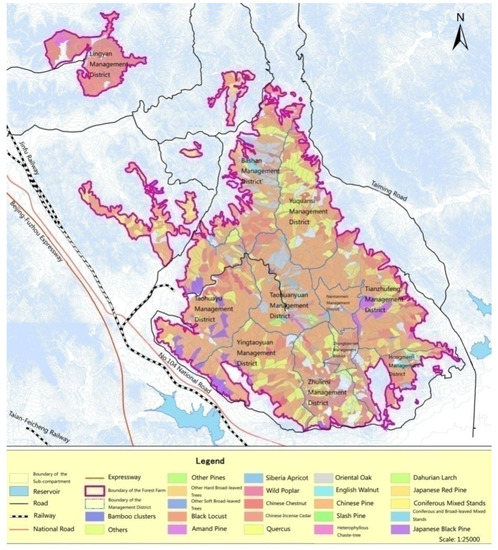
Figure 1.
Tree species distribution map of Mount Taishan.
Mount Taishan has abundant water resources and complex terrain, which provides favorable conditions for the foraging and habitat of various animals.
The Mount Taishan Forest Farm consists of eleven subordinate management districts. Each district has its own staff to carry out forest management activities. The investigation of the forest condition mainly focuses on the control of pests in order to prevent pest outbreak. Moreover, the Mount Taishan Management Committee attaches great importance to forest fire prevention. Every year, a large amount of undergrowth vegetation is removed for fire prevention purpose. This activity destroys biodiversity and causes a certain degree of soil erosion.
2.2. Data Source and Pretreatment
The data pretreatment involves importingthe data obtained from the field survey into the GIS system. A multi-edge map layer was created under Arc GIS 10.1, the attribute fields needed for forest health evaluation in this study were added to the layer attributes. The sub-compartment map of the Mount Taishan State-owned Forest Farm was imported as abottom map. After checking for topological errors, data which was obtained from a local forest survey conducted in 2016 was imported one by one.
In this study, each sub-compartment was used as an evaluation unit. In China, sub-compartment is the basic unit for investigation, statistics, and management planning.
2.3. Indicators and Weights
2.3.1. Selection of Evaluation Indicators
The establishment of an evaluation index system is the most important step in forest health assessment. Table 1 presentsthe evaluation index system applied in this study. The system was established on the basis of the framework of forest health assessment presented by Edmonds et al. [28], FAO’s guidelines on forest health indicators [29], the analysis of existing measures of forest health by Trumbore et al. [10], and the indicators applied in previous forest health assessment in China [20,21,22], with consideration of the biotic and abiotic factors of Mount Taishan forest and the feasibility of field investigation.

Table 1.
Index system for the Mount Taishan forest ecosystem health assessment.
2.3.2. Grading and Score of Evaluation Indicators
The different indicators were used to produce a composite measure of the health level of each evaluation object (sub-compartment) in the study area. To this end, it is necessary to assign a numerical value or score to each of the indicators for each sub-compartment. This was done by classifying the state of each indicator into a number of grades and then assigning a score to each grade.
Quantitative Indicators
Five of the indicators used in this study are quantitative in nature. These include canopy closure, understory shrub coverage, herbal coverage, soil thickness, and humus thickness. We divided the state of each quantitative indicator into five grades according to the values of the indicator measured in field survey. The intervals of measured values for different grades for the quantitative indicators (see Table 2) were determined in consultation with experts at the Mount Taishan Forest Farm. For each indicator, grade 1 refers to the best condition for forest health and was assigned a score of 100. Grade 5 refers to the most unfavorable condition observed in the study area. The score for grade 5 was determined through discussion with experts at the Mount Taishan Forest Farm. The scores for the intermediate grades were then determined using an equal distance method. Table 3 presents the scores assigned to different grades for the quantitative indicators. The impacts of the quantitative indicators on forest health are described in the following.
Table 2.
Grading criteria of quantitative indicators of the Mount Taishan forest ecosystem health assessment.
Table 3.
Scores of different grades of the quantitative indicators.
- (1)
- Canopy Closure: Canopy closure of forest affects climatic factors such as light, temperature, and humidity in the forest that can influence the growth of forest vegetation. Neither too high nor too low canopy would be advantageous to the health of forest ecosystems.
- (2)
- Understory Shrub Coverage: Understory shrub coverage affects the abundance of species of forest ecosystem and community structure. Too high or too low understory shrub coverage would lead to a too simple structure of forest community and might reduce species diversity.
- (3)
- Herbal Coverage: Similar to understory shrub coverage, herbal coverage also affects the abundance of species of forest ecosystem and community structure.
- (4)
- Soil Thickness: The thickness of soil layer is closely related to soil fertility. A thick soil layer indicates that the soil can provide a more favorable growth environment for the forest, which is conducive to the healthy development of the forest ecosystem.
- (5)
- Humus Thickness: Similar to the soil thickness, soil humus thickness also affects the nutrient supply of the forest and affects the health of the forest ecosystem.
Qualitative Indicators
Seven of the indicators were treated as categorical variables in forest surveys in the study area. We included 3 to 8 grades for each of these indicators, depending on the number of categories defined in the forest survey data. The grading criteria (see Table 4) were determined with consideration of the actual situation of the Mount Taishan forest. The scores of different grades (see Table 5) were determined in the same way as the scores for the quantitative indicators. The impacts of qualitative indicators on forest health are described as follows.
Table 4.
Grade criteria of the qualitative indicators of the Mount Taishan forest ecosystem health assessment.
Table 5.
Scores of different grades of the qualitative indicators of the Mount Taishan forest ecosystem health assessment.
- (1)
- Community Structure: Community structure reflects the species diversity of forest communities and also reflects the stability of the community. Integral structure of the forest community is an important indicator of the health of forest ecosystems. In this study, we divided the community structure into three types: Integral structure, relatively integral structure, and simple structure.
- (2)
- Tree Species Composition: Mixed-species forests are more stable and stronger in stress resistance than pure forests and are therefore more conducive to the health of forest ecosystems. With respect to tree species composition, we distinguished among six types of forest stands: Coniferous and broad-leaved mixed stands, coniferous mixed stands, broad-leaved mixed stands, coniferous dominated stands, broad-leaved dominated stands, coniferous pure stands, and broad-leaved pure stands.
- (3)
- Age Group: As the age structure of the forest changes, the ability of the forest to withstand adverse environmental conditions changes. In this study, the age group was divided into young stand, half-mature stand, near-mature stand, mature stand, and over mature stand.
- (4)
- Slope: Slope affects surface water runoff and soil water content, which are important factors affecting forest growth and vitality. This study divided the slope into flat slope, gentle slope, abrupt slope, steep slope, very steep slope, and dangerous slope.
- (5)
- Slope Direction: Similar to slope, slope direction also has significant impact on soil water content. In addition, slope direction also has an important influence on the lighting conditions in the forest. This paper divided the slope direction into northern slope, northeast slope, east slope, southeast slope, south slope, southwest slope, west slope, and northwest slope.
- (6)
- Soil Texture: Soil texture, as a main physical property of soil, is closely related to the ventilation, fertilizer conservation, and water retention of soil. This study divided the soil texture into loam, sandy loam, light loam, heavy loam, sand, silt, clay, and gravel soil.
- (7)
- Damage Level: The level of damage reflects the degree of stress on the forest and affects the health of the forest ecosystem. In this study, the damage level was divided into none (the proportion of damaged standing plants is 10% or less), light (the proportion of damaged standing plants is 10% to 29%), moderate (the proportion of damaged standing plants is 30% to 59%), and severe (the proportion of damaged standing plants is more than 60%).
2.3.3. Determination of the Weights of Different Indicators
The most commonly used methods are expert scoring, sequence synthesis, statistical analysis, and analytic hierarchy process (AHP). Among them, the analytic hierarchy process is widely used in the evaluation of forest ecosystem health [30,31,32,33]. In this study, the method of AHP was applied to determine the weights of different indicators (see Table 6). When determining the weights of each indicator, we firstly determined the weights of the criterion layer. After gathering the experts’ opinions, we believed that the community status and site conditions are of equal importance. Because the degree of stress index has only one indicator, it is considered to be slightly less important here. At the target level, the importance of one indicator is also compared with all other indicators in the same evaluation index, and the weight of each indicator at the target layer is finally obtained. Then the multiplication of the weight of criterion layer and the target layer will determine the overall weight.
Table 6.
Weightsof different indices and indicators.
2.4. The Health Level of Each Sub-Compartment
The health level of each sub-compartment is measured using the weight mean of the scores of different indicators:
where Si is the health score of the i-th sub-compartment, n is the number of indicators, Qij is the score of the j-thindicator for the i-th sub-compartment, and Wj is overall weight of the j-th indicator (see the last column in Table 6). Based on the health score we divided the health level of different sub-compartments into five grades (see Table 7).
Table 7.
Grading of forest level.
3. Results
3.1. IndicatorScores
For each sub-compartment, the score of every indicator was determined according to Table 2, Table 3, Table 4 and Table 5. Figure 2 shows maps of all indicators.
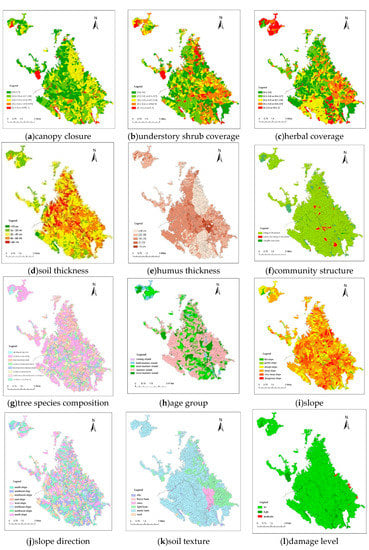
Figure 2.
Maps of all indicators, (a)canopy closure; (b) understory shrub coverage; (c) herbal coverage; (d) soil thickness; (e) humus thickness; (f) community structure; (g) tree species composition; (h) age group; (i) slope.
3.2. The Health Status of the Forest in Mount Taishan
Figure 3 shows the health levels of different sub-compartments of the forest in Mount Taishan.
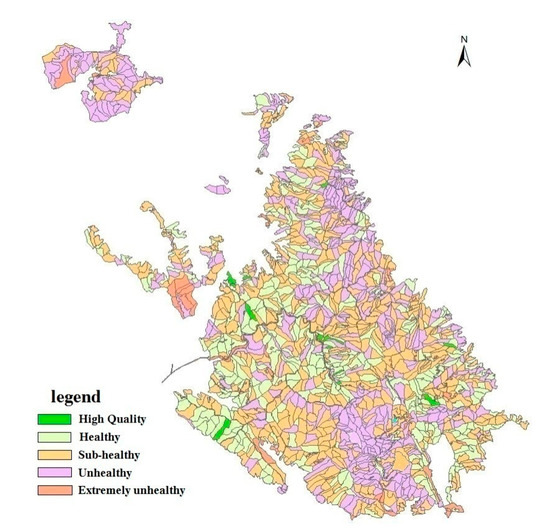
Figure 3.
Health condition map of Mount Taishan forest ecosystem.
According to the statistical analysis function of GIS, the total area of high quality sub-compartments was 80.42 ha, accounting for 0.69% of the total forest area; the total area of healthy sub-compartments was 2671.04 ha, accounting for 22.77%; the total area of sub-healthy sub-compartments was 7115.63 ha, accounting for 60.65%; the total area of unhealthy sub-compartments was 1767.63 ha, accounting for 15.06%; the total area of extremely unhealthy sub-compartments was 98.24 ha, accounting for 0.84%. The area and percentage of the forest in different health levels are shown in Table 8.
Table 8.
Statistics of forest ecosystem health level of Mount Taishan.
4. Discussion
It can be seen from Table 8 that over 75% of the forests in Mount Taishan were in a sub-health or unhealthy state. Most of the forests in Mount Taishan are plantations established in the 1950s and 1960s and many pine species were selected for planting. These pine stands have reached the stage of over-maturity. Some scholars believe that the key problem with plantations is pests; they pointed out that planted forests were increasingly threatened by insects and microbial pathogens [34,35,36]. In this study, we found that a major threat to the health of the forest in Mount Taishan is the lack of effective regeneration. Due to this, the ability of the forest stand to resist external disturbances has been greatly reduced. Pests or severe weather conditions such as drought and extreme cold, once occurred, might cause large areas of forest death. In addition, the stand structure is too simple, most forests were pure forest, and the stability of the forest stand is poor. Cutting off the grass for forest fire prevention has also caused great loss to species diversity and impacted the community structure of the stands.
The State-owned Forest Farm of Mount Taishan includes eleven subordinate management districts. From Figure 3, it can be seen that the relatively healthy stands are mainly distributed in the west part of the Mount Taishan Forest Farm (Bashan management district, the central parts of Taohuayuan management district, and the southern part of Taohuayu management district). In addition, there are small areas of healthy stands in the east part of the Mount Taishan Forest Farm. Stands in Bashan and Taohuayuan management districts are mostly located far from roads and where there is little human activity. Due to the political significance of Mount Taishan, the importance of fire prevention is very high. Fire prevention in Mount Taishan mainly limits people from going into the deep forests from non-tourist routes. Because people are rarely able to enter to the forest far from the road, the government does not carry out a large-scale cutting of shrub and grass. In addition, the government plans to carry out a tending of the woods every year, so the health condition of these parts is relatively good. In terms of tree species, healthy forests in the Bashan management district and Taohuayuan management district are mainly Sawtooth Oak and these stands are in their prime. Healthy forests in the Taohuayu management district are mainly Chinese Pine; due to the importance of the Taohuayu scenic spot, the tending of these forests is accurate and timely. Unhealthy forests are mainly distributed in the Zhulinsi management district, Yuquansi management district and Lingyan management district. The Zhulinsi management district has been seriously disturbed by tourists and undergrowth vegetation is scarce. Too high stand density is also a serious problem. The Yuquansi management district is remote and its technology of pest control is relatively old fashioned. In addition, the area bordering the Yuquansi management district and surrounding collective forests is influenced by human interference. Tree vigor in this area is relatively weak. In the Lingyan management district, the main tree species is Chinese Arborvitae. These stands were planted in the 1950s and 1960s. Chinese Arborvitae usually has long life, so most of these stands are in the half-mature stage. These stands are very dense and the forest structure is unreasonable. It can be seen from Figure 3 that the sub-healthy forests are widely distribute throughout Mount Taishan and the main species is Chinese Pine. In fact, these forests have reached the over-mature stage and their resilience to risk has been reduced. High quality forests and extremely unhealthy forests are distributed sporadically.
Overall, the health condition of Mount Taishan forests is not very satisfactory and measures have been taken in order to improve the health level. Although these measures have a role to play, the potential health risks cannot be ignored. If these forests are not regenerated in time, large-scale deaths will occur someday.
Since the fall of 2018, a large number of dead trees have appeared on Mount Taishan, and that has been a growing trend. The yellow dead trees have a great negative impact on the landscape of Mount Taishan. The most important reason for the dead trees is that the structure of the Mount Taishan forest ecosystem is too single. Another vital reason is the existence of large over-mature forests. When adverse external factors occur, the Mount Taishan forest will face a great threat.
Forest management practices, whether for commodities, amenities, or ecosystem services all require labor and cost money to implement. Planning, harvesting, burning, planting, applying herbicide, fencing, and monitoring are among the most widely applied actions to manage forests for a multitude of objectives [37,38]. In order to improve the health level of the Mount Taishan forest, as the next step, the following measures can be taken.
- (1)
- For the aging-degraded stands, the dead wood and the near dead wood should be removed, and the forest densityshould be reducedby thinning.
- (2)
- To make full use of the excellent native tree species with natural regeneration ability, select the target tree, cut down other inferior wood that affects the natural species of the target tree, and use the natural regeneration ability of the target tree to achieve uneven-aged and multiple layered forests.
- (3)
- Forest fire prevention is very important, but do not overdo it. Cuting the undergrowth blindly to prevent fire will make the loss outweigh the gain. Except local tree species such as Chinese Pine and Oak, some non-flammable tree species can be considered during forest regeneration.
Since the last century, remote sensing has been used to monitor forest health because it can facilitate the acquisition of large-scale surface information, timely, continuously and accurately. Studies employing remote sensing to characterize forest health have burgeoned since early twenty-first century [39]. For instance, for forestry pests, remote sensing techniques were used in Australia’s forest health monitoring for assessment of the hazard of radiate pine leaf disease [40]. Zhao identified and mapped health levels of Robinia pseudoacacia forests based on multiple spectral bands, gray-level co-occurrence matrix (GLCM) texture information, and local Getis-OrdGi statistical information extracted from high resolution IKONOS imagery [41]. Michez proposed a methodological framework to explore how a set of multi-temporal images acquired during a vegetative period can differentiate some of the deciduous riparian forest species and their health conditions [42]. GIS has advantages in spatial data analysis. With the continuous advancement and development of GIS technology and remote sensing technology, their applications in forestry will expand [43,44,45,46]. Compared to traditional methods, GIS and remote sensing technologies make forest ecosystem health assessments more convenient and fast, and can flexibly select survey content according to the focus of evaluation. Thus, the adoption of GIS and remote sensing technology will be trending in future forest ecosystem health assessment and diagnosis. For instance, Wang and Zhong used multitemporal Landsat imagery to analyze the dynamic changes of the R. pseudacacia forest health levels during the periods of 1995–2007 and 2007–2013. They demonstrated that four Vis computed from Landsat imagery were powerful in discriminating three forest health levels. They also indicated that R. pseudacacia forest in the Yellow River Delta has experienced obvious degradation [47].
However, despite the advantages, remote sensing and GIS can not completely replace traditional surveys. Passive optical and radar remote sensing have consistently failed to provide reliable estimates of biophysical properties describing canopy and stand structure, and consequently, have not met the data and information needs of forest, landscape, and global ecologists [48]. The application of a certain kind of remote sensing image to a certain research area may achieve better results, but the results may not be universal. The terrain of Mount Taishan is very complicated. The shadows of the terrain can reduce the accuracy of evaluation. Even if topographic correction is carried out, the influence of topographic shadow can only be reduced to a certain extent. So, traditional surveys are also important. This paper is based on the survey data of forest resources and it used the powerful spatial data analysis capability of GIS. The data collection took professional forestry staff more than five months to complete, and the survey data were recorded into the GIS system by professionals to ensure the accuracy of the first-hand data. Therefore, a comprehensive and detailed field survey of the State-owned Forest Farm of Mount Taishan was a huge project. However, the health assessment of forest ecosystems should be a long-term dynamic process. Long-term and periodic monitoring and evaluation of forest health status needs to be combined with remote sensing technology. How to improve the accuracy of evaluation deserves further research. Such information can not only help understand the forest health status of the study area, but also guide forest management practices to prevent degradation of forest health.
As a tourist attraction, Mount Taishan has a large number of tourists every year. In non-tourist areas, residents in the mountains spread sheep, cattle, and other livestock in the deep forest. The disturbance by human activities will also have a certain impact on the health status of the Mount Taishan forest. This may be another idea for monitoring the health of the Mount Taishan forest.
In a historical context, many of the State-owned Forest Farms in China were planted forests in the 1950s and 1960s. The large-scale tree-planting campaign made a huge contribution to China’s forest coverage at that time. However, because of technological backwardness, most of the plantations also had a problem of simple forest species. Similar to the Mount Taishan forest, many of the State-owned Forests have now reached the stage of mature and over-mature forests, and the conditions of these forests are not satisfactory.
In China, a local forest survey is conducted every ten years, and every inventory has a technical specification. The survey covers the types of forest trees, the amount of forest stock, the natural geographical environment, and the ecological and environmental factors related to forest resources. In addition, more specific surveys can be established based on the characteristics of forest resourcesand survey purposes. In fact, regular field inspections by forestry staff are common practice in most countries. This allows us to monitor forest health conditions and their change over time. On the whole, these surveys are time-consuming, involve a wide range of participants, and the survey information is valuable. By making full use of these survey materials, the establishment of an indicator system that can visually reflect the health status of forest resources can provide a more objective understanding of the health status of forest resources, and thus provide direction for the next forestry measures. In this process, the selection of indicators is the key, and it is of great significance to standardize the index system for a certain type of forest. For instance, working from a set of common forest health indicators, sample protocols, and database structures has facilitated the creation of a consistent forest health inventory across spatial scales in some areas of the USA, with investment from numerous partners [49].
5. Conclusions
- (1)
- The forest resources survey provides rich first-hand information for forest health assessment. It is very important to establish a targeted index system for forest assessment.
- (2)
- There are many problems in the forest health of Mount Taishan, and the government should take corresponding measures in the future. We believe that the most important measure should be timely regeneration.
- (3)
- The ability of remote sensing technology to acquire data timely can compensate for the enormous work of field survey. However, when applied in mountain areas, the accuracy of evaluation is a problem and it needs to be discussed and studied in depth.
Author Contributions
B.C. and Y.M. designed the research ideas. X.D. organized field surveys conducted by specialists of the eleven subordinate management districts. Y.M. participated in field surveys. Y.M. and C.D. entered and analyzed the survey data under professional software. All authors read and approved the final manuscript.
Funding
This research was funded by the Chinese Public Research Fund for Key Technologies for Landscape Quality Improvement and Resource Conservation in Forest Parks (No. 201104051).
Conflicts of Interest
The authors declare no conflict of interest.
References
- Brockerhoff, E.G.; Jactel, H.; Parrotta, J.A.; Ferraz, S.F.B. Role of eucalypt and other planted forests in biodiversity conservation and the provision of biodiversity-related ecosystem services. For. Ecol. Manag. 2013, 301, 43–50. [Google Scholar] [CrossRef]
- Ninan, K.N.; Inoue, M. Valuing forest ecosystem services: What we know and what we don’t. Ecol. Econ. 2013, 93, 137–149. [Google Scholar] [CrossRef]
- Marie-Lyne, C.; Laurence, D. Forest health monitoring highlights progress in forest deterioration in France. Water Air Soil Pollut. 2018, 229, 311–325. [Google Scholar]
- Perles, S.J.; Wagner, T.; Irwin, B.J.; Manning, D.R.; Callahan, K.K.; Marshall, M.R. Evaluation of a regional monitoring program’s statistical power to detect temporal trends in forest health indicators. Environ. Manag. 2014, 54, 641–655. [Google Scholar] [CrossRef]
- Blatner, K.A.; Keegan, C.E.; O’Laughlin, J.; Adams, D.L. Forest health management case study in southwestern Idaho. J. Sustain. For. 1994, 2, 317–337. [Google Scholar] [CrossRef]
- Sampson R, N. Assessing Forest Ecosystem Health in the Land West; Food Products Press: New York, NY, USA, 1993; pp. 317–338. [Google Scholar]
- Kolb, T.E.; Wagner, M.R.; Cvington, W.W. Concepts of forest health: Utilitarian and ecological perspective. J. For. 1994, 92, 63–65. [Google Scholar]
- Chen, X.; Wang, J. Summary of research on forest health assessment. For. Sci. Technol. Guangdong Prov. 2007, 23, 61–65. [Google Scholar]
- Bussotti, F.; Feducci, M.; Iacopetti, G.; Maggino, F.; Pollastrini, M.; Selvi, F. Linking forest diversity and tree health: Preliminary insights from a large-scalesurvey in Italy. For. Ecosyst. 2018, 5, 12. [Google Scholar] [CrossRef]
- Trumbore, S.; Brando, P.; Hartmann, H. Forest health and global change. Science 2015, 349, 814–818. [Google Scholar] [CrossRef]
- Yin, H.; Liu, Q. Advancement of forest ecosystem health diagnoses and pondering over health diagnoses for subalpine coniferous forests. Res. Dev. World Sci. Technol. 2003, 25, 56–61. [Google Scholar]
- Fan, M.; Lu, X.; Yu, X. Rapid assessment of forest ecosystem health. Soil Water Conserv. Bull. 2010, 30, 196–200. [Google Scholar]
- Hurley, B.P.; Slippers, B.; Sathyapala, S.; Wingfield, M.J. Challenges to planted forest health in developing economies. Biol. Invasions 2017, 19, 1–13. [Google Scholar] [CrossRef]
- Li, J.; Zhang, Z.; Luo, K. Establishment of indicator system for forest ecosystem health assessment. Soil Water Conserv. Res. 2007, 14, 173–176. [Google Scholar]
- Doane, D.; Laughlin, J.O.; Morgan, P.; Miller, C. Barriers to wildlandfire Use. Int. J. Wilderness 2006, 12, 36–38. [Google Scholar]
- Costanza, R.; Norton, B.G.; Haskell, B.D. Ecosystem Health New Goals for Environmental Management; Island Press: Washington, DC, USA, 1992. [Google Scholar]
- Patel, A.; Rapport, D.J.; Vanderlinden, L.; Eyles, J. Forests and societal values: Comparing scientific and public perception of forest health. Environmentalist 1999, 19, 239–249. [Google Scholar] [CrossRef]
- Mortenson, L.A.; Gray, A.N.; Shaw, D.C. A forest health inventory assessment of red fir (Abiesmagnifica) in upper montane California. Écoscience 2015, 22, 47–58. [Google Scholar] [CrossRef]
- Turner, D.; Lucieer, A.; Malenovský, Z.; King, D.; Robinson, S.A. Assessment of Antarctic moss health from multi-sensor UAS imagery with Random Forest Modelling. Int. J. Appl. Earth Obs. Geoinf. 2018, 68, 168–179. [Google Scholar] [CrossRef]
- Kong, H.; Zhao, J.; Ma, K.; Zhang, P.; Ji, L. Preliminary study on ecosystem health evaluation method. J. Appl. Ecol. 2002, 1, 486–490. [Google Scholar]
- Li, J.; Zheng, X. Discussion on health evaluation index system of water conservation forest in Beijing area. For. Resour. Manag. 2004, 2, 31–34. [Google Scholar]
- Lu, S.; Liu, F.; Yu, X. Health assessment of forest ecosystem in Badalingforest farm in Beijing. J. Soil Water Conserv. 2006, 20, 79–82. [Google Scholar]
- Liyun, W.; Weibin, Y.; Zhirong, J.; Shihong, X.; Dongjin, H. Ecosystem health assessment of dongshan island based on its ability to provide ecological services that regulate heavy rainfall. Ecol. Indic. 2018, 84, 393–403. [Google Scholar] [CrossRef]
- Chen, G.; Dai, L.; Fan, Z. Assessment and monitoring of forest ecosystem health. J. Appl. Ecol. 2002, 13, 605–610. [Google Scholar]
- Wang, J.; Liu, J.; Chen, X. Host selection of xylophagousinsects and its application in forest health evaluation. For. Sci. Res. 2010, 23, 125–133. [Google Scholar]
- Villa-Castillo, J.; Wagner, M.R. Ground beetle (coleoptera: Carabidae) species assemblage as an indicator of forest condition in northern arizona ponderosa pine forests. Environ. Entomol. 2002, 31, 242–252. [Google Scholar] [CrossRef]
- Potter, K.M.; Koch, F.H. Patterns of forest phylogenetic community structure across the United States and their possible forest health implications. For. Sci. 2014, 60, 851–861. [Google Scholar] [CrossRef]
- Edmonds, R.L.; Agee, J.K.; Gara, R.I. Forest Health and Protection; McGraw-Hill: New York, NY, USA, 2000. [Google Scholar]
- Kleine, M.; Cobbinah, J.; Yang, Z.Q. Forest Health Indicators for Measuring Forest Degradation-FAO. Available online: www.fao.org/forestry/25751-064de189f784bdcc0eb7948ea4dce7e92.doc (accessed on 10 August 2010).
- Hong, J.; Shu, Q.; Wu, J. The health classification of Pinusdensatatypical forest ecosystem in alpine region of northwestern Yunnan based on hyperiondata. J. Southwest For. Univ. 2016, 36, 79–86. [Google Scholar]
- Wang, Q.; Du, Y.; Zheng, X. Construct the health evaluation of index system for evergreen broadleaf forest in Jiangleforest farm. J. Southwest For. Univ. 2014, 34, 74–78. [Google Scholar]
- Li, Y.; Qiao, Q.; Chai, F. Study on environmental risk assessment index weight of industrial park based on the analytic hierarchy process. Res. Environ. Sci. 2014, 27, 334–340. [Google Scholar]
- Feng, J.; Wang, J.; Yao, S.; Ding, L. Dynamic assessment of forest resources quality at the provincial level using ahp and cluster analysis. Comput. Electron. Agric. 2016, 124, 184–193. [Google Scholar] [CrossRef]
- Wingfield, M.J.; Brockerhoff, E.G.; Wingfield, B.D.; Slippers, B. Planted forest health: The need for a global strategy. Science 2015, 349, 832–836. [Google Scholar] [CrossRef]
- Jactel, H.; Petit, J.; Desprez-Loustau, M.L.; Delzon, S.; Piou, D.; Battisti, A.; Koricheva, J. Drought effects on damage by forest insects and pathogens: A meta-analysis. Glob. Chang. Biol. 2012, 18, 267–276. [Google Scholar] [CrossRef]
- Ian, H.; Robert, C.; Mark, F. An evaluation of forest health insect and disease survey data and satellite-based remote sensing forest change detection methods: Case studies in the United States. Remote Sens. 2018, 10, 1184–1196. [Google Scholar]
- Stephen, R.S.; Moser, W.K.; David, J.N.; Patrick, D.M.; Brett, J.B.; Francisco, X.A.; Ryan, D.D.; Eric, J.G. Five anthropogenic factors that will radically alter forest conditions and management needs in the northern United States. For. Sci. 2014, 60, 914–925. [Google Scholar]
- Peterson, K.; Diss-Torrance, A. Motivations for rule compliance in support of forest health: Replication and extension. J. Environ. Manag. 2014, 139, 135–145. [Google Scholar] [CrossRef]
- Xulu, S.; Gebreslasie, M.T.; Peerbhay, K.Y. Remote sensing of forest health and vitality: Asouth african perspective. South. For. J. For. Sci. 2018, 81, 1–12. [Google Scholar] [CrossRef]
- John, W.C.; Mark, J.A.; Riitters, K.H. Forest health monitoring 2002 national technical report general technical report SRS-84. Asheville NC South. Res. Stn. USDA For. Serv. 2005, 97, 84. [Google Scholar]
- Yu, Z.; Hong, W.; Zhenzhen, Z. Forest healthy classification of Robinia Pseudoacacia in the Yellow River Delta, China based on spectral and spatial remote sensing variables using random forest. Remote Sens. Technol. Appl. 2016, 31, 359–367. [Google Scholar]
- Michez, A.; Piégay, H.; Lisein, J.; Claessens, H.; Lejeune, P. Classification of riparian forest species and health condition using multi-temporal and hyperspatial imagery from unmanned aerial system. Environ. Monit. Assess. 2016, 188, 1–19. [Google Scholar] [CrossRef]
- Yang, L.; Zhang, T.; He, J. Research on the hyperiondatapre-processing method based on ENVI. J. Henan Sci. Technol. 2015, 9, 39–42. [Google Scholar]
- Hu, X.; Cao, S.; Zhao, X. Comparison of greenlandinformation extraction based on vegetation index. J. Nanjing Univ. Inf. Sci. Technol. 2012, 4, 420–425. [Google Scholar]
- Li, X.; Li, Z.; Gao, Z. Estimation of sparse vegetation cover in Aridregionsbased on hyperionvegetation index. J. Beijing For. Univ. 2010, 32, 95–100. [Google Scholar]
- Pasqualini, V.; Oberti, P.; Vigetta, S. A GIS-based multicriteriaevaluation for aiding risk management PinusPinasterAit forests: A case study in Corsican Island, western Mediterranean Region. Environ. Manag. 2011, 48, 38–56. [Google Scholar]
- Wang, H.; Zhong, Y.; Pu, R.; Zhao, Y.; Song, Y.; Li, G. Dynamic analysis of RobiniaPseudoacaciaforest health levels from 1995 to 2013 in the Yellow River Delta, China using multitemporalLandsat imagery. Int. J. Remote Sens. 2018, 39, 4232–4253. [Google Scholar] [CrossRef]
- Lim, S.W. Lidar Remote Sensing of Forest Canopy and Stand Structure. 2006. Available online: https://www.researchgate.net/publication/252766380 (accessed on 28 July 2019).
- Woodall, C.W.; Amacher, M.C.; Bechtold, W.A.; Coulston, J.W.; Jovan, S.; Perry, C.H. Status and future of the forest health indicators program of the USA. Environ. Monit. Assess. 2011, 177, 419–436. [Google Scholar] [CrossRef]


© 2019 by the authors. Licensee MDPI, Basel, Switzerland. This article is an open access article distributed under the terms and conditions of the Creative Commons Attribution (CC BY) license (http://creativecommons.org/licenses/by/4.0/).