Article

Effects of Tree Shape on the Microclimate and Fruit Quality Parameters of Camellia oleifera Abel

1
Key Laboratory of Silviculture and Conversation, Ministry of Education, Beijing Forestry University, Beijing 100083, China
2
Hunan Academy of Forestry, Changsha 410004, China
*
Author to whom correspondence should be addressed.
Forests 2019, 10(7), 563; https://doi.org/10.3390/f10070563
Submission received: 8 May 2019 / Revised: 25 June 2019 / Accepted: 2 July 2019 / Published: 5 July 2019
(This article belongs to the Section Forest Ecology and Management)

Abstract

:
Tree shape can affect microclimate, which may directly influence fruit growth and development. Open center and round head are two tree canopy shapes that are generally used in Camellia oleifera Abel. cultivation. To study the effects of the two canopy shapes on the microclimate and fruit quality parameters inside the canopy and investigate the correlations between microclimate and oil yield characteristics, microclimates in different developmental periods and fruit quality parameters at maturity at different positions in the two canopy shapes were determined. In this study, the open-center shape increased the light intensity and temperature, and reduced the relative humidity within the canopy, and the microclimate was more uniformly distributed within the open-center canopy. Fruit quality parameters of open-center canopied trees were also significantly increased and had more uniform distributions, especially the oil yield parameters. The content ratio of the dry seed, oil content ratio of the fresh fruit, and oil yield increased by 43.55%, 59.30% and 79.01%, in the lower layer, respectively, and 27.33%, 41.75%, and 55.43%, in the inner canopy, respectively, compared to those of round-head canopied trees. For both canopy shapes, oil yield parameters had positive correlations with light intensity and temperature, but negative correlations with relative humidity, and the correlation coefficients between light intensity and temperature at different developmental stages and oil yield parameters in round-head canopies were greater than in the open-center canopies. Additionally, regression equations between the single microclimatic factor in different developmental periods and oil yield parameters could be used to estimate the latter in the two canopy shapes. The optimum light conditions for open-center and round-head canopy shapes were 916–1893 and 1108–1259 μmol·m2·s−1, respectively. Overall, the open-center canopy had a more desirable microclimate and a more uniform microclimate distribution, especially the light intensity, which contributes to high uniform fruit quality parameters. Thus, an open-center canopy is the desirable shape in C. oleifera production.

1. Introduction

Camellia oleifera Abel. is a unique woody oil tree grown in China and one of the four major woody oil trees worldwide [1]. It has a large growing area in southern China, covering 14 provinces. Tea oil is known as “eastern olive oil” [2] because it is rich in unsaturated fatty acids [3]. By the end of 2018, the planting areas of C. oleifera have occupied 4.39 million hectares in China. However, low production and inefficiency cultivation have seriously restricted the development of C. oleifera industry. Extensive management and poor tree structure are important factors that result in low fruit yield and quality. Pruning is a common practice for increasing the fruit quality and yield [4,5]. The purpose of pruning is to obtain a reasonable tree structure, which is the basis for forming economic yield. It can reduce the canopy size [5,6] and modify the canopy microclimate, such as by increasing the light interception [7,8] and decreasing the moisture level [9,10]. In C. oleifera, pruning is also an important way to keep stable and high yield. As stated by Yi [11], fruit yield of C. oleifera after pruning was increased by over one third compared to that of unpruned trees.
Tree shape strongly influences the density and spatial distribution of branches, leaves and fruit within a canopy, and the differences in these distributions can cause differences in light intensity, temperature, and relative humidity [12,13,14], forming unique microclimates that differ from the external environment. Light condition appears to be the most affected by tree shapes and training systems among the canopy microclimate. In apple orchards, Y-trellis, solaxe training system, and V-shaped trees have the greatest light interception levels within the canopy compared with other training systems and tree shapes [15,16,17], and solar radiation transmission was greater in the Y-shaped system when compared with the fruiting wall system in peach orchards [18].
Open-center and round-head canopy shapes are the most common for C. oleifera [19]. An open canopy allows an increase in transmitted light [20], and the photosynthetically active radiation within an open-center canopy reaches further into the canopy [21]. Moreover, an open-center canopy configuration for apple always increases the light interception and light-use efficiency within the canopy, resulting in the leaves obtaining a high level of radiation. These factors contribute to an increase in apple quality [22,23,24]. In contrast, a round-head canopy inhibits light penetration inside the canopy because excessive branches congest the center, and the poor light distribution always leads to a low fruit yield and quality [25]. Open-centre canopy of C. oleifera not only significantly increased the single fruit weight, yield per plant, and the weight of seed kernel by improving the leaf nutrients [26,27], but also increased the rate and number of flower buds [26,27], which helped to increase the fruit quality and yield in the following year. Light use efficiency of the open-center shape was the highest among four apple tree shapes (small-sparse shape, disperse-stratified shape, spindle shape, open-center shape), and the leaves’ average photosynthetic rate within open-center shape was also higher, which promoted the transport and distribution of photosynthetic products resulting in higher fruit quality [24].
Microclimates play roles in the growth and development of trees by affecting photosynthesis [28]. Furthermore, an acceptable level of fruit yield is largely dependent on environmental conditions. Light is a key factor for fruit development, and fruit yield and quality are always strongly positively correlated with light intensity and interception [16,29]. Well-illuminated conditions could increase the percentage of oil and decrease the water content of olive trees [30]. In mango, Schaffer and Gay [31] found that fruit grown under poor light-interception conditions had low fruit-set and yield rates. Flower bud initiation and fruit size decreased in shaded canopy areas compared to sun-exposed areas [32,33]. Light interception along the north-south axis of the canopy is high, whereas it is low along the east–west (E–W) axis [34]. Lombard and Westwood [35] found that E–W rows had a lower yield of pear compared to north–south (N–S) rows. They attributed this to a lower bloom density on the E–W rows as a result of less light. Khemiral [36] reported that lower levels of sunlight interception in E–W rows decreased the fruit set and crop density, leading to a lower average cumulative yield of ‘Anjou’ pear.
Canopy temperature and humidity also have significant effects on fruit quality parameters [37] Because temperature usually varies with light intensity, it is hard to separate the influence of light and temperature on fruit development, and high light intensities and temperatures might affect the metabolites of grape berries [38]. There are more fig fruits with lower acidity in the exterior canopy positions compared to the interior because high temperatures enhance fruit enlargement and decrease the acidity of fig juice [39]. d’Anjou pear fruit grown in high temperature parts of the canopy had a high fruit percentage blush, which was attributed to increased enzyme activity in the anthocyanin synthesis pathway caused by the high temperature [40]. Unfavorable temperatures and relative humidity levels could cause a significant reduction in mango yield [41]. It has also been reported that lower temperature and higher humidity positions within the apple tree canopy increase Ca transportation from the xylem to the fruit, which lead to a reduction in bitter pits and better fruit quality [42].
Previous research has provided appropriate pruning methods from the technology aspect [43,44], and proposed common tree shapes in C. oleifera cultivation [26,27]. On this basis, Duan et al. [19] studied the relationship between tree structure and light utilization. In their experience, open-center shape had a better effect on photosynthetic efficiency. Pan et al. [45] obtained the multiple linear regression equations between the four tree structure factors and yield. Most studies on C. oleifera tree structure only provided details about the correlation between tree structure and light, yield, respectively. However, information on fruit quality parameters’ correlations with the microclimates of different canopy shapes are not available. Our previous study has shown that the fruit quality parameters of C. oleifera have the greatest correlations with the canopy microclimates in January to February, July to September, and October [46]. In this study, we measured the light intensity, temperature, and relative humidity of different areas of open-center and round-head canopy shapes during different developmental periods (January to February, July to September, and October). In addition, the fruit quality parameters of the two canopy shapes were determined at maturity. The objectives of this study were (i) to obtain the reasons for differences in fruit quality parameters of different canopy shapes; (ii) to evaluate the correlations between microclimate and fruit quality parameters of different canopy shapes; (iii) to propose a reasonable tree structure in the production of C. oleifera.

2. Materials and Methods

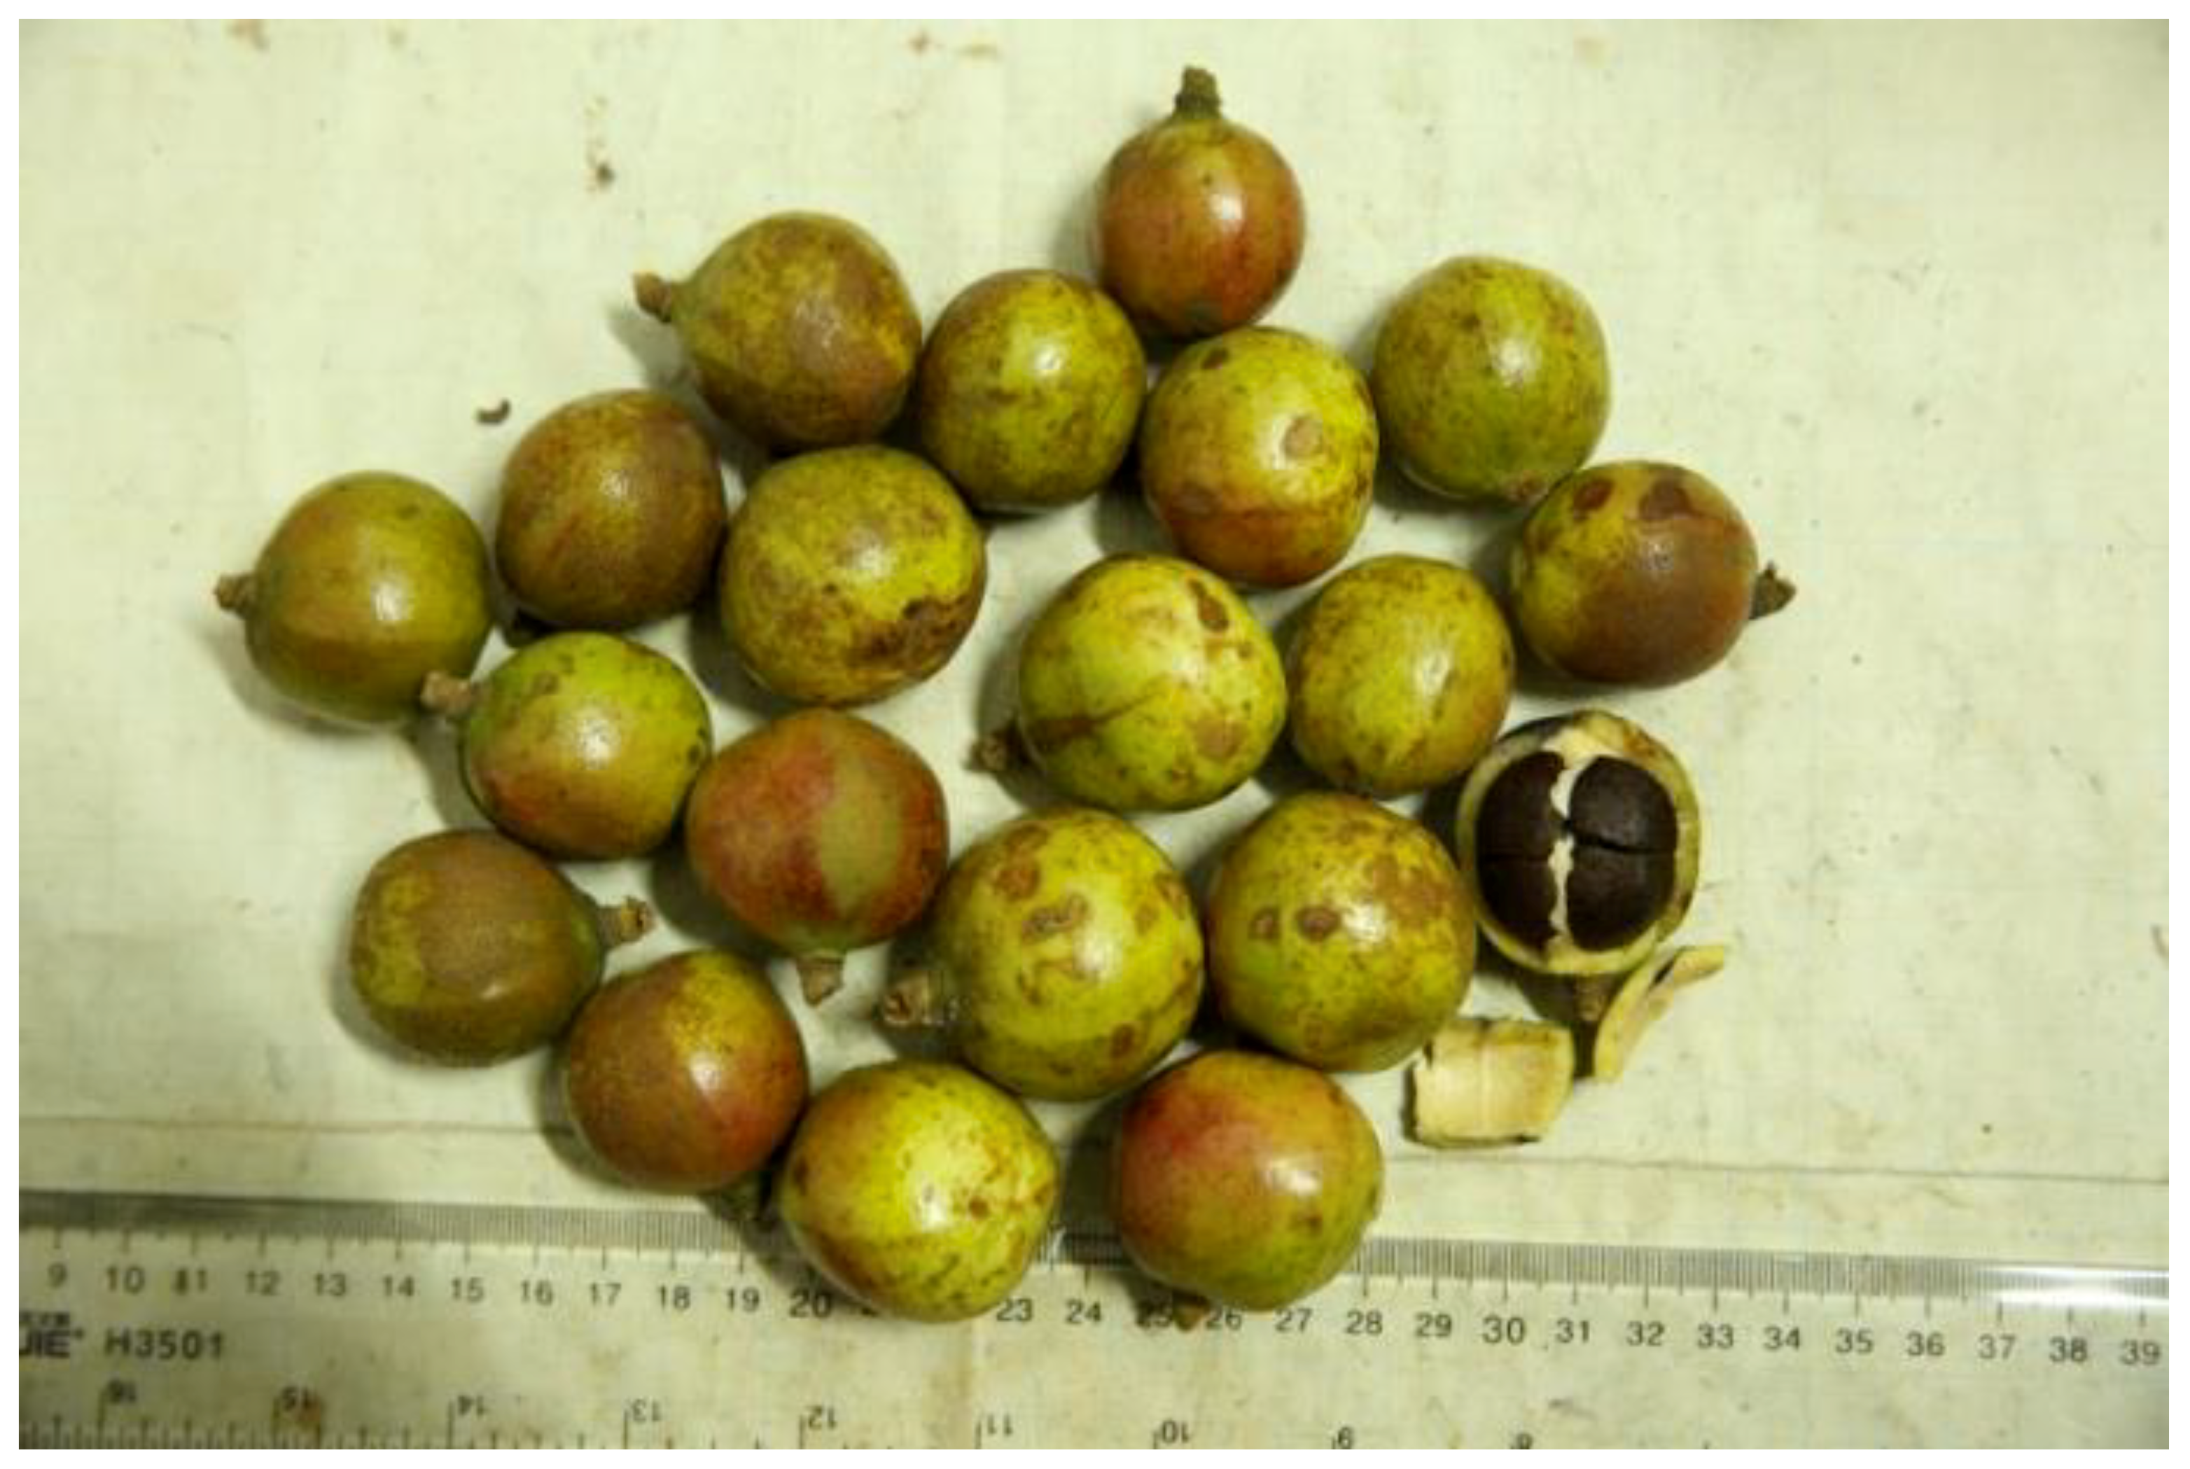
2.1. Experimental Site Description and Plant Materials

The clonal cultivar ‘Xiang Lin 27’ was planted in the National Oil-tea Camellia Engineering & Technology Research Center in Changsha, Hunan Province, China (28°14’24” N, 113°10’12” E, 80–100 m in altitude a.s.l.) which has a subtropical humid monsoon climate with a mean annual temperature of 16.8 °C and an average annual precipitation of 1455.5 mm. The climate and site conditions are suitable for the growth of C. oleifera, and the experiment site is inside of the natural distribution range of C. oleifera in China.
Trees were 1.3-m high, with a crown diameter of 2 m, spaced at 2 m × 2 m. Trees have entered the stable fruiting period with a stable round-head form (Figure 1a), and an annual fruit yield of 3750 kg per hectare. In general, the dormant period of C. oleifera is from January to February, during which new shoots have not started to grow. Flower bud differentiation starts in early May and lasts until the middle to the end of September [47]. Flowering lasts from approximately mid-October to the end of December. The ovary starts to swell in the middle of March, and fruits begin to develop. The fruit expansion and oil conversion stages are between April to June and July to September, respectively. Fruits have ripened in the middle of October [48]. The descriptions of fruit of ‘Xiang Lin 27’ C oleifera were as follows: capsule with thin skin, ovoid or globular shape, diameter 30–45 cm, ventricle 3–5, seeds usually 4–6, black brown and shiny seed. The fruit image of ‘Xiang Lin 27’ C oleifera was shown in Figure 2.
Six trees of similar size with no disease or pest problems were selected for this study, and they were grown under the same site conditions with the same growth vigor and canopy structure. Among the selected trees, three trees were pruned to the open-center shape (Figure 1b) on 20 December 2014, and the remaining three trees maintained the round-head shape.

2.2. Canopy Microclimate.

With the trunk serving as the center, each tree canopy was divided into four directions: south, west, north, and east (Figure 3a). Each crown was divided into horizontal and vertical directions as well. The horizontal direction was then divided into inner (0–50 cm from the center of the trunk) and outer (50–100 cm from the center of the trunk) canopies. In vertical direction, the canopy was considered to start at 30 cm from the base of the trunk, and every 50 cm was then deemed a layer (Figure 3b). The vertical direction was divided into two layers, the lower (0–50 cm) and upper (50–100 cm). There were 16 partitions in total. In each partition, 5 points were selected randomly to measure the microclimates, and the average of 5 points was used for representing the microclimates of the small area.
Light intensity, temperature, and relative humidity were measured every 7 days on wind-free and clear days during the different developmental periods of C. oleifera. The canopy microclimates in the different partitions (Figure 3) were recorded at fixed intervals throughout the observational days (8:00, 11:00, 14:00, and 17:00) and repeated three times at the regular time. Canopy microclimate was determined 4 days in a month, and the average of 4 days was used for the 1-month observational data. The averages of three replications were used to analyze the differences in microclimates of different canopy shapes in different periods. Light intensity was measured using LI-250 light meter (Li-COR, Inc.; Lincoln, NE, USA). Temperature and relative humidity were determined using a portable meteorograph (Kestrel 4000, Nielsen Kellerman, Boothwyn, PA, USA).

2.3. Fruit Quality Parameters

Fruits of open-center and round-head C. oleifera were picked on 20 October 2015 from the areas shown in Figure 3, when all fruits in each partition of the two canopy shapes have ripened. In each area, all the fruits were selected to determine the fruit quality parameters (fruit yield, fresh seed content ratio, dry seed content ratio, kernel percentage in the dry seed, and oil yield parameters—oil content ratio in the dry kernel, oil content ratio in the fresh fruit, oil yield). Fruit yield and oil yield represent fresh fruit yield and dry oil yield per volume of each divided partition in the canopy, respectively. The other fruit quality parameters were calculated using the following equations: fresh seed content ratio (%) = total mass of fresh seeds (g)/total mass of fresh fruit (g) × 100 %; dry seed content ratio (%) = total mass of dry seeds (g)/total mass of fresh fruit (g) × 100 %; kernel percentage in the dry seed (%) = total mass of dry kernel (g)/total mass of dry seeds (g) × 100 %; oil content ratio in the dry kernel = total mass of dry oil (g)/total mass of dry kernel (g) × 100 %; oil content ratio in the fresh fruit = total mass of dry oil (g) / total mass of fresh fruit (g) × 100 %.

2.4. Statistical Analysis

Differences in microclimates and fruit quality parameters of the different areas within the same canopy shape, and the differences in microclimates and fruit quality parameters among the different parts of two C. oleifera canopy shapes were all analyzed by t-tests using SPSS 18.0 (SPSS Inc., Chicago, IL, USA). Design expert (version 8.0) software (Stat-Ease Inc., Minneapolis, MN, USA) was used to draw the distributions of canopy microclimates during different developmental periods and the oil yield parameters in the upper and lower layers of two canopy shapes. Correlation coefficients and regression equations between the single microclimatic factor at different developmental stages and oil yield parameters of different C. oleifera canopy shapes were also established using SPSS.

3. Results

3.1. Effects of Canopy Shape on Fruit Quality Parameters

In the vertical direction, the open-center canopy had higher fruit yield parameters compared with the round-head shape (Table 1). There were significant differences in the other fruit yield-quality parameters, except for the fruit yield, between different canopy shapes, and canopy shape had the greatest effects on the oil content ratio in the fresh fruit and oil yield. The values of oil content ratio in the fresh fruit and oil yield in the lower layer of the open-center canopy were 1.59 and 1.79 times greater than those of the round-head shape, respectively. Furthermore, the effects of the canopy shape on the lower layer’s fruit quality parameters were more significant than on the upper layer. In addition, fruit quality parameters in the lower layer had significantly lower values when compared with those of the upper layer within the same canopy shape, and the differences in fruit quality parameters between the lower and upper layers of the open-center shape were lower than those of the round-head shape, with the greatest differences appearing in the oil yield, which was 3.83 and 2.28 times greater in the upper layer of the round-head and open-center canopies, respectively, than in the lower layer.
Horizontally, the open-center canopy improved the fruit quality parameters (Table 2) and had a more significant effect on fresh seed content ratio (FSR), kernel percentage in the dry seed (KPS), oil content ratio in the dry seed (ORS), oil content ratio in the fresh fruit (ORF), and oil yield (OY), which were 1.07, 1.09, 1.27, 1.42, and 1.55 times greater, respectively, in the inner areas than in the round-head canopy. Furthermore, the effects of the canopy shape on the fruit quality parameters of the inner canopy were more significant than the effects on the outer canopy. In addition, fruit quality parameters in the inner canopy had significantly lower values when compared with those of the outer canopy within the same canopy shape, and the differences in fruit quality parameters between the inner and outer canopies of the open-center shape were less than those of the round-head shape, and the greatest differences were in the oil yields, which were 1.60 and 1.34 times greater in the outer canopy of the round-head and open-center canopies, respectively, than in their inner canopies.
The fruit quality parameters in different areas within the same canopy shape were very different (Table 3). For both canopy shapes, the fruit quality parameters significantly decreased from the outer to the inner layer and from top to bottom, and all the fruit quality parameters in the outer canopy of the upper layer had the largest values when compared with the other areas, and the lowest values for fruit quality parameters appeared in the inner canopy of the lower layer. In addition, there were no significant differences in dry seed content ratio (DSR) and kernel percentage in the dry seed (KPS) between outer canopy of the lower layer and inner canopy of the upper layer within the open-center shape.
The oil yield parameters included the ORS, ORF, and OY, which decreased from the outer to inner and top to bottom within both the open-center and round-head canopy shapes (Figure 4). The oil yield parameters of the open-center canopy had greater values than those of the round-head canopy in the same layer, and the ranges of variations for oil yield parameters in the upper layer were smaller in the open-center canopy than in the round-head canopy. The ranges of ORS, ORF, and OY in the upper canopy of the open-center shape were nearly 28%–35%, 6.0%–9.4%, and 60–120 g·m−3, respectively, and they were 22%–37%, 3.8%–10.0%, and 36–110 g·m−3, respectively, in the upper canopy of the round-head shape. In addition, differences in oil yield parameters between open-center and round-head canopies in lower layers were greater than those in the upper layers, and the ranges of the oil content ratio in the dry seed, oil content ratio in the fresh fruit, and oil yield in the lower layer of the open-center were 24%–32%, 3.8%–8.3%, and 0–108 g·m−3, respectively, while in the round-head canopy they were 18%–28%, 2.0%–6.8%, and 0–75 g·m−3, respectively.

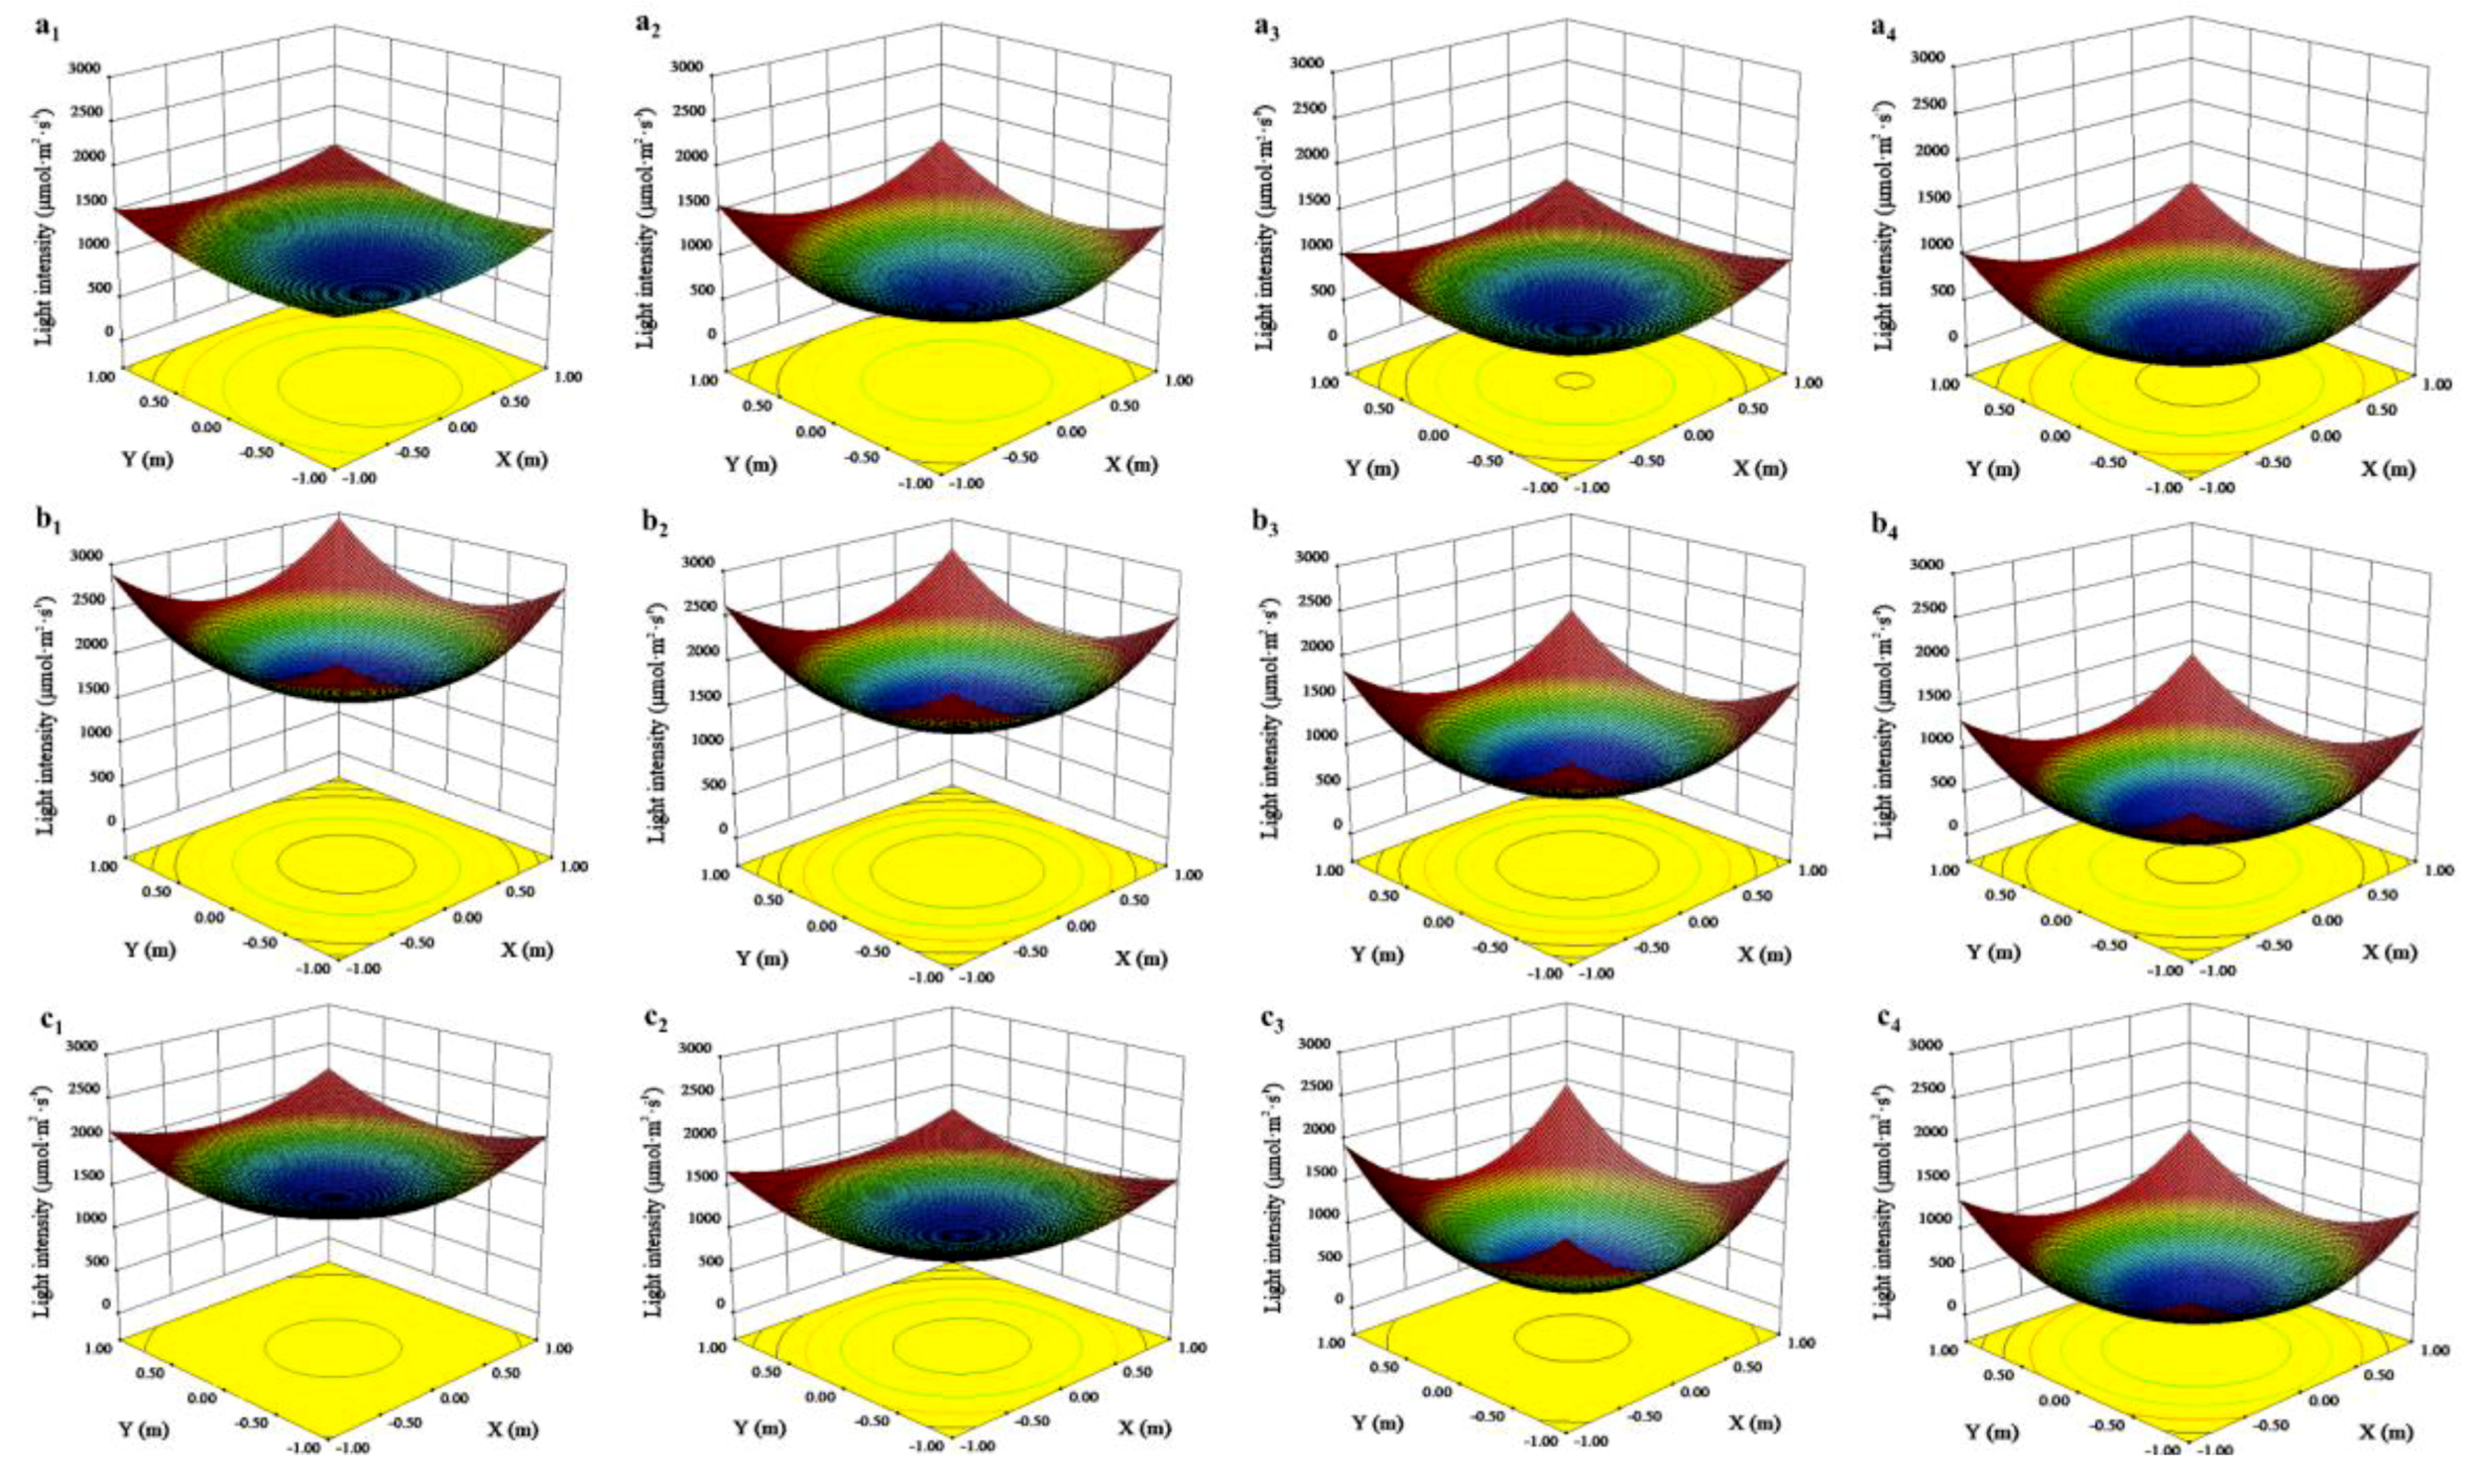
3.2. Effects of Canopy Shape on Microclimate

The light intensity and temperature in each area of the open-center canopy were greater than in the round-head canopy, while the relative humidity was lower (Table 4). At the same developmental stages, differences in these three microclimatic factors between different canopy shapes were more significant in the lower and inner parts when compared with the upper and outer parts, respectively, with the most obvious differences being in light intensity, which occurred between the two canopy shapes in both horizontal and vertical directions from July to September. The light intensity in the lower and inner parts of the open-center canopy from July to September increased by 77% and 65%, respectively, compared with the same area in the round-head canopy. The values of these microclimatic factors in the lower layer and inner canopy were significant greater when compared with those of the upper layer and outer canopy, respectively, within the same canopy shape, and the differences in microclimatic factors of different areas of the open-center shape were lower than those in the round-head shape, with the greatest difference also being in light intensity levels from July to September, which were 2.01 and 1.46 times greater in the upper layers of the round-head and open-center canopies, respectively, than in their lower layers. In addition, there were significant differences in canopy microclimate among different areas of the same canopy shape (Table 5). For both canopy shapes, light intensity and temperature significantly decreased from the outer to the inner layer and from top to bottom, but the relative humidity was of the opposite trend. Light intensity and temperature in the outer canopy of the upper layer had the largest values when compared with the other areas, and the lowest values for light intensity and temperature appeared in the inner canopy of the lower layer.
Light intensity and temperature had funnel distributions in both open-center and round-head canopy shapes and increased from the bottom to top and from the inner to outer canopy (Figure 5 and Figure 6), while relative humidity showed the reverse trend (Figure 7).
During the whole observational period, the light intensity levels in the same layers of the open-center canopy were greater than those in the round-head canopy, and the greatest light intensity values occurred from July to September, when the light intensity levels of the open-center and round-head canopies reached nearly 3000 and 2800 μmol·ms−1, respectively, in the upper layer, while the lowest light intensity occurred in the lower layers of the open-center and round-head canopies from January to February, when the variation ranges of light intensity were approximately 300–1050 and 0–1000 μmol·m2·s−1, respectively (Figure 5).
The temperature of the open-center canopy was greater than in the round-head canopy in the same layer during the same developmental period, with the highest temperatures occurring from July to September, when they were 32.20 and 31.00 °C in the upper layers of the open-center and round-head canopies, respectively (Figure 6). The lowest temperatures in the lower layers of the open-center and round-head canopies occurred from January to February, with variation ranges of 10.15–10.35 °C and 9.95–10.25 °C, respectively.
At the same developmental stage, the relative humidity in the upper layer of the open-center canopy was less than that of the round-head canopy, and a similar trend was observed in the lower layer (Figure 7). The relative humidity was greatest from July to September, reaching nearly 53.50% and 56.50% in the lower layers of the open-center and round-head canopies, respectively. The lowest relative humidity in the upper layers of the open-center and round-head canopies occurred from January to February, reaching 33.80%–34.20% and 33.80%–34.50%, respectively.

3.3. Correlations between Canopy Microclimates and the Oil Yield Parameters of Different Canopy Shapes

There were positive correlation coefficients between oil yield parameters and both light intensity and temperature during the different developmental periods within the open-center and round-head canopies, while the oil yield parameters were negatively correlated with relative humidity (Table 6). At the same developmental stages, the coefficients between oil yield parameters and both light intensity and temperature of the open-center canopy were lower than those of the round-head canopy. In addition, correlative coefficients between oil yield parameters and relative humidity from January to February and July to September in the open-center canopy were greater than those in the round-head canopy, while correlative coefficients between oil yield parameters and relative humidity in October in the open-center canopy were lower than in the round-head canopy.
Regression equations between a single microclimatic factor in different developmental periods and oil yield parameters of the two canopy shapes are shown in Table 7 (In Supplementary Materials), which also shows the suitable ranges of single microclimatic values during the different developmental periods. Although light intensity had the greatest correlation coefficients with oil yield parameters, the greatest R2 values of the regression equations between light intensity and oil yield parameters were not always observed. Table 8 showed optimum microclimatic conditions in different developmental periods of different canopy shapes, and the optimum light conditions for open-center and round-head canopy shapes were 916–1893 and 1108–1259 μmol·m2·s−1, respectively.

4. Discussion

4.1. Effects of Canopy Shape on Microclimate

Under certain natural environmental conditions, tree shape can affect canopy structure, and different canopy structures cause differences in filtering the microclimate, resulting in large differences in canopy light intensity, temperature, and relative humidity. In this study, compared with the round-head canopy shape, every area within the open-center canopy was subjected to more sunlight. This mainly resulted from the elimination overcrowding and undesirable branches from the middle part of the inner canopy. Consequently, there were smaller differences in the light intensity levels in different areas within the open-center canopy, indicating that the light was more uniformly distributed in the open-center canopy. Duan et al. [19] concluded that the open-center canopy shape increased the light transmission within the canopy of C. oleifera, and Jiang [27] found that the area of effective light in an open-center canopy shape (62.50%) for C. oleifera was greater than that of the round-head canopy shape (47.67%), which also indicated that there was a more desirable light condition in the open-center canopy. In peach trees, an open-center canopy has greater light penetration [49] and usually has 30%–50% full-sun exposure on the outer leaves (up to 3 to 4 feet deep) [50].
Because an open-center canopy receives more light than a round-head canopy, the temperature and relative humidity within the former are usually higher and lower, respectively [51,52]. Moreover, the differences in temperature and relative humidity among different areas within the round-head canopy were greater than in the open-center canopy, indicating that the temperature and relative humidity were more evenly distributed in the latter. This mainly results from the excessive branches and leaves in the round-head canopy, which decreases the air circulation in the lower and inner parts. Therefore, temperature and relative humidity in the round-head canopy were less affected by the external environment, while the open-center canopy had a greater air exchange between the microclimate inside the canopy and the external environment. This was consistent with a study by Tang et al. [49], who proposed that the open-center canopy shape provides desirable air ventilation in peach trees.
The microclimates within open-center and round-head canopy shapes varied with the developmental period, and the lowest light intensity and temperature values occurred from January to February because of the low solar radiation. However, strong solar radiation from July to October usually resulted in increased light intensity and temperature. In addition, the highest differences in temperature and relative humidity between the two canopy shapes occurred from July to September. This may result from too much rain in May and June, and the strong solar radiation between July and September, leading to an intense leaf transpiration with the high changes in temperature and relative humidity.
Additionally, 3D digital models obtained in this study could reflect the continuous distributions of microclimates in different parts of the open-center and round-head canopy shapes at different growth stages, and similar research exists on the spatial light distributions of other trees [53,54,55,56].

4.2. Effects of Canopy Shape on Fruit Quality Parameters

Tree shape has a large impact on the fruit quality parameters, except for fruit yield, which was different from the research of Jiang [27], in which the open-center canopy shape significantly increased the fruit yield compared with the round-head canopy shape, which might account for the differences in canopy partitioning. For both open-center and round-head canopies, fruit is mainly distributed in the outer and top parts, which is similar to previous studies [57], and the open-center shape could significantly increase the fruit quality parameters within the canopy. Furthermore, the effects of the canopy shape on fruit quality parameters in the lower layer and inner canopy were more significant compared with in the upper layer and outer canopy, respectively, and the spatial distributions for oil yield parameters also showed that the differences in oil yield parameters between open-center and round-head canopies in lower layers were greater than in the upper parts. Therefore, the open-center canopy had uniform high fruit quality parameters. In peach, fruit also has a uniform distribution in the different areas within the open-center canopy [57]. In addition, compared to the round-head canopy, the open-center canopy had a reasonable tree structure, with smaller numbers of branches and leaves, which reduces their nutrient consumption, leaving more nutrients for fruit development. This might also increase the fruit quality parameters. Therefore, the open-center canopy is appropriate for allowing fruit bearing at multiple levels and locations in C. oleifera. As young C. oleifera trees often grow quite vigorously with a strong need for proper pruning, the open-center canopy shape is an optimum form for obtaining high oil yield characteristics.

4.3. Correlations between Canopy Microclimates and the Oil Yield Parameters of Different Canopy Shapes

Dry matter formation of fruit is closely related to the transport, allocation, conversion, and metabolism of carbohydrates, which would affect the fruit yield and consequently influence the oil yield. Leaf is the main organ for carbohydrate production. The source–sink relationship could affect the dry matter producing and partitioning, and the supply capacity of source (leaf) plays an important role in source–sink relationship. Moreover, source supply capacity is closely related to the light intensity, and high light intensity and reasonable light distribution would promote leaves to produce more photosynthetic products and improve the fruit quality parameters. In general, better light distribution also means high uniform light intensity. In addition, previous studies also confirmed the importance of light environment for fruit yield and quality [58,59]. In Sapindus mukorossi, Zhang et al. [58] concluded that light intensity was the most highly correlated with oil yield among all the microclimate factors.
Because canopy shape had the greatest effects on oil yield parameters, the correlations between single microclimatic factors at different developmental stages and the oil yield parameters of different canopy shapes were established. In both canopy shapes, oil yield parameters were positively correlated with the light intensity and temperature, but negatively correlated with relative humidity. Furthermore, the greatest correlation coefficients with light intensity emphasized the large impact of light intensity on oil yield parameters. In addition, there were also high correlation coefficients between relative humidity and oil yield parameters, which differed from the study of Zhang et al. [58] in Sapindus mukorossi. This might be the result of the greater rainfall in the C. oleifera experimental field.
In this study, the light intensity values and temperatures in each area of the open-center canopy were greater than those of the round-head canopy, especially in the inner and lower canopy parts that always received less irradiance [60], while the relative humidity showed the opposite trend. Moreover, correlations between canopy microclimates and oil yield parameters in both canopy shapes also revealed that a high light intensity, high temperature, and low relative humidity increased the oil yield parameters. Therefore, the open-center canopy contributed to increasing oil yield parameters due to the more desirable microclimate, especially the light distribution, which was more important than light interception in improving fruit quality and productivity [61]. The light environment was the most important and direct factor influencing oil yield parameters because it plays crucial roles in the growth and development of fruit trees and crops [62,63], and sufficient sunshine favors photosynthesis, resulting in an increase in the light efficiency of C. oleifera [19]. According to Jiang [27], the leaf photosynthetic rate of C. oleifera within the open-center canopy was greater compared with that of the round-head canopy, which could provide more photosynthates for the growth of fruit, and might also facilitate assimilate accumulation, partitioning, and transportation [64], thereby improving the oil yield parameters and even resulting in a high C. oleifera oil yield. Hao [26] found that the open-center canopy also produces advantageous leaf parameters that improve the photosynthetic capabilities of Camellia saplings. Acebedo et al. [65] reported that well illuminated canopy areas had more intense vegetative growth, more inflorescences and fertile flowers, greater fruit set, and heavier fruit, resulting in producing more olive oil. In contrast, the lower light intensity provided by the round head canopy shape appeared to limit the olive oil content as proposed by Cherbiy-Hoffmann et al. [66], and the poor light condition also reduced photosynthetic capacity, which may be partially responsible for the decrease in olive oil synthesis [65]. Tombesi et al. [67] also found poor light caused low olive oil content, and they attributed this to the reduced pulp/stone relation in a limited light condition. In addition, at the same developmental stage, correlation coefficients between the oil yield parameters and both light intensity and temperature of the round-head canopy were greater than those of the open-center canopy, indicating that the light intensity and temperature of the round-head canopy had closer correlations with the oil yield parameters. Thus, slight changes in light intensity and temperature within the round-head canopy may affect the oil yield parameters.
Regression equations between single microclimatic factors during different developmental periods and the oil yield parameters in two C. oleifera canopy shapes may be used to evaluate their oil yield parameters. Furthermore, from the regression equations of these three developmental periods, it may seem obvious that the regression coefficients of temperature and relative humidity between January and February for both canopy shapes were higher than those of the other two developmental periods; however, the regression coefficients of light intensity between July to October were higher than those between January and February. This indicated that the temperature and relative humidity mainly affected the oil yield parameters during January and February (dormant period), and the light intensity between July to October (Oil conversion and mature periods) had a significant impact on fruit development. Oil conversion period being accompanied by an active metabolic physiology [68], with an ever-growing demand for assimilates resulting in high levels of photosynthesis-related characteristics [69], which contribute to an increased level of chemical energy in the form of carbohydrates and other organic compounds for oil formation [70]. Therefore, higher light intensity during the oil conversion and mature stages, between July to October, which might promoted assimilate transportation, partitioning, and accumulation within the open-center canopy. The relationships between light and flowing, fruiting have been studied widely, and linear equations were used commonly. Jung studied the relationship between light penetration and flower bud density of ‘Fuji’ apple trees in an orchard as affected by tree training system by using linear equation [16]. In our study, we used the second-grade equations between oil-yield parameters and single microclimate factor of two canopy shapes to obtain the suitable microclimate. Further studies on the deep biological meaning would be conducted in our future work. In addition, some researchers also take a similar approach to establish similar fitted equation. He et al. [57] established the regression analysis of relationships between relative canopy light intensity and quality factors of peach fruit, and found the optimum microclimate values for the quality factors of peach fruit. Zhang et al [58] also used the optimal regression equations to show the suitable microclimate conditions for the growth and development of Sapindus mukorossi Gaertn. Additionally, although temperature and relative humidity could also affect the oil yield parameters of differently shaped C. oleifera, it is not clear how temperature and humidity influenced the oil yield parameters, which needs to be further studied.
Since fruit quality parameters which involve flower development and fruit setting are influenced by the canopy microclimate, the relationship between microclimate and flowering and fruiting mechanisms of different canopy shapes will be studied in our next work.

5. Conclusions

Our study demonstrated that the microclimate and fruit quality parameters within the canopy can be affected by tree shape. The open-center canopy shape of C. oleifera had a greater light intensity and temperature, and a lower relative humidity throughout the whole tree canopy compared with that of the round head canopy shape; moreover, the open-center canopy had a more uniform microclimate distribution. Compared with the round-head canopy, the more desirable microclimatic conditions and uniform microclimate distribution within the open-center canopy, especially the light intensity, contributed to high and uniform fruit quality parameters. Therefore, open-center canopy is an optimal tree shape in C. oleifera production. In addition, regression equations between single canopy microclimatic factors and the oil yield parameters in various developmental periods may be used to evaluate the latter in the two canopy shapes. The optimum light conditions for open-center and round-head canopy shapes were 916–1893 and 1108–1259 μmol·m2·s−1, respectively.

Supplementary Materials

The following are available online at https://www.mdpi.com/1999-4907/10/7/563/s1.

Author Contributions

S.S. conceived the structure and idea of the paper. X.W. participated in the selection of experimental materials. S.Y. and Y.Z. was involved in collecting data. Y.W. took charge of data processing, data analysis, and writing the paper. L.M. and L.Z. contributed to text revisions.

Funding

This work was supported by the National Key R&D Program Project Funding (2018YFD1000603).

Conflicts of Interest

The authors declare that they have no conflict of interest.

References

  1. Xia, E.; Jiang, J.; Huang, H.; Zhang, L.; Zhang, H.; Gao, L. Transcriptome analysis of the oil-rich tea plant, Camellia oleifera, reveals candidate genes related to lipid metabolism. PLoS ONE 2014, 9, e104150. [Google Scholar] [CrossRef] [PubMed]
  2. Long, Z.; Wang, D. Chemical constituents of olive oil and from Camellia oleifera seed oil. J. Chin. Cereals Oils Assoc. 2008, 23, 121–123. [Google Scholar]
  3. Ma, J.; Ye, H.; Rui, Y.; Chen, G.; Zhang, N. Fatty acid composition of Camellia oleifera oil. J. Verbrauch Lebensm 2011, 6, 9–12. [Google Scholar] [CrossRef]
  4. Singh, S.; Singh, S.; Sharma, R. Pruning alters fruit quality of mango cultivars (Mangifera indica L.) under high density planting. J. Trop. Agric. 2010, 48, 55–57. [Google Scholar]
  5. Singh, S.; Singh, S.; Sharma, R.; Patel, V. Influence of pruning intensity on flowering, fruit yields and floral malformation in three mango cultivars planted under high density. Indian J. Hortic. 2010, 67, 84–89. [Google Scholar]
  6. Li, K.; Lakso, A.; Piccioni, R.; Robinson, T. Summer pruning effects on fruit size, fruit quality, return bloom and fine root survival in apple trees. J. Hortic. Sci. Biotechnol. 2003, 78, 7. [Google Scholar] [CrossRef]
  7. Li, K.; Lasko, A. Photosynthesis characteristics of apple spur leaves after summer pruning to improve exposure to light. Hortscience 2004, 39, 969–972. [Google Scholar] [CrossRef]
  8. Calatayud, A.; Roca, D.; Gorbe, E.; Martínez, P.F. Light acclimation in rose (Rosa hybrida cv. Grand Gala) leaves after pruning: Effects on chlorophyll a fluorescence, nitrate reductase, ammonium and carbohydrate. Sci. Hortic. 2007, 111, 152–159. [Google Scholar] [CrossRef]
  9. Hanson, E.; Hancock, J.; Ramsdell, D.; Schilder, A.; Vanee, G.; Ledebuhr, R. Sprayer type and pruning affect the incidence of blueberry fruit rots. Hortscience 2000, 35, 235–238. [Google Scholar] [CrossRef]
  10. Cooley, D.; Autio, W. Summer pruning of apple: impacts on disease management. Adv. Hortic Sci 2011, 25, 199–204. [Google Scholar]
  11. Yi, K. Scientific pruning of Camellia oleifera. Hunan For. Sci. Technol. 2003, 30, 1–64. [Google Scholar]
  12. Robinson, T.; Lakso, A.; Ren, Z. Modifying apple tree canopies for improved production efficiency. HortScience 1991, 26, 1005–1012. [Google Scholar] [CrossRef]
  13. Cheng, X.; Liao, K.; Li, N.; Zhao, S.; Sun, H.; Mansur, N.; Liu, J. Analysis on the composition and structure of branches of two kinds of tree shapes in Korla fragrant pear. Agric. Sci. Tech. 2013, 14, 954–958. [Google Scholar]
  14. Tukiran, J.; Ariffin, J.; Ghani, A. Cooling effects of two types of tree canopy shape in Penang, Malaysia. Int. J. Geomate 2016, 11, 2275–2283. [Google Scholar] [CrossRef]
  15. Kappel, K.; Brownlee, R. Early performance of ‘Conference’ pear on four training systems. Hortscience 2001, 36, 69–71. [Google Scholar] [CrossRef]
  16. Jung, S.; Choi, H. Light penetration, growth, and fruit productivity in ‘Fuji’ apple trees trained to four growing systems. Sci. Hortic. 2010, 125, 672–678. [Google Scholar] [CrossRef]
  17. Lordan, J.; Francescatto, P.; Dominguez, L.; Robinson, T. Long-term effects of tree density and tree shape on apple orchard performance, a 20 year study-part 1, agronomic analysis. Sci. Hortic. 2018, 238, 303–317. [Google Scholar] [CrossRef]
  18. Sobierajski, G.; Silva, T.; Hernandes, J.; Pedro Júnior, M. Y-shaped and fruiting wall peach orchard training system in subtropical Brazil. Available online: http://www.scielo.br/scielo.php?pid=S0006-87052019005007102&script=sci_arttext (accessed on 12 November 2018).
  19. Duan, W.; Yuan, D.; Gao, C.; Gong, C.; Lei, X.; Liao, T. Relationship between tree composition and light utilization of Camellia oleifera. For. Res. 2013, 26, 118–122. [Google Scholar]
  20. Siles, P.; Vaast, P.; Dreyer, E.; Harmand, J. Rainfall partitioning into throughfall, stemflow and interception loss in a coffee (Coffea arabica L.) monoculture compared to an agroforestry system with Inga densiflora. J. Hydrol. 2010, 395, 39–48. [Google Scholar] [CrossRef]
  21. Marini, R.; Marini, M. Seasonal changes in specific leaf weight, net photosynthesis, and chlorophyll content of peach leaves as affected by light penetration and canopy position. J. Am. Soc. Hortic. Sci. 1983, 108, 600–605. [Google Scholar]
  22. Zhang, S.; Li, B.; Liu, Y.; Zhang, L.; Wang, Z.; Han, M. Fractal characteristics of two-dimensional images of ‘Fuji’ apple trees trained to two tree configurations after their winter pruning. Sci. Hortic. 2011, 130, 102–108. [Google Scholar] [CrossRef]
  23. Gao, Z.; Zhao, C.; Cheng, J.; Zhang, X. Tree structure and 3-D distribution of radiation in canopy of apple trees with different canopy structures in china. Chin. J. Eco-Agric. 2012, 20, 63–68. [Google Scholar] [CrossRef]
  24. Gao, Z.; Li, Z. Light use efficiency distribution as a function of different tree shapes in apple. J. Anim. Plant. Sci. 2015, 25, 247–253. [Google Scholar]
  25. Middleton, S.; McWaters, A. Increasing the yield and fruit quality of Australian apple orchards; Horticulture Australia Ltd.: Sydney, Australia, 2001. [Google Scholar]
  26. Hao, J. The Effect of Topiary Work on the Growth Characteristics and Photosynthetic Physiology of Camellia Sapling. Master’s Thesis, Jiangxi Agricultural University, Nanchang, China, 2011. [Google Scholar]
  27. Jiang, Z. The Research on Classification Transformation Technology of Low Yield Stands of Camellia oleifera. Master’s Thesis, Central South University of Forestry and Technology, Changsha, China, 2012. [Google Scholar]
  28. Franck, N.; Vaast, P.; Ge´nard, M.; Dauzat, J. Soluble sugars mediate sink feedback down–regulation of leaf photosynthesis of Coffea arabica in the field. Tree Physiol 2006, 26, 517–525. [Google Scholar] [CrossRef] [PubMed]
  29. Siles, P.; Harmand, J.; Vaast, P. Effects of Inga densiflora, on the microclimate of coffee (Coffea arabica L.) and overall biomass under optimal growing conditions in Costa Rica. Agrofor. Syst. 2010, 78, 269–286. [Google Scholar] [CrossRef]
  30. Proietti, P.; Nasini, L.; Famiani, F.; Guelfi, P.; Standardi, A. Influence of light availability on fruit and oil characteristics in Olea europaea L. Acta Hortic. 2012, 949, 243–250. [Google Scholar] [CrossRef]
  31. Schaffer, B.; Gaye, G. Effect of pruning on light interception, specific leaf density, leaf chlorophyll content of mango. Sci. Hortic. 1989, 41, 55–61. [Google Scholar] [CrossRef]
  32. Cain, J. Effects of mechanical pruning of apple hedgerows with a slotting saw on light penetration and fruiting. J. Am. Soc. Hortic. Sci. 1971, 96, 664–667. [Google Scholar]
  33. Seeley, E.; Micke, W.; Kammereck, R. ‘Delicious’ apple fruit size and quality as influenced by radiant flux density in the immediate growing environment. J. Am. Soc. Hortic. Sci. 1980, 109, 19–24. [Google Scholar]
  34. Hunter, J.; Volschenk, C.; Zorer, R. Vineyard row orientation of Vitis vinifera, L. cv. Shiraz/101-14 Mgt: Climatic profiles and vine physiological status. Agric. For. Meteorol. 2016, 228–229, 104–119. [Google Scholar] [CrossRef]
  35. Lombard, P.; Westwood, N. Effect of hedgerow orientation on pear fruiting. Acta Hort. 1977, 69, 175–182. [Google Scholar] [CrossRef]
  36. Khemira, H.; Lombard, P.; Sugar, D.; Azarenko, A. Hedgerow orientation affects canopy exposure, flowering and fruiting of ‘Anjou’ pear trees. HortScience 1993, 28, 984–987. [Google Scholar] [CrossRef]
  37. Hatfield, J.; Prueger, J. Temperature extremes: effect on plant growth and development. Weather Clim. Extrem. 2015, 10, 4–10. [Google Scholar] [CrossRef]
  38. Feng, H.; Yuan, F.; Skinkis, P.; Qian, M. Influence of cluster zone leaf removal on Pinot noir grape chemical and volatile composition. Food Chem. 2015, 173, 414–423. [Google Scholar] [CrossRef] [PubMed]
  39. Trad, M.; Gaaliche, B.; Renard, C.; Mars, M. Inter-and intra-tree variability in quality of figs. Influence of altitude, leaf area and fruit position in the canopy. Sci. Hortic. 2013, 162, 49–54. [Google Scholar] [CrossRef]
  40. Zhang, J.; Serra, S.; Leisso, R.; Musacchi, S. Effect of light microclimate on the quality of ‘d’Anjou’ pears in mature open-centre tree architecture. Biosyst. Eng. 2016, 141, 1–11. [Google Scholar] [CrossRef]
  41. Sharma, R.; Singh, R. Pruning intensity modifies canopy microclimate, and influences sex ratio, malformation incidence and development of fruited panicles in ‘Amrapali’ mango (Mangifera indica L.). Sci. Hortic. 2006, 109, 118–122. [Google Scholar] [CrossRef]
  42. Amarante, C.; Steffens, C.; Argenta, L. Yield and fruit quality of ‘Gala’ and ‘Fuji’ apple trees protected by white anti-hail net. Sci. Hortic. 2011, 129, 79–85. [Google Scholar] [CrossRef]
  43. Tan, H.; Liu, S.; Yang, X. Shaping and pruning of Camellia oleifera. For. Chin. 2009, 1, 57. [Google Scholar]
  44. Liu, J. Shaping and pruning techniques for high yield Camellia oleifera. Mod. Hortic. 2017, 21, 73. [Google Scholar]
  45. Pan, H.; Liu, J.; Zhou, G. Study on relationship between the tree composition and yield of Camellia oleifera. J. Jiangxi Agric. Univ. 2011, 33, 58–62. [Google Scholar]
  46. Wen, Y.; Su, S.; Ma, L.; Yang, S.; Wang, Y.; Wang, X. Effects of canopy microclimate on fruit yield and quality of Camellia oleifera. Sci. Hortic. 2018, 235, 132–141. [Google Scholar]
  47. Yuan, D.; Zhou, F.; Tan, X.; He, C.; Yuan, J.; Fan, X. Flower bud differentiation and development of male and female gametophytes in Camellia oleifera. J. Cent. South. Univ. For. Technol. 2011, 31, 65–70. [Google Scholar]
  48. Wang, X. Research on Phenology and Blossom Biology Of Oil-Tea Camellia. Master’s Thesis, Central South University of Forestry and Technology, Changsha, China, 2011. [Google Scholar]
  49. Tang, L.; Hou, C.; Huang, H.; Chen, C.; Zou, J. Light interception efficiency analysis based on three-dimensional peach canopy models. Ecol. Inform. 2015, 30, 60–67. [Google Scholar] [CrossRef] [Green Version]
  50. Marini, R.P. Pruning Peach Trees. Available online: https://www.pubs.ext.vt.edu/422/422-020/422-020.html (accessed on 12 October 2018).
  51. Foley, J.; Costa, M.; Delire, C.; Ramankutty, N.; Snyder, P. Green surprise? How terrestrial ecosystems could affect earth’s climate. Front. Ecol. Environ. 2003, 1, 38–44. [Google Scholar]
  52. Fouché, J.; Roberts, S.; Midgley, S.; Steyn, W. Peel color and blemishes in ‘Granny Smith’ apples in relation to canopy light environment. Hortscience 2010, 45, 899–905. [Google Scholar]
  53. Sinoquet, H.; Roux, X.; Adam, B.; Ameglio, T.; Daudet, F. RATP: A model for simulating the spatial distribution of radiation absorption, transpiration and photosynthesis within canopies: application to an isolated tree crown. Plant. Cell Environ. 2010, 24, 395–406. [Google Scholar] [CrossRef]
  54. Xue, H.; Han, Y.; Li, Y.; Wang, G. Spatial distribution of light interception by different plant population densities and its relationship with yield. Field Crops Res. 2015, 184, 17–27. [Google Scholar] [CrossRef]
  55. Connor, D.; Gómez-del-Campo, M.; Trentacoste, E. Relationships between olive yield components and simulated irradiance within hedgerows of various row orientations and spacings. Sci. Hortic. 2016, 198, 12–20. [Google Scholar] [CrossRef]
  56. Kim, J.; Lee, J.; Ahn, T.; Shin, J.; Park, K.; Son, J. Sweet pepper (Capsicum annuum L.) canopy photosynthesis modeling using 3D plant architecture and light ray-tracing. Front. Plant. Sci. 2016, 7, 1321. [Google Scholar] [CrossRef]
  57. He, F.; Wang, F.; Wei, Q.; Wang, X.; Zhang, Q. Relationships between the distribution of relative canopy light intensity and the peach yield and quality. Agric. Sci. Chin. 2008, 7, 297–302. [Google Scholar] [CrossRef]
  58. Zhang, Y.; Wen, Y.; Bai, Q.; Ma, Z.; Ye, H.; Su, S. Spatio-temporal effects of canopy microclimate on fruit yield and quality of Sapindus mukorossi Gaertn. Sci. Hortic. 2019, 251, 136–149. [Google Scholar] [CrossRef]
  59. Gao, Y.; Gao, S.; Jia, L.; Dai, T.; Wei, X.; Duan, J.; Liu, S.; Weng, X. Canopy characteristics and light distribution in Sapindus mukorossi, Gaertn. Are influenced by crown architecture manipulation in the hilly terrain of southeast china. Sci. Hortic. 2018, 240, 11–22. [Google Scholar] [CrossRef]
  60. Yuri, J.; Ibarra-Romero, M.; Vásquez, J.; Lepe, V.; González-Talice, J.; del Pozo, A. Reduction of apple tree height (Malus domestica borkh) cv. Ultra-Red Gala/MM111 does not decrease fruit yield and quality. Sci. Hortic. 2011, 130, 191–196. [Google Scholar] [CrossRef]
  61. Lauri, P.; Costes, E.; Regnard, J.; Brun, L.; Simon, S.; Monney, P.; Sinoquet, H. Does knowledge on fruit tree architecture and its implications for orchard management improve horticultural sustainability? An overview of recent advances in the apple. Acta Hortic. 2009, 817, 243–250. [Google Scholar] [CrossRef]
  62. Walcroft, A.; Roux, L.; Diaz-Espejo, A.; Dones, N.; Sinoquet, H. Effects of crown development on leaf irradiance, leaf morphology and photosynthetic capacity in a peach tree. Tree Physiol. 2002, 22, 929–938. [Google Scholar] [CrossRef]
  63. Agele, S.; Maraiyesa, I.; Adeniji, I. Effects of variety and row spacing on radiation interception, partitioning of dry matter and seed set efficiency in late season sunflower (Helianthus annuus L.) in a humid zone of Nigeria. Afr. J. Agric. Res. 2007, 2, 80–88. [Google Scholar]
  64. Yuan, J.; Shi, B.; Wu, Z.; Tang, X. Response of fruit quality and leaf photosynthesis to different sink-source relationships in Camellia oleifera. Plant. Physiol. J. 2015, 51, 1287–1292. [Google Scholar]
  65. Acebedo, M.; Cuevas, J.; Cañete, M. Processes affecting fruit distribution and its quality in the canopy of olive trees. Adv. Hortic. Sci. 2000, 14, 169–175. [Google Scholar]
  66. Cherbiy-Hoffmann, S.; Searles, P.; Hall, A.; Rousseaux, M. Influence of light environment on yield determinants and components in large olive hedgerows following mechanical pruning in the subtropics of the Southern Hemisphere. Sci. Hortic. 2012, 137, 36–42. [Google Scholar] [CrossRef]
  67. Tombesi, A.; Cartechini, A. L’effetto dell’ombreggiamento della chioma sulla differenziazione delle gemme a fiore dell’olivo. Riv. Di Ortoflorofrutti. It. 1986, 70, 277–285. [Google Scholar]
  68. Zhou, C.; Yao, X.; Lin, P.; Lu, J. Growth characteristics and dynamic analysis of water and oil content on oil-tea Camellia fruit. J. Yangzhou Univ. 2013, 34, 49–53. [Google Scholar]
  69. He, Y. Studies on Photosynthetic Characteristics of Oil-Tea Camellia Clones at the Fat Conversation Period of Fruit. Master’s Thesis, Central South University of Forestry and Technology, Changsha, China, 2010. [Google Scholar]
  70. Lestari, R.; Ebert, G.; Huyskenskeil, S. The effect of light and water supply on growth, net CO2 assimilation rate and mineral content of Salak (Salacca zalacca (Gaertn.) Voss) Seedlings. Int. J. Biol. 2011, 3, 94–104. [Google Scholar] [CrossRef]
Figure 1. Different Camellia oleifera canopy shapes. (a) Round-head shape; (b) open-center shape.
Forests 10 00563 g001
Figure 2. Fruit image of ‘Xiang Lin 27’ Camellia oleifera.
Forests 10 00563 g002
Figure 3. Top and lateral views of Camellia oleifera canopy partitions. N, north; E, east; S, south; and W, west. (a) Top view; (b) lateral view.
Forests 10 00563 g003
Figure 4. Oil yield parameter distributions in different layers of open-center and round-head canopies. ORS, oil content ratio in the dry seed; ORF, oil content ratio in the fresh fruit; OY, oil yield. The X-axis shows the distance in east (+) and west (−) directions from the trunk. The Y-axis shows the distance in south (+) and north (−) directions from the trunk. Lowercases a, b, and c indicate the different development periods, January to February, July to September, and October, respectively. Subscripts 1, 2, 3, and 4 indicate the different canopy layer, upper layer of open-center canopy, upper layer of round-head canopy, lower layer of open-center canopy, and lower layer of round-head canopy, respectively.
Forests 10 00563 g004
Figure 5. Light intensity distributions in different layers of open-center and round-head canopy shapes during the different developmental periods. The X-axis shows the distance in east (+) and west (−) directions from the trunk. The Y-axis shows the distance in south (+) and north (−) directions from the trunk. Lowercases a, b, and c indicate the different development periods, January to February, July to September, and October, respectively. Subscripts 1, 2, 3, and 4 indicate the different canopy position, upper layer of open-center canopy, upper layer of round-head canopy, lower layer of open-center canopy, and lower layer of round-head canopy, respectively.
Forests 10 00563 g005
Figure 6. Temperature distributions in different layers of open-center and round-head canopy shapes during the different developmental periods. The X-axis shows the distance in east (+) and west (−) directions from the trunk. The Y-axis shows the distance in south (+) and north (−) directions from the trunk. Capitals A, B, and C indicate the different development periods, January to February, July to September, and October, respectively. Subscripts 1, 2, 3, and 4 indicate the different canopy position, upper layer of open-center canopy, upper layer of round-head canopy, lower layer of open-center canopy, and lower layer of round-head canopy, respectively.
Forests 10 00563 g006
Figure 7. Relative humidity distributions in different layers of open-center and round-head canopy shapes during the different developmental periods. The X-axis shows the distance in east (+) and west (−) directions from the trunk. The Y-axis shows the distance in south (+) and north (−) directions from the trunk. Capitals A, B, and C indicate the different development periods, January to February, July to September, and October, respectively. Subscripts 1, 2, 3, and 4 indicate the different canopy position, upper layer of open-center canopy, upper layer of round-head canopy, lower layer of open-center canopy, and lower layer of round-head canopy, respectively.
Forests 10 00563 g007
Table 1. Differences in fruit quality parameters in vertical directions of different Camellia oleifera canopy shapes.
PositionFruit Quality ParameterOpen CenterRound HeadSignificance
Lower layerFY (g·m−3)646.17 ± 39.81575.08 ± 36.71NS
Upper layer1048.83 ± 15.401072.19 ± 10.45NS
Significance **
Lower layerFSR (%)50.23 ± 1.8147.83 ± 1.76NS
Upper layer55.76 ± 0.8853.82 ± 0.80*
Significance **
Lower layerDSR (%)45.59 ± 0.3241.20 ± 0.29*
Upper layer47.41 ± 0.2647.50 ± 0.25NS
Significance **
Lower layerKPS (%)48.92 ± 0.4642.85 ± 0.32*
Upper layer51.70 ± 0.7150.52 ± 0.62NS
Significance **
Lower layerORS (%)28.91 ± 0.7220.14 ± 0.71*
Upper layer31.34 ± 0.8129.42 ± 0.51*
Significance **
Lower layerORF (%)5.48 ± 0.153.44 ± 0.10*
Upper layer7.70 ± 0.337.07 ± 0.31NS
Significance **
Lower layerOY (g·m−3)35.41 ± 5.9719.78 ± 3.67*
Upper layer80.76 ± 4.0375.80 ± 2.65*
Significance **
FY, fruit yield; FSR, fresh seed content ratio; DSR, dry seed content ratio; KPS, kernel percentage in the dry seed; ORS, oil content ratio in the dry seed; ORF, oil content ratio in the fresh fruit; OY, oil yield. Data are presented as means ± standard deviations; Significance in a row represents the differences in fruit quality parameters of the same areas within the different canopy shapes; Significance in a column represents the differences in fruit quality parameters of different areas within the same canopy shape; “*” indicates significance at p ≤ 0.05; NS, not significant.
Table 2. Differences in fruit quality parameters in horizontal directions of different Camellia oleifera canopy shapes.
PositionFruit Quality Parameter Open CenterRound HeadSignificance
Inner canopyFY (g·m−3)771.40 ± 27.66703.48 ± 15.20*
Outer canopy923.60 ± 33.12943.79 ± 31.20NS
Significance **
Inner canopyFSR (%)52.43 ± 0.9049.09 ± 0.89*
Outer canopy55.43 ± 0.7952.56 ± 0.71*
Significance **
Inner canopyDSR (%)45.49 ± 0.3141.73 ± 0.30*
Outer canopy47.53 ± 0.3446.98 ± 0.37NS
Significance **
Inner canopyKPS (%)49.14 ± 0.4445.15 ± 0.31*
Outer canopy51.59 ± 0.4648.22 ± 0.39*
Significance **
Inner canopyORS (%)30.24 ± 0.7823.75 ± 0.43*
Outer canopy30.98 ± 0.3124.81 ± 0.29*
Significance NS*
Inner canopyORF (%)6.79 ± 0.114.79 ± 0.09*
Outer canopy7.60 ± 0.165.72 ± 0.14*
Significance **
Inner canopyOY (g·m−3)52.38 ± 4.1433.70 ± 3.17*
Outer canopy70.19 ± 5.3053.98 ± 4.37*
Significance **
FY, fruit yield; FSR, fresh seed content ratio; DSR, dry seed content ratio; KPS, kernel percentage in the dry seed; ORS, oil content ratio in the dry seed; ORF, oil content ratio in the fresh fruit; OY, oil yield. Data are presented as means ± standard deviations; Significance in a row represents the differences in fruit quality parameters of the same areas within the different canopy shapes; Significance in a column represents the differences in fruit quality parameters of different areas within the same canopy shape; “*” indicates significance at p ≤ 0.05; NS, not significant.
Table 3. Fruit quality parameters in different areas within the same Camellia oleifera canopy shape.
Fruit Quality ParameterOpen CenterRound Head
LILOUIUOLILOUIUO
FY (g·m−3)545.70 ± 21.22 d746.64 ± 13.16 c997.1 ± 17.21 b1100.56 ± 13.22 a441.62 ± 12.10 d708.54 ± 10.12 c965.34 ± 21.14 b1061.04 ± 13.22 a
FSR (%)49.91 ± 0.40 d50.55 ± 0.21 c54.95 ± 0.54 b55.91 ± 0.41 a45.62 ± 0.61 d50.04 ± 0.60 c52.56 ± 0.71 b55.08 ± 0.27 a
DSR (%)45.01 ± 0.31 c46.17 ± 0.50 b45.97 ± 0.45 b48.89 ± 0.70 a36.39 ± 0.28 d46.01 ± 0.20 c46.53 ± 0.31 b48.47 ± 0.20 a
KPS (%)47.30 ± 0.31 c50.54 ± 0.23 b50.76 ± 0.22 b52.64 ± 0.60 a40.37 ± 0.41 d45.33 ± 0.77 c49.93 ± 0.37 b51.11 ± 0.31 a
ORS (%)28.54 ± 0.40 d29.28 ± 0.30 c31.94 ± 0.31 b32.68 ± 0.40 a19.66 ± 0.62 d22.09 ± 0.38 c27.55 ± 0.54 b30.29 ± 0.38 a
ORF (%)5.32 ± 0.12 d6.23 ± 0.20 c7.31 ± 0.33 b7.92 ± 0.20 a3.41 ± 0.14 d5.12 ± 0.18 c6.69 ± 0.23 b7.29 ± 0.21 a
OY (g·m−3)21.94 ± 2.11 d48.88 ± 4.32 c76.12 ± 3.20 b84.21 ± 3.77 a10.66 ± 2.14 d33.32 ± 3.01 c60.49 ± 4.14 b78.21 ± 1.02 a
FY, fruit yield; FSR, fresh seed content ratio; DSR, dry seed content ratio; KPS, kernel percentage in the dry seed; ORS, oil content ratio in the dry seed; ORF, oil content ratio in the fresh fruit; OY, oil yield. Data are presented as means ± standard deviations; Same small letter in a row represented the difference in fruit quality parameters among different areas within the same canopy shape; LI, inner canopy of the lower layer; LO, outer canopy of the lower layer; UI, inner canopy of the upper layer; UO, outer canopy of the upper layer.
Table 4. Differences in canopy microclimate of different Camellia oleifera canopy shapes in different development period.
MonthPositionLight Intensity (μmol·m2·s−1)Temperature (°C)Relative Humidity (%)
Open CenterRound HeadSignificanceOpen CenterRound HeadSignificanceOpen CenterRound HeadSignificance
1–2Lower layer661.53 ± 24.47442.96 ± 12.24*10.23 ± 0.0210.03 ± 0.01*34.53 ± 0.0235.54 ± 0.02*
Upper layer1168.29 ± 29.86908.29 ± 13.63*10.31 ± 0.0110.17 ± 0.01*34.28 ± 0.0134.61 ± 0.02*
Significance** ** **
Inner canopy832.75 ± 21.87498.43 ± 15.01*10.24 ± 0.0110.04 ± 0.01*34.48 ± 0.0235.04 ± 0.01*
Outer canopy997.06 ± 24.89602.83 ± 14.84*10.29 ± 0.0110.14 ± 0.01*34.32 ± 0.0234.70 ± 0.01*
Significance** ** **
7–9Lower layer1295.19 ± 35.84733.10 ± 24.85*30.54 ± 0.1129.44 ± 0.06*53.71 ± 0.1757.44 ± 0.14*
Upper layer1889.25 ± 37.041476.20 ± 21.47*31.25 ± 0.0830.31 ± 0.07*52.54 ± 0.0955.34 ± 0.14*
Significance** ** **
Inner canopy1529.20 ± 26.67925.16 ± 33.72*30.74 ± 0.0629.86 ± 0.06*53.44 ± 0.0756.08 ± 0.14*
Outer canopy1638.24 ± 28.531261.15 ± 32.29*31.05 ± 0.0730.16 ± 0.05*52.81 ± 0.0155.59 ± 0.01*
Significance** ** **
10Lower layer858.54 ± 22.62529.78 ± 10.97*30.35 ± 0.1429.00 ± 0.09*43.67 ± 0.0646.10 ± 0.09*
Upper layer1423.85 ± 21.651209.05 ± 14.11*31.32 ± 0.1130.31 ± 0.12*42.14 ± 0.0644.56 ± 0.08*
Significance** ** **
Inner canopy1098.15 ± 21.67781.94 ± 10.49*30.70 ± 0.0629.52 ± 0.06*43.08 ± 0.0745.57 ± 0.12*
Outer canopy1325.86 ± 22.161078.89 ± 12.86*31.13 ± 0.0730.02 ± 0.05*42.65 ± 0.0645.08 ± 0.10*
Significance** ** **
Data are presented as means ± standard deviations; Significance in a row represented the difference in microclimate of same areas within the different canopy shape; Significance in a column represented the difference in microclimate of different areas within the same canopy shape; “*” indicates significance at p ≤ 0.05; NS, not significant.
Table 5. Canopy microclimate in different areas of same Camellia oleifera canopy shape in different development period.
MonthPositionLight Intensity (μmol·m2·s−1)Temperature (°C)Relative Humidity (%)
Open CenterRound HeadOpen CenterRound HeadOpen CenterRound Head
1–2LI564.34 ± 13.05 d244.50 ± 12.22 d10.19 ± 0.01 d9.99 ± 0.03 d34.65 ± 0.01 a35.34 ± 0.02 a
LO758.68 ± 15.12 c561.42 ± 16.00 c10.25 ± 0.01 c10.06 ± 0.02 c34.41 ± 0.02 b34.94 ± 0.01 b
UI1101.14 ± 29.91 b752.35 ± 16.18 b10.29 ± 0.01 b10.12 ± 0.01 b34.31 ± 0.01 c34.75 ± 0.02 c
UO1235.44 ± 22.24 a1064.24 ± 21.00 a10.33 ± 0.01 a10.22 ± 0.01 a34.23 ± 0.01 d34.47 ± 0.02 d
7–9LI788.16 ± 6.98 d290.53 ± 8.24 d30.42 ± 0.04 d29.55 ± 0.02 d54.01 ± 0.09 a56.42 ± 0.09 a
LO1222.23 ± 15.79 c729.66 ± 14.76 c30.66 ± 0.05 c29.87 ± 0.02 c53.40 ± 0.01 b56.45 ± 0.06 b
UI1830.24 ± 17.12 b1559.78 ± 14.41 b31.07 ± 0.04 b30.16 ± 0.02 b52.87 ± 0.01 c55.74 ± 0.06 c
UO2254.26 ± 26.32 a1992.63 ± 25.94 a31.44 ± 0.04 a30.45 ± 0.03 a52.21 ± 0.01 d54.94 ± 0.06 d
10LI580.71 ± 4.63 d348.03 ± 13.61 d30.10 ± 0.04 d28.97 ± 0.05 d43.86 ± 0.05 a46.40 ± 0.07 a
LO1136.36 ± 20.26 c755.53 ± 11.00 c30.60 ± 0.06 c29.50 ± 0.06 c43.48 ± 0.04 b45.79 ± 0.05 b
UI1615.60 ± 29.05 b1215.86 ± 26.21 b31.29 ± 0.06 b30.07 ± 0.06 b42.31 ± 0.04 c44.74 ± 0.05 c
UO1832.11 ± 33.35 a1402.24 ± 26.83 a31.55 ± 0.07 a30.54 ± 0.06 a41.98 ± 0.03 d44.37 ± 0.04 d
Data are presented as means ± standard deviations; Same small letter in a column represented the differences in microclimate among different areas within the same canopy shape in each development period; LI, inner canopy of the lower layer; LO, outer canopy of the lower layer; UI, inner canopy of the upper layer; UO, outer canopy of the upper layer.
Table 6. Correlations between canopy microclimates in different developmental periods and the oil yield parameters of different Camellia oleifera canopy shapes.
MonthCanopy ShapeCorrelation Coefficient
Light IntensityTemperatureRelative Humidity
ORSORFOYORSORFOYORSORFOY
1–2Open center0.839 **0.834 *0.882 **0.743 *0.754 *0.794 *−0.852 **−0.854 **−0.886 **
Round head0.899 **0.875 **0.913 **0.831 *0.877 **0.895 **−0.830 *−0.818 *−0.819 *
7–9Open center0.870 **0.855 **0.919 **0.840 **0.839 **0.881 **−0.856 **−0.858 **−0.885 **
Round head0.906 **0.887 **0.926 **0.846 **0.884 **0.890 **−0.849 **−0.844 **−0.837 **
10Open center0.859 **0.865 **0.903 **0.846 **0.850 **0.893 **−0.841 **−0.838 **−0.885 **
Round head0.870 **0.903 **0.922 **0.853 **0.869 **0.911 **−0.842 **−0.893 **−0.895 **
ORS, oil content ratio in the dry seed; ORF, oil content ratio in the fresh fruit; OY, oil yield. “**” and “*” indicate significant differences at p ≤ 0.01 and p ≤ 0.05, respectively.
Table 7. Regression equation between single microclimate factor in different development period and oil yield parameters of different Camellia oleifera canopy shapes.
MonthCanopy ShapeLight Intensity (103 μmol·m2·s−1)Temperature (°C)Relative Humidity (%)Suitable Range of Values
ORS1–2Open centerY = −1.10X2 + 7.55X + 24.24NSY = 4.70X2 − 333.42X + 5933.30<3432 μmol·m2·s−1
(p = 0.0481, R2 = 0.704)(p = 0.0421, R2 = 0.726)>35.47%
Round headY = −17.10X2 + 43.05X + 4.82Y = 209.01X2 − 4170.20X + 20822Y = 8.66X2 − 616.74X + 11005<1259 μmol·m2·s−1
(p = 0.0129, R2 = 0.824)(p = 0.0388, R2 = 0.727)(p = 0.0327, R2 = 0.745)>9.98°C
>35.61%
7–9Open centerY = −5.99X2 + 23.94X + 7.60Y = −0.21X2 + 16.98X − 290.70Y = 0.16X2 − 19.53X + 605.47<1998 μmol·m2·s−1
(p = 0.0022, R2 = 0.818)(p = 0.0132, R2 = 0.697)(p = 0.0311, R2 = 0.630)<40.43 °C
<53.70%
Round headY = 1.09X2 + 9.45X + 12.92Y = 7.15X2 − 416.58X + 6085.70Y = 2.63X2 − 301.59X + 8649.60>733 μmol·m2·s−1
(p = 0.0213, R2 = 0.768)(p = 0.0233, R2 = 0.765)(p = 0.0123, R2 = 0.825)>29.13 °C
<57.45%
10Open centerY = 8.99X2 − 16.47X + 36.58 (p = 0.0089, R2 = 0.603)Y = 0.64X2 − 36.97X + 558.30Y = −0.11X2 + 7.26X − 85.75>916 μmol·m2·s−1
(p = 0.0135, R2 = 0.652)(p = 0.0145, R2 = 0.686)>28.88 °C
<43.70
Round headY = 3.33X2 − 7.38X + 15.28Y = 1.11X2 − 58.84X + 792.98Y = −0.45X2 + 34.33X − 611.64>1108 μmol·m2·s−1
(p = 0.0310, R2 = 0.700)(p = 0.0073, R2 = 0.696)(p = 0.0035, R2 = 0.732)>26.50 °C
<38.14%
ORF1–2Open centerY = −2.61X2 + 9.88X − 0.0662NSY = 1.71X2 − 126.50X + 2337<1893 μmol·m2·s−1
(p = 0.0477, R2 = 0.703)(p = 0.0373, R2 = 0.729)> 36.99%
Round headY = 2.00X2 + 4.41X + 1.49Y = 223.83X2 − 4501.40X + 22636Y = 3.69X2 − 262.82X + 4674>443 μmol·m2·s−1
(p = 0.0016, R2 = 0.766)(p = 0.0232, R2 = 0.778)(p = 0.0025, R2 = 0.909)>10.06 °C
>35.61%
7–9Open centerY = −6.37X2 + 24.78X − 16.22Y = −0.96X2 + 62.91X − 1019.30Y = −0.034X2 + 1.64X + 15.61<1945 μmol·m2·s−1
(p = 0.0011, R2 = 0.731)(p = 0.0037, R2 = 0.699)(p = 0.0056, R2 = 0.646)<32.77 °C
<53.70%
Round headY = 1.69X2 + 0.87X + 2.05Y = 3.21X2 − 187.66X + 2748.70Y = 0.99X2 − 112.90X + 3233.50>733 μmol·m2·s−1
(p = 0.0016, R2 = 0.863)(p = 0.0032, R2 = 0.899)(p = 0.0096, R2 = 0.939)>29.23 °C
>57.02%
10Open centerY = 6.81X2 − 11.76X + 10.70Y = 0.26X2 − 13.48X + 175.39Y = −0.24X2 + 18.83X − 360.66>863 μmol·m2·s−1
(p = 0.0410, R2 = 0.579)(p = 0.0316, R2 = 0.662)(p = 0.0033, R2 = 0.700)>25.92 °C
<39.23 %
Round headY = 2.99X2 − 0.14X + 2.74Y = 0.85X2 − 47.55X + 670.02Y = 0.11X2 − 12.28X + 337.56>23.41 μmol·m2·s−1
(p = 0.0013, R2 = 0.893)(p = 0.0014, R2= 0.889)(p = 0.0006, R2 = 0.915)>27.97 °C
<46.10%
OY1–2Open centerY = −27.97X2 + 148.73X − 52.20Y = −1717.30X2 + 35808X − 186554Y = 239.04X2 − 16614X − 288696<2652 μmol·m2·s−1
(p = 0.0016, R2 = 0.780)(p = 0.0432, R2 = 0.718)(p = 0.0021, R2 = 0.817)<10.43 °C
>34.75%
Round headY = 12.81X2 + 97.26X − 23.07Y = 2973.80X2 − 59717X + 299830Y = 91.66X2 − 6486.70X + 114738>443 μmol·m2·s−1
(p = 0.0111, R2 = 0.834)(p = 0.0013, R2 = 0.901)(p = 0.0010, R2 = 0.866)>10.04 °C
>35.38%
7–9Open centerY = −102.75X2 + 413.38X − 331.92Y = −25.06X2 + 1619X − 26035Y = 9.35X2 − 1034.00X + 28611<2012 μmol·m2·s−1
(p = 0.0050, R2 = 0.789)(p = 0.0056, R2 = 0.836)(p = 0.0010, R2 = 0.654)<32.30 °C
<53.70 %
Round headY = 62.33X2 − 62.07X + 32.62Y = 87.37X2 − 5155.50X + 76070Y = 21.65X2 − 2466.90X + 70300>498 μmol·m2·s−1
(p = 0.0022, R2 = 0.869)(p = 0.0024, R2 = 0.950)(p = 0.0011, R2= 0.943)>29.50 °C
>56.97%
10Open centerY = 159.25X2 − 282.44X + 161.94Y = −0.019X2 + 51.29X + 1505.70Y = 3.70X2 − 352.15X + 8347.90>887 μmol·m2·s−1
(p = 0.0039, R2 = 0.803)(p = 0.0011, R2 = 0.771)(p = 0.0342, R2 = 0.661)>30.40 °C
<43.70%
Round headY = 97.80X2 − 87.51X + 38.67Y = 26.78X2 − 1544.70X + 22290Y = 9.43X2 − 893.43X + 21173>447 μmol·m2·s−1
(p = 0.0014, R2 = 0.912)(p = 0.0010, R2 = 0.904)(p = 0.0012, R2 = 0.908)>28.84 °C
<46.10%
ORS, oil content ratio in the dry seed; ORF, oil content ratio in the fresh fruit; OY, oil yield. NS, not significant.
Table 8. Suitable ranges of single microclimatic values in different development period of different Camellia oleifera canopy shapes.
Canopy ShapeMonthLight Intensity (μmol·m2·s−1)Temperature (°C)Relative Humidity (%)
Open center1–2<1893<10.43>36.99
7–9<1954<32.30<53.70
10>916>30.40<39.23
Round head1–2443–1259>10.06>35.61
7–9>733>29.5057.02–57.45
10>1108>28.84<38.14
ORS, oil content ratio in the dry seed; ORF, oil content ratio in the fresh fruit; OY, oil yield.

