Assessing Forest Ecosystems across the Vertical Edge of the Mid-Latitude Ecotone Using the BioGeoChemistry Management Model (BGC-MAN)

 ,
,  , ,
, , 
 ,
,  and
and 
Abstract
1. Introduction
2. Materials and Methods
2.1. Applying BGC-MAN
2.2. Study Sites
2.3. Data Processing
3. Results
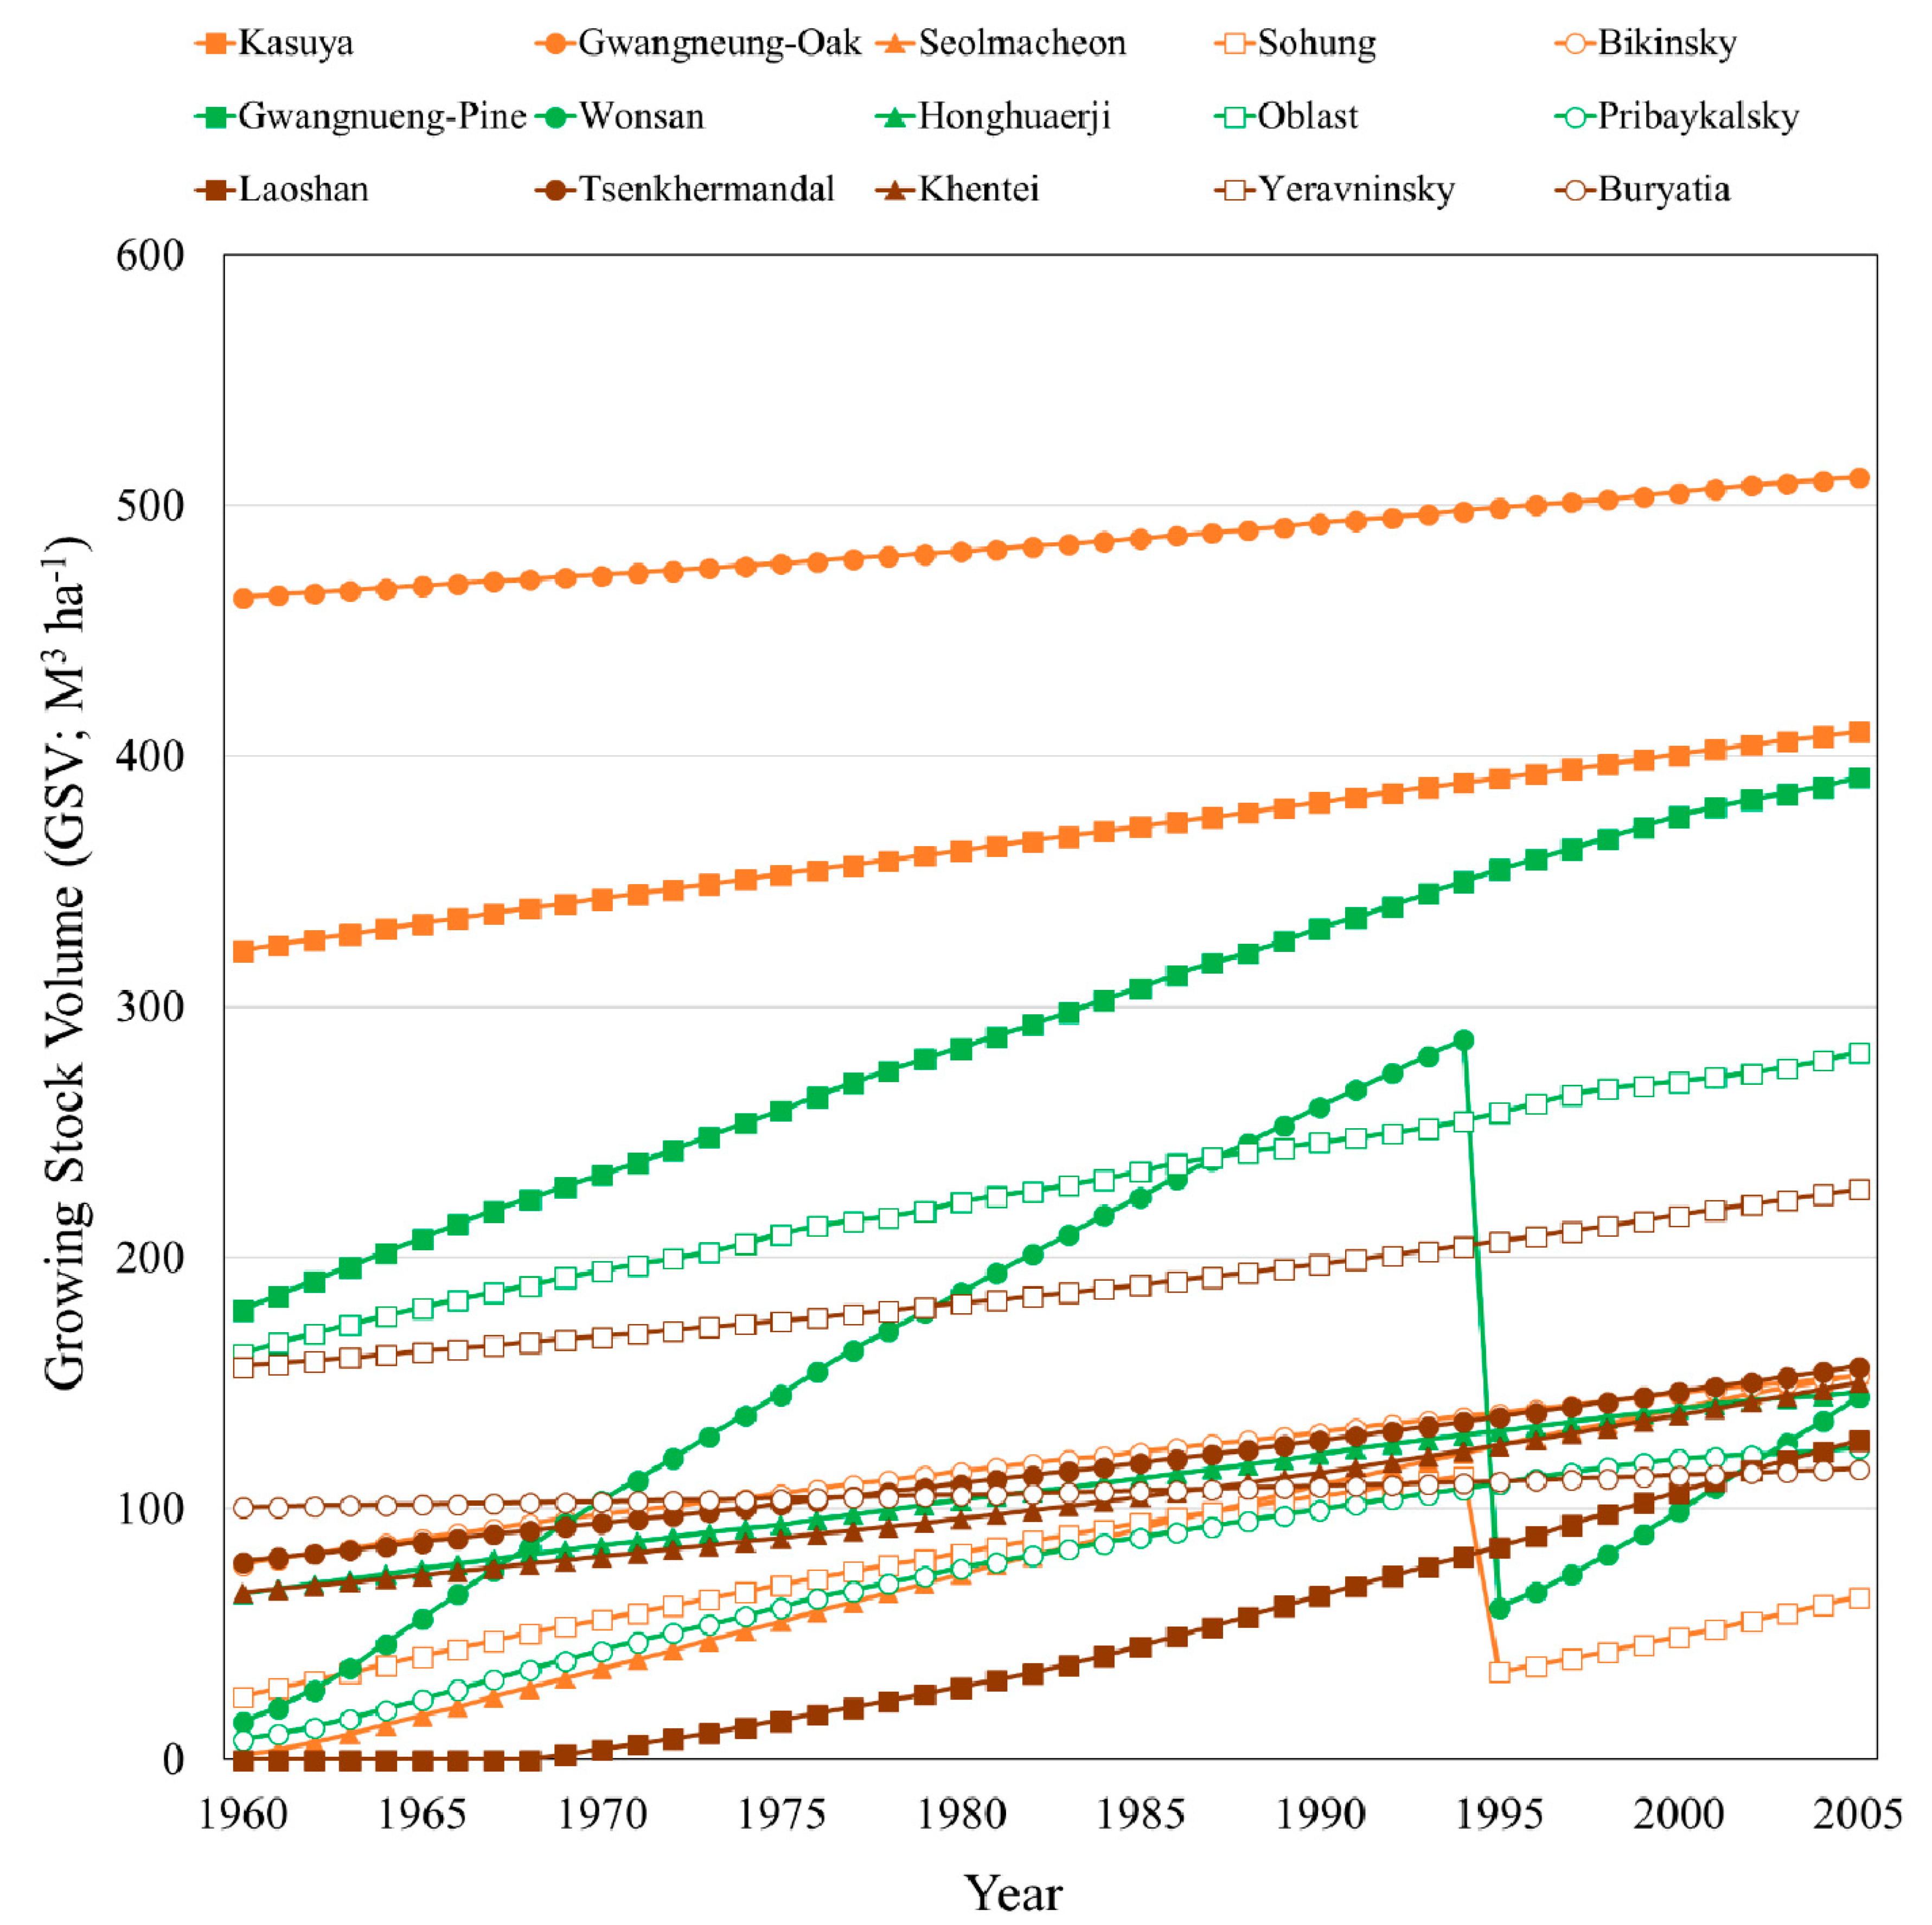
3.1. GSV and NPP
3.2. Comparing with the Literature
4. Discussion
5. Conclusions
Author Contributions
Funding
Acknowledgments
Conflicts of Interest
References
- Soja, A.J.; Tchebakova, N.M.; French, N.H.F.; Flannigan, M.D.; Shugart, H.H.; Stocks, B.J.; Sukhinin, A.I.; Parfenova, E.I.; Chapin, F.S.; Stackhouse, P.W. Climate-induced boreal forest change: Predictions versus current observations. Glob. Planet. Chang. 2006, 56, 274–296. [Google Scholar] [CrossRef]
- Cowie, A.L.; Orr, B.J.; Castillo Sanchez, V.M.; Chasek, P.; Crossman, N.D.; Erlewein, A.; Louwagie, G.; Maron, M.; Metternicht, G.I.; Minelli, S.; et al. Land in balance: The scientific conceptual framework for Land Degradation Neutrality. Environ. Sci. Policy 2018, 79, 25–35. [Google Scholar] [CrossRef]
- Bai, Z.G.; Dent, D.L.; Olsson, L.; Schaepman, M.E. Proxy global assessment of land degradation. Soil Use Manag. 2008, 24, 223–234. [Google Scholar] [CrossRef]
- Neilson, R.P. Transient ecotone response to climatic change: Some conceptual and modelling approaches. Ecol. Appl. 1993, 3, 385–395. [Google Scholar] [CrossRef] [PubMed]
- Moon, J.; Lee, W.K.; Song, C.; Lee, S.G.; Heo, S.B.; Shvidenko, A.; Kraxner, F.; Lamchin, M.; Lee, E.J.; Zhu, Y.; et al. An Introduction To Mid-Latitude Ecotone: Sustainability and Environmental Challenges. Sib. J. For. Sci. 2017, 53, 41–53. [Google Scholar]
- Song, C.; Kim, S.J.; Moon, J.; Lee, S.J.; Lee, W.; Kim, N.; Wang, S.W.; Lee, W.K. Classification of global land development phases by forest and GDP changes for appropriate land management in the mid-latitude. Sustainability 2017, 9, 1342. [Google Scholar] [CrossRef]
- Lamchin, M.; Lee, W.K.; Jeon, S.W.; Wang, S.W.; Lim, C.H.; Song, C.; Sung, M. Long-term trend and correlation between vegetation greenness and climate variables in Asia based on satellite data. Sci. Total Environ. 2018, 618, 1089–1095. [Google Scholar] [CrossRef] [PubMed]
- Shvidenko, A.; Buksha, I.; Krakovska, S.; Lakyda, P. Vulnerability of Ukrainian forests to climate change. Sustainability 2017, 9, 1152. [Google Scholar] [CrossRef]
- Choi, Y.; Lim, C.H.; Ryu, J.; Jeon, S.W. Bioclimatic classification of Northeast Asia reflecting social factors: Development and characterization. Sustainability 2017, 9, 1137. [Google Scholar] [CrossRef]
- Ueyama, M.; Ichii, K.; Hirata, R.; Takagi, K.; Asanuma, J.; MacHimura, T.; Nakai, Y.; Ohta, T.; Saigusa, N.; Takahashi, Y.; et al. Simulating carbon and water cycles of larch forests in East Asia by the BIOME-BGC model with AsiaFlux data. Biogeosciences 2010, 7, 959–977. [Google Scholar] [CrossRef]
- Park, M.S. Inter-Korean forest cooperation 1998-2012: A policy arrangement approach. Sustainability 2015, 7, 5241–5259. [Google Scholar] [CrossRef]
- Bae, J.S.; Joo, R.W.; Kim, Y.S. Forest transition in South Korea: Reality, path and drivers. Land Use Policy 2012, 29, 198–207. [Google Scholar] [CrossRef]
- Lee, S.G.; Choi, H.A.; Yoo, H.; Song, C.; Cha, S.; Bae, S.W.; Son, Y.; Lee, W.K. Restoration plan for degraded forest in the democratic people’s Republic of Korea considering suitable tree species and spatial distribution. Sustainability 2018, 10, 856. [Google Scholar] [CrossRef]
- Kang, S.; Choi, W. Forest cover changes in North Korea since the 1980s. Reg. Environ. Chang. 2014, 14, 347–354. [Google Scholar] [CrossRef]
- Kim, D.; Lim, C.H.; Song, C.; Lee, W.K.; Piao, D.; Heo, S.; Jeon, S. Estimation of future carbon budget with climate change and reforestation scenario in North Korea. Adv. Sp. Res. 2016, 58, 1002–1016. [Google Scholar] [CrossRef]
- Cui, G.; Lee, W.K.; Kim, D.; Lee, E.J.; Kwak, H.; Choi, H.A.; Kwak, D.A.; Jeon, S. Estimation of forest carbon budget from land cover change in South and North Korea between 1981 and 2010. J. Plant Biol. 2014, 57, 225–238. [Google Scholar] [CrossRef]
- Feng, L.; Jia, Z.; Li, Q. The dynamic monitoring of aeolian desertification land distribution and its response to climate change in northern China. Sci. Rep. 2016, 6, 1–10. [Google Scholar] [CrossRef][Green Version]
- Tsogtbaatar, J. Deforestation and reforestation needs in Mongolia. For. Ecol. Manag. 2004, 201, 57–63. [Google Scholar] [CrossRef]
- Wenhua, L. Degradation and restoration of forest ecosystems in China. For. Ecol. Manag. 2004, 201, 33–41. [Google Scholar] [CrossRef]
- Huang, L.; Xiao, T.; Zhao, Z.; Sun, C.; Liu, J.; Shao, Q.; Fan, J.; Wang, J. Effects of grassland restoration programs on ecosystems in arid and semiarid China. J. Environ. Manag. 2013, 117, 268–275. [Google Scholar] [CrossRef]
- Schaphoff, S.; Reyer, C.P.O.; Schepaschenko, D.; Gerten, D.; Shvidenko, A. Tamm Review: Observed and projected climate change impacts on Russia’s forests and its carbon balance. For. Ecol. Manag. 2016, 361, 432–444. [Google Scholar] [CrossRef]
- Potapov, P.; Hansen, M.C.; Stehman, S.V.; Loveland, T.R.; Pittman, K. Combining MODIS and Landsat imagery to estimate and map boreal forest cover loss. Remote Sens. Environ. 2008, 112, 3708–3719. [Google Scholar] [CrossRef]
- Matsushita, B.; Tamura, M. Integrating remotely sensed data with an ecosystem model to estimate net primary productivity in East Asia. Remote Sens. Environ. 2002, 81, 58–66. [Google Scholar] [CrossRef]
- Takagi, K.; Hirata, R.; Ide, R.; Ueyama, M.; Ichii, K.; Saigusa, N.; Hirano, T.; Asanuma, J.; Li, S.G.; Machimura, T.; et al. Spatial and seasonal variations of CO2flux and photosynthetic and respiratory parameters of larch forests in East Asia. Soil Sci. Plant Nutr. 2015, 61, 61–75. [Google Scholar] [CrossRef]
- Ueyama, M.; Kai, A.; Ichii, K.; Hamotani, K.; Kosugi, Y.; Monji, N. The sensitivity of carbon sequestration to harvesting and climate conditions in a temperate cypress forest: Observations and modeling. Ecol. Model. 2011, 222, 3216–3225. [Google Scholar] [CrossRef]
- Kondo, M.; Ichii, K.; Ueyama, M.; Mizoguchi, Y.; Hirata, R.; Saigusa, N. The role of carbon flux and biometric observations in constraining a terrestrial ecosystem model: A case study in disturbed forests in East Asia. Ecol. Res. 2013, 28, 893–905. [Google Scholar] [CrossRef]
- Churkina, G.; Running, S.W.; Schloss, A.L. Comparing global models of terrestrial net primary productivity (NPP): The importance of water availability. Glob. Chang. Biol. 1999, 5, 46–55. [Google Scholar] [CrossRef]
- Li, B.; Wang, W. Trade-offs and synergies in ecosystem services for the Yinchuan Basin in China. Ecol. Indic. 2018, 84, 837–846. [Google Scholar] [CrossRef]
- Merganičová, K.; Pietsch, S.A.; Hasenauer, H. Testing mechanistic modeling to assess impacts of biomass removal. For. Ecol. Manag. 2005, 207, 37–57. [Google Scholar] [CrossRef]
- Choi, S.; Lee, W.K.; Kwak, H.; Kim, S.R.; Yoo, S.; Choi, H.A.; Park, S.; Lim, J.H. Vulnerability assessment of forest ecosystem to climate change in Korea using MC1 model. J. For. Plan. 2011, 16, 149–161. [Google Scholar]
- Pietsch, S.A. Modelling Ecosystem Pools and Fluxes. Implementation and Application of Biogeochemical Ecosystem Models; Institute of Silviculture Department of Forest and Soil Sciences University of Natural Resources and Life Sciences (BOKU): Vienna, Austria, 2014. [Google Scholar]
- Thornton, P.E.; Law, B.E.; Gholz, H.L.; Clark, K.L.; Falge, E.; Ellsworth, D.S.; Goldstein, A.H.; Monson, R.K.; Hollinger, D.; Falk, M.; et al. Modeling and measuring the effects of disturbance history and climate on carbon and water budgets in evergreen needleleaf forests. Agric. For. Meteorol. 2002, 113, 185–222. [Google Scholar] [CrossRef]
- Pietsch, S.A.; Hasenauer, H.; Thornton, P.E. BGC-model parameters for tree species growing in central European forests. For. Ecol. Manag. 2005, 211, 264–295. [Google Scholar] [CrossRef]
- Akujärvi, A.; Shvidenko, A.; Pietsch, S.A. Modelling the impacts of intensifying forest management on carbon budget across a long latitudinal gradient in Europe. Environ. Res. Lett. 2018, 14, 034012. [Google Scholar] [CrossRef]
- Ishihara, M.I.; Suzuki, S.N.; Nakamura, M.; Enoki, T.; Fujiwara, A.; Hiura, T.; Hoshino, D.; Homma, K.; Hoshizaki, K.; Ida, H.; et al. Forest stand structure, composition, and dynamics in 34 sites over Japan. Ecol. Res. 2011, 26, 1007–1008. [Google Scholar] [CrossRef]
- Chae, N. Annual variation of soil respiration and precipitation in a temperate gorest (Quercus serrata and Carpinus laxiflora) under East Asian monsoon climate. J. Plant Biol. 2011, 54, 101–111. [Google Scholar] [CrossRef]
- Wang, H.M.; Saigusa, N.; Zu, Y.G.; Wang, W.J.; Yamamoto, S.; Kondo, H. Carbon fluxes and their response to environmental variables in a Dahurian larch forest ecosystem in northeast China. J. For. Res. 2008, 19, 1–10. [Google Scholar] [CrossRef]
- Noh, N.J.; Kim, C.; Bae, S.W.; Lee, W.K.; Yoon, T.K.; Muraoka, H.; Son, Y. Carbon and nitrogen dynamics in a Pinus densiflora forest with low and high stand densities. J. Plant Ecol. 2013, 6, 368–379. [Google Scholar] [CrossRef]
- Crowther, T.W.; Glick, H.B.; Covey, K.R.; Bettigole, C.; Maynard, D.S.; Thomas, S.M.; Smith, J.R.; Hintler, G.; Duguid, M.C.; Amatulli, G.; et al. Mapping tree density at a global scale. Nature 2015, 525, 201–205. [Google Scholar] [CrossRef]
- Kummu, M.; Varis, O. The world by latitudes: A global analysis of human population, development level and environment across the north-south axis over the past half century. Appl. Geogr. 2011, 31, 495–507. [Google Scholar] [CrossRef]
- Tran, H.; Iida, S.; Inoue, S. Initial sprouting of some tree species in natural forests following 9-month cutting in Kasuya Research Forest of Kyushu University Forest, Japan. J. Fac. Agric. Kyushu Univ. 2005, 50, 471–480. [Google Scholar]
- Lim, H.J.; Lee, Y.H.; Kwon, H. Evaluation of Community Land Model version 3.5-Dynamic global vegetation model over deciduous forest in Gwangneung, Korea. Korean J. Agric. For. Meteorol. 2010, 12, 95–106. [Google Scholar] [CrossRef]
- Kwon, H.; Lee, J.; Lee, Y.; Lee, J.W.; Jung, S.W.; Kim, J. Seasonal variations of evapotranspiration observed in a mixed forest in the Seolmacheon catchment. Korean J. Agric. For. Meteorol. 2009, 11, 39–47. [Google Scholar] [CrossRef]
- Shin, H.J.; Park, G.A.; Park, M.; Kim, S.J. Projection of forest vegetation change by applying future climate change scenario MIROC3.2 A1B. J. Korean Assoc. Geogr. Inf. Stud. 2012, 15, 64–75. [Google Scholar] [CrossRef][Green Version]
- Piao, D.; Zhu, Y.; Piao, D.; Lee, W.; Zhu, Y.; Kim, M.; Song, C. Assessment of forest degradation and carbon storage for REDD+ project in North Korea. Korean J. Environ. Biol. 2016, 9999, 1–7. [Google Scholar] [CrossRef]
- Shvidenko, A.; Schepaschenko, D.; Nilsson, S.; Bouloui, Y. Tables and Models of Growth and Productivity of Forests of Major Forest Forming Species of Northern Eurasian; Federal Agency of Forest Management; International Institute for Applied Systems Analysis: Moscow, Russia, 2008. [Google Scholar]
- Noh, N.J.; Son, Y.; Lee, S.K.; Yoon, T.K.; Seo, K.W.; Kim, C.; Lee, W.K.; Bae, S.W.; Hwang, J. Influence of stand density on soil CO2efflux for a Pinus densiflora forest in Korea. J. Plant Res. 2010, 123, 411–419. [Google Scholar] [CrossRef] [PubMed]
- Eum, S.; Kang, S.; Lee, D. A simulation study to investigate climatic controls on net primary production (NPP) of a rugged forested landscape in The Mid-western Korean Peninsula. Korean J. Agric. For. Meteorol. 2005, 7, 67–78. [Google Scholar]
- Hanns Seidel Foundation German-North Korean Cooperation in the Field of Forestry. Available online: https://korea.hss.de/en/news/detail/german-north-korean-cooperation-in-the-field-of-forestry-news3931/ (accessed on 12 January 2019).
- Zhu, J.; Zhi-ping, F.; Zeng, D.; Jiang, F.; Matsuzaki, T. Comparison of stand structure and growth between artificial and natural forests of Pinus sylvestiris var.mongolica on sandy land. J. For. Res. 2003, 14, 103–111. [Google Scholar]
- Chen, Z.; Zhang, X.; Cui, M.; He, X.; Ding, W.; Peng, J. Tree-ring based precipitation reconstruction for the forest-steppe ecotone in northern Inner Mongolia, China and its linkages to the Pacific Ocean variability. Glob. Planet. Chang. 2012, 86–87, 45–56. [Google Scholar] [CrossRef]
- Khishigjargal, M.; Dulamsuren, C.; Leuschner, H.H.; Leuschner, C.; Hauck, M. Climate effects on inter- and intra-annual larch stemwood anomalies in the Mongolian forest-steppe. Acta Oecol. 2014, 55, 113–121. [Google Scholar] [CrossRef]
- Dulamsuren, C.; Khishigjargal, M.; Leuschner, C.; Hauck, M. Response of tree-ring width to climate warming and selective logging in larch forests of the Mongolian Altai. J. Plant Ecol. 2014, 7, 24–38. [Google Scholar] [CrossRef]
- Dulamsuren, C.; Hauck, M.; Leuschner, H.H.; Leuschner, C. Climate response of tree-ring width in Larix sibirica growing in the drought-stressed forest-steppe ecotone of northern Mongolia. Ann. For. Sci. 2011, 68, 275–282. [Google Scholar] [CrossRef]
- Kim, M.; Lee, W.K.; Choi, G.M.; Song, C.; Lim, C.H.; Moon, J.; Piao, D.; Kraxner, F.; Shvidenko, A.; Forsell, N. Modeling stand-level mortality based on maximum stem number and seasonal temperature. For. Ecol. Manag. 2017, 386, 37–50. [Google Scholar] [CrossRef]
- Holland, E.A.; Dentener, F.J.; Bobby, H.; Sulzman, J.M. Contemporary and pre-industrial global reactive nitrogen budgets. Biogeochemistry 1999, 46, 7–43. [Google Scholar] [CrossRef]
- Vet, R.; Artz, R.S.; Carou, S.; Shaw, M.; Ro, C.U.; Aas, W.; Baker, A.; Bowersox, V.C.; Dentener, F.; Galy-Lacaux, C.; et al. A global assessment of precipitation chemistry and deposition of sulfur, nitrogen, sea salt, base cations, organic acids, acidity and pH, and phosphorus. Atmos. Environ. 2014, 93, 3–100. [Google Scholar] [CrossRef]
- Granhall, U.; Lindberg, T. Nitrogen fixation in some coniferous forest ecosystems. Ecol. Bull. 1978, 26, 178–192. [Google Scholar]
- Todd, R.L.; Meyer, R.D.; Waide, J.B. Nitrogen Fixation in a Deciduous Forest in the South-Eastern United States. Source Ecol. Bull. 1978, 26, 114–121. [Google Scholar]
- Son, Y. Non-symbiotic nitrogen fixation in forest ecosystems. Ecol. Res. 2001, 16, 183–196. [Google Scholar] [CrossRef]
- Shugalei, L.S.; Vedrova, E.F. Nitrogen pool in northern-Taiga larch forests of central Siberia. Biol. Bull. 2004, 31, 200–208. [Google Scholar] [CrossRef]
- White, M.A.; Thornton, P.E.; Running, S.W.; Nemani, R.R. Parameterization and sensitivity analysis of the BIOME–BGC Terrestrial Ecosystem Model: Net primary production controls. Earth Interact. 2000, 4, 1–85. [Google Scholar] [CrossRef]
- Thornton, P.E.; Running, S.W. An improved algorithm for estimating incident daily solar radiation from measurements of temperature, humidity, and precipitation. Agric. For. Meteorol. 1999, 93, 211–228. [Google Scholar] [CrossRef]
- Warszawski, L.; Frieler, K.; Huber, V.; Piontek, F.; Serdeczny, O.; Schewe, J. The Inter-Sectoral Impact Model Intercomparison Project (ISI–MIP): Project framework. Proc. Natl. Acad. Sci. USA 2014, 111, 3228–3232. [Google Scholar] [CrossRef] [PubMed]
- Hempel, S.; Frieler, K.; Warszawski, L.; Schewe, J.; Piontek, F. A trend-preserving bias correction –The ISI-MIP approach. Earth Syst. Dyn. 2013, 4, 219–236. [Google Scholar] [CrossRef]
- Rosenzweig, C.; Elliott, J.; Deryng, D.; Ruane, A.C.; Müller, C.; Arneth, A.; Boote, K.J.; Folberth, C.; Glotter, M.; Khabarov, N.; et al. Assessing agricultural risks of climate change in the 21st century in a global gridded crop model intercomparison. Proc. Natl. Acad. Sci. USA 2014, 111, 3268–3273. [Google Scholar] [CrossRef] [PubMed]
- Kira, T. A New Classification of Climate in Eastern Asia as the Basis for Agricultural Geography; Horticultural Institute, Kyoto University: Kyoto, Japan, 1945. [Google Scholar]
- Choi, S.; Lee, W.; Kwak, D.; Lee, S.; Son, Y.; Lim, J.; Saborowski, J. Predicting forest cover changes in future climate using hydrological and thermal indices in South Korea. Clim. Res. 2011, 49, 229–245. [Google Scholar] [CrossRef][Green Version]
- Inoue, T.; Enoki, T.; Tashiro, N.; Sakuta, K.; Inoue, S. Effects of topography and planted trees on the distribution of naturally regenerated broad-leaved trees in a 140-year-old Cryptomeria japonica plantation in northern Kyushu, Japan. J. For. Res. 2008, 13, 365–371. [Google Scholar] [CrossRef]
- Son, Y.M.; Kim, R.H.; Lee, K.H.; Pyo, J.K.; Kim, S.W.; Hwang, J.S.; Lee, S.J. Carbon Emission Factors and Biomass Allometric Equations by Species in Korea; National Institute of Forest Science: Seoul, Korea, 2014. [Google Scholar]
- Lim, J.; Shin, J.H.; Jin, G.Z.; Chun, J.H.; Oh, J.S. Forest stand structure, site characteristics and carbon budget of the Kwangneung Natural Forest in Korea. Korean J. Agric. For. Meteorol. 2003, 5, 101–109. [Google Scholar]
- Shin, H.J.; Park, M.J.; Kim, S.J. Evaluation of forest watershed hydro-ecology using measured data and RHESSys Model 2014for the Seolmacheon catchment. J. Korea Water Resour. Assoc. 2012, 45, 1293–1307. [Google Scholar] [CrossRef]
- Shi, F.; Chen, X.; Wang, W.; Takagi, K.; Akibayashi, Y.; Sasa, K.; Uemura, S. Vegetation characteristics of a Larch-dominant Site for CO2 flux monitoring study at the laoshan experimental station in northesast China. Eurasian J. For. Res. 2001, 3, 55–67. [Google Scholar]
- MOD17A3 MODIS/Terra Gross Primary Productivity Yearly L4 Global 1 km SIN Grid; NASA EOSDIS Land Processes DAAC. 2011. Available online: https://lpdaac.usgs.gov/products/mod17a3v055/ (accessed on 10 February 2019).
- Pietsch, S.A.; Hasenauer, H. Evaluating the self-initialization procedure for large-scale ecosystem models. Glob. Chang. Biol. 2006, 12, 1658–1669. [Google Scholar] [CrossRef]
- Kajimoto, T.; Matsuura, Y.; Sofronov, M.A.; Volokitina, A.V.; Mori, S.; Osawa, A.; Abaimov, A.P. Above- and belowground biomass and net primary productivity of a Larix gmelinii stand near Tura, central Siberia. Tree Physiol. 1999, 19, 815–822. [Google Scholar] [CrossRef]
- Kharuk, V.I.; Ranson, K.J.; Im, S.T.; Dvinskaya, M.L. Response of Pinus sibirica and Larix sibirica to climate change in southern Siberian alpine forest-tundra ecotone. Scand. J. For. Res. 2009, 24, 130–139. [Google Scholar] [CrossRef]
- Kang, S.; Lim, J.H.; Kim, E.S.; Cho, N. Modelling analysis of climate and soil depth effects on pine tree dieback in Korea using BIOME-BGC. Korean J. Agric. For. Meteorol. 2016, 18, 242–252. [Google Scholar] [CrossRef]
- Kang, S.; Lee, D.; Lee, J.; Running, S.W. Topographic and climatic controls on soil environments and net primary production in a rugged temperate hardwood forest in Korea. Ecol. Res. 2006, 21, 64–74. [Google Scholar] [CrossRef]
- Wang, P.; Sun, R.; Hu, J.; Zhu, Q.; Zhou, Y.; Li, L.; Chen, J.M. Measurements and simulation of forest leaf area index and net primary productivity in Northern China. J. Environ. Manag. 2007, 85, 607–615. [Google Scholar] [CrossRef] [PubMed]
- Gower, S.T.; Krankina, O.; Olson, R.J.; Apps, M.; Linder, S.; Wang, C. Net primary production and carbon allocation patterns of boreal forest ecosystems. Ecol. Appl. 2001, 11, 1395–1411. [Google Scholar] [CrossRef]
- Sato, H.; Kobayashi, H.; Iwahana, G.; Ohta, T. Endurance of larch forest ecosystems in eastern Siberia under warming trends. Ecol. Evol. 2016, 6, 5690–5704. [Google Scholar] [CrossRef] [PubMed]
- Shuman, J.K.; Shugart, H.H.; O’Halloran, T.L. Sensitivity of Siberian larch forests to climate change. Glob. Chang. Biol. 2011, 17, 2370–2384. [Google Scholar] [CrossRef]
- Jiang, H.; Apps, M.J.; Zhang, Y.; Peng, C.; Woodard, P.M. Modelling the spatial pattern of net primary productivity in Chinese forests. Ecol. Model. 1999, 122, 275–288. [Google Scholar] [CrossRef]


| Classes | Oak Forest Stands | Pine Forest Stands | Larch Forest Stands | ||||||||||||
|---|---|---|---|---|---|---|---|---|---|---|---|---|---|---|---|
| Species | Quercus acuta | Quercus serrata | Quercus variabilis | Quercus mongolica | Quercus mongolica | Pinus densiflora | Pinus densiflora | Pinus sylvestris | Pinus sylvestris | Pinus sylvestris | Larix gmelinii | Larix sibirica | Larix sibirica | Larix gmelinii | Larix gmelinii |
| Types | Evergreen | Deciduous | Deciduous | Deciduous | Deciduous | Evergreen | Evergreen | Evergreen | Evergreen | Evergreen | Deciduous | Deciduous | Deciduous | Deciduous | Deciduous |
| Location | Kasuya | Gwang-neung | Seolma-cheon | Sohung | Bikinsky | Gwang-neung | Wonsan | Hong-huaerji | Oblast | Pribay-kalsky | Laoshan | Tsenkher-mandal | Khentei | Yeravnin-sky | Buryatia |
| Nation 1 | JPN | ROK | ROK | DPRK | RUS | ROK | DPRK | CHN | RUS | RUS | CHN | MNG | MNG | RUS | RUS |
| Longitude (°) | 130.550 | 127.149 | 126.955 | 126.032 | 134.373 | 127.162 | 127.320 | 119.993 | 105.334 | 107.985 | 127.340 | 109.068 | 107.316 | 111.411 | 111.728 |
| Latitude (°) | 33.650 | 37.750 | 37.939 | 38.391 | 46.770 | 37.748 | 39.149 | 48.200 | 52.185 | 52.504 | 45.200 | 47.835 | 49.100 | 52.397 | 54.960 |
| Elevation (m) | 355 | 340 | 293 | 169 | 160 | 425 | 481 | 836 | 730 | 620 | 370 | 1797 | 1021 | 922 | 1612 |
| Aspect (%) | E | NW | NW | N | S | SW | N | SW | NE | SW | SW | N | NW | NW | N |
| Slope (%) | 15 | 14 | 15 | 21 | 15 | 19 | 21 | 1 | 26 | 25 | 6 | 24 | 8 | 32 | 34 |
| Sand (%) | 42 | 50 | 52 | 42 | 15 | 50 | 42 | 89 | 65 | 55 | 37 | 31 | 45 | 34 | 38 |
| Silt (%) | 36 | 13 | 25 | 36 | 48 | 45 | 36 | 6 | 25 | 37 | 45 | 36 | 31 | 33 | 31 |
| Clay (%) | 22 | 37 | 23 | 22 | 37 | 5 | 22 | 5 | 10 | 8 | 18 | 33 | 24 | 23 | 21 |
| Soil depth (m) | 1.00 | 1.00 | 1.00 | 1.00 | 1.60 | 1.00 | 1.00 | 1.00 | 0.80 | 0.95 | 1.00 | 0.90 | 1.00 | 1.00 | 0.60 |
| East horizon (°) | 5 | 0 | 7 | 26 | 32 | 0 | 0 | 31 | 6 | 35 | 3 | 16 | 16 | 18 | 5 |
| West horizon (°) | 60 | 18 | 0 | 54 | 10 | 5 | 6 | 0 | 10 | 10 | 2 | 4 | 8 | 0 | 2 |
| Forest age | 140 | 80–200 | 20–40 | - | 80 | 80+ | - | 40–60 | 95 | 60 | 40–50 | 110 | 60–150 | 100 | 100 |
| Mortality (%) 2 | 1.7–2.0 | 1.7–2.0 | 2.0+ | 2.0+ | 1.7–2.0 | 1.4+ | 1.4–3.0 | 1.4–3.0 | 0.7 | 0.8–2.0 | 5.0–5.6 | 0.2 | 0.2–0.3 | 0.2–0.3 | 0.2–0.3 |
| Fire fraction (%) | - | - | - | - | 0.005 | - | - | - | 0.25 | 0.15 | - | 0.15 | - | 0.08 | 0.08 |
| Options 3 | P, N | P, N | C, P, N | C, P, L | P, N | C, P, N | C, P, L | P, N | P, N | P, N | C, P, N | P, N | P, N | P, N | P, N |
| Parameters | Units | Oak | Pine | Larch |
|---|---|---|---|---|
| Annual leaf and fine root turnover fraction | year−1 | 1.0 | 0.3 | 1.0 |
| Annual live wood turnover fraction | year−1 | 0.7 | 0.3 | 0.7 |
| Annual whole-plant mortality fraction | year−1 | 0.008 | 0.180 | 0.050 |
| Annual fire mortality fraction | year−1 | 0.017 | 0.700 | 0.056 |
| New fine root C:new leaf C | ratio | 1.0 | 0.523 | 0.8~1.2 |
| New stem C:new total wood C | ratio | 1.29 | 2.5 | 1.2~2.2 |
| New live wood C:new total wood C | ratio | 0.120 | 0.059 | 0.1 |
| New coarse root C:new stem C | ratio | 0.250 | 0.290 | 0.23 |
| Current growth proportion | ratio | 0.5 | 0.5 | 0.5 |
| C:N of leaves | kgC/kgN | 26.9 | 33.1 | 25.8~27 |
| C:N of leaf letters | kgC/kgN | 63.3 | 132.0 | 111.9 |
| C:N of fine roots | kgC/kgN | 73.5 | 38.0 | 42.0 |
| C:N of live wood | kgC/kgN | 63.5 | 50.0 | 42.0 |
| C:N of dead wood | kgC/kgN | 450.0 | 1400.0 | 442.0 |
| Leaf litter labile proportion | DIM | 0.200 | 0.257 | 0.390 |
| Leaf litter cellulose proportion | DIM | 0.560 | 0.493 | 0.440 |
| Leaf litter lignin proportion | DIM | 0.240 | 0.250 | 0.170 |
| Fine root labile proportion | DIM | 0.340 | 0.252 | 0.300 |
| Fine root cellulose proportion | DIM | 0.440 | 0.493 | 0.450 |
| Fine root lignin proportion | DIM | 0.220 | 0.253 | 0.250 |
| Dead wood cellulose proportion | DIM | 0.704 | 0.710 | 0.760 |
| Dead wood lignin proportion | DIM | 0.296 | 0.290 | 0.240 |
| Canopy water interception coefficient | 1/LAI/d | 0.038 | 0.051 | 0.041 |
| Canopy light extinction coefficient | DIM | 0.540 | 0.510 | 0.500 |
| All-sided to projected leaf area ratio | DIM | 2.0 | 2.6 | 2.6 |
| Canopy average specific leaf area | m2/kgC | 35.0 | 13.0 | 20.3 |
| Ratio of shaded SLA | DIM | 2.0 | 2.0 | 2.0 |
| Fraction of leaf N in Rubisco | DIM | 0.0880 | 0.0457 | 0.0750 |
| Maximum stomatal conductance | m/s | 0.0018 | 0.0010 | 0.0022 |
| Cuticular conductance | m/s | 0.00004 | 0.000014 | 0.00001 |
| Boundary layer conductance | m/s | 0.005 | 0.09 | 0.008 |
| Leaf water potential | MPa | (−0.1)–(−3.5) | (−0.5)–(−2.2) | (−0.7)–(−2.6) |
| Vapor pressure deficit | MPa | 200–2550 | 50–2500 | 800–3200 |
| Night time freezing temperature | C | (−1)–(−8) | (−2)–(−8) | (−8)–(−20) |
| Types | Simulation | Literature | Sources | Species | Locations |
|---|---|---|---|---|---|
| GSV (m3 ha−1) | 410 | 109–516 | Estimation [35,69,70] | Oak | Kasuya |
| 511 | 550 | Chae (2011) [36] | Oak | Gwangneung | |
| 154 | 78–159 | Kwon et al. (2009) [43] | Oak | Seolmacheon | |
| 65 | 56–66 | Piao et al. (2016) [45] | Oak | Sohung | |
| 153 | 154 | Shvidenko et al. (2008) [46] | Oak | Bikinsky | |
| 391 | 378–645 | Noh et al. (2013) [38] | Pine | Gwangneung | |
| 146 | 117–173 | Zhu et al. (2003) [50] | Pine | Honghuaerji | |
| 282 | 282 | Shvidenko et al. (2008) [46] | Pine | Oblast | |
| 124 | 102 | Shvidenko et al. (2008) [46] | Pine | Pribaykalsky | |
| 127 | 118–133 | Shi et al. (2001) [73] | Larch | Laoshan | |
| 227 | 227 | Shvidenko et al. (2008) [46] | Larch | Yeravninsky | |
| 116 | 117 | Shvidenko et al. (2008) [46] | Larch | Buryatia | |
| NPP (Mg C ha−1) | 4.28 | 4.30–6.05 | Lim et al. (2003) [71] | Oak | Gwangneung |
| 5.39 | 4.00–6.55 | Lim et al. (2010) [42] | Oak | Gwangneung | |
| 3.70 | 5.05 | Shvidenko et al. [46] | Oak | Bikinsky | |
| 6.39 | 5.37–7.20 | Eum et al. (2005) [48] | Pine | Gwangneung | |
| 6.75 | 4.30–6.03 | Cui et al. (2014) [16] | Pine | Wonsan | |
| 3.49 | 3.06 | Shvidenko et al. (2008) [46] | Pine | Oblast | |
| 2.50 | 2.72 | Shvidenko et al. (2008) [46] | Pine | Pribaykalsky | |
| 5.23 | 7.18–7.89 | Kondo et al. (2013) [26] | Larch | Laoshan | |
| 1.28 | 3.38 | Shvidenko et al. (2008) [46] | Larch | Yeravninsky | |
| 0.49 | 2.81 | Shvidenko et al. (2008) [46] | Larch | Buryatia | |
| GPP | 8.72 | 11.93–12.06 | Shin et al. (2012) [72] | Oak | Seolmacheon |
| (Mg C ha−1) | 2.85 | 5.62–6.10 | Takagi et al. (2015) [24] | Larch | Khentei |
© 2019 by the authors. Licensee MDPI, Basel, Switzerland. This article is an open access article distributed under the terms and conditions of the Creative Commons Attribution (CC BY) license (http://creativecommons.org/licenses/by/4.0/).
Share and Cite
Song, C.; Pietsch, S.A.; Kim, M.; Cha, S.; Park, E.; Shvidenko, A.; Schepaschenko, D.; Kraxner, F.; Lee, W.-K. Assessing Forest Ecosystems across the Vertical Edge of the Mid-Latitude Ecotone Using the BioGeoChemistry Management Model (BGC-MAN). Forests 2019, 10, 523. https://doi.org/10.3390/f10060523
Song C, Pietsch SA, Kim M, Cha S, Park E, Shvidenko A, Schepaschenko D, Kraxner F, Lee W-K. Assessing Forest Ecosystems across the Vertical Edge of the Mid-Latitude Ecotone Using the BioGeoChemistry Management Model (BGC-MAN). Forests. 2019; 10(6):523. https://doi.org/10.3390/f10060523
Chicago/Turabian StyleSong, Cholho, Stephan A. Pietsch, Moonil Kim, Sungeun Cha, Eunbeen Park, Anatoly Shvidenko, Dmitry Schepaschenko, Florian Kraxner, and Woo-Kyun Lee. 2019. "Assessing Forest Ecosystems across the Vertical Edge of the Mid-Latitude Ecotone Using the BioGeoChemistry Management Model (BGC-MAN)" Forests 10, no. 6: 523. https://doi.org/10.3390/f10060523
APA StyleSong, C., Pietsch, S. A., Kim, M., Cha, S., Park, E., Shvidenko, A., Schepaschenko, D., Kraxner, F., & Lee, W.-K. (2019). Assessing Forest Ecosystems across the Vertical Edge of the Mid-Latitude Ecotone Using the BioGeoChemistry Management Model (BGC-MAN). Forests, 10(6), 523. https://doi.org/10.3390/f10060523