Article

Potential Distribution Shifts of Plant Species under Climate Change in Changbai Mountains, China

1
Northeast Institute of Geography and Agroecology, Chinese Academy of Sciences, Changchun 130102, China
2
Key Laboratory of Geographical Processes and Ecological Security in Changbai Mountains, Ministry of Education, School of Geographical Sciences, Northeast Normal University, Changchun 130024, China
*
Authors to whom correspondence should be addressed.
Forests 2019, 10(6), 498; https://doi.org/10.3390/f10060498
Submission received: 18 April 2019 / Revised: 17 May 2019 / Accepted: 7 June 2019 / Published: 11 June 2019

Abstract

:
Shifts in alpine tundra plant species have important consequences for biodiversity and ecosystem services. However, recent research on upward species shifts have focused mainly on polar and high-latitude regions and it therefore remains unclear whether such vegetation change trends also are applicable to the alpine tundra at the southern edges of alpine tundra species distribution. This study evaluated an alpine tundra region within the Changbai Mountains, China, that is part of the southernmost alpine tundra in eastern Eurasia. We investigated plant species shifts in alpine tundra within the Changbai Mountains over the last three decades (1984–2015) by comparing contemporary survey results with historical ones and evaluated potential changes in the distribution of dwarf shrub and herbaceous species over the next three decades (2016–2045) using a combination of observations and simulations. The results of this study revealed that the encroachment of herbaceous plants had altered tundra vegetation to a significant extent over the last three decades, especially within low and middle alpine tundra regions in Changbai Mountains, China. The herbaceous species would continue shifting upward and expanding while their dwarf shrub counterparts would continue shifting upward and shrinking over the next three decades under the RCP 4.5 and RCP 8.5 scenarios. The upward shifts of plant species would not keep up with the rate of climate warming under the RCP 8.5 scenarios. The dominant plant tundra species may transform from dwarf shrubs to herbaceous varieties. The results of this study provide a scientific basis for biodiversity protection under climate change and a reference data set for additional research on alpine vegetation dynamics.

1. Introduction

Alpine tundra is an important component of alpine ecosystems; this habitat type covers about three percent of the Earth’s land surface and harbors about four percent of higher plant species [1]. Plant species that live on alpine tundra are adapted to specific and harsh conditions including low temperature, high humidity, and large daily temperature range [2]. The ‘alpine tundra’ Köppen climatic type (the mean temperature of the warmest month is more than 0 °C and less than 10 °C) is thought likely to disappear from many mountains as temperatures continue to rise [3]. Indeed, the very particular kinds of geographic environments that include alpine tundra plant species have tended to shift upward in elevation as a result of global warming [4]. This phenomenon has been shown to drive upward shifts in elevation in both the leading and rear edges of mountain plant species [5]. These shifts in plant species undoubtedly alter the functional composition, vegetation albedo, surface energy exchange, soil temperatures, and carbon cycling [6], as well as biodiversity and ecosystem services by influencing abiotic and biotic environments [7,8]. The study of alpine tundra plant species shifts is therefore of great significance for biodiversity protection and effective management, as well as for the prediction of local climate changes in the context of global warming.
Research has shown that lower elevation shrubs have encroached onto alpine tundra over recent decades in Alaska [9], the Canadian arctic [8], the European arctic [10], Arctic Russia [11], the European Alps [12], and High Tatras [13]. Such encroachments have resulted in alpine tundra area shrinkages over time [6,8]. However, recent research on upward species shifts focused mainly on polar and high-latitude regions and it therefore remained unclear whether such vegetation change trends also were applicable to the alpine tundra at the southern edges. In addition, previous studies have focused only on plant species range shifts over the recent decades; few researchers have paid attention to likely future taxonomic changes in alpine tundra plant species. A number of uncertainties therefore remain with regard to alpine species range shifts in light of future climate change [8], especially variations in temperature and precipitation. It is therefore unclear how potential distributions of species will change as a result of climate change in the future, especially which are likely to shift upwards along the altitudinal gradient.
A range of methods have been proposed to investigate tundra plant species changes, including resurveying historic vegetation plots, warming experiments, and modeling [4,14,15]. The first of these approaches, resurveying historic vegetation plots, provides a unique opportunity to evaluate vegetation changes over recent decades and has therefore become increasing popular as a research method [14]. Although short-term warming experimental simulations can also be used to interpret species compositional changes at finer scales, these approaches cannot be used to address plant taxonomic range changes at larger scales and also underestimate the full magnitude of global change effects on communities [4]. Ecological niche models (ENMs) have also been widely utilized to predict potential species distributions and to estimate range expansions or shrinkages under current and future climatic conditions [15,16,17]. These models utilize the current spatial distribution of plant species to infer their climatic requirements and predict their spatial distribution in future climates according to the requirements of these systems [18]. The use of ENMs to predict the potential distribution of plant species has nevertheless been subject to some criticism because these approaches do not take biotic interactions and dispersals into account [19]. In spite of these limitations, however, the main advantage of ENMs is that these approaches are easy to handle and offer a relatively easy system by which decision makers and land managers can obtain acceptable models to assess the potential distributional shifts in species over reasonable time frames [16,20,21].
Alpine tundra is particularly prone to clouds and rainfall which means it is often difficult to obtain suitable remote sensing images that are used as the input of current distributions for plant species in some models. Range shifts in alpine species are therefore most often monitored using a belt transect method along an elevation gradient as this is the most appropriate approach to obtain current distributional data [22]. We combined the resurveying historical vegetation plots, field monitoring (the belt transect method), and model simulation (ENM) to evaluate alpine species range shifts within the Changbai Mountains, China, that is part of the southernmost alpine tundra in eastern Eurasia. The herbaceous plants encroachment to alpine tundra was found in the late 1980s [23], nearly 30 years from that time. We initially compared our contemporary vegetation survey results with historic ones to investigate alpine species shifts along an elevation gradient over the last three decades (1984–2015) within the Changbai Mountains, China. We then evaluated potential distributional changes in dwarf shrub and herbaceous species over the next three decades (2016–2045). After the 30 years of herbaceous plants encroachment to alpine tundra, we hypothesized (1) the encroachment of herbaceous plants had altered tundra vegetation significantly over the past three decades—the reason for the different responses between herbs and dwarf shrubs is not clear. Based on the current climatic niches of these species, we supposed that (2) the distribution of herbaceous species was likely to continue to shift upwards and expand over the next three decades, and (3) dominant tundra species were likely to transition from dwarf shrubs to herbaceous ones into the future.

2. Materials and Methods
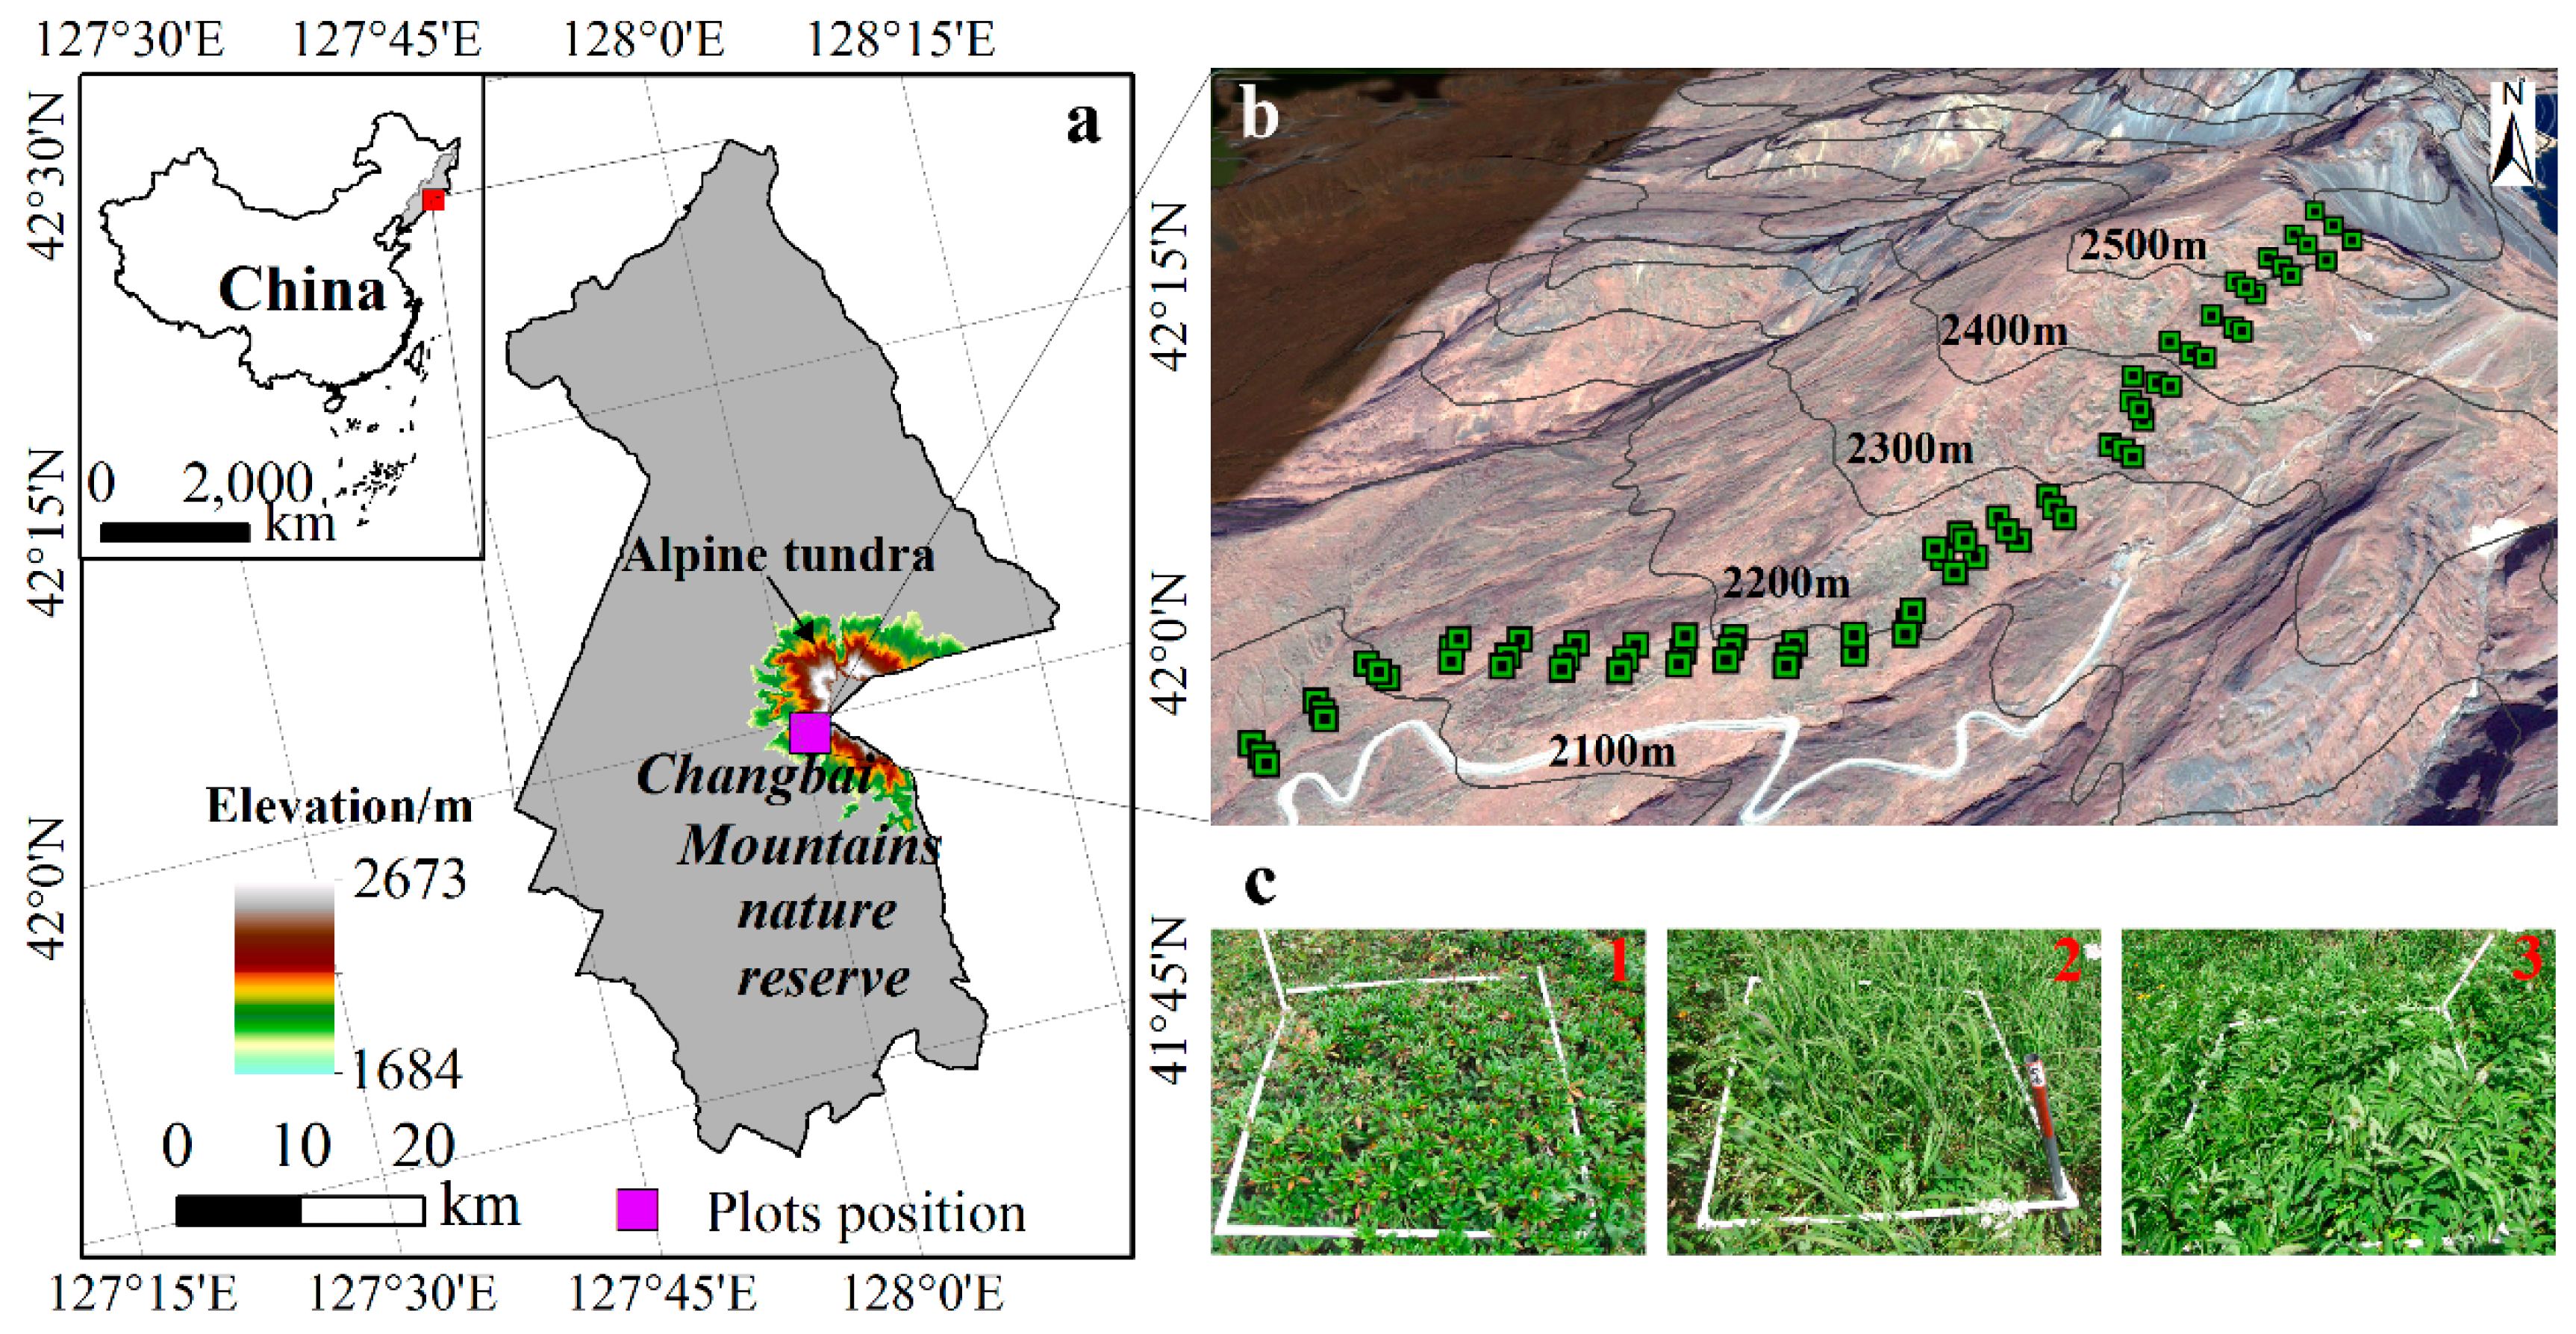
2.1. Study Area

This study was carried out within alpine tundra along the western slope of the Changbai Mountains (Figure 1a), including the highest peak in northeastern China. Alpine tundra above the tree line in this region is the most typical of its kind in China as well as the southern border of this vegetation type within eastern Asia. This habitat type is also subject to a climate that is characterized by long and cold winters that last for up to eight months as well as a short growing season between June and September; alpine tundra in this region experiences a mean temperature of 5.8 °C and mean precipitation of 958 mm within the growing season [24]. Annual precipitations of between 600 and 900 mm as well as 1400 mm were recorded at the foot and summit (Tianchi station) of the Changbai Mountains, respectively [25]. The average snow thickness in this region is about 1 m in winter. The morphology of alpine tundra comprises the rock debris slope and ravine formed by flowing water. Tundra soil is very thin, usually not more than 30 cm in thickness, and is covered by dwarf shrubs, mosses, and lichens. The dominant plant species found in this region include the dwarf shrubs (Rhododendron chrysanthum Pall., Vaccinium uliginosum L., and Dryas octopetala L.) as well as herbaceous plants (Saussurea tomentosa Kom. and Carex aterrima Hoppe). The rapid warming over recent decades has resulted in changes to alpine tundra vegetation including the upward migration of the tree line in this region to tundra [26] as well as the encroachment of herbaceous plants, including Deyeuxia angustifolia Kom. [27].

2.2. Historical Vegetation Survey

In early work, Huang and Li (1984) divided alpine tundra vegetation within the Changbai Mountains into four types and 15 communities on the basis of elevation, slope, topography, soil, and plant community structures by surveying plots [28]. The four variations recognized by Huang and Li (1984) comprised dwarf shrub-lichen (between 2000 and 2200 m above sea level), dwarf shrub-moss-lichen (between 2200 and 2400 m a.s.l.), herb (Kobresia bellardii (All.) Degl.)-dwarf shrub (between 2400 and 2500 m a.s.l.), and meadow (in cleugh under 2100 m a.s.l.) tundra types [28]. Dwarf shrubs were shown to be the clearly dominant plant species within 15 alpine tundra communities, while the D. angustifolia and S. sitchensis were only recorded in one community as rare species [28]. Information from this study did not include the accurate positions of vegetation plots; we were nevertheless able to compare the results of this earlier study with ours along an elevation gradient in order to identify changes in alpine tundra vegetation [14].

2.3. Contemporary Vegetation Survey

Previous studies in the same study area plotted the species-area curves and suggested the minimum area of plant communities’ investigation was 0.8–0.9 m2 [29]. For the convenience of investigation, we used the plot with 1 × 1 m to investigate the current distributions of tundra plant species. Vegetation plots were set up along a transect on the western slope of Changbai Mountain at a slope distance interval of 100 m in August 2015 using a systematic sampling method in order to investigate the current distributions of species (Figure 1b). The elevations of plots ranged between 2050 m (the tree line and tundra ecotone) to 2550 m (the upper tundra boundary). We chose three sample belts vertical to elevation; each of these belts comprised 25 plots up to a total of 75 overall. A slope distance of 25 m between two neighboring sample belts was maintained in this study to ensure a representative number of plant species was present at each gradient. Plots were fixed using PVC pipes and nylon cords to enable long-term monitoring and to determine the distribution of species. The nearest straight distance from the highway to each plot was always greater than 30 m, ensuring minimal disturbance due to human activities. We also randomly chose other 20 plots as verification to assess the results of ENMs. We used the independent t-test method to evaluate the significant difference between the two surveys.
A detailed vegetation survey was then carried out within each plot in August 2015. Data including plant name, coverage, number of plants (cluster), north-south and east-west crown diameter, and plant height were recorded while the longitude, latitude, and elevation of each plot were also determined using GPS. We used a compass to measure slope and slope direction and recorded the slope location for each plot alongside soil depth. Soil from each plot was sampled using a 3 cm diameter soil auger and physicochemical properties were determined, including particle size (clay, particle, and sand), organic carbon (C), available nitrogen (N), potassium, phosphorus, humic acid, and fulvic acid, as well as the C:N ratio.
In addition to investigating topography and soil properties, temperature and precipitation were also monitored within each plot. We buried a temperature recorder (Tidbit@Tv2) to a depth of 5 cm; this instrument had a resolution of 0.02 °C and collected data every 30 minutes to provide a long-term data series that can be used for monitoring [30]. The soil temperature data used in this paper encompassed the three complete growing seasons (June to September) between 2015 and 2017; in addition, we also monitored air temperature at every altitudinal gradient between 2050 and 2550 m at 100 m interval. Two automatic weather stations (WeatherHawk 610, Campbell Scientific, Logan, UT, USA) were set up at elevations of 2135 m and 2246 m to monitor and record tundra precipitation. Data show that precipitation gradually increases in concert with altitude within the Changbai Mountains; automatic weather station values for growing season mean precipitation were 1294 mm and 1372 mm at 2135 m and 2246 m on the western slope of Changbai Mountains between 2015 and 2017, respectively. Precipitation values for each plot were interpolated on the basis of the relationship between precipitation and elevation [25].

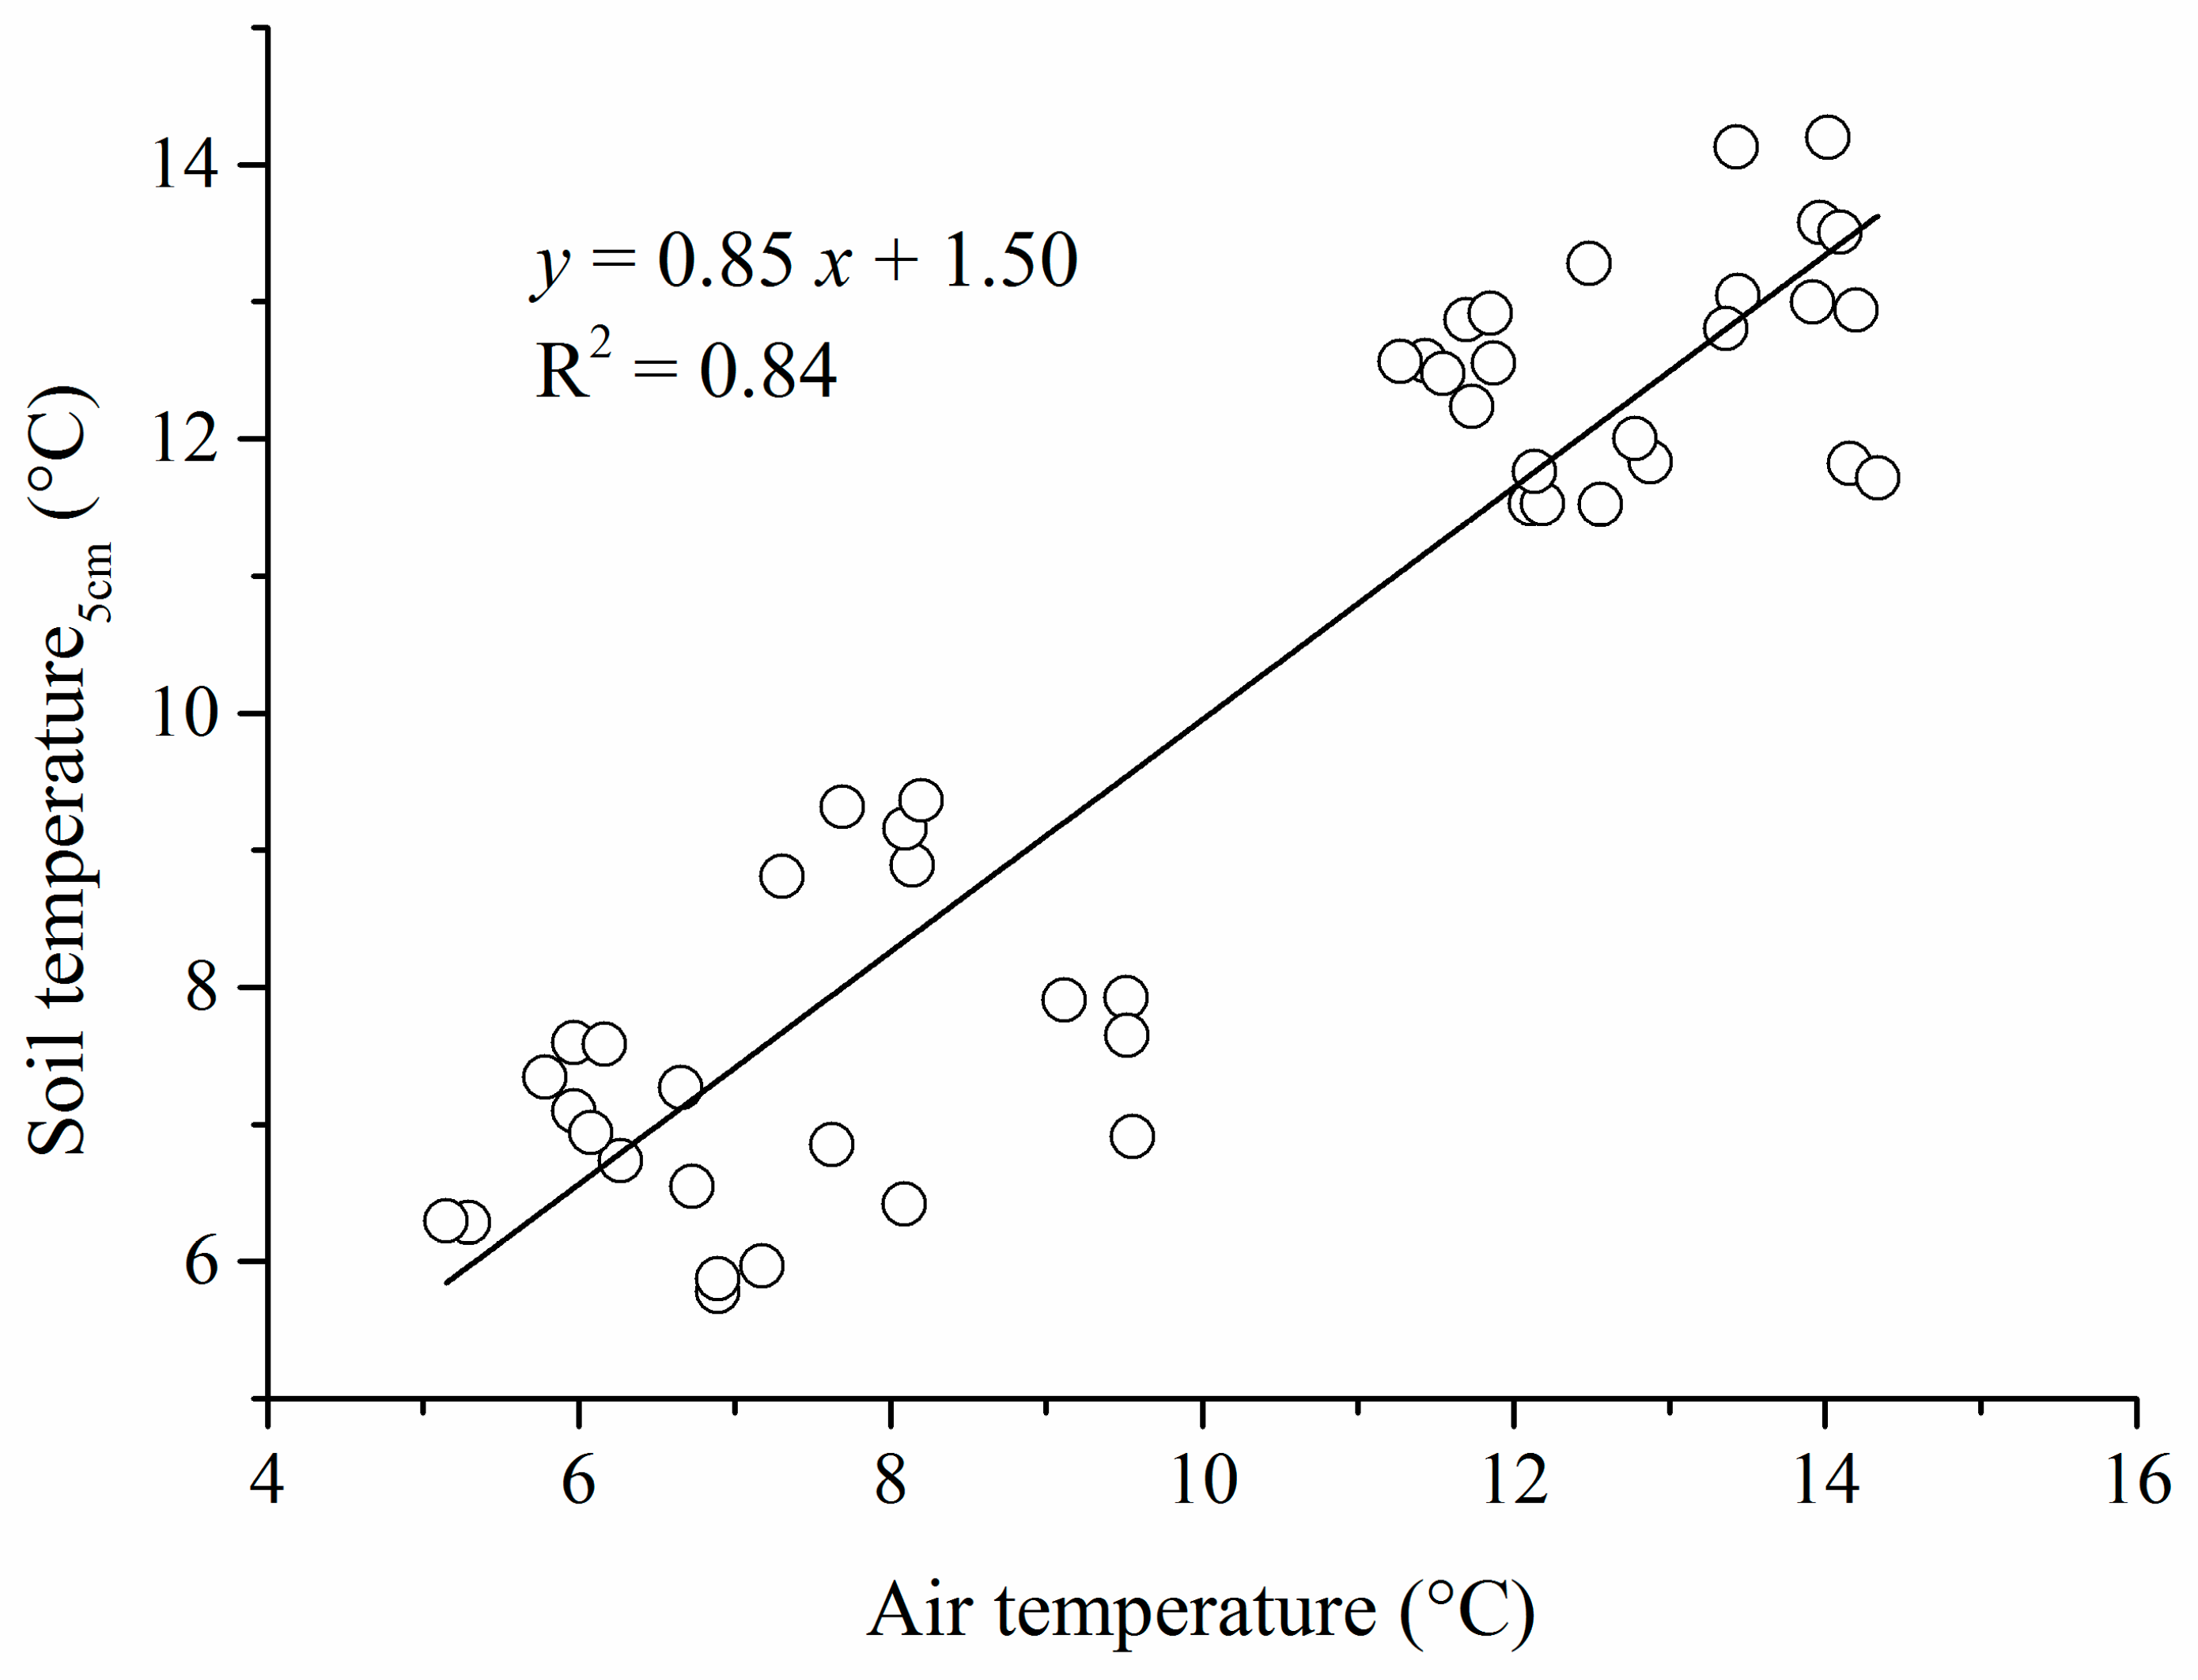
2.4. Historical and Future Climate Data

The historical climate data used in this study encompassed the period between 1984 and 2015 and were obtained from Tianchi Station (42°01′ N, 128°05′ E), approximately 4 km from our study area at 2623 m elevation. The climate data in this station for winter half year were not available from 1989. Data quality control and homogeneity assessments were performed by the National Meteorological Information Center before release.
We chose to use future simulation data (encompassing the period between 2016 and 2045, which is similar with the time frame of the historical data availability) in a series of general circulation models (GCMs) taken from the Coupled Model Intercomparison Project Phase 5 (CMIP5) (https://esgf-node.llnl.gov/search/cmip5/) under three representative concentration pathways (RCP4.5 and RCP8.5) in order to analyze likely future changes in temperature and precipitation within the Changbai Mountains (Supplementary Table S1), which represent mild and severe future climate change, respectively. Thus, in order to obtain accurate estimates for future climate change and to increase result comparability between two RCPs, selected GCMs must simultaneously meet two conditions [31]: (1) They must output daily temperature and precipitation data; and (2) they must simultaneously output two data series under two RCPs. We therefore employed the bilinear interpolation method to interpolate data from the different models into 0.5° × 0.5° grids. In addition, as the GCMs used here all exhibit different performances with respect to temperature and precipitation in northeastern China [31], we adopted a total of six GCMs to investigate future changes in both these variables, including BCC-CSM1.1m, CCSM4, CNRM-CM5, FGOALS-g2, MIROC5, and MRI-CGCM3. Trends in temperature and precipitation under RCPs in the Changbai Mountains were then used to represent alpine tundra in order to reduce uncertainty. In this study, the changes of temperature and precipitation in different altitudes were deemed to no difference because of the small area and small difference in height. We analyzed trends within temperature and precipitation using the linear tendency method, with the ordinary least-squares technique [32]. The nonparametric Mann–Kendall statistical test [33] was used to detect whether the linear trends of temperature and precipitation reach statistical significance.

2.5. Climate Ecological Niche Modeling

We firstly discriminated the dominant environmental factors controlling the distributions of alpine tundra plant species prior to model building. We then built the ENM for each species using dominant environmental factors (temperature and precipitation) based on their contemporary distributions. Finally, the changes in species were evaluated by the changes of dominant environmental factors under the RCP4.5 and RCP8.5 emission scenarios and the unchanged realized climate niche for each species. We estimated whether upward shifts of plant species could track the rates of future climate change through comparing the rates of upward shifts of species with the rates of climate change in elevation. We estimated the rates of climate change as the ratio of the magnitudes of climate warming and the temperature lapse rate (0.6 °C/100 m) [34].
Plant species that occurred at frequencies less than 5% across the study area were excluded from this analysis. We established two data matrices: the importance values for 42 plant species and environmental (topography, soil, and climate) factors in 75 plots, respectively. We found that the maximum length value for the first four axes was 5.39 using the detrended correspondence analysis (DCA). We therefore chose canonical correspondence analysis to analyze the relationships between plant species and environmental factors [35]. This ordination analysis was performed using the vegan package [36] within the R software (v 3.0.1.; R Foundation for Statistical Computing, Vienna, Austria). This analysis showed that water and heat conditions were more important factors than soil nutrients in controlling the distribution of plant species within alpine tundra (Supplementary Table S2). On the basis of the vegetation survey records, we selected R. chrysanthum (Figure 1c1) (a native plant species), D. angustifolia (Figure 1c2) and S. sitchensis (Figure 1c3) (the dominant encroaching herbaceous species) as exemplars to investigate potential changes in the distribution of dwarf shrub and herbaceous species across the tundra.
We utilized warmth (WI) and humidity indices (HI) to build plant species ENMs [37,38]. In this context, WI denotes the sum of monthly average temperatures higher than 5 °C, the thermal condition required for plant growth. Soil temperatures at a depth of 5 cm were therefore monitored for each plot; these values reflect changes in micro-topography as well as soil moisture. These values were then used to calculate WI for each plot as opposed to air temperature. The relationship between air and soil temperatures at a depth of 5 cm (Figure 2), WI, was therefore calculated using monthly average soil values at a depth of 5 cm higher than 5.75 °C as heat index for plant species. The formula used in this study was as follows:
W I = i = 1 n T 5 c m 5.75
In this expression, T 5 c m denotes monthly average soil temperature at a depth of 5 cm, expressed in °C·month units.
Moisture is also a crucial factor that determines the distribution of plants. Thus, HI was used in this study as the moisture index for plant species [39], as follows:
H I = P / W I
In this expression, P denotes annual precipitation. Thus, as tundra within the Changbai Mountains is covered with snow during the non-growing season, annual precipitation was adjusted to growing season values, expressed in mm/°C·month units.
In order to calculate the optimal range of plant species indices, we adopted the method of peak width at half height proposed by Yim (1977) [40]. The formulas used to express the optimal ranges of heat and moisture distributions were as follows:
( X ¯ 1 2 P W H ,   X ¯ + 1 2 P W H )
and
P W H = 2.354 × S
In this expression, X ¯ denotes the mean value for WI or HI, while S refers to standard deviation in WI and HI. According to the contemporary spatial distributions of the three plant species (Supplementary Figure S1) as well as the WIs and HIs (Supplementary Figure S2) present in each plot, we assessed climate niches for R. chrysanthum, D. angustifolia, and S. sitchensis, respectively (Supplementary Figure S3). Based on the climate niche for each species, we evaluated the changes in three species by the changes of WI and HI under the RCP4.5 and RCP8.5 emission scenarios. We used the receiver operating characteristic (ROC) method by computing the area under the ROC curve (AUC) to evaluate the performance of the model [41]. The traditional academic points system [42] was employed to classify the accuracy of the diagnostic test: poor (0.5–0.6), fair (0.6–0.7), good (0.7–0.8), very good (0.8–0.9), and excellent (0.9–1); the values more than 0.75 are regarded as potentially useful [43,44].

3. Results

3.1. Historical and Future Changes in Climate

Growing season temperature increased with 0.4 °C/decade over the study period (p > 0.01; Figure 3a). There was a slight, although insignificant, tendency for precipitation to decrease over the same period (−42.6 mm/decade; Figure 3b). Growing season temperatures predicted significant increasing trends between 2016 and 2045 with averages of 0.1 °C/decade (p < 0.05) and 0.4 °C/decade (p < 0.01) under mild climate change and severe climate change, respectively (Figure 3c). Precipitation showed different trends under the two RCPs over the same period (Figure 3d). Precipitation tended to significantly increase under mild climate change at a magnitude of 22.8 mm/decade (p < 0.01), but decreased under severe climate change. Climate conformed to a warming-wetting trend under a low emission scenario as well as a warming-drying trend under a high emission scenario between 2016 and 2045. Significant changes also occurred in WI and HI for each plot under both scenarios by 2045 (Supplementary Figure S4).

3.2. Changes in Alpine Tundra Vegetation over the Last 30 Years

A total of 62 plant species within 24 families were recorded in 75 tundra plots. The result of this study showed that tundra vegetation changed significantly by 2015, comprising herb (D. angustifolia and S. sitchensis)-shrub (less than 2100 m a.s.l), shrub-herb (between 2100 and 2300 m a.s.l), dwarf shrub (between 2300 and 2400 m a.s.l), and sparse shrub (over 2400 m a.s.l) tundra types by this time (Table 1). Records showed that dwarf shrubs were the absolutely dominant plant species in alpine tundra by 1984, irrespective of elevation, while the D. angustifolia and S. sitchensis were only recorded in one community as rare species. However, the D. angustifolia and S. sitchensis were the dominant alpine tundra plant species at low elevations by 2015 and had encroached into the middle section of alpine tundra. The importance value of S. sitchensis was only lower than that of R. chrysanthum among tundra species by this time, while the frequency and importance values for D. angustifolia were higher than those for V. uliginosum and D. octopetala, typical tundra dwarf shrubs (Table 2). The elevation ranges of D. angustifolia and S. sitchensis showed significant differences (p < 0.05) between both surveys, which were obvious rising in 2015 (Figure 4).

3.3. Potential Shifts in Tundra Plant Species under Different Emission Scenarios

The results on prediction performance in R. chrysanthum, D. angustifolia, and S. sitchensis showed AUC values of 0.84 ± 0.03, 0.76 ± 0.08, and 0.80 ± 0.05, respectively, which all were potentially useful (Supplementary Figure S5). The potential plot occupancies for R. chrysanthum shrank by 2% and 27% under RCP 4.5 and 8.5 scenarios, respectively (Table 3, Figure 5). Similar, potential plot occupancies for D. angustifolia and S. sitchensis expanded by 2% and 7%, respectively, under mild climate change and by 38% and 52%, respectively, under severe climate change. The upper elevation limits for R. chrysanthum rose to 2550 m by 2045 under mild climate change but did not change under severe climate change. Both upper elevation limits for D. angustifolia and S. sitchensis in 2045 rose to 2375 m under mild climate change and to 2475 m under severe climate change. The upper elevation limits for D. angustifolia and S. sitchensis increased to a greater extent under the high emission scenario than these under a low emission one.

4. Discussion

4.1. Historical Plant Species Distribution Shifts within Alpine Tundra

Alpine tundra climate has become both warmer and drier over the last three decades within Changbai Mountains, China. The results of this analysis suggest that the upper limits for the herbaceous species shift upwards and the distributions for them expanded across alpine tundra within the Changbai Mountains for recent decades, which are different from previous studies (upward shifts in erect shrubs across alpine tundra) in polar and high-latitude regions [6,8,45]. Although the tree line shows an upward migration in this region to tundra [26], the upper limits of the herbaceous species are higher than that of the tree line. The exact upper limit of tree line was at 2030 m in 1994 [26]. We could not obtain the exact upper limits for the herbaceous species in 1984. However, we conservatively estimated that the upper limit of the herbaceous species was at 2030 m in 1984. Thus, the magnitude of species range shift revealed here was 73.3 m/decade which was far higher than that estimated for species within central European mountains (e.g., 23.9 m/decade [46]; 29.4 m/decade [47]) and lower than the observed plant species shift with 150 m/decade in Himalaya [48]. The difference among the magnitudes of species range shift may be relative to the rates of warming [49]. Because growing season temperature increased significantly with 0.4 °C/decade in our study region, which was lower than the rate of warming with 0.59 °C/decade in Himalaya [48] and higher than that in the Rhaetian Alps with a magnitude of 0.32 °C/decade [47]. According to our conservative hypothesis, the upper limit of herbaceous species kept up with the rate of climate warming for the past three decades.
At the same time, there was no significant change in the lower limit of R. chrysanthum over the past three decades, which did not track climate change along the elevation gradient likely due to topography. The temperature is dominated by solar radiation and aerodynamics and co-controlled by micro-topography and plant morphology, which results in a mosaic of micro-climates [50]. Micro-topography also changes the distribution of soil moisture by influencing water flow [51]. The micro-climatic conditions are therefore associated with plant species distribution in alpine areas and might buffer impacts on plant species rather than forcing them upslope [50]. Although there was no significant change in the lower limit of R. chrysanthum, the distribution area of R. chrysanthum shrank. Herbaceous plants in our field area crossed the tree line and invaded into alpine tundra from the birch forest zone; thus, once herbaceous plants encroached to dwarf shrub species, they influenced solar radiation, soil moisture and nutrition and resulted in the death of these taxa [27].

4.2. Possible Factors Controlling Plant Species Shifts

Previous researchers have demonstrated that numerous factors were responsible for observed range shifts in alpine plant species, including climate change [46] and land use changes (i.e., the cessation of sheep grazing) [13], tourism [45], and the increased deposition of atmospheric nitrogen [1,52]. The control experiments carried out on alpine tundra within the Changbai Mountains showed that increased deposition of atmospheric N was conducive to the growth of herbaceous species and was therefore not the direct factor underlying encroachment [53]. At the same time, tourism influences tundra vegetation dynamics via trampling and can therefore influence soil compaction, erosion, and humidity, as well as the dispersal of plant species seeds [45]. Although the number of tourists visiting the Changbai Mountains had rapidly increased in recent years [54], strict scenic area management had limited their activities to wooden walkways, stairs, and observation decks (Supplementary Figure S6). Thus, if tourism had actually promoted the encroachment of herbaceous plants, then more of these species should occur along wooden walkways. This was not corroborated by our field survey as few herbaceous plants were actually recorded adjacent to these walkways.
Land-use changes are known to have influenced tundra plant species range shifts, such as the abandonment of agriculture and grazing in alpine areas [13]. This situation is different in the Changbai Mountains, however, since this region has been a national nature reserve since 1986; alpine tundra within these mountains comprise the core nature reserve area and has never been utilized as either farmland or pasture. Indeed, some recent research has shown that the Sus scrofa population has been increasing within the Changbai Mountains [55]; we identified S. scrofa activities during our alpine tundra survey adjacent to the tree line (Supplementary Figure S7), utilizing R. chrysanthum communities to find food. Areas hogged by S. scrofa tends to be encroached into by herbaceous plants. In other words, if the activities of S. scrofa have induced the upward migration of herbaceous plants, the altitude gradients of encroached species would be lower than those within which S. scrofa was active. Our field survey showed, however, that the upper elevation limit (about 2250 m) for encroaching herbaceous plants was far higher than that (about 2150 m) characterized the upper extent of S. scrofa activities. The configuration change observed in temperature and precipitation along our alpine tundra transect had influenced vegetation dynamics, which was consistent with previous results [13,45,46]. However, the dominant factor driving plant species shifts on the Changbai Mountains alpine tundra needs to be further investigated by controlled experiments, which will be done in our subsequent study.

4.3. Potential Plant Species Distribution Shifts within Alpine Tundra

The results of this analysis suggest that the potential upper limit for the dwarf shrub is likely to shift upwards across alpine tundra within the Changbai Mountains in the future. This is consistent with previous research; upward shifts in erect shrubs across alpine tundra have been reported in many other mountains, including the Rocky Mountains [6], the Alps [8], and the High Tatras [56]. The potential upper limit of R. chrysanthum is likely to shift upwards by 50 m under two scenarios over the next three decades. The magnitude of species range shift is 16.7 m/decade, lower than that estimated for species within central European mountains (e.g., 23.9 m/decade [46]; and 29.4 m/decade [47]. The upper limit of R. chrysanthum is likely to keep up with the rate of climate warming under mild climate change (16.7 m/decade) but will not be able to catch up under severe climate change (66.7 m/decade). One possible reason for a lower upward shift in the upper limit under severe climate change is the elevation limit of the Changbai Mountains; the distribution of R. chrysanthum remains close to the mountain summit, consistent with the result of Felde et al. (2012) [57]. At the same time, we show no change in the potential lower limit of R. chrysanthum under mild climate change likely due to the micro-climatic conditions controlled by topography. This impact can only offset low magnitude warming, however, the potential lower limit of R. chrysanthum shifted upward by 50m while potential plot occupancies shrank significantly under severe climate change.
Our results also demonstrate that herbaceous species are likely to shift upwards and expand under RCPs in the future. The mean magnitude of potential upper limit upward shift for herbaceous species is 25.8 m/decade and 58.5 m/decade under the RCP4.5 and RCP8.5 scenarios, respectively. These results mean that the upper limit of herbaceous species will keep pace with the rate of climate warming under mild climate change, but will not catch up under severe climate change. These rates approach, or exceed, those recorded for mountains in central Europe [46,47]. The upward shift rate for herbaceous species (non-native species) was higher in our study area than that for dwarf shrub plants (native species), a similar result to that reported on the island of Hawaii [58]. The potential plot occupancies of these species are likely to significantly increase under two scenarios in the future due to upward shift in upper limits as well as the filling process [57]. Although the potential upper elevation limits for dwarf shrubs increased in our survey, these taxa had reached the upper tundra boundary (the lower the alpine desert boundary or the mountain top) and then could not increase with climate warming. Changes in alpine tundra vegetation are therefore likely to be from dwarf shrub-dominated to herbaceous-dominated in the future.

4.4. Uncertainties in Potential Distribution Shifts

There are a number of uncertainties in predicting plant species distribution using interpolated air temperatures from weather stations as these are different from actual dwarf alpine species temperatures [49,59]. Although we monitored soil temperature for each plot in this study to reduce this issue, projected data nevertheless included some uncertainties derived from GCMs. We also reduced the level of uncertainties by selecting high resolution GCMs that performed better across northeastern China. At the same time, however, it is clear that some variables might result in uncertainties in future climate change projections, including model resolutions and the rationality of physical processes [60]. Recent studies have suggested that models with higher resolutions and more physical process rationality might mitigate these issues [31]. It will be possible to carry out a more comprehensive evaluation of potential tundra vegetation shifts in the future using output data from advanced GCMs.
Research has shown that the distribution of plant species is influenced by climate, geology, edaphic factors, and inter- and intra-species competition [6,21,61]. ENMs have some limitations to predict species distribution under future climate. For example, ENMs are likely to use the realized niche rather than the fundamental niche, which can generate mistakes [62]. In addition, species dispersal and biotic interactions are not taken into consideration [19]. We only used warmth and humidity indices to build ENMs instead of other factors. Dubuis et al. (2013) found that pH was an important predictor variable for explaining species distribution in the western Alps, Switzerland [61]. Our canonical correspondence analysis results also highlighted the fact that soil nutrients played a role in determining the distribution of species. The results of this study could also be improved by using more accurate topo-climatic data as well as a model that include additional environment factors and processes [61]. A more accurate evaluation of potential shifts will also necessitate the integration of ENM and mechanistic models that simulate the distribution of plant species based on functions that are founded on physiological knowledge [18].

5. Conclusions

The encroachment of herbaceous plants altered tundra vegetation significantly within the Changbai Mountains for the last decades (1984–2015), especially in low and middle elevation areas. The distribution of dwarf shrub species is likely to shift upwards and shrink over the next three decades, while herbaceous species are likely to also continue shifting upwards and expanding under mild climate change and severe climate change. Dominant tundra vegetation plant species are likely to transform from dwarf shrubs to herbaceous taxa over time. R. chrysanthum was unable to track climate change along the elevation gradient; this is likely to lead to the extinction of this species as well as a decrease in biodiversity and changes in alpine tundra ecosystem services within the Changbai Mountains. The alpine tundra in the Changbai Mountains has a tendency to turn into meadow. This study provides a scientific basis for biodiversity protection under climate change and a reference data set for additional research on alpine vegetation dynamics.

Supplementary Materials

The following are available online at https://www.mdpi.com/1999-4907/10/6/498/s1; Figure S1: Current spatial distributions of dominant alpine tundra plant species (R. chrysanthum, D. angustifolia, and S. sitchensis) along western slope transect within the Changbai Mountains; Figure S2: Contemporary distributions of WI and HI values for each plot across alpine tundra along a western slope transect within the Changbai Mountains; Figure S3: Ecological climate niches for the dominant species R. chrysanthum, D. angustifolia, and S. sitchensis were assessed using warmth index and humidity index, respectively; Figure S4: Spatial changes in WI and HI differences during the growing season between 2015 and 2045 under two RCP scenarios; Figure S5: The AUC values of R. chrysanthum, D. angustifolia, and S. sitchensis; Figure S6: The tourist activities were limited to the wooden walkways, stairs, and observation decks in the Changbai mountains; Figure S7: The damages of Sus scrofa foraging to alpine tundra vegetation within the Changbai Mountains. The areas hogged by Sus scrofa are easy to be encroached by the herbaceous plants; Table S1: Information on six general circulation models from CMIP5 used in this study; Table S2: The correlations between the environmental variables and plant species are evaluated by canonical correspondence analysis.

Author Contributions

Conceptualization, Z.W., W.J.W., and L.W.; Methodology, L.W. and H.D.; Software, S.Z. and S.M.; Validation, L.W., S.Z., and S.M.; Investigation, L.W., S.Z., and H.D.; Writing—original draft preparation, L.W.; Writing—review and editing, W.J.W.; Funding acquisition, Z.W., W.J.W., and L.W.

Funding

This research was funded by the National Natural Science Foundation of China, grant number 41801081, 41871045, and 41471085, the Natural Science Foundation of Jilin Province, China, grant number 20190103153JH and 20190201119JC, and the key laboratory project of wetland ecology and environment, Chinese Academy of Sciences, grant number O9B3017001.

Acknowledgments

We acknowledge the China Meteorological Data Sharing Service System for sharing the Chinese observed climate data.

Conflicts of Interest

The authors declare no conflict of interest.

References

  1. Korner, C. Alpine Plant Life: Functional Plant Ecology of High Mountain Ecosystems; Springer: New York, NY, USA, 2001. [Google Scholar]
  2. Theurillat, J.P.; Guisan, A. Potential Impact of Climate Change on Vegetation in the European Alps: A Review. Clim. Chang. 2001, 50, 77–109. [Google Scholar] [CrossRef]
  3. Diaz, H.F.; Eischeid, J.K. Disappearing “alpine tundra” Koppen climatic type in the western United States. Geophys. Res. Lett. 2007, 34, L18707. [Google Scholar] [CrossRef]
  4. Farrer, E.C.; Ashton, I.W.; Spasojevic, M.J.; Fu, S.; Gonzalez, D.J.X.; Suding, K.N. Indirect effects of global change accumulate to alter plant diversity but not ecosystem function in alpine tundra. J. Ecol. 2015, 103, 351–360. [Google Scholar] [CrossRef] [Green Version]
  5. Rumpf, S.B.; Hülber, K.; Klonner, G.; Moser, D.; Schütz, M.; Wessely, J.; Willner, W.; Zimmermann, N.E.; Dullinger, S. Range dynamics of mountain plants decrease with elevation. Proc. Natl. Acad. Sci. USA 2018, 115, 1848. [Google Scholar] [CrossRef] [PubMed]
  6. Formica, A.; Farrer, E.C.; Ashton, I.W.; Suding, K.N. Shrub Expansion Over the Past 62 Years in Rocky Mountain Alpine Tundra: Possible Causes and Consequences. Arct. Antarct. Alp. Res. 2002, 46, 616–631. [Google Scholar] [CrossRef]
  7. Dumais, C.; Ropars, P.; Denis, M.P.; Dufourtremblay, G.; Boudreau, S. Are low altitude alpine tundra ecosystems under threat? A case study from the Parc National de la Gaspésie, Québec. Environ. Res. Lett. 2014, 9, 094001. [Google Scholar] [CrossRef]
  8. Myerssmith, I.; Forbes, B.C.; Wilmking, M.; Hallinger, M.; Lantz, T.; Blok, D.; Tape, K.D.; Maciasfauria, M.; Sassklaassen, U.; Lévesque, E. Shrub expansion in tundra ecosystems: dynamics, impacts and research priorities. Environ. Res. Lett. 2011, 6, 045509. [Google Scholar] [CrossRef] [Green Version]
  9. Ken, T.; Matthew, S.; Charles, R. The evidence for shrub expansion in Northern Alaska and the Pan-Arctic. Glob. Chang. Biol. 2006, 12, 686–702. [Google Scholar]
  10. Hallinger, M.; Manthey, M.; Wilmking, M. Establishing a missing link: Warm summers and winter snow cover promote shrub expansion into alpine tundra in Scandinavia. New Phytol. 2010, 186, 890–899. [Google Scholar] [CrossRef]
  11. Forbes, B.C.; Macias Fauria, M.; Zetterberg, P. Russian Arctic warming and ‘greening’ are closely tracked by tundra shrub willows. Glob. Chang. Biol. 2010, 16, 1542–1554. [Google Scholar] [CrossRef]
  12. Cannone, N.; Sgorbati, S.; Guglielmin, M. Unexpected Impacts of Climate Change on Alpine Vegetation. Front. Ecol. Environ. 2007, 5, 360–364. [Google Scholar] [CrossRef]
  13. Czortek, P.; Eycott, A.E.; Grytnes, J.A.; Delimat, A.; Kapfer, J.; Jaroszewicz, B. Effects of grazing abandonment and climate change on mountain summits flora: A case study in the Tatra Mts. Plant Ecol. 2018, 219, 1–16. [Google Scholar] [CrossRef]
  14. Kapfer, J.; Hédl, R.; Jurasinski, G.; Kopecký, M.; Schei, F.H.; Grytnes, J.A. Resurveying historical vegetation data-opportunities and challenges. Appl. Veg. Sci. 2016, 20, 164–171. [Google Scholar] [CrossRef] [PubMed]
  15. Mateo, R.G.; Mokany, K.; Guisan, A. Biodiversity Models: What If Unsaturation Is the Rule? Trends Ecol. Evol. 2017, 32, 556–566. [Google Scholar] [CrossRef] [PubMed] [Green Version]
  16. Guisan, A.; Thuiller, W. Predicting species distribution: offering more than simple habitat models. Ecol. Lett. 2005, 8, 993–1009. [Google Scholar] [CrossRef]
  17. Zimmermann, N.E.; Edwards, T.C.; Graham, C.H.; Pearman, P.B.; Svenning, J.C. New trends in species distribution modelling. Ecography 2011, 33, 985–989. [Google Scholar] [CrossRef]
  18. Hijmans, R.J.; Graham, C.H. The ability of climate envelope models to predict the effect of climate change on species distributions. Glob. Chang. Biol. 2006, 12, 2272–2281. [Google Scholar] [CrossRef]
  19. Taylor, S.; Kumar, L.; Reid, N.; Kriticos, D.J. Climate change and the potential distribution of an invasive shrub, Lantana camara L. PLoS ONE 2012, 7, e35565. [Google Scholar] [CrossRef]
  20. Walker, G.A.; Robertson, M.P.; Gaertner, M.; Gallien, L.; Richardson, D.M. The potential range of Ailanthus altissima (tree of heaven) in South Africa: the roles of climate, land use and disturbance. Biol. Invasions 2017, 19, 3675–3690. [Google Scholar] [CrossRef] [Green Version]
  21. Welk, E.; Schubert, K.; Hoffmann, M.H. Present and potential distribution of invasive garlic mustard (Alliaria petiolata) in North America. Divers. Distrib. 2002, 8, 219–233. [Google Scholar] [CrossRef]
  22. Kem, V.; Oksanen, L.; Oksanen, T.; Pyykönen, A.; Olofsson, J.; Virtanen, R. Open tundra persist, but arctic features decline-Vegetation changes in the warming Fennoscandian tundra. Glob. Chang. Biol. 2017, 23, 3794–3807. [Google Scholar]
  23. Zong, S.; Xu, J.; Wu, Z. Investigation and Mechanism Analysis on the Invasion of Deyeuxia angustifolia to Tundra Zone in Western Slope of Changbai Mountain. J. MT. Sci.-Engl. 2013, 31, 448–455. [Google Scholar]
  24. Zong, S.; Wu, Z.; Du, H. Study on Climate Change in Alpine Tundra of the Changbai Mountain in Growing Season in Recent 52 Years. Arid Zone Res. 2013, 30, 41–49. [Google Scholar]
  25. Hao, Z.; Dai, L.; He, H.S. Potential response of major tree species to climate warming in Changbai Mountain, Northeast China. Chin. J. Appl. Ecol. 2001, 12, 653–658. [Google Scholar]
  26. Du, H.; Liu, J.; Li, M.H.; Büntgen, U.; Yang, Y.; Wang, L.; Wu, Z.; He, H.S. Warming-induced upward migration of the alpine treeline in the Changbai Mountains, northeast China. Glob. Chang. Biol. 2018, 24, 1256–1266. [Google Scholar] [CrossRef] [PubMed]
  27. Li, L.; Xing, M.; Lv, J.; Wang, X.; Chen, X. Response of rhizosphere soil microbial to Deyeuxia angustifolia encroaching in two different vegetation communities in alpine tundra. Sci. Rep.-UK 2017, 7, 43150. [Google Scholar] [CrossRef] [Green Version]
  28. Huang, X.; Li, C. An analysis on the ecology of alpine tundra landscape of Changbai Mountains. Acta Geogr. Sin. 1984, 39, 285–297. [Google Scholar]
  29. Qian, H. Numerical classification and ordination of plant communities in the alpine tundra of Mt. Changbai. Chin. J. Appl. Ecol. 1990, 1, 254–263. [Google Scholar]
  30. Samaritani, E.; Mitchell, E.A.D.; Rich, J.; Shrestha, J.; Fournier, B.; Frey, B. Soil bacterial communities and ecosystem functioning change more strongly with season than habitat in a restored floodplain. Appl. Soil Ecol. 2017, 112, 71–78. [Google Scholar] [CrossRef] [Green Version]
  31. Wang, L.; Wu, Z.; He, H.; Wang, F.; Du, H.; Zong, S. Changes in start, end, and length of frost-free season across Northeast China. Int. J. Climatol. 2017, 37, 271–283. [Google Scholar] [CrossRef]
  32. Marquardt, D.W. An algorithm for least-squares estimation of nonlinear parameters. J. Soc. Ind. Appl. Math. 1963, 11, 431–441. [Google Scholar] [CrossRef]
  33. Kendall, M.G. Rank correlation methods. Br. J. Psychol. 1990, 25, 86–91. [Google Scholar] [CrossRef]
  34. Loarie, S.R.; Duffy, P.B.; Hamilton, H.; Asner, G.P.; Field, C.B.; Ackerly, D.D. The velocity of climate change. Nature 2009, 462, 1052. [Google Scholar] [CrossRef] [PubMed]
  35. Šmilauer, P.; Lepš, J. Multivariate Analysis of Ecological Data Using Canoco 5; Cambridge University Press: New York, NY, USA, 2014. [Google Scholar]
  36. Dixon, P. VEGAN, a package of R functions for community ecology. J. Veg. Sci. 2003, 14, 927. [Google Scholar] [CrossRef]
  37. Fang, J.; Lechowicz, M. Climatic limits for the present distribution of beech (Fagus L.) species in the world. J. Biogeogr. 2006, 33, 1804–1819. [Google Scholar] [CrossRef]
  38. Kira, T. Forest ecosystems of east and southeast Asia in a global perspective. Ecol. Res. 1991, 6, 185–200. [Google Scholar] [CrossRef]
  39. Xu, W. The relation between the zonal distribution of types of vegetation and the climate in northeast China. Chin. J. Plant Ecol. 1986, 10, 16–25. [Google Scholar]
  40. Yim, Y.J. Distribution of forest vegetation and climate in the Korean Peninsula: I. distribution of some indices of thermal climate. Jpn. J. Ecol. 1977, 25, 77–88. [Google Scholar]
  41. Fielding, A.H.; Bell, J.F. A review of methods for the assessment of prediction errors in conservation presence/absence models. Environ. Conserv. 1997, 24, 38–49. [Google Scholar] [CrossRef]
  42. Swets, J.A. Measuring the accuracy of diagnostic systems. Science 1988, 240, 1285–1293. [Google Scholar] [CrossRef]
  43. Elith, J. Quantitative Methods for Modeling Species Habitat: Comparative Performance and an Application to Australian Plants; Springer: New York, NY, USA, 2000. [Google Scholar]
  44. Phillips, S.J.; Dudík, M. Modeling of species distributions with Maxent: New extensions and a comprehensive evaluation. Ecography 2008, 31, 161–175. [Google Scholar] [CrossRef]
  45. Czortek, P.; Delimat, A.; Dyderski, M.K.; Zięba, A.; Jagodziński, A.M.; Jaroszewicz, B. Climate change, tourism and historical grazing influence the distribution of Carex lachenalii Schkuhr—A rare arctic-alpine species in the Tatra Mts. Sci. Total Environ. 2018, 618, 1628–1637. [Google Scholar] [CrossRef] [PubMed]
  46. Paroloa, G.; Rossi, G. Upward migration of vascular plants following a climate warming trend in the Alps. Basic Appl. Ecol. 2008, 9, 100–107. [Google Scholar] [CrossRef]
  47. Lenoir, J.; Gégout, J.C.; Marquet, P.A.; De, R.P.; Brisse, H. A significant upward shift in plant species optimum elevation during the 20th century. Science 2008, 320, 1768–1771. [Google Scholar] [CrossRef] [PubMed]
  48. Dolezal, J.; Dvorsky, M.; Kopecky, M.; Liancourt, P.; Hiiesalu, I.; Macek, M.; Altman, J.; Chlumska, Z.; Rehakova, K.; Capkova, K. Vegetation dynamics at the upper elevational limit of vascular plants in Himalaya. Sci. Rep.-UK 2016, 6, 24881. [Google Scholar] [CrossRef] [PubMed]
  49. Grytnes, J.A.; Kapfer, J.; Jurasinski, G.; Birks, H.H.; Henriksen, H.; Klanderud, K.; Odland, A.; Ohlson, M.; Wipf, S.; Birks, H.J.B. Identifying the driving factors behind observed elevational range shifts on European mountains. Glob. Ecol. Biogeogr. 2014, 23, 876–884. [Google Scholar] [CrossRef]
  50. Scherrer, D.; Körner, C. Topographically controlled thermal-habitat differentiation buffers alpine plant diversity against climate warming. J. Biogeogr. 2011, 38, 406–416. [Google Scholar] [CrossRef]
  51. Harvey, J.W.; Bencala, K.E. The effect of streambed topography on surface-subsurface water exchange in mountain catchments. Water Resour. Res. 1993, 29, 89–98. [Google Scholar] [CrossRef]
  52. Britton, A.J.; Beale, C.M.; Towers, W.; Hewison, R.L. Biodiversity gains and losses: Evidence for homogenisation of Scottish alpine vegetation. Biol. Conserv. 2009, 142, 1728–1739. [Google Scholar] [CrossRef]
  53. Jin, Y.; Xu, J.; Zong, S.; Wang, P. Experimental study on the effects of nitrogen deposition on the tundra vegetation of the Changbai Mountains. Sci. Geogr. Sin. 2014, 34, 1526–1532. [Google Scholar]
  54. Jin, S.; Yang, X.; Ma, J. The influence of rainfall on tourist flow in Changbai Mountains from June to October. Jilin Qixiang 2015, 22, 9–13. [Google Scholar]
  55. Zhu, H.; Ge, Z.; Liu, G.; Chang, S.; Wu, J.; Shi, X.; Xu, J.; Mao, Z. Population Status of Wild Boar (Sus scrofa ussuricus) in the Changbai Mountians, Jilin Province, China. Amino Acid. Biotic Resour. 2011, 33, 13–16. [Google Scholar]
  56. Czortek, P.; Kapfer, J.; Delimat, A.; Eycott, A.E.; Grytnes, J.A.; Orczewska, A.; Ratyńska, H.; Zięba, A.; Jaroszewicz, B. Plant species composition shifts in the Tatra Mts as a response to environmental change: A resurvey study after 90 years. Folia Geobot. 2018, 1–16. [Google Scholar] [CrossRef]
  57. Felde, V.A.; Kapfer, J.; Grytnes, J.A. Upward shift in elevational plant species ranges in Sikkilsdalen, central Norway. Ecography 2012, 35, 922–932. [Google Scholar] [CrossRef]
  58. Koide, D.; Yoshida, K.; Daehler, C.C.; Mueller-Dombois, D. An upward elevational shift of native and non-native vascular plants over 40 years on the island of Hawai’i. J. Veg. Sci. 2017, 28, 939–950. [Google Scholar] [CrossRef]
  59. Scherrer, D.; Schmid, S.; Körner, C. Elevational species shifts in a warmer climate are overestimated when based on weather station data. Int. J. Biometeorol. 2011, 55, 645–654. [Google Scholar] [CrossRef]
  60. Ganguly, A.R.; Steinhaeuser, K.; Erickson, D.J.; Branstetter, M.; Parish, E.S.; Singh, N.; Drake, J.B.; Buja, L.; Schneider, S.H. Higher Trends but Larger Uncertainty and Geographic Variability in 21st Century Temperature and Heat Waves. Proc. Natl. Acad. Sci. USA 2009, 106, 15555–15559. [Google Scholar] [CrossRef]
  61. Dubuis, A.; Giovanettina, S.; Pellissier, L.; Pottier, J.; Vittoz, P.; Guisan, A. Improving the prediction of plant species distribution and community composition by adding edaphic to topo-climatic variables. J. Veg. Sci. 2013, 24, 593–606. [Google Scholar] [CrossRef]
  62. Davis, A.J.; Jenkinson, L.S.; Lawton, J.H.; Shorrocks, B.; Wood, S. Making mistakes when predicting shifts in species range in response to global warming. Nature 1998, 391, 783–786. [Google Scholar] [CrossRef]
Figure 1. Map to show the location of alpine tundra plots along the western slope of the Changbai Mountains (a,b). The dominant plant species (R. chrysanthum (c1), D. angustifolia (c2), and Sanguisorba sitchensis CA Mey. (c3)) on alpine tundra.
Forests 10 00498 g001
Figure 2. The relationship between mean monthly air temperature and soil temperature at 5 cm depth.
Forests 10 00498 g002
Figure 3. Trends in temperature (a) and precipitation (b) throughout the growing season (June, July, August, and September) on alpine tundra within the Changbai Mountains between 1984 and 2015. Dashed lines, the 5%–95% uncertainty range of the linear regression slope; the p value is the trend significance according to a Mann–Kendall test. Trends in temperature (c) and precipitation (d) throughout the growing season within multi-model ensembles for the same region under two RCP scenarios between 2016 and 2045. The shadow zones represented SDs for each index, respectively.
Forests 10 00498 g003
Figure 4. The differences of elevation ranges for R. chrysanthum, D. angustifolia, and S. sitchensis between historic and current vegetation survey. * represents a difference that is significant at the 0.05 level.
Forests 10 00498 g004
Figure 5. Potential changes of elevation and the number of plots for each dominant tundra plant species by 2045 under the RCP 4.5 and RCP 8.5 scenarios in Changbai Mountains.
Forests 10 00498 g005
Table 1. The comparisons of vegetation types and plant species along the altitude gradient in the western slope of the Changbai Mountains between historic vegetation survey in 1984 and current vegetation survey in 2015.
Historic Vegetation Survey (1984)Current Vegetation Survey (2015)
Elevation (m)Vegetation TypeDominant Plant SpeciesElevation (m)Vegetation TypeDominant Plant Species
2000–2200Dwarf shrub-lichenI II III2000–2100Herb-dwarf shrubVII VIII I
2200–2400Dwarf shrub-mossIII IV I2100–2300Dwarf shrub-herbI VII VIII IX
>2400Sparse shrubV III VI2300–2400Dwarf shrub-lichenI II III
>2400Sparse shrubV III VI
I. R. chrysanthum, II. V. uliginosum, III. D. octopetala, IV. Phyllodoce caerulea (L.) Bab., V. K. bellardii, VI. Papaver pseudo-radicatum Kitag., VII. D. angustifolia, VIII. S. sitchensis, IX. Ligularia jamesii(Hemsl) Kom.
Table 2. The frequencies and important values for dominant species recorded within the Changbai Mountains (2015).
Plant SpeciesFrequency (%)Important Value
R. chrysanthum65.321.57
S. sitchensis41.37.61
Sanguisorba teriuifolia Var.52.06.23
D. angustifolia29.34.86
S. tomentosa52.04.79
Ligularia jamesii (Hemsl) Kom.32.04.24
V. uliginosum26.74.10
Polygonum viviparum L.46.73.82
D. octopetala22.73.29
Table 3. Potential changes in dominant Changbai Mountains tundra plant species by 2045 under two RCP scenarios.
NameR. chrysanthumS. sitchensisD. angustifolia
RCP4.5Percentage of plots occupied (%)2 ± 12 ↓7 ± 17 ↑2 ± 12 ↑
Lower limit of elevation (m)0 ----
Upper limit of elevation (m)50 ± 37 ↑25 ± 37 ↑125 ± 40 ↑
RCP8.5Percentage of plots occupied (%)27 ± 16 ↓52 ± 17 ↑38 ± 10 ↑
Lower limit of elevation (m)75 ± 43 ↑----
Upper limit of elevation (m)50 ± 0 ↑125 ± 52 ↑225 ± 35 ↑

