Article

Non-Destructive Assessment of Wood Stiffness in Scots Pine (Pinus sylvestris L.) and its Use in Forest Tree Improvement

1
Umeå Plant Science Centre, Department of Forest Genetics and Plant Physiology, Swedish University of Agricultural Sciences, 90183 Umeå, Sweden
2
Skogforsk (The Forestry Research Institute of Sweden), 91821 Sävar, Sweden
3
Department of Genetics and Breeding, Faculty of Agrobiology and Natural Resources, Czech University of Life Sciences Prague, 16500 Prague, Czech Republic
4
Key Laboratory of Forest Genetics and Biotechnology, Co-Innovation Center for the Sustainable Forestry in Southern China, Nanjing Forestry University, Nanjing 210037, China
5
Beijing Advanced Innovation Centre for Tree Breeding by Molecular Design, Beijing Forestry University, Beijing 100083, China
6
CSIRO National Research Collection Australia, Black Mountain Laboratory, Canberra ACT 2601, Australia
*
Author to whom correspondence should be addressed.
Forests 2019, 10(6), 491; https://doi.org/10.3390/f10060491
Submission received: 25 April 2019 / Revised: 7 June 2019 / Accepted: 7 June 2019 / Published: 7 June 2019
(This article belongs to the Section Forest Ecophysiology and Biology)

Abstract

:
Wood stiffness is an important wood mechanical property that predetermines the suitability of sawn timber for construction purposes. Negative genetic correlations between wood stiffness and growth traits have, however, been reported for many conifer species including Scots pine. It is, therefore, important that breeding programs consider wood stiffness and growth traits simultaneously. The study aims to (1) evaluate different approaches of calculating the dynamic modulus of elasticity (MOE, non-destructively assessed stiffness) using data from X-ray analysis (SilviScan) as a benchmark, (2) estimate genetic parameters, and (3) apply index selection. In total, we non-destructively measured 622 standing trees from 175 full-sib families for acoustic velocity (VEL) using Hitman and for wood density (DEN) using Resistograph and Pilodyn. We combined VEL with different wood densities, raw (DENRES) and adjusted (DENRES.TB) Resistograph density, Pilodyn density measured with (DENPIL) and without bark (DENPIL.B), constant of 1000 kg·m−3 (DENCONST), and SilviScan density (DENSILV), to calculate MOEs and compare them with the benchmark SilviScan MOE (MOESILV). We also derived Smith–Hazel indices for simultaneous improvement of stem diameter (DBH) and wood stiffness. The highest additive genetic and phenotypic correlations of the benchmark MOESILV with the alternative MOE measures (tested) were attained by MOEDENSILV (0.95 and 0.75, respectively) and were closely followed by MOEDENRES.TB (0.91 and 0.70, respectively) and MOEDENCONST and VEL (0.91 and 0.65, respectively for both). Correlations with MOEDENPIL, MOEDENPIL.B, and MOEDENRES were lower. Narrow-sense heritabilities were moderate, ranging from 0.39 (MOESILV) to 0.46 (MOEDENSILV). All indices revealed an opportunity for joint improvement of DBH and MOE. Conclusions: MOEDENRES.TB appears to be the most efficient approach for indirect selection for wood stiffness in Scots pine, although VEL alone and MOEDENCONST have provided very good results too. An index combining DBH and MOEDENRES.TB seems to offer the best compromise for simultaneous improvement of growth, fiber, and wood quality traits.

1. Introduction

Wood is a versatile, renewable, and environmentally sustainable material with a wide range of utilization. It has been used as a building material for thousands of years as it provides good insulation, has good machinability, and is exceptionally strong in proportion to its weight [1]. Stiffness, a non-permanent deformation of a sample when a load is applied, represents an important wood mechanical parameter that predetermines the suitability of sawn boards for construction purposes [2]. Since utilization of wood for construction is foreseen to remain important in the future [3], inclusion of wood stiffness into breeding programs appears to be inevitable. It is particularly crucial for species that exhibit adverse negative correlations between growth and stiffness, as the traditional emphasis on volume maximization has been found to result in stiffness degradation, e.g., [4,5,6,7].
Therefore, a reliable technique suitable for rapid screening of large numbers of trees is needed. The destructive bending stress testing, i.e., quantifying stiffness as the static modulus of elasticity, is commonly replaced by acoustic sensing technology, which is based on the determination of the propagation velocity of stress waves induced by a mechanical force [8,9]. In standing trees, acoustic velocity is recorded between two probes hammered into a stem ca 1 m apart and 2–3 cm deep. Wood stiffness, expressed as the dynamic modulus of elasticity (MOEd, GPa) calculated from acoustic velocity (VEL, km∙s−1) and green wood density (DEN, kg∙m−3) according to Equation (1) as
M O E d = V E L 2 × D E N
has proven to be a useful proxy for the static modulus of elasticity [10].
Several different wood density estimates have been tested as potential surrogates for green wood density in the MOEd calculation (Equation (1)). When static MOE (MOES) determined from destructive testing or SilviScan MOE (MOESILV) estimated through X-ray density combined with X-ray diffraction [11] were used as benchmark variables, a number of studies reported moderate to very strong correlations with MOEd that utilized X-ray density estimated through SilviScan or other X-ray apparatus, e.g., [12,13,14,15] and moderate correlations when volumetric green density was used [16,17,18]. X-ray or volumetric wood densities are, however, rather inconvenient to employ as their estimation requires time-consuming and expensive laboratory measurements and are therefore often replaced by a constant wood density (usually 1000 kg∙m−3). Such simplification did not compromise the results, as moderate to strong correlations were attained for MOEd using the constant wood density as well, e.g., [6,7,19]. This alternative approach assumes very little variation in wood density [20] and/or a strong relationship between acoustic velocity and wood stiffness. The latter statement is supported by the attainment of moderate to strong correlations of acoustic velocity itself with benchmark variables observed in several studies [19,21,22]. Nevertheless, these correlations often reach even higher levels when some wood density information is included [12,13,23]. Focusing on fast and non-destructive alternatives of wood density measurement, wood density estimated based on Pilodyn penetration depth appears to be ideal as its MOEd gave an almost perfect genetic correlation with the benchmark MOESILV (rG = 0.99) in a Norway spruce (Picea abies (L.) H. Karst.) study conducted by [12]. Another candidate approach could be density derived from micro-drilling resistance measured by Resistograph, as strong genetic correlations between adjusted Resistograph density and a benchmark density were reported, e.g., for Scots pine (Pinus sylvestris L.) [24] or loblolly pine (Pinus taeda L.) [25,26].
The identification of a reliable method for wood stiffness assessment that would be suitable for screening large numbers of trees is just the first step towards the inclusion of a new trait into an ongoing tree breeding program. Since stem volume is a prioritized trait in many programs, an appropriate method for multi-trait selection has to be applied. Independent culling, which lies in setting independent truncation thresholds for each trait of interest [27], tandem selection, which considers only a single trait in each breeding cycle [28], or two-stage selection, which focuses on one trait at a time but covers all traits of interest during one breeding cycle [29], are possible options to choose from. Nevertheless, the most efficient method designed for simultaneous improvement of several traits is index selection, which is performed through assigning a weight for each trait according to its economic importance [30,31]. Index selection is suitable for traits that differ in economic importance, heritability, variability, and/or correlation among their phenotypic and genotypic values [27], particularly if the correlation is negative [32]. Estimation of economic weights for the index selection is, however, very complicated, mainly due to the uncertain future of end-products and prerequisites for their production as well as unwillingness of the wood processing industry to fully disclose their financial flows. Nevertheless, economic weights were successfully estimated and applied for radiata pine (Pinus radiata D. Don) structural timber in Australia [33].
The aim of this study is to (1) evaluate different approaches of calculating the dynamic modulus of elasticity (MOEd) in Scots pine using SilviScan-, Pilodyn-, Resistograph-based, and constant wood density employing SilviScan modulus of elasticity as a benchmark, (2) estimate heritabilities of the best MOEd approaches and calculate their phenotypic and genetic correlations with growth, fiber, and wood quality traits, and (3) apply index selection using non-monetary weights to explore possibilities of simultaneous improvement of stem diameter and wood stiffness under the presence of unfavorable genetic correlation.

2. Materials and Methods

2.1. Test Material

In total, 622 trees from 175 families of 44 parents were sampled in a Scots pine full-sib progeny test “Grundtjärn” (#S23F 711261, lat. 63.5556° N, long. 17.4139° E, alt. 320 m, area 3.5 ha) located in central Sweden. The test was established by the Forestry Research Institute of Sweden (Skogforsk) in 1971 on a slightly west-sloping sandy moraine with the site productivity around 3 m3/ha/year [34]. It was comprised of 7240 seedlings representing 179 full-sib families of 45 parents that were crossed following a partial diallel mating design, where each parent participated 8–9 times as either a mother or a father. Phenotypically selected parental trees originated from forest populations between latitudes 63° N and 64° N. One-year-old seedlings were planted with 2.2 × 2.2 m spacing following a completely randomized single tree plot design. The experiment was divided into 181 post-blocks, each consisting of 40 trees (4 columns by 10 rows) and was systematically thinned at age 35.

2.2. Wood Density Assessment

Wood density of standing trees was assessed non-destructively using micro-drill Resistograph IML-RESI PD 300 (Instrumenta Mechanic Labor, Germany) and penetrometer Pilodyn 6J Forest (PROCEQ, Switzerland) in early summer at tree ages of 45 and 47, respectively. Both tools utilize a slender needle that penetrates into wood and leave just negligible openings. Each tree was drilled with Resistograph bark-to-bark and shot with Pilodyn through bark (DENPIL) and after removing a patch of bark (DENPIL.B) ca 1.3 m above ground. All wood density measurements were performed with an effort to avoid knots or any visible damages that could cause a bias in wood density estimates. Resistograph’s drilling profiles (resistograms) were adjusted (detrended and debarked) according to [24]. Mean values of unadjusted and adjusted Resistograph’s records (DENRES and DENRES.TB, respectively) and reciprocals of Pilodyn’s readings were used in this study.

2.3. SilviScan Data

Pith-to-bark increment cores of 10 mm in diameter, extracted ca 1.3 m above ground, were cut into thin strips and analyzed with SilviScan technology (CSIRO, Australia). SilviScan wood stiffness (MOESILV) derived from X-ray absorption and diffraction was used as a benchmark for evaluation of six different dynamic moduli of elasticity calculated according to Equation (1). Other traits estimated by SilviScan that are used in this study include: Wood density (DENSILV); density of earlywood (EWD), transition wood (TWD), and latewood (LWD); proportion of earlywood (EWP), transition-wood (TWP), and latewood (LWP); microfibril angle (MFA); fiber wall thickness (FWT); fiber coarseness (FCS); and fiber width in radial (FRW) and tangential (FTW) direction. Earlywood, transition wood, and latewood were defined as annual ring segments with densities ranging from 0–20%, 20–80%, and 80–100% of the span from minimum to maximum density within the ring, respectively. All traits measured by SilviScan were obtained for each annual ring; mean values (excluding EWP, TWP, and LWP) were calculated as area-weighted values (AWV),
A W V = ( α i d i ) α i
where d i is a value for ith annual ring with cross-sectional area α i [35].

2.4. Wood Stiffness Assessment through Acoustic Velocity

Standing-tree acoustic velocity (VEL) was measured in autumn at a tree age of 42 by Hitman ST300 (Fibre-gen, New Zealand) between two probes hammered 0.7–1.3 m apart into the southeastern side of a stem. Time-of-flight of a stress wave induced by tapping the transmitter probe with a steel hammer was recorded and, knowing the exact distance between the two probes, acoustic velocity was calculated. Mean value of two series of eight taps was used for calculating the dynamic modulus of elasticity (MOEd, Equation (1) reflecting the wood stiffness. Different wood densities were used for MOEd calculation:
  • Constant density of 1000 kg∙m−3 (DENCONST);
  • Wood density estimated by SilviScan technology (DENSILV);
  • Resistograph unadjusted density (DENRES);
  • Resistograph adjusted (detrended and debarked) density (DENRES.TB);
  • Density based on depth of Pilodyn’s pin penetration with bark (DENPIL);
  • Density based on depth of Pilodyn’s pin penetration without bark (DENPIL.B).
The VEL and MOEd estimates were compared with SilviScan modulus of elasticity (MOESILV), which served as a benchmark. Pairwise comparisons between MOE means were performed using Duncan’s multiple range test (duncan.test in R program [36]) at the significance level of 0.01. Variation in wood quality traits due to measurements being taken in different seasons and/or at different tree ages was considered negligible.

2.5. Growth Data

Height (HGT) and diameter at breast height (DBH) were obtained from Skogforsk. Stem volume (VOL) was calculated as a function of height and diameter [37]:
V O L = e x p [ 2.7841 + 1.9474 × l n ( D B H ) 0.05947 × l n ( D B H + 20 ) + 1.40958 × l n ( H G T ) 0.4581 × l n ( H G T 1.3 ) ]

2.6. Statistical Analysis

Using statistical package ASReml 4 [38], the response variables were fitted into the following linear model in order to estimate variance and covariance components:
y i j k l = μ + B i + P j + P k + F j k + e i j k l
where yijkl is the variable measurement for lth offspring from full-sib family of parents j and k growing in ith block; μ is the variable overall mean; B, P, F, and e are random effects of block, parent, family, and residuals, respectively.
Individual-tree narrow sense heritability ( h i 2 ) for each variable was estimated using variance components from the univariate analysis as
h i 2 = σ A 2 σ P 2 = 4 σ p 2 2 σ p 2 + σ f 2 + σ e 2
where σ A 2 , σ P 2 , σ p 2 , σ f 2 , and σ e 2 are variances for additive genetic, phenotypic, parental, family, and residual components, respectively. Taylor series expansion was employed to estimate standard errors [38]. Phenotypic and genetic correlations ( r x y ) were calculated as
r x y = σ x y σ x 2 × σ y 2
where σ x 2 and σ y 2 are phenotypic or additive genetic variance components for trait x and y, respectively, and σ x y is phenotypic or additive genetic covariance component between traits x and y estimated by fitting a bivariate model (Equation (4)) [38]. Dendrogram of additive genetic correlations depicting relationships among traits was produced by hierarchical cluster analysis based on dissimilarity matrix using hclust function in R program [36].
Index selection was applied to explore the possibility of simultaneous improvement of stem diameter and wood stiffness, in spite of the negative genetic correlation between the two traits. Index selection was also constructed for DBH and wood density as a close proxy for wood stiffness. Different sets of weights for stiffness (GPa) and density (kg·m−3), ranging from 0 to 3.6 and from 0 to 0.12, respectively, relative to 1 for DBH (cm) were used. The Smith–Hazel index, which maximizes the efficiency of selection through accounting for heritabilities and genetic and phenotypic correlations among traits, was employed to find optimal weights with desired genetic gains for both traits [30,39].
The index (I) is generally defined as
I = b 1 P 1 + b 2 P 2 + + b n P n
where Ps represent phenotypic performance for each trait and bs are their corresponding index coefficients. Index coefficients were calculated as
b = P 1 A w
where P is phenotypic variance-covariance matrix, A is additive genetic variance-covariance matrix, and w is vector of weights for each trait. The expected genetic gain (ΔAx) for trait x included in the Smith–Hazel index was estimated following [32] as:
Δ A x = i ( b x σ A x 2 + b y σ A x y ) σ I
where i is the selection intensity (1% refers to i = 2.67), σ A x 2 is additive genetic variance of trait x, σ A x y is additive genetic covariance for traits x and y, and σ I is a square root of phenotypic variance of the index calculated as
σ I 2 = b T P b
Genetic gain ( G A x ) for direct selection was estimated as
G A x = i h x 2 C V x
where i is selection intensity, h x 2 is heritability for trait x, and C V x is coefficient of variation for trait x calculated as a phenotypic standard deviation divided by mean. Correlated response ( C R y ) to selection for a target trait y was determined as
C R y = i h x h y r x y C V y
where h x and h y are squared roots of narrow sense heritabilities for selection trait x and target trait y, respectively, r x y is additive genetic correlation between trait x and y, and C V y is coefficient of variation for target trait y. Traits involved in the index selection were included as a new aggregated variable x calculated according to Equation (7). Weights corresponding to intersections of plotted weights versus expected genetic gains were used for calculation of index coefficients.

3. Results

3.1. Variation in Different Wood Stiffness (MOE) Estimates

Different estimates of wood stiffness (MOE) together with their descriptive statistics and narrow-sense heritabilities are summarized in Table 1. Benchmark MOESILV, estimated by SilviScan, varied between 5.0 and 16.0 GPa, with a mean of 10.2 GPa. MOECONST, calculated using a constant density of 1000 kg·m−3, had the highest minimum, maximum, and mean values compared to other MOE estimates. Range and mean of MOEDENSILV utilizing wood density estimated by SilviScan technology were similar to those of MOEDENRES and MOEDENRES.TB that applied density estimated based on drilling resistance measured by Resistograph, and MOEDENPIL that used density as the reciprocal depth of Pilodyn penetration measured with bark. MOEDENPIL.B and MOEDENPIL exhibited the highest variation (22.8% and 22.7%) whereas VEL exhibited the lowest (9.0%).

3.2. Heritability

All individual-tree narrow-sense heritabilities obtained for different estimates of MOE and VEL were moderate (Table 1). Heritability of the benchmark MOESILV (0.39) was higher than that of VEL and MOEDENCONST (both 0.37) but lower than those for all other estimates of MOEd. The highest heritability was attained by MOEDENSILV (0.46), followed by MOEDENRES.TB (0.45) and MOEDENRES (0.44).

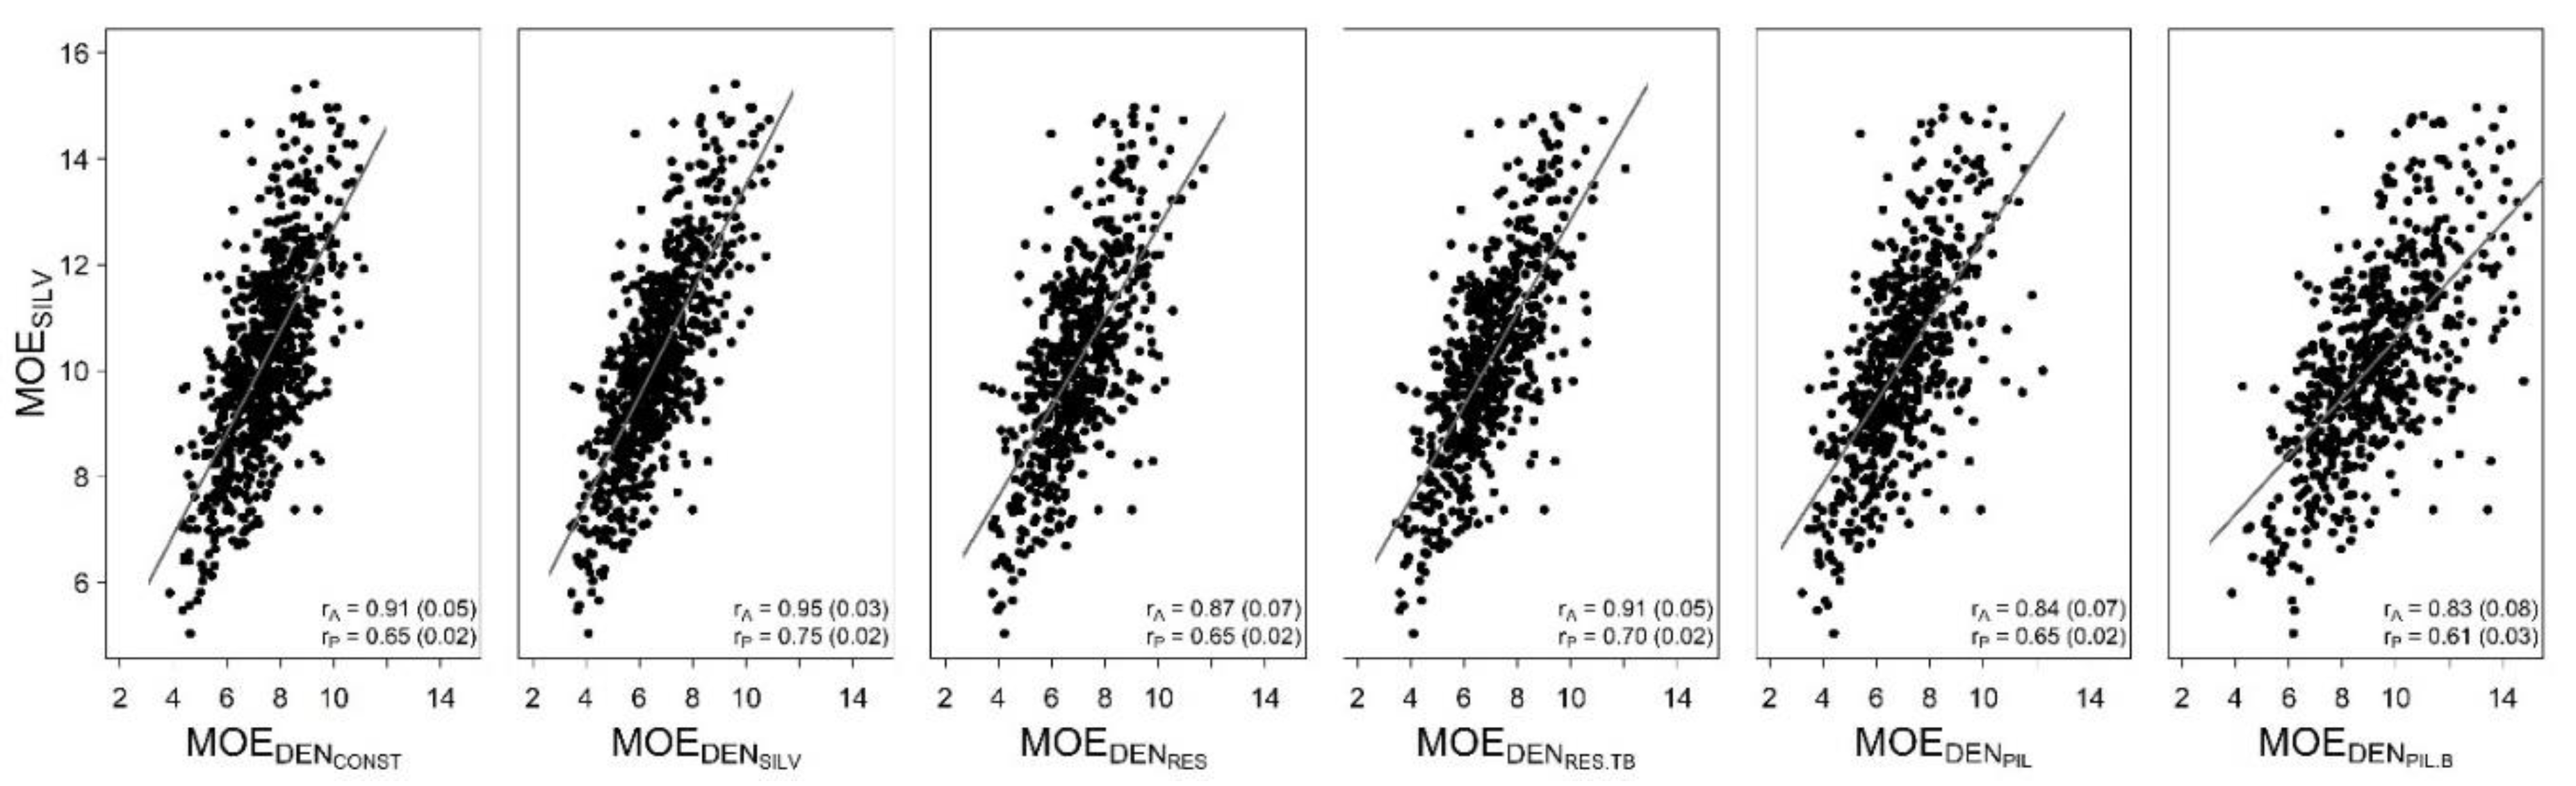
3.3. Comparison of Moduli of Elasticity

Using MOESILV as the benchmark, MOEDENSILV gave the best estimate of modulus of elasticity (rG = 0.95 and rP = 0.75; Table 2, Figure 1). The second-best estimate of MOE was, at the genetic level, attained by VEL, MOEDENRES.TB, and MOEDENCONST (rG = 0.91 for all); however, at the phenotypic level, MOEDENRES.TB gave a better estimate (rP = 0.70 and rP = 0.65, respectively). It means that additional information in the form of adjusted Resistograph density improved the MOE estimate, although the improvement was just minor. On the other hand, neither the two Pilodyn densities nor the unadjusted Resistograph density improved the MOE estimation. Their correlations with the benchmark MOESILV were the same or lower compared with those of MOESILV with VEL where no additional wood density information was supplied.

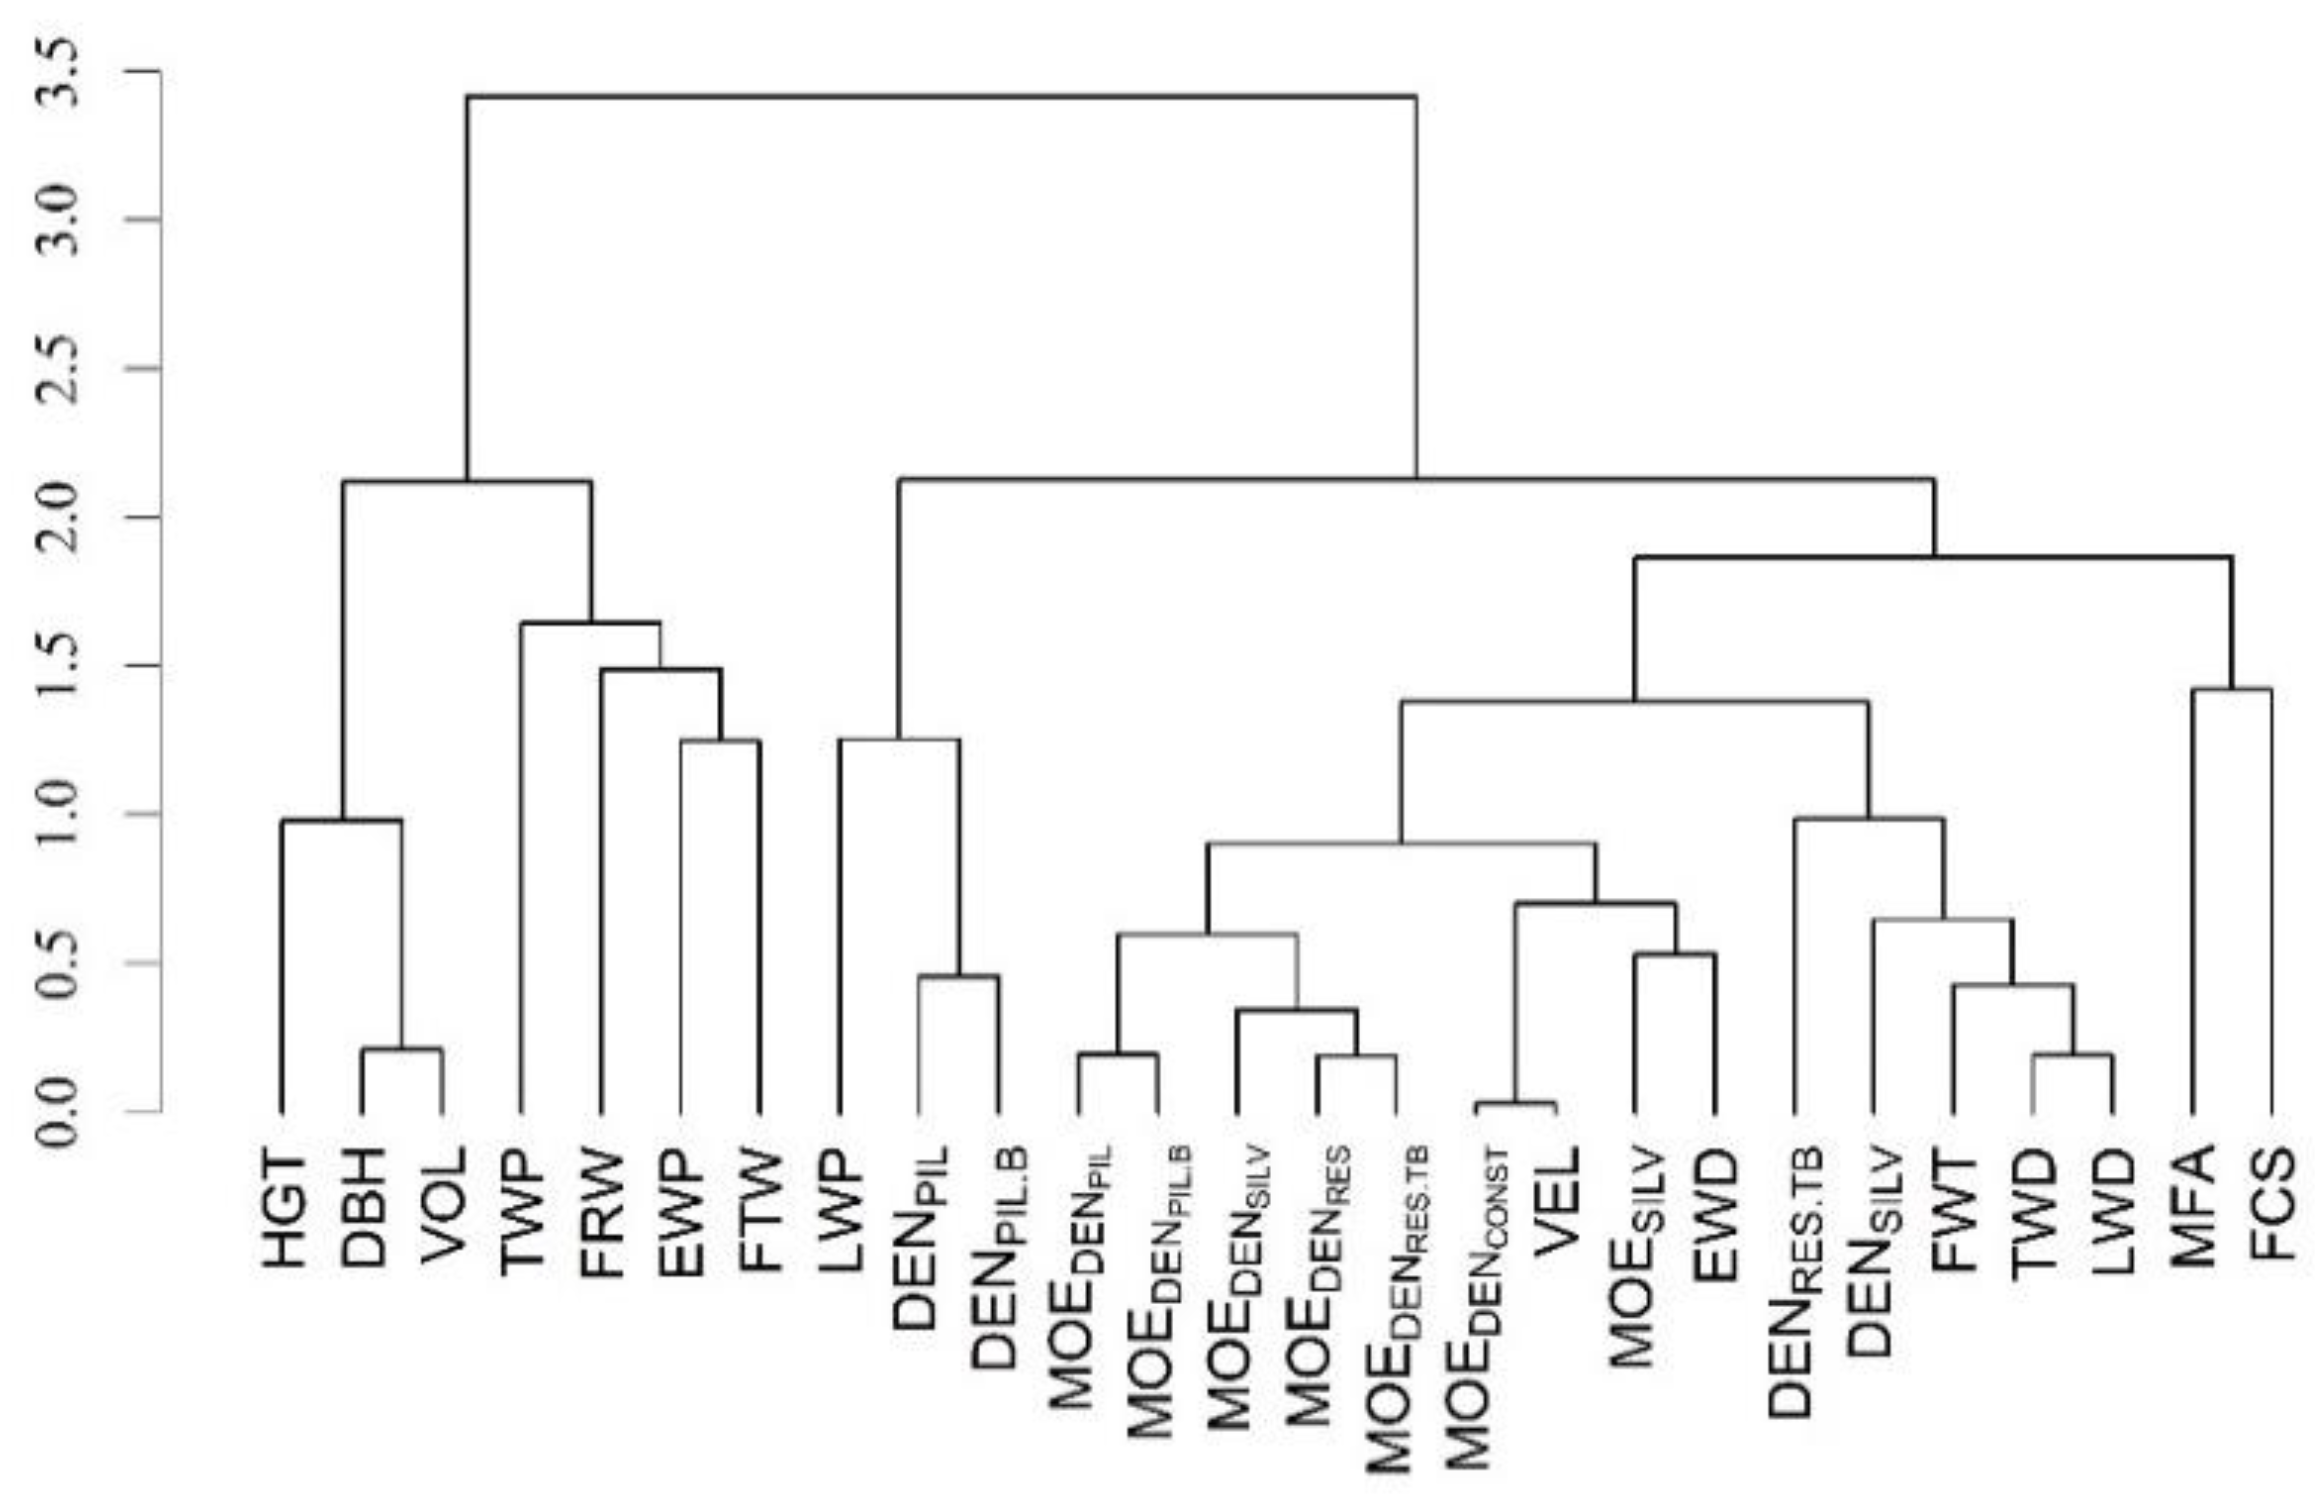
3.4. Phenotypic and Additive Genetic Correlations of Selected Moduli of Elasticity with Other Wood, Fiber, and Growth Traits

Phenotypic and additive genetic correlations of the benchmark MOESILV, VEL, and the best performing moduli of elasticity estimated based on VEL (MOEDENCONST, MOEDENSILV, MOEDENRES.TB) are presented in Table 3. Correlations of VEL and MOEDENCONST were almost identical. Genetic correlations among moduli of elasticity and different wood density estimates were moderate to strong, while phenotypic correlations were moderate to weak. The strongest relationships with wood density traits were obtained for MOEDENRES.TB, followed by MOEDENSILV. On the other hand, relationships with VEL and MOEDENCONST were the weakest. Genetic correlations of VEL and moduli of elasticity with LWP, TWP, and EWP were moderately positive, weakly negative, and close to zero, respectively. MOESILV was strongly negatively correlated with MFA. Genetic correlations of VEL and MOEDENCONST with MFA were also strong and negative; other correlations with MFA were moderate. Strong genetic and moderate phenotypic positive correlations were obtained for moduli of elasticity with FTW, except for MOEDENCONST that had weaker correlations. Genetic and phenotypic correlation with FCS were moderate, except for weak phenotypic correlation of MOEDENCONST. Correlations with FRW and FTW were weak and negative for all moduli of elasticity. Genetic and phenotypic correlations of VEL and moduli of elasticity with growth traits were moderately negative, except for week phenotypic correlations with HGT. MOESILV produced the strongest negative correlations with growth traits.
Relationships among variables based on additive genetic correlations are shown in Figure 2. The dendrogram revealed two distinct groups: One consisting of two sub-groups (growth traits; and earlywood and transition wood proportion together with fiber width) and the other consisting of four sub-groups (Pilodyn density along with latewood proportion; moduli of elasticity, acoustic velocity, and earlywood density; SilviScan, Resistograph, transition wood and latewood density, plus fiber wall thickness; and microfibril angle with fiber coarseness).

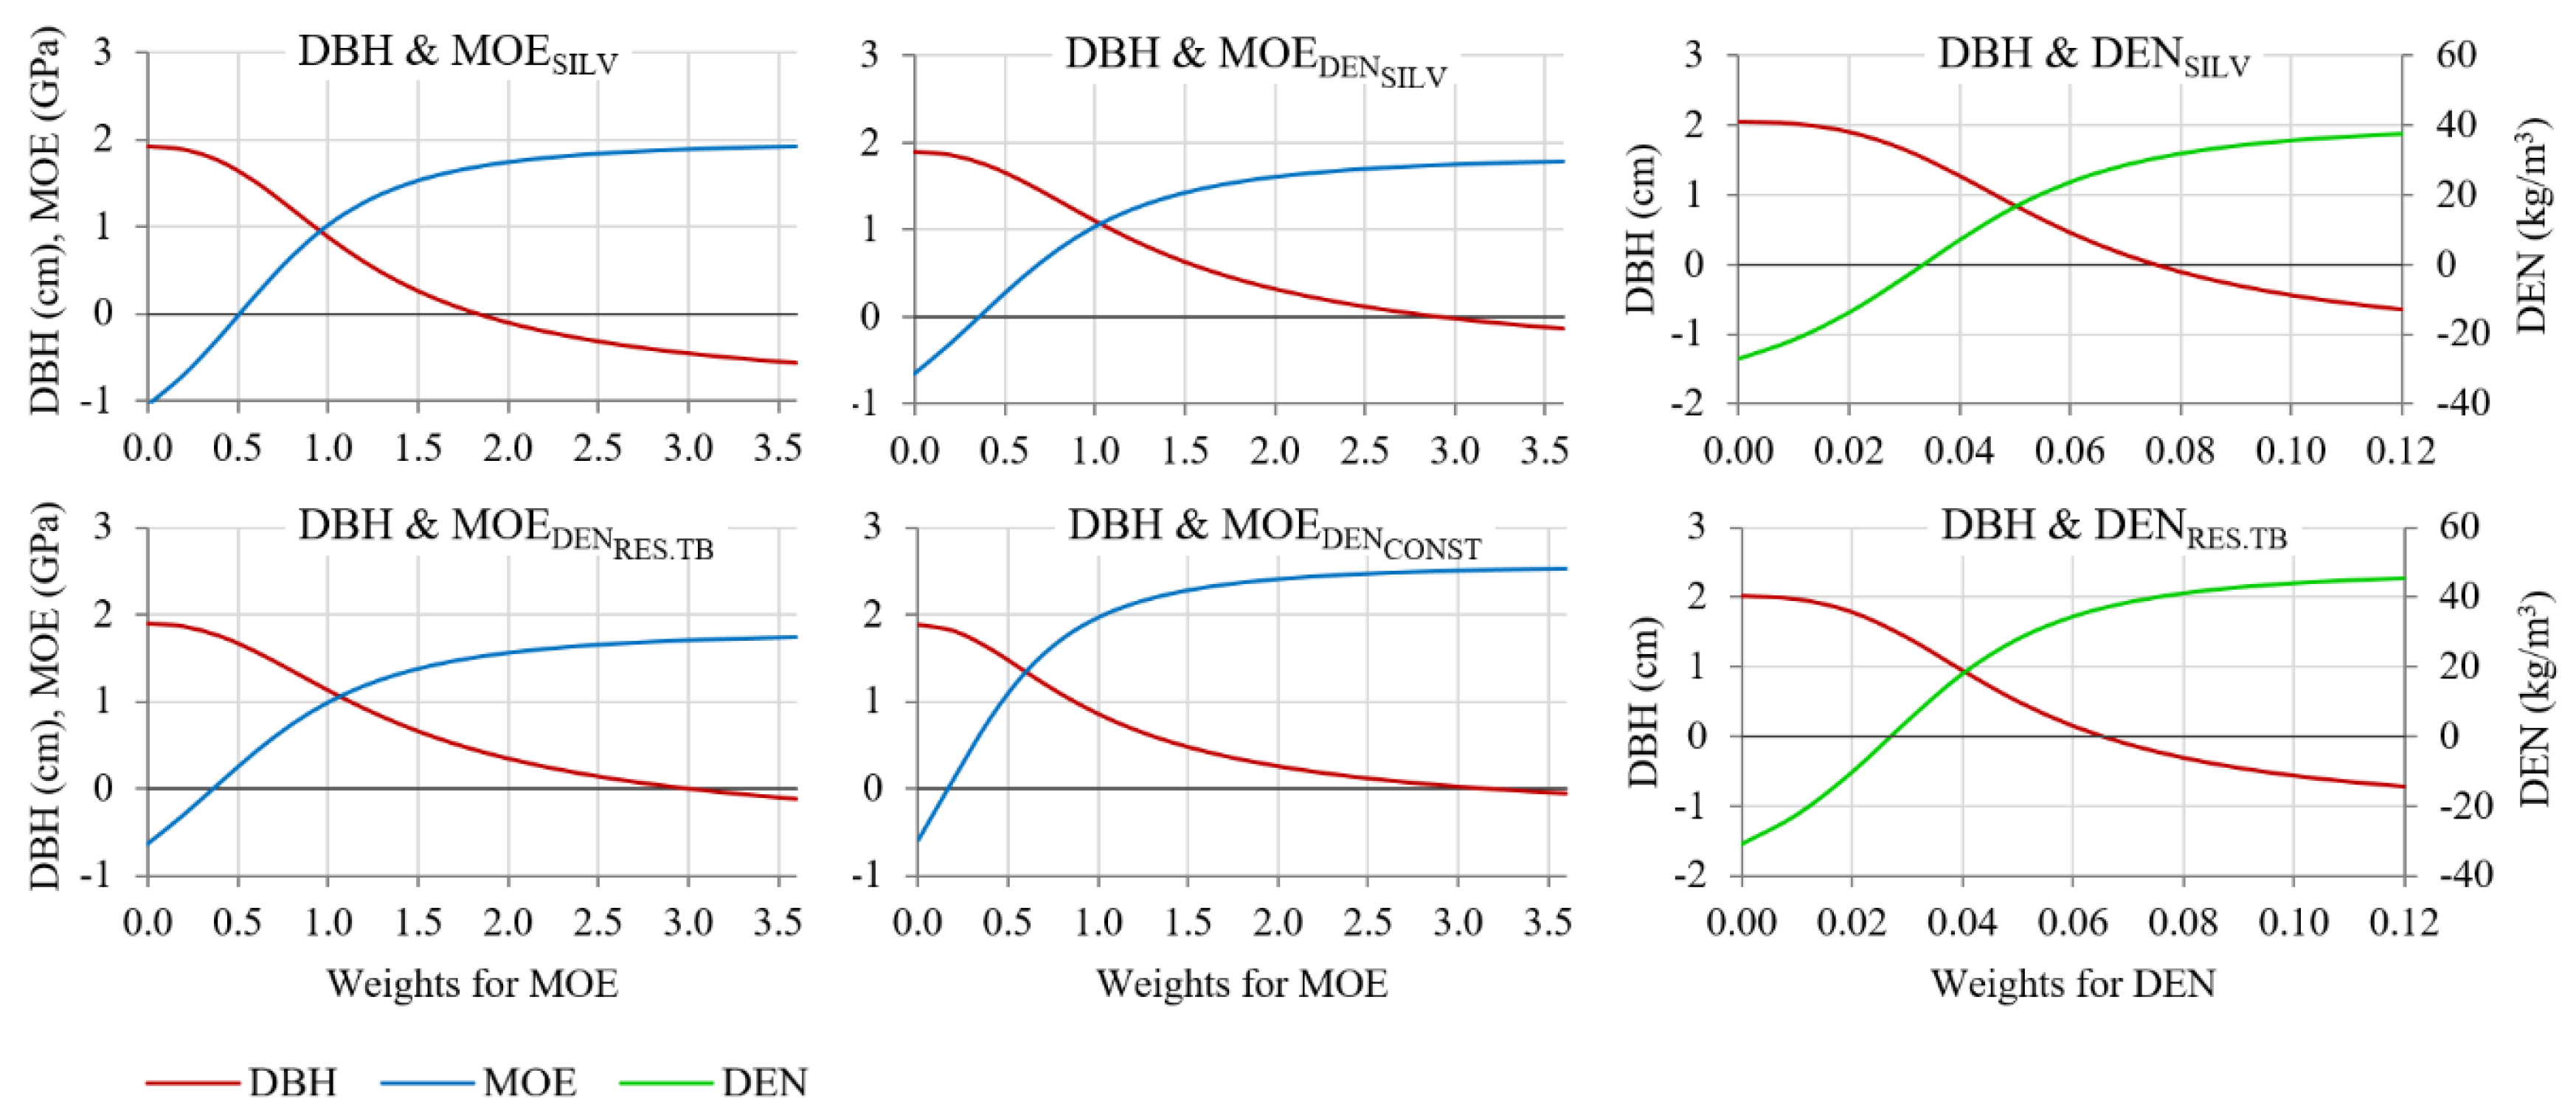
3.5. Index Selection

Index selection, with different sets of weights for MOE and DEN relative to 1 for DBH, was employed in order to evaluate the possibility of simultaneous improvement. For all studied combinations of DBH and a wood quality trait, weights plotted against expected genetic gains (Figure 3) clearly revealed regions with a positive gain for both traits in question. Among pairs of DBH and different MOE estimates, the pair with MOEDENCONST exhibited the longest positive region between weights 0.2 and 3.2, with the highest expected gain being attained at the intersection (1.3 cm for DHB and 1.3 GPa for MOE). Pairs with MOEDENSILV and MOEDENRES.TB showed an almost identical pattern, with a positive region between weights 0.4 and 2.8 and the intersectional gain of 1. The graph of simultaneous selection of DBH and MOESILV appeared to have the shortest region of positive values (0.5–1.8) but the intersectional expected gain was 1 as well. The pair of DBH with DENSILV had a slightly longer positive region (0.035–0.075) than the one with DENRES.TB (0.030–0.065). Nevertheless, the pair with DENRES.TB reached a higher genetic gain for both traits (1 cm for DBH and 20 kg·m−3 for density) compared to the pair with DENSILV (0.8 cm for DBH and 16 kg·m−3 for density). Weights corresponding to the graphs’ intersections were used for calculating index coefficients and a subsequent analysis of the correlated response to selection.

3.6. Response to Selection

Correlated response to selection for important growth (DBH, VOL), fibre (MFA), and wood quality (MOESILV, DENSILV) traits is summarized in Table 4. Selection for DBH separately resulted in positive genetic gains in growth traits but in negative gains in wood quality traits. Note that a positive gain for MFA means an unfavorable increase in microfibril angle. Contrariwise, selection based on MOESILV led to improvement of wood quality and fiber traits but to a decline in growth traits. Therefore, indices combining DBH with different MOE and DEN estimates have been employed. All indices resulted in desirable simultaneous improvement of both growth and wood quality traits as well as MFA. The highest genetic response of growth traits was attained by selection based on DBH and MOEDENCONST, followed by DBH and MOEDENSILV and DBH and DENSILV, while the highest response of stiffness was achieved by DBH and MOEDENRES.TB and DBH and MOESILV. Selection based on DBH and DENRES.TB and DBH and MOEDENRES.TB resulted in the highest gain for wood density. The highest decrease in microfibril angle was achieved by selecting for DBH and MOESILV, followed by MOEDENSILV and MOEDENRES.TB, whereas selection combining DBH and DEN had nearly no effect on MFA.

4. Discussion

4.1. Estimation of Wood Stiffness

Wood stiffness is an important mechanical parameter determining the suitability of wood for construction purposes. It is, however, negatively correlated with growth traits, which means that a systematic selection for bigger trees leads to deterioration in wood stiffness. In order for wood stiffness to be included in forest tree breeding programs, a reliable method for its assessment, suitable for fast screening of thousands of trees, is needed. Hence, we have evaluated several different approaches of calculating modulus of elasticity from acoustic velocity (Equation (1), Table 2) measured non-destructively on standing trees. Having MOESILV as a benchmark, MOEDENSILV, which combines acoustic velocity and wood density derived from X-ray absorption of SilviScan, was found to be the best proxy, providing the highest correlations (rG = 0.95 and rP = 0.75). It is in good accordance with other studies—for instance, strong correlations between MOESILV and MOEDENSILV were reported for radiata pine (rP = 0.97) [15] or Norway spruce (rG = 1.01 and rP = 0.66) [12]. This relationship can, however, be slightly overestimated as SilviScan wood density was used for calculating both MOESILV and MOEDENSILV. Nevertheless, employing SilviScan or another X-ray-based technology is feasible only for a small-scale assessment, as the wood sample preparation and scanning are laborious and costly. Of the proxies suitable for inclusion in operational breeding programs, the best MOE estimate incorporating acoustic velocity and Resistograph adjusted density (MOEDENRES.TB) was closely followed by the MOE estimate based solely on acoustic velocity (MOEDENCONST) and acoustic velocity itself (VEL). The MOEDENRES.TB had a slightly higher phenotypic correlation (rP = 0.75 versus 0.65) with the benchmark MOESILV but genetic correlations of MOEDENRES.TB, MOEDENCONST and VEL were identical (rG = 0.91). Similar correlations between MOESILV and MOEDENCONST were obtained, e.g., for lodgepole pine (Pinus contorta Douglas ex Loudon) (rG = 0.91 and 0.90, rP = 0.67 and 0.61) [6]; a strong phenotypic correlation of VEL with a benchmark MOE was published for Scots pine (rP = 0.72) [19] or Douglas-fir (Pseudotsuga menziesii (Mirb.) Franco) (rP = 0.79) [13]. Genetic correlations of all other MOE estimates with MOESILV in this study were lower than the one of VEL, which indicates that the additional information on wood density measured by Pilodyn, either with or without bark, or by Resistograph, without the subsequent adjustment of drilling profiles, did not bring any improvement to the MOE estimation. On the other hand, a combination of Pilodyn wood density and acoustic velocity (MOEDENPIL) was identified as an efficient method for indirect selection for MOE in Norway spruce (rG = 0.99, rP = 0.53) [12].

4.2. Heritability

Individual-tree narrow-sense heritabilities for the estimated moduli of elasticity and acoustic velocity were moderate (Table 1), of which those considering only VEL were a little lower (0.37) than those involving DEN (0.39–0.46). In other studies, heritability of VEL varied from low (0.15) [12] to moderate (0.39) [26] or (0.46) [21]. Low (0.14) [13], moderate (0.20 and 0.29) [6], as well as high (0.63) [7] heritabilities were reported for MOEDENCONST. Moderate (0.31) [12] to high (0.68) [13] heritabilities were obtained for MOEDENSILV and MOEDENX-RAY, respectively. Employing Pilodyn wood density, moderate heritabilities of MOEDENPIL were estimated for black spruce (Picea mariana [Mill.] B.S.P.) (0.36 and 0.37) [40], slash pine (Pinus elliottii Engelm.) (0.29) [41], or Norway spruce (0.28) [12].

4.3. Correlations

Additive genetic correlations of MOE and VEL with DENSILV were strong and positive in this study, which corresponds with correlations of MOESILV and MOEDENPIL reported for Norway spruce [12]. It suggests that selection based on one of the traits only, either MOE or DEN, whichever is more convenient to measure, would lead to improvement of both traits at the same time. On the other hand, weak to moderate positive correlations of VEL or MOEDENCONST with a benchmark density were observed for other conifers, e.g., [7,13,42]. Strong negative genetic correlations of MOE and VEL with MFA were in good accordance with a number of earlies studies, e.g., [6,12,42,43,44], implying that selection for MOE or just VEL would result in a desirably lower MFA. Negative correlations of MOE and VEL with growth traits were weak to moderate, of which the weakest were those with HGT. Similar results were obtained, e.g., for Douglas-fir [13] or Norway spruce [12]. Moderate negative genetic correlations between MOEDENCONST and DBH were also reported for Sitka spruce (Picea sitchensis (Bong.) Carr.) and lodgepole pine, whilst negative genetic correlations between MOESILV and DBH and between MOES and DBH were strong in the two species [7] and [6], respectively. In contrast, weakly positive genetic correlations of VEL with HGT and DBH were estimated for black spruce [40] and white spruce (Picea glauca (Moench) Voss) [42].

4.4. Factors Affecting Acoustic Velocity Measurements

A number of factors have been reported to affect VEL measurements on standing trees such as the presence of knots, compression wood [45], spiral grain [46], age [47], temperature [48], moisture content [49,50,51], or direction of the measurement on sloping terrain [52]. It has also been observed that VEL can be influenced by insertion depth of probes [53], their imbedding angle [54], and variation in hitting intensity [45]. Moreover, VEL measured on standing trees considers only the outermost wood, which is usually stiffer than the whole log [55]. Nevertheless, in this study, VEL has proven to be an efficient method for wood stiffness assessment in the whole stem profile, being capable of revealing high MFA too.

4.5. Response to Selection

Taking into account the negative correlations between growth and wood quality traits, it is obvious that selection for growth results in a lower wood quality and vice versa. Moreover, prioritizing growth traits increases MFA, which negatively influences the quality of end-products, e.g., stiffness of sawn boards [56] or pulp yield [57]. A similar pattern of the expected genetic response after single-trait selection was also observed in lodgepole pine [6] or Norway spruce [12,58].
In order to explore opportunities for joint improvement, we have constructed indices consisting of DBH as an easy-to-measure growth trait and several estimates of MOE and DEN. Different sets of weights for MOE and DEN relative to 1 for DBH were plotted against expected genetic gains (Figure 3) whereby regions with positive gains for both traits were revealed. Intersections of the two respective curves on each graph were considered as points of a good compromise between the potential gain increase in one trait and decline in the other when each of the traits is selected alone. Weights corresponding to these intersections were used for calculating index coefficients. Weights for the index selection of DBH and MOESILV determined based on the intersection of their plotted expected genetic gains (1 cm for DHB and 1 GPa for MOE) correspond with weights suggested by [58] for Norway spruce and applied by [59], who studied lodgepole pine growing in northern Sweden (note that DBH in the two studies was expressed in mm, whereas we use cm).
The performance of indices calculated using SilviScan-based estimates of wood stiffness and density (MOESILV and DENSILV, respectively) was compared with that of indices calculated using non-destructive techniques for wood quality assessment (acoustic velocity and drilling resistance, Table 4). An index combining DBH and MOEDENCONST, representing the simplest approach to MOE estimation, resulted in the highest gain in growth but lowest in wood density, which was anticipated as no density information was supplied. This index also gave a rather low gain in wood stiffness compared to other indices that involved MOE. The index incorporating DBH and mean wood density calculated from adjusted drilling profiles (DENRES.TB) performed best for wood density improvement only but genetic gains for all other traits were low. The combination of DBH and MOEDENRES.TB calculated from acoustic velocity and adjusted drilling resistance seems to be the best option, as selection based on this index generated the highest and second highest gain for stiffness and wood density, respectively. Gains for growth traits were higher compared to the benchmark DBH and MOESILV but lower than those using indices with MOEDENSILV and MOEDENCONST. Correlated response of MFA was comparable with DBH and MOEDENSILV but a little lower than the benchmark DBH and MOESILV.
The joint selection for DBH and MOEDENRES.TB appears to offer a reasonable compromise in terms of the attained genetic gain for growth and wood quality traits as well as for MFA, resulting in trees with wood of versatile properties suitable for a great variety of purposes.

4.6. Practical Implications

Apart from the accuracy of assessment and purchasing expenses, the time required for conducting the measurements should also be considered when a new technique is evaluated for potential utilization. The Hitman ST300 operated by a team of two people is more than twice as efficient as if it is operated by a single person. However, the IML Resistograph can be efficiently operated by a single person while the measurements are acquired ca 2–3 times faster than those by Hitmen when operated by two people. Furthermore, while the measurement speed of the Resistograph depends on stem diameter only, the speed of Hitman, although constant under ideal conditions, is strongly affected by the presence of branches reaching below the upper probe, which must be removed prior to the measurements. The necessity to repeat measurements is comparable for both tools. Post-measurement adjustment of Resistograph’s drilling profiles is recommended in order to get more accurate estimates of wood density [25]. A linear detrending, followed by bark removal proposed by [24], represents a simple and quick fix. When one has to decide for just one of the wood quality assessment methods (Hitman or Resistograph) due to shortage of funding, time, or people, Hitman appears to a better choice than Resistograph, although the measurements will require a considerably higher amounts of time. Nevertheless, measuring with the Resistograph is fast and the inclusion of wood density estimated by the Resistograph in MOE calculations brings a substantial improvement in genetic gains for wood quality traits.

5. Conclusions

In this study, we focused on wood stiffness as an important mechanical parameter. We evaluated several non-destructive approaches of calculating the dynamic modulus of elasticity (MOEd, non-destructively assessed wood stiffness) based on acoustic velocity and wood density measurements. The following wood density measures were considered: Constant density, SilviScan density, unadjusted and adjusted Resistograph density, and Pilodyn density measured with and without bark. MOEd calculated from acoustic velocity and wood density derived from Resistograph’s adjusted drilling profiles (MOEDENRES.TB) appears to be the most efficient combination for indirect selection for wood stiffness. Nevertheless, acoustic velocity alone and MOEd derived from acoustic velocity and constant wood density reached nearly the same results as MOEDENRES.TB. In order to investigate the possibility of a joint improvement of unfavorably correlated growth and wood quality traits, we applied index selection. An index that combines stem diameter and MOEDENRES.TB seems to offer the best compromise for simultaneous improvement of growth, fiber, and wood quality traits.

Author Contributions

Conceptualization, I.F.; methodology, I.F. and T.F.; software, I.F.; validation, I.F. and T.F.; formal analysis, I.F.; investigation, I.F. and T.F.; data curation, I.F.; writing—original draft preparation, I.F.; writing—review and editing, T.F. and H.X.W.; visualization, I.F.; supervision, H.X.W. and I.F.; project administration, I.F. and H.X.W.; funding acquisition, I.F. and H.X.W.

Funding

This research was financially supported by UPSC Berzelii Center for Forest Biotechnology, Föreningen Skogsträdsförädling and Fonden för Skogsvetenskaplig Forskning (Swedish University of Agricultural Sciences).

Acknowledgments

The authors thank Skogforsk (The Forestry Research Institute of Sweden) for providing information about and access to the progeny trial and Zhou Hong, Anders Fries, Zhiqiang Chen, Henrik Hallingbäck and David Hall for help with field work.

Conflicts of Interest

The authors declare no conflict of interest.

References

  1. Falk, R.H. Wood as a sustainable building material. In Wood handbook - wood as an engineering material. General technical report FPL-GTR-190; U.S. Department of Agriculture, Forest Service, Forest Products Laboratory: Madison, WI, USA, 2010; Volume 190. [Google Scholar]
  2. Ramage, M.H.; Burridge, H.; Busse-Wicher, M.; Fereday, G.; Reynolds, T.; Shah, D.U.; Wu, G.; Yu, L.; Fleming, P.; Densley-Tingley, D. The wood from the trees: The use of timber in construction. Renew. Sust. Energ. Rev. 2017, 68, 333–359. [Google Scholar] [CrossRef]
  3. Wegner, T.; Skog, K.E.; Ince, P.J.; Michler, C.J. Uses and desirable properties of wood in the 21st century. J. For. 2010, 108, 165–173. [Google Scholar]
  4. Hong, Z.; Fries, A.; Wu, H. High negative genetic correlations between growth traits and wood properties suggest incorporating multiple traits selection including economic weights for the future Scots pine breeding programs. Ann. For. Sci. 2014, 71, 463–472. [Google Scholar] [CrossRef] [Green Version]
  5. Chen, Z.-Q.; Gil, M.R.G.; Karlsson, B.; Lundqvist, S.-O.; Olsson, L.; Wu, H.X. Inheritance of growth and solid wood quality traits in a large Norway spruce population tested at two locations in southern Sweden. Tree Genet. Genome. 2014, 10, 1291–1303. [Google Scholar] [CrossRef]
  6. Hayatgheibi, H.; Fries, A.; Kroon, J.; Wu, H.X. Genetic analysis of lodgepole pine (Pinus contorta) solid-wood quality traits. Can. J. For. Res. 2017, 47, 1303–1313. [Google Scholar] [CrossRef]
  7. Kennedy, S.G.; Cameron, A.D.; Lee, S.J. Genetic relationships between wood quality traits and diameter growth of juvenile core wood in Sitka spruce. Can. J. For. Res. 2013, 43, 1–6. [Google Scholar] [CrossRef]
  8. Wessels, C.B.; Malan, F.S.; Rypstra, T. A review of measurement methods used on standing trees for the prediction of some mechanical properties of timber. Eur. J. For. Res. 2011, 130, 881–893. [Google Scholar] [CrossRef]
  9. Legg, M.; Bradley, S. Measurement of stiffness of standing trees and felled logs using acoustics: A review. J. Acoust. Soc. Am. 2016, 139, 588–604. [Google Scholar] [CrossRef] [PubMed] [Green Version]
  10. Bucur, V. Acoustics of Wood, 2nd ed.; Springer: Berlin/Heidelberg, Germany, 2006; p. 394. [Google Scholar]
  11. Evans, R. Wood stiffness by X-ray diffractometry. In Characterization of the Cellulosic Cell Wall; Stokke, D., Groom, L., Eds.; Blackwell Publishing: Oxford, UK, 2006; pp. 138–146. [Google Scholar]
  12. Chen, Z.-Q.; Karlsson, B.; Lundqvist, S.-O.; Gil, M.R.G.; Olsson, L.; Wu, H.X. Estimating solid wood properties using Pilodyn and acoustic velocity on standing trees of Norway spruce. Ann. For. Sci. 2015, 72, 499–508. [Google Scholar] [CrossRef] [Green Version]
  13. El-Kassaby, Y.A.; Mansfield, S.; Isik, F.; Stoehr, M. In situ wood quality assessment in Douglas-fir. Tree Genet. Genome. 2011, 7, 553–561. [Google Scholar] [CrossRef]
  14. Newton, P.F. Acoustic-based non-destructive estimation of wood quality attributes within standing red pine trees. Forests 2017, 8, 380. [Google Scholar] [CrossRef]
  15. Raymond, C.A.; Joe, B.; Evans, R.; Dickson, R.L. Relationship between timber grade, static and dynamic modulus of elasticity, and SilviSvan properties for Pinus radiata in New South Wales. N. Z. J. For. Sci. 2007, 37, 186. [Google Scholar]
  16. Cherry, M.L.; Vikram, V.; Briggs, D.; Cress, D.W.; Howe, G.T. Genetic variation in direct and indirect measures of wood stiffness in coastal Douglas-fir. Can. J. For. Res. 2008, 38, 2476–2486. [Google Scholar] [CrossRef]
  17. Vikram, V.; Cherry, M.L.; Briggs, D.; Cress, D.W.; Evans, R.; Howe, G.T. Stiffness of Douglas-fir lumber: Effects of wood properties and genetics. Can. J. For. Res. 2011, 41, 1160–1173. [Google Scholar] [CrossRef]
  18. Wang, X.P.; Ross, R.J.; McClellan, M.; Barbour, R.J.; Erickson, J.R.; Forsman, J.W.; McGinnis, G.D. Nondestructive evaluation of standing trees with a stress wave method. Wood Fiber Sci. 2001, 33, 522–533. [Google Scholar]
  19. Auty, D.; Achim, A. The relationship between standing tree acoustic assessment and timber quality in Scots pine and the practical implications for assessing timber quality from naturally regenerated stands. Forestry 2008, 81, 475–487. [Google Scholar] [CrossRef] [Green Version]
  20. Wielinga, B.; Raymond, C.A.; James, R.; Matheson, A.C. Effect of green density values on Pinus radiata stiffness estimation using a stress-wave technique. N. Z. J. For. Sci. 2009, 39, 71–79. [Google Scholar]
  21. Kumar, S.; Jayawickrama, K.J.S.; Lee, J.; Lausberg, M. Direct and indirect measures of stiffness and strength show high heritability in a wind-pollinated radiata pine progeny test in New Zealand. Silvae Genet. 2002, 51, 256–261. [Google Scholar]
  22. Chauhan, S.S.; Walker, J.C.F. Variations in acoustic velocity and density with age, and their interrelationships in radiata pine. For. Ecol. Manag. 2006, 229, 388–394. [Google Scholar] [CrossRef]
  23. Hong, Z.; Fries, A.; Lundqvist, S.-O.; Gull, B.A.; Wu, H.X. Measuring stiffness using acoustic tool for Scots pine breeding selection. Scand. J. For. Res. 2015, 30, 363–372. [Google Scholar] [CrossRef]
  24. Fundova, I.; Funda, T.; Wu, H.X. Non-destructive wood density assessment of Scots pine (Pinus sylvestris L.) using Resistograph and Pilodyn. PLoS ONE 2018, 13. [Google Scholar] [CrossRef] [PubMed]
  25. Isik, F.; Li, B.L. Rapid assessment of wood density of live trees using the Resistograph for selection in tree improvement programs. Can. J. For. Res. 2003, 33, 2426–2435. [Google Scholar] [CrossRef]
  26. Walker, T.D.; Isik, F.; McKeand, S.E. Genetic variation in acoustic time of flight and drill resistance of juvenile wood in a large loblolly pine breeding population. For. Sci. 2019. [Google Scholar] [CrossRef]
  27. Hazel, L.N.; Lush, J.L. The efficiency of three methods of selection. J. Hered. 1942, 33, 393–399. [Google Scholar] [CrossRef]
  28. White, T.L.; Adams, W.T.; Neale, D.B. Forest Genetics; CAB International: Wallingford, UK, 2007. [Google Scholar]
  29. Namkoong, G. Optimum allocation of selection intensity in two stages of tuncation selection. Biometrics 1970, 26, 465–476. [Google Scholar] [CrossRef]
  30. Hazel, L.N. The genetic basis for constructing selection indexes. Genetics 1943, 28, 476–490. [Google Scholar] [PubMed]
  31. Falconer, D.S.; Mackay, T.F.C. Introduction to Quantitative Genetics; Longman: Harlow, UK, 1996; Volume 4, p. 464. [Google Scholar]
  32. Cotterill, P.P.; Dean, J.S. Successful Tree Breeding with Index Selection; Division of Forestry and Forest Products, CSIRO: Victoria, Australia, 1990.
  33. Ivković, M.; Wu, H.X.; McRae, T.A.; Powell, M.B. Developing breeding objectives for radiata pine structural wood production. I. Bioeconomic model and economic weights. Can. J. For. Res. 2006, 36, 2920–2931. [Google Scholar] [CrossRef]
  34. Fries, A. Genetic parameters, genetic gain and correlated responses in growth, fibre dimensions and wood density in a Scots pine breeding population. Ann. For. Sci. 2012, 69, 783–794. [Google Scholar] [CrossRef]
  35. Hannrup, B.; Ekberg, I.; Persson, A. Genetic correlations among wood, growth capacity and stem traits in Pinus sylvestris. Scand. J. For. Res. 2000, 15, 161–170. [Google Scholar] [CrossRef]
  36. RCoreTeam. R: A Language and Environment for Statistical Computing; R Foundation for Statistical Computing: Vienna, Austria, 2013. [Google Scholar]
  37. Brandel, G. Volume Functions for Individual Trees: Scots pine (Pinus sylvestris), Norway Spruce (Picea abies) and birch (Betula pendula & Betula pubescens); Report 26; Department of Forest Yield Research, Swedish University of Agricultural Sciences: Garpenberg, Sweden, 1990; p. 183. [Google Scholar]
  38. Gilmour, A.R.; Gogel, B.J.; Cullis, B.R.; Thompson, R. ASReml User Guide; Release 3.0; VSN International Ltd.: Hemel Hempstead, UK, 2009; Available online: www.vsni.co.uk (accessed on 11 February 2019).
  39. Smith, H.F. A discriminant function for plant selection. Ann. Eugen. 1936, 7, 240–250. [Google Scholar] [CrossRef]
  40. Desponts, M.; Perron, M.; DeBlois, J. Rapid assessment of wood traits for large-scale breeding selection in Picea mariana [Mill.] B.S.P. Ann. For. Sci. 2017, 74, 12. [Google Scholar] [CrossRef]
  41. Zhang, S.; Jiang, J.; Luan, Q. Index selection for growth and construction wood properties in Pinus elliottii open-pollinated families in southern China. South. For. J. For. Sci. 2018, 80, 209–216. [Google Scholar] [CrossRef]
  42. Lenz, P.; Auty, D.; Achim, A.; Beaulieu, J.; Mackay, J. Genetic improvement of white spruce mechanical wood traits—early screening by means of acoustic velocity. Forests 2013, 4, 575–594. [Google Scholar] [CrossRef]
  43. Baltunis, B.S.; Wu, H.X.; Powell, M.B. Inheritance of density, microfibril angle, and modulus of elasticity in juvenile wood of Pinus radiata at two locations in Australia. Can. J. For. Res. 2007, 37, 2164–2174. [Google Scholar] [CrossRef]
  44. Wang, X.P.; Carter, P.; Ross, R.J.; Brashaw, B.K. Acoustic assessment of wood quality of raw forest materials—A path to increased profitability. For. Prod. J. 2007, 57, 6–14. [Google Scholar]
  45. Carter, P. Breeding for wood quality; acoustic tools and technology. Presented at AFG & IUFRO SPWG Joint Conference, Hobart, Tasmania, April 2007. [Google Scholar]
  46. Lindström, H.; Harris, P.; Sorensson, C.T.; Evans, R. Stiffness and wood variation of 3-year old Pinus radiata clones. Wood Sci. Technol. 2004, 38, 579–597. [Google Scholar] [CrossRef]
  47. Grabianowski, M.; Manley, B.; Walker, J.C.F. Acoustic measurements on standing trees, logs and green lumber. Wood Sci. Technol. 2006, 40, 205–216. [Google Scholar] [CrossRef]
  48. Gao, S.; Wang, X.; Wang, L.; Allison, R.B. Effect of temperature on acoustic evaluation of standing trees and logs. Part 1. Laboratory investigation. Wood Fiber Sci. 2012, 44, 1–12. [Google Scholar]
  49. Chan, J.M.; Walker, J.C.; Raymond, C. Effects of moisture content and temperature on acoustic velocity and dynamic MOE of radiata pine sapwood boards. Wood Sci. Technol. 2011, 45, 609–626. [Google Scholar] [CrossRef]
  50. Wang, S.Y.; Chuang, S.T. Experimental data correction of the dynamic elastic moduli, velocity and density of solid wood as a function of moisture content above the fiber saturation point. Holzforschung 2000, 54, 309–314. [Google Scholar] [CrossRef]
  51. Newton, P. Quantifying the effects of wood moisture and temperature variation on time-of-flight acoustic velocity measures within standing red pine and jack pine trees. Forests 2018, 9, 527. [Google Scholar] [CrossRef]
  52. Škorpík, P.; Konrad, H.; Geburek, T.; Schuh, M.; Vasold, D.; Eberhardt, M.; Schueler, S. Solid wood properties assessed by non-destructive measurements of standing European larch (Larix decidua Mill.): Environmental effects on variation within and among trees and forest stands. Forests 2018, 9, 276. [Google Scholar] [CrossRef]
  53. Paradis, N.; Auty, D.; Carter, P.; Achim, A. Using a standing-tree acoustic tool to identify forest stands for the production of mechanically-graded lumber. Sensors 2013, 13, 3394. [Google Scholar] [CrossRef] [PubMed]
  54. Lindström, H.; Harris, P.; Nakada, R. Methods for measuring stiffness of young trees. Holz Als Roh-und Werkst. 2002, 60, 165–174. [Google Scholar] [CrossRef]
  55. Briggs, D.G.; Thienel, G.; Turnblom, E.C.; Lowell, E.; Dykstra, D.; Ross, R.J.; Wang, X.; Carter, P. Influence of thinning on acoustic velocity of Douglas-fir trees in western Washington and western Oregon. In Proceedings of the 15th International Symposium on Nondestructive Testing of Wood, Duluth, MN, USA, 10–12 September 2007; Forest Products Society: Madison, WI, USA, 2008; pp. 113–123. [Google Scholar]
  56. Ivković, M.; Wu, H.X.; Spencer, D.J.; McRae, T.A. Modelling the effects of stem sweep, branch size and wood stiffness of radiata pine on structural timber production. Austral. For. 2007, 70, 173–184. [Google Scholar] [CrossRef]
  57. Apiolaza, L.A.; Raymond, C.A.; Yeo, B.J. Genetic variation of physical and chemical wood properties of Eucalyptus globulus. Silvae Genet. 2005, 54, 160–166. [Google Scholar] [CrossRef]
  58. Chen, Z.-Q.; Karlsson, B.; Mörling, T.; Olsson, L.; Mellerowicz, E.J.; Wu, H.X.; Lundqvist, S.-O.; Gil, M.R.G. Genetic analysis of fiber dimensions and their correlation with stem diameter and solid-wood properties in Norway spruce. Tree Genet. Genome. 2016, 12, 123. [Google Scholar] [CrossRef] [Green Version]
  59. Hayatgheibi, H.; Fries, A.; Kroon, J.; Wu, H. Genetic analysis of fiber-dimension traits and combined selection for simultaneous improvement of growth and stiffness in lodgepole pine (Pinus contorta). Can. J. For. Res. 2019, 49, 500–509. [Google Scholar] [CrossRef]
Figure 1. Relationships between benchmark MOESILV and moduli of elasticity (GPa) calculated using acoustic velocity and different wood density estimates.
Forests 10 00491 g001
Figure 2. Dendrogram of additive genetic correlations depicting relationships among growth, fiber, and wood quality traits.
Forests 10 00491 g002
Figure 3. Expected genetic gains for simultaneous selection of diameter (DBH) with different moduli of elasticity (MOE) and wood density (DEN) estimates with selection intensity of 1%. X-axis indicates weights for MOE/DEN relative to constant weight of 1 for DBH; Y-axis represents the expected genetic gain.
Forests 10 00491 g003
Table 1. Descriptive statistics for different estimates of modulus of elasticity and acoustic velocity—minimum, maximum, mean, standard deviation (SD), coefficient of variation (CV), individual narrow-sense heritabilities ( h i 2 ) with standard errors in parentheses, and Duncan’s multiple range test (DMRT).
TraitUnitsDescriptionMinMaxMeanSDCV h i 2 DMRT
MOESILVGPaBenchmark modulus of elasticity from SilviScan5.016.010.21.918.50.39 (0.09)b
VELkm·s−1Acoustic velocity measured by Hitman2.84.73.80.39.00.37 (0.09)-
MOECONSTGPaDynamic modulus of elasticity with DEN = 10007.722.314.92.617.70.37 (0.09)a
MOEDENSILVGPaDynamic modulus of elasticity with DEN = DENSILV3.411.26.71.521.70.46 (0.10)d
MOEDENRESGPaDynamic modulus of elasticity with DEN = DENRES/43.411.77.01.420.70.44 (0.11)d
MOEDENRES.TBGPaDynamic modulus of elasticity with DEN = DENRES.TB/43.412.06.91.521.70.45 (0.11)d
MOEDENPILGPaDynamic modulus of elasticity with DEN = 1/DENPIL3.212.26.91.622.70.40 (0.10)d
MOEDENPIL.BGPaDynamic modulus of elasticity with DEN = 1/DENPIL.B3.916.79.22.122.80.41 (0.10)c
DENSILV—SilviScan area-weighted mean density, DENRES—Resistograph unadjusted density, DENRES.TB—Resistograph adjusted density (detrended and debarked), DENPIL—depth of Pilodyn’s pin penetration with bark, DENPIL.B—depth of Pilodyn’s pin penetration without bark; DMRT—means with the same letter are not significantly different; VEL was not included in Duncan’s test.
Table 2. Additive genetic and phenotypic correlations of benchmark SilviScan modulus of elasticity (MOESILV) with acoustic velocity and estimates of dynamic modulus of elasticity obtained using six different approaches (standard errors in parentheses).
Correlations with MOESILV
GeneticPhenotypic
VEL0.91 (0.05)0.65 (0.02)
MOEDENCONST0.91 (0.05)0.65 (0.02)
MOEDENSILV0.95 (0.03)0.75 (0.02)
MOEDENRES0.87 (0.07)0.65 (0.02)
MOEDENRES.TB0.91 (0.05)0.70 (0.02)
MOEDENPIL0.84 (0.07)0.65 (0.02)
MOEDENPIL.B0.83 (0.08)0.61 (0.03)
Table 3. Additive genetic and phenotypic correlations of different estimates of modulus of elasticity and acoustic velocity with growth, fiber, and wood traits (standard errors in parentheses).
Genetic CorrelationsPhenotypic Correlations
MOESILVVELMOEDENCONSTMOEDENSILVMOEDENRES.TBMOESILVVELMOEDENCONSTMOEDENSILVMOEDENRES.TB
Wood traits
DENSILV0.84 (0.07)0.73 (0.11)0.73 (0.11)0.87 (0.06)0.92 (0.05)0.60 (0.03)0.33 (0.04)0.33 (0.04)0.62 (0.03)0.53 (0.03)
DENRES.TB0.63 (0.13)0.58 (0.14)0.57 (0.15)0.76 (0.09)0.83 (0.07)0.45 (0.03)0.27 (0.04)0.27 (0.04)0.49 (0.03)0.64 (0.03)
DENPIL0.44 (0.18)0.50 (0.17)0.51 (0.17)0.57 (0.15)0.66 (0.14)0.33 (0.04)0.24 (0.04)0.24 (0.04)0.33 (0.04)0.35 (0.04)
DENPIL.B0.43 (0.18)0.48 (0.18)0.49 (0.17)0.62 (0.14)0.62 (0.14)0.26 (0.04)0.22 (0.04)0.22 (0.04)0.34 (0.04)0.36 (0.04)
EWD0.95 (0.05)0.81 (0.09)0.81 (0.09)0.88 (0.06)0.96 (0.05)0.51 (0.03)0.30 (0.04)0.31 (0.04)0.56 (0.03)0.47 (0.03)
TWD0.79 (0.08)0.69 (0.11)0.69 (0.11)0.83 (0.07)0.85 (0.07)0.66 (0.02)0.39 (0.03)0.39 (0.03)0.63 (0.02)0.58 (0.03)
LWD0.78 (0.08)0.70 (0.11)0.70 (0.11)0.83 (0.07)0.84 (0.07)0.73 (0.02)0.46 (0.03)0.46 (0.03)0.65 (0.02)0.61 (0.03)
EWP0.00 (0.23)0.00 (0.24)0.00 (0.24)−0.06 (0.23)−0.12 (0.24)0.20 (0.04)0.15 (0.04)0.14 (0.04)0.04 (0.04)0.08 (0.04)
TWP−0.27 (0.23)−0.21 (0.25)−0.21 (0.25)−0.23 (0.24)−0.16 (0.25)−0.36 (0.03)−0.22 (0.04)−0.21 (0.04)-0.18 (0.04)−0.19 (0.04)
LWP0.39 (0.18)0.31 (0.20)0.31 (0.20)0.47 (0.17)0.50 (0.17)0.32 (0.03)0.08 (0.04)0.09 (0.04)0.26 (0.04)0.21 (0.04)
Fiber traits
MFA−0.90 (0.04)−0.86 (0.07)−0.86 (0.07)−0.79 (0.09)−0.66 (0.13)−0.89 (0.01)−0.62 (0.02)−0.61 (0.02)−0.59 (0.03)−0.56 (0.03)
FWT0.80 (0.08)0.69 (0.12)0.69 (0.12)0.80 (0.08)0.80 (0.09)0.52 (0.03)0.26 (0.04)0.27 (0.04)0.54 (0.03)0.46 (0.04)
FCS0.61 (0.13)0.50 (0.16)0.49 (0.16)0.56 (0.14)0.49 (0.16)0.32 (0.04)0.13 (0.04)0.14 (0.04)0.34 (0.04)0.28 (0.04)
FRW−0.02 (0.20)−0.19 (0.20)−0.19 (0.20)−0.23 (0.19)−0.40 (0.18)−0.09 (0.04)−0.06 (0.04)−0.07 (0.04)−0.09 (0.04)−0.09 (0.04)
FTW−0.02 (0.20)0.02 (0.20)0.01 (0.20)−0.03 (0.19)−0.10 (0.20)−0.27 (0.04)−0.19 (0.04)−0.19 (0.04)−0.27 (0.04)−0.25 (0.04)
Growth traits
DBH−0.45 (0.18)−0.26 (0.21)−0.25 (0.22)−0.32 (0.20)−0.32 (0.21)−0.40 (0.03)−0.29 (0.04)−0.29 (0.04)−0.33 (0.03)−0.33 (0.04)
HGT−0.38 (0.19)−0.18 (0.21)−0.17 (0.21)−0.22 (0.20)−0.26 (0.20)−0.12 (0.04)−0.10 (0.04)−0.10 (0.04)−0.08 (0.04)−0.09 (0.04)
VOL−0.44 (0.19)−0.24 (0.21)−0.23 (0.22)−0.30 (0.20)−0.30 (0.21)−0.37 (0.03)−0.27 (0.04)−0.27 (0.04)−0.30 (0.04)−0.29 (0.04)
DENSILV—SilviScan mean density, DENRES.TB—Resistograph adjusted density, DENPIL—depth of Pilodyn’s pin penetration with bark, DENPIL.B—depth of Pilodyn’s pin penetration without bark, EWD—SilviScan density of earlywood, TWD—SilviScan density of transition wood, LWD—SilviScan density of latewood, EWP—proportion of earlywood, TWP—proportion of transition wood, LWP—proportion of latewood, MFA—microfibril angle, FWT—fiber wall thickness, FCS—fiber coarseness, FRW—fiber width in radial direction, FTW—fiber width in tangential direction, DBH—diameter at breast height, HGT—height, VOL—volume. Descriptive statistics and narrow-sense heritabilities for traits in the first column can be found in [24].
Table 4. Response to selection (in%) for important growth and wood quality traits under selection intensity of 1%. Different scenarios are considered: Selection for DBH and MOESILV separately, and selection based on indices combining DBH with MOE or DEN.
Selection TraitsWeightsTarget Traits
DBHVOLMOESILVDENSILVMFA
DBH-9.4019.75−6.47−2.905.66
MOESILV-−5.69−11.8519.277.02−19.62
DBH & MOESILV[1 1.0]4.048.619.572.95−10.75
DBH & MOEDENSILV[1 1.0]5.5111.688.453.09−8.65
DBH & MOEDENRES.TB[1 1.1]4.9510.039.834.31−8.60
DBH & MOEDENCONST[1 0.6]6.5513.845.771.49−7.34
DBH & DENSILV[1 0.05]5.3911.633.652.24−1.94
DBH & DENRES.TB[1 0.04]3.166.875.934.50−0.86
Weights (in brackets) correspond to intersections of plotted weights versus expected genetic gains (Figure 3) and were used for calculating index coefficients.

