Article

Current and Future Distribution of Ricania shantungensis (Hemiptera: Ricaniidae) in Korea: Application of Spatial Analysis to Select Relevant Environmental Variables for MaxEnt and CLIMEX Modeling

1
Entomology program, Department of Agricultural Biotechnology, Seoul National University, Seoul 08826, Korea
2
Research Institute of Agriculture and Life Sciences, Seoul National University, Seoul 08826, Korea
*
Author to whom correspondence should be addressed.
Forests 2019, 10(6), 490; https://doi.org/10.3390/f10060490
Submission received: 10 May 2019 / Revised: 5 June 2019 / Accepted: 6 June 2019 / Published: 7 June 2019
(This article belongs to the Special Issue Impacts, Monitoring and Management of Forest Pests and Diseases)

Abstract

:
Since the first report on its occurrence in 2010, Ricania shantungensis Chou & Lu in Korea has quickly spread. This pest population in agricultural areas has increased by over 100% each year and has caused serious economic damage in the last few years. This study was conducted to predict the potential habitat and the current and future distribution of R. shantungensis in Korea using CLIMEX and the Maximum Entropy Model (MaxEnt), and to suggest a new parameter selection method for both modeling programs. Weights of variables used in CLIMEX and those used in MaxEnt were determined using spatial association indices of spatial analysis by distance indices (SADIE). Weather data of Zhejiang province in China and those of all Korean territories were compared with Climate Matching in CLIMEX. MaxEnt was applied and evaluated with 295 data points on the presence and absence of R. shantungensis and eight environmental variables that were preselected by spatial and correlation tests. In MaxEnt, maximum temperature of the warmest month, annual mean temperature, mean temperature of the coldest month, and precipitation of the driest month were determined to be the most important variables affecting the distribution of R. shantungensis in Korea. The results of this study indicated that R. shantungensis had a higher probability of occurrence in western areas than in eastern areas of Korea, and showed great potential to spread eastward. These results are expected to be helpful for managing R. shantungensis in Korea and selecting relevant environmental variables for species distribution modeling.

1. Introduction

Since Ricania shantungensis Chou & Lu (Hemiptera: Ricaniidae) was first reported in Gongju and Yesan of Chungcheong-do in 2010 in Korea, this insect pest has quickly spread southward to Jeonla-do and northward to Gyunggi-do [1]. It is now slowly spreading toward the middle parts of Gyungsang-do [2]. Overall, the population of R. shantungensis in agricultural areas has increased by over 100% each year from 2015 to 2017, causing serious economic damage [3]. This pest directly causes damage by sucking plant saps and laying eggs. It also indirectly induces sooty mold disease on leaves through its excretions [1]. Accordingly, there has been an increasing demand for knowledge about the current and future distribution of R. shantungensis in order to determine how environmental conditions influence its occurrence and improve the efficiency of this species’ management. There has been a report [4] in which the habitat suitability of R. shantungensis in Korea was estimated with the Maximum Entropy Model (MaxEnt). In that report, the predicted habitats were able to explain the distribution of R. shantungensis at that time. However, the current distribution of R. shantungensis appears to be different from their prediction in areas of Korea where this pest has newly spread. In addition, they did not explain how the variables selected in the model affected its occurrence. Moreover, to date, the future distribution of R. shantungensis has not been predicted.
MaxEnt estimates the distribution of a species by finding the distribution that is closest to the geographically uniform distribution, which is determined by the environmental characteristics of locations where it is present with given environmental variables [5]. The characteristics of MaxEnt are the use of data on presence and pseudo-absence, the determination of environmental and/or biological factors related to target species’ distribution, and a correlative parameter selection process [5,6,7]. Its correlative parameter selection process has received major criticisms: ecologically unrelated variable selection with target species distribution [8], a relatively low prediction ability in spreading species [9], and highly biased results in unsampled areas [10].
Due to the inherent issues with correlative methods for species distribution models (SDMs), deterministic methods have also been used for SDMs. Among the deterministic methods, CLIMEX is one of the most popular methods due to its good prediction of target species’ distribution and relative ease of use [11,12,13]. CLIMEX estimates the potential distribution and risk of a species in relation to climate by using a deterministic method that requires pre-determined parameters regardless of target species distribution in the areas of interest, which is the opposite of the parameter selection process in MaxEnt [13]. CLIMEX is composed of the CLIMEX Model and Climate Matching [11,13]. Both the CLIMEX Model and Climate Matching in CLIMEX require biological information (e.g., growth-related indices such as temperature, moisture, radiation, substrate, light, and diapause, and stress-related indices such as cold, heat, dry, wet, and stress interactions) to determine the model parameters and the weights of parameters, respectively [13]. Biological information on many invasive species is limited because they have not been studied well because they are often less economically important in their areas of origin. This is likely to be the case for R. shantungensis. There is no available information on the distribution of R. shantungensis, except for that in Korea, to estimate CLIMEX Model parameters. Only a limited amount of information is available for determining the parameters themselves. However, Climate Matching requires less information, such as information on the climate of the areas of origin and interest and the weights of the model parameters, as compared to CLIMEX Modeling [13]. The origin of R. shantungensis was assumed to be the Zhejiang or Shandong provinces in the eastern coastal areas of China [14]. However, R. shantungensis has been recorded and managed as an important economic pest in Zhejiang province only [15]. Thus, the occurrence of R. shantungensis in Korea could be estimated by comparing information on the climate of the Zhejiang province of China with information on the climate in areas of Korea.
Climate matching in CLIMEX could provide information on the potential habitats of R. shantungensis in Korea. However, it may not exactly match the actual distribution of R. shantungensis because prediction in the model is only determined by climate factors. In addition, the model predicts potential habitats using a deterministic process. In contrast, MaxEnt can evaluate both climate and non-climate factors and select correlative variables within its distribution. Thus, the distribution predicted by this model should match the actual distribution well, although the reliability of the parameters selected by MaxEnt remains to be proven. In other words, prediction in CLIMEX and MaxEnt is restricted to the fundamental and realized niches of a target species, respectively [8]. Therefore, results from CLIMEX could help us to predict the directions of spread of R. shantungensis in Korea in the near future from the current distribution that has been predicted by MaxEnt. Moreover, results from both CLIMEX and MaxEnt could minimize the drawbacks of each modeling process and support each other by considering the ecological aspects in CLIMEX and the current distribution in MaxEnt for R. shantungensis if both CLIMEX and MaxEnt are applied together. However, there is no standardized process for determining the relevant variables in MaxEnt and the weights of the parameters in CLIMEX.
Therefore, this study was conducted to evaluate the potential habitat of R. shantungensis with CLIMEX, to predict the current distribution of the possible presence of R. shantungensis with MaxEnt, to suggest a method for selecting parameters in MaxEnt and the parameters’ weights in CLIMEX, and finally to predict the future distribution of the possible presence of R. shantungensis in Korea.

2. Materials and Methods

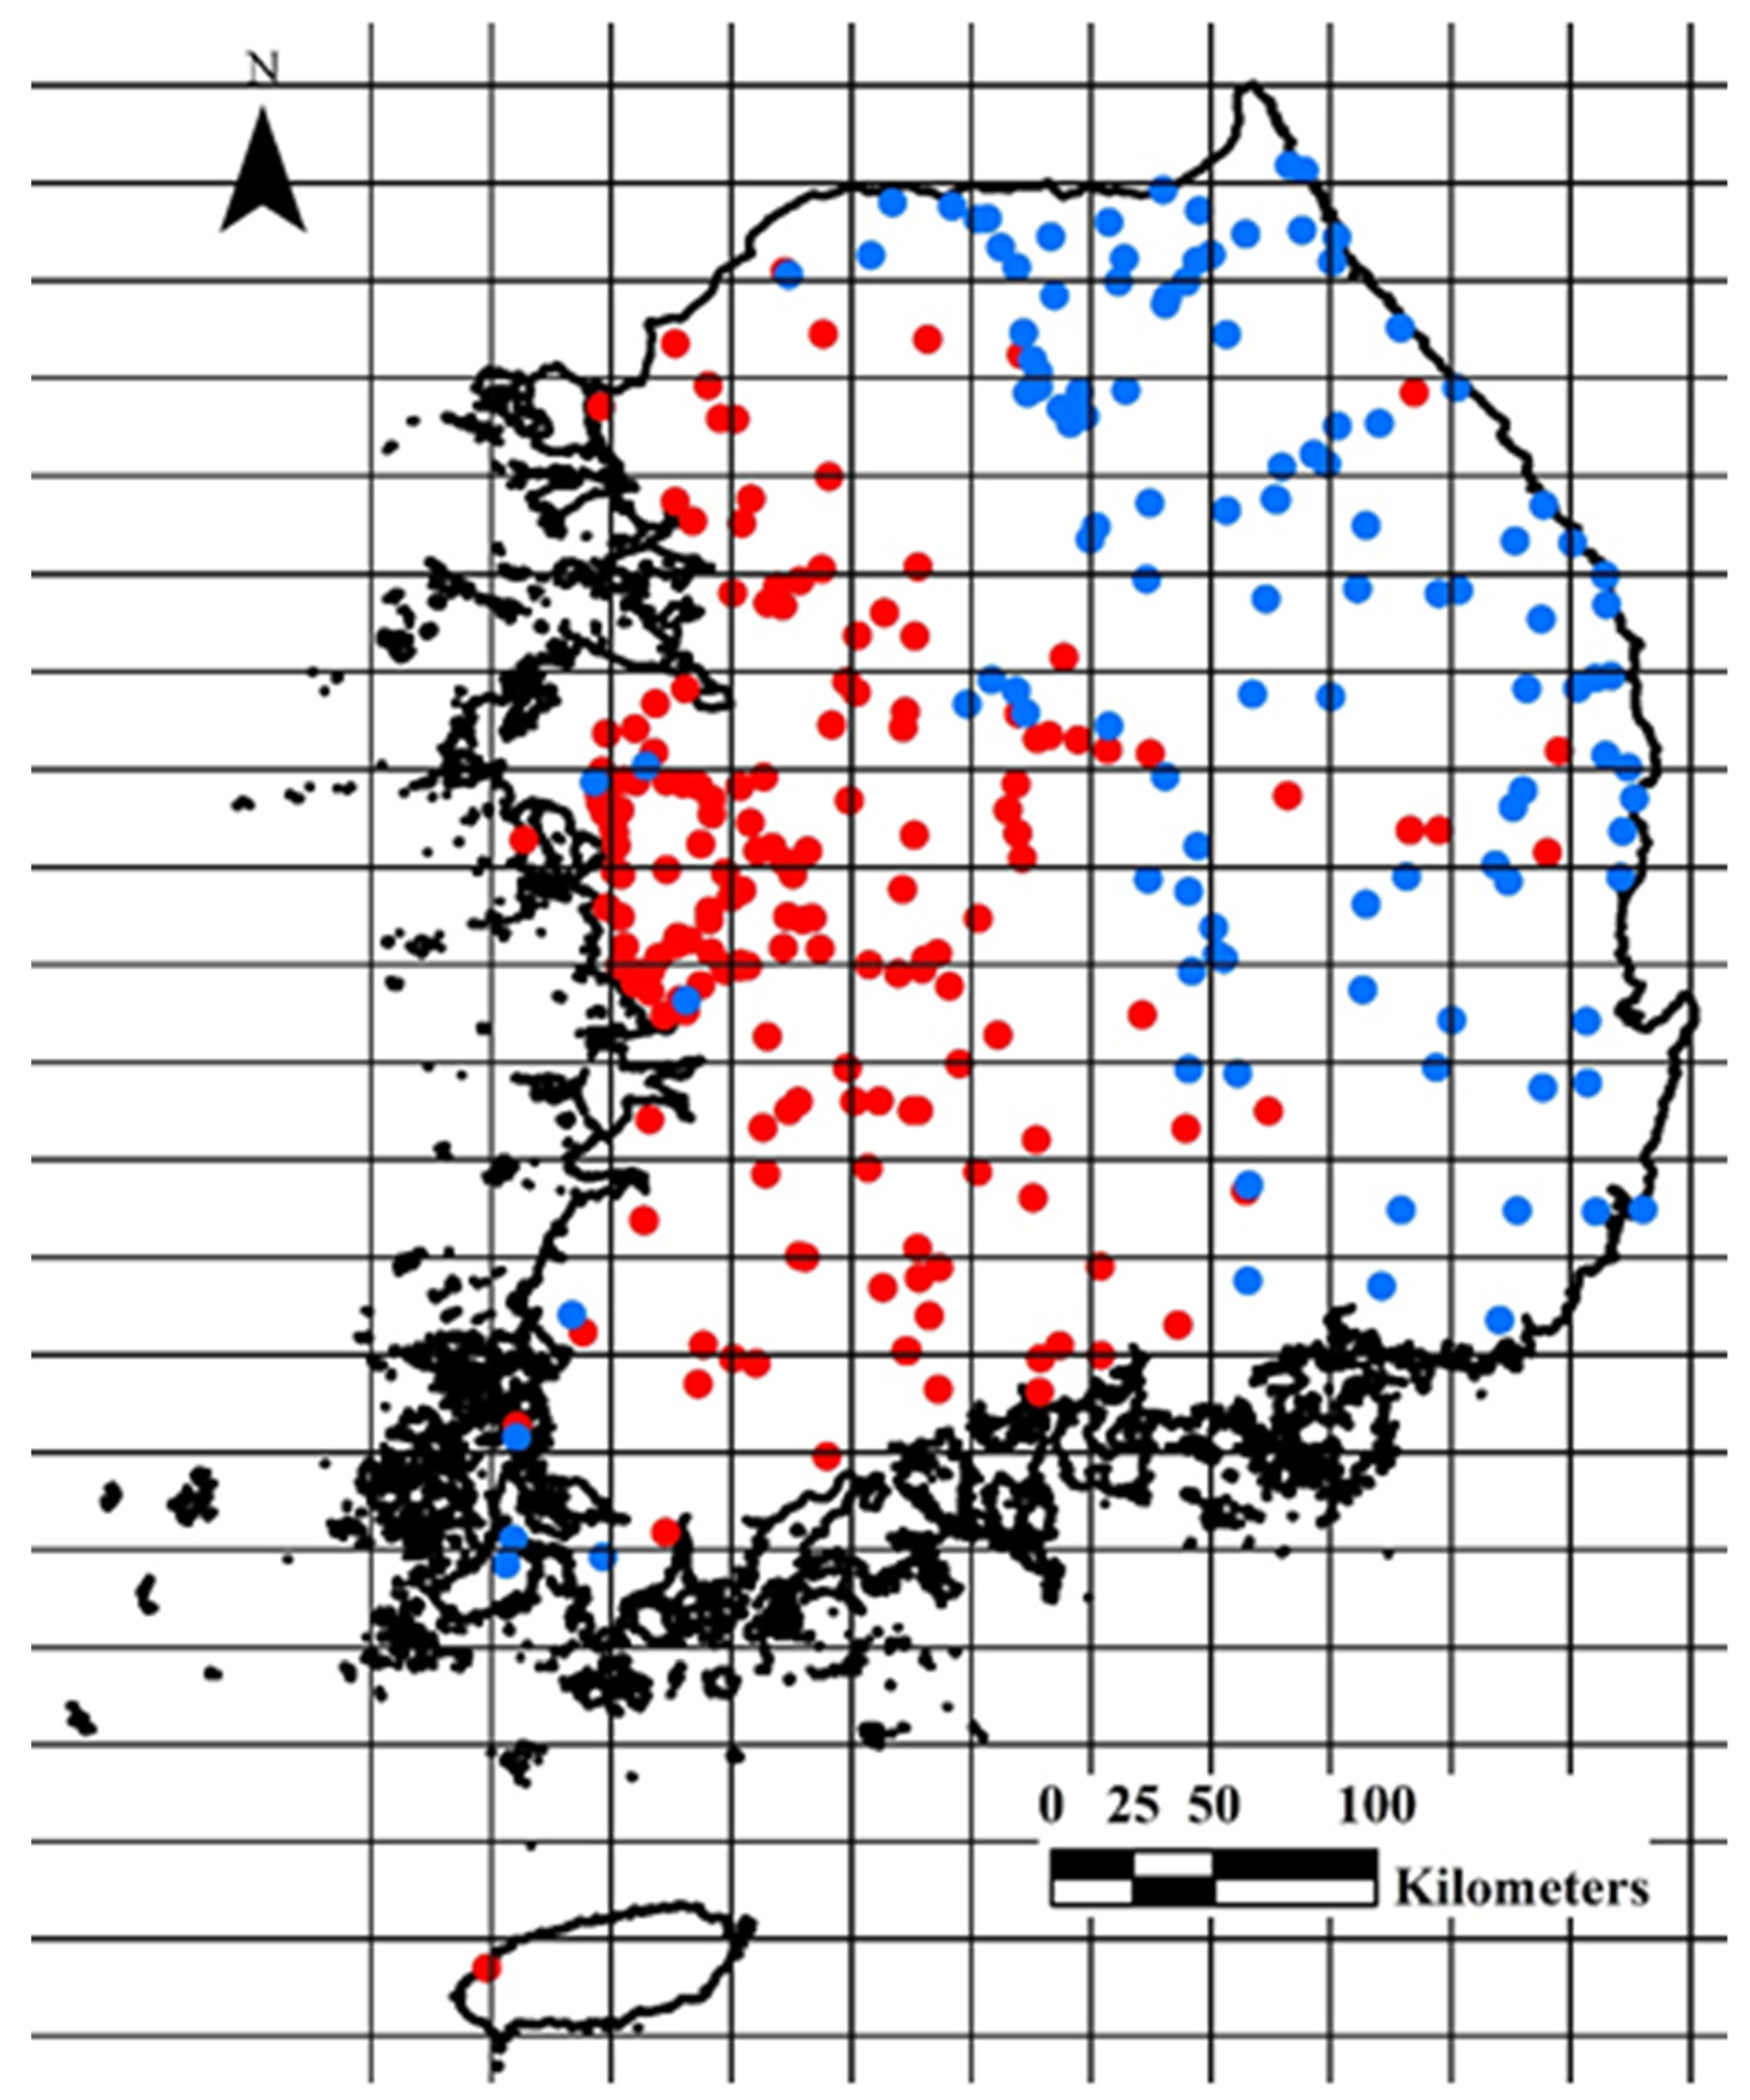
2.1. Data Collection for the Presence and Absence of R. shantungensis

In order to collect data on the presence and absence of R. shantungensis, a map of Korea was divided into 30 km by 30 km grids, and at least one location point per grid was surveyed for the occurrence of R. shantungensis to minimize unsampled areas (Figure 1). First, data on presence were obtained from previously published data [4] and unpublished reports by the Gyunggi and Chungnam Agricultural Research and Extension Services in 2017. Grid locations where the presence of R. shantungensis was not checked were then surveyed in 2017. The survey was mainly conducted along rest areas of highways within a grid because R. shantungensis had been first found at rest areas of highways in newly invaded areas [4]. If rest areas were not present within a grid, then major host plants (i.e., Robinia pseudoacacia, Diospyros kaki, Castanea spp., Prunus serrulata, and so on) at temporary parking places abutting forested areas were randomly observed within the grid. The absence of R. shantungensis was determined after checking at least 20 trees. Whole branches within observers’ reach were observed in each tree. A total of 295 data points (149 previously reported points and 146 newly surveyed points) were collected, and R. shantungensis was found at 175 points among them (Figure 1).

2.2. Environmental, Traffic, Footprint, and Landcover Data Collection

Numerical climate data, composed of monthly temperatures (i.e., maximum, minimum, and mean) and precipitation for the period 1981–2010 from 73 meteorological stations, were obtained from the Korea Meteorological Administration (KMA) (http://www.kma.go.kr). Climatic data were interpolated throughout all areas of Korea using inverse distance weighting with an option of estimating a point value with the nearest five meteorological stations’ data. The estimated monthly temperature and precipitation data were transformed into 19 bioclimatic variables in the format of WorldClim (http://www.worldclim.org) in DIVA-GIS 7.5 [16]. All variables were created in the same resolution (i.e., 1 km by 1 km) and file format (i.e., ASCII) by considering the resolution of the available projected map and environmental data. Future climate data were also downloaded from the KMA. These data were developed by the representative concentration pathway (RCP) 8.5 scenario for temperature and precipitation based on historical data (1986–2005) in Korea. In this study, climate data (i.e., temperature and precipitation) of RCP 8.5 for the 2030s (2031–2040), the 2050s (2051–2060), the 2070s (2071–2080), and the 2090s (2091–2100) were used to estimate the future distribution of R. shantungensis in Korea.
A digital elevation model (DEM) was downloaded from the website of the National Spatial Data Infrastructure Portal in Korea (http://www.nsdi.go.kr) to create elevation data. Because these elevation data were created with a different resolution (i.e., 0.8 km by 0.8 km) from that of the 19 bioclimatic variables, data were resampled by the numeric value of the nearest neighbor cell using the resample tool in ArcGIS 10.1 (ESRI; Redlands, CA, USA).
Traffic data were downloaded from the website of the Traffic Monitoring System in Korea (http://www.road.re.kr). For analysis, the downloaded traffic amount at 3477 points was interpolated with the ordinary Kriging method and mapped in ASCII file format with a resolution of 1 km by 1 km in ArcGIS 10.1. Footprint data were also downloaded from the website of National Aeronautics and Space Administration (NASA) Earth Observing System Data and Information System (http://earthdata.nasa.gov). Worldwide data were clipped with the mask of the Korean territory in ArcGIS 10.1.
Landcover data furnished by the Environmental Geographic Information Service in Korea (http://egis.me.go.kr) were downloaded and resampled by the attribute value with the largest area within a 1 km by 1 km cell in ArcGIS 10.1 because the resolution of the downloaded data (i.e., 5 m by 5 m) was much higher than that of the other variables.
A total of 23 variables (Table 1), including 19 bioclimatic variables, were prepared to describe the current distribution of R. shantungensis in Korea.

2.3. Spatial Association between Environmental Variables and Distribution of R. shantungensis

In order to accurately predict the distribution of R. shantungensis in Korea, variables selected for modeling should be biologically related to R. shantungensis. If distributions of selected variables are spatially related to the distribution of R. shantungensis, possibilities of biological relationships between R. shantungensis and its surrounding environmental variables are expected to be increased [17]. Thus, spatial analysis by distance indices (SADIE) [18] was used to measure spatial associations between data on the occurrence of R. shantungensis and 22 environmental variables. The Landcover variable could not be applied for spatial analysis because it was in the form of categorical data. SADIE quantifies the contribution of counts at each location to a patch (i.e., a region of relatively large counts close to one another) and a gap (i.e., a region of relatively small counts close to one another) [19]. For the spatial association test in SADIE, the variables that are compared should have coincident coordinates, and all data should have clustering indices (i.e., a degree of contribution at each location) [19]. To match the coordinates of each point of data on the occurrence of R. shantungensis and the 22 environmental variables, point data were extracted from middle points of each grid (Figure 1) in ArcGIS 10.1. For this process, a krigged map for R. shantungensis occurrence was used. Spatial indices of each point of 23 sets were estimated in SADIE. The overall spatial association (X) is the mean of the local correlation coefficient between the clustering indices of the two sets; X > 0 for a positive spatial association, X = 0 for no spatial association, and X < 0 for a negative spatial association [19]. Positive X values indicate the coincidence of a patch cluster for one set with a patch cluster for the other or the coincidence of two gaps, and negative X values are indicated by a patch coinciding with a gap [19]. The associated probability (P) was also calculated based on randomization tests [19]. The null hypothesis is that the spatial arrangement of the count data between two data sets is random [20]. In this study, X > 0 indicates a positive spatial association, X = 0 indicates no spatial association, and X < 0 indicates a negative spatial association between the occurrence of R. shantungensis and its surrounding environments. All SADIE statistics were calculated using SADIEShell version 1.22 (Rothamsted Experimental Station, Harpenden, Herts, UK).

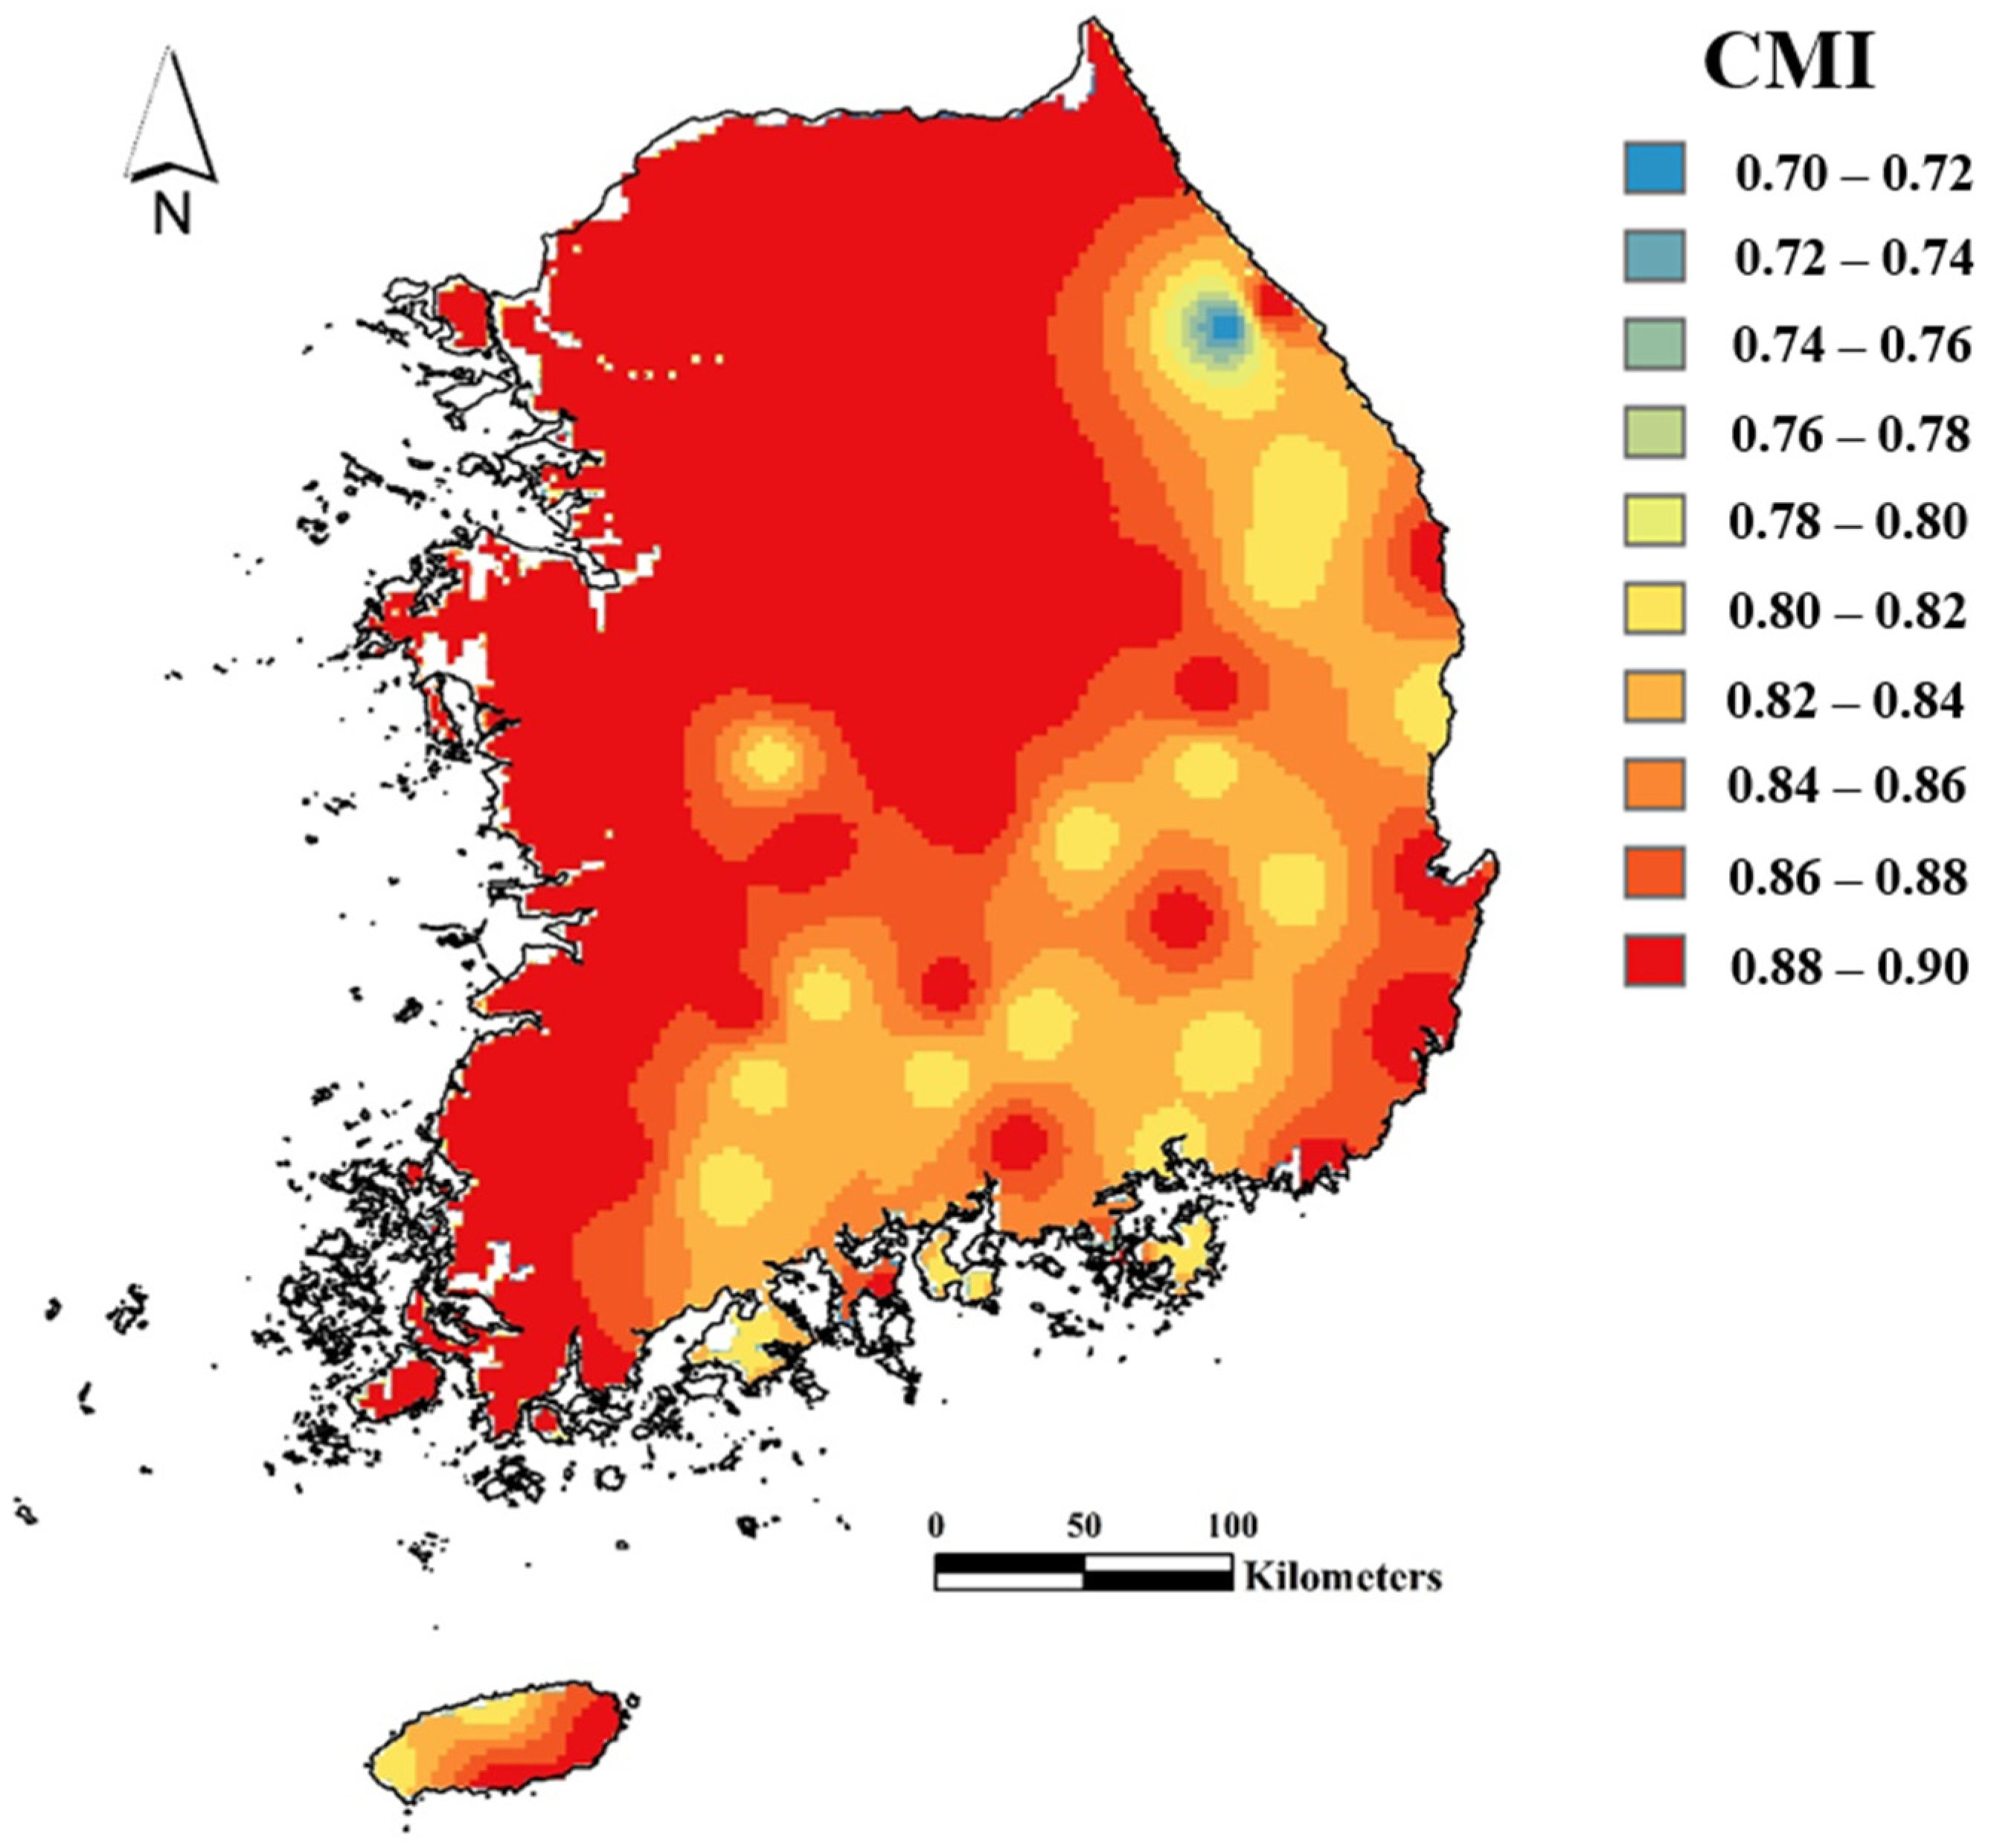
2.4. Prediction of Habitat Suitability of R. shantungensis with CLIMEX

The Climate Matching function in CLIMEX predicts the habitat suitability of a target species in a country of interest (i.e., Korea in this study and Away in CLIMEX) by comparing the climate of the origin area (i.e., Zhejiang in this study and Home in CLIMEX) with that of Away [8]. Metadata provided by the CLIMEX program and 30 years (1981–2010) of climate data from the KMA were used as the climate data of Zhejiang in China and all Korean territories, respectively. The similarity level of climates between Home and Away was determined by the Composite Match Index (CMI), which is calculated using seven components (i.e., Maximum temperature (Itmax), Minimum temperature (Itmin), Average temperature (Itav), Total rainfall (Irain), Rainfall pattern (Irpat), Relative humidity (Ihum), and Soil moisture (Ismst)) and the individual weight of each component [13]. If the CMI value is closer to 1 than 0, climates of Away areas are more similar to those of the Home area [11].
Among the seven components, only five related to temperature and precipitation were used for Climate Matching in this study. Between Itav and Itmin, Itav was selected and used for the analysis because Itav was highly correlated (correlation coefficient (r) > 0.9) with Itmin and the X value of Itav in spatial association tests was higher than that of Itmin (Table 2). Weights of the four remaining variables were determined by using the X values of related environmental factors in spatial association tests between environmental factors and R. shantungensis occurrence as follows:
Weight of Itav = [XBio1/(XBio1 + XBio5)] ∗ [{(XBio1 + XBio5)/2}/{(XBio12 + XBio13 + XBio14 + XBio16 + XBio17 + XBio18 + XBio19)/7}]
Weight of Itmax = [XBio5/(XBio1 + XBio5)] ∗ [{(XBio1 + XBio5)/2}/{(XBio12 + XBio13 + XBio14 + XBio16 + XBio17 + XBio18 + XBio19)/7}]
Weight of Irain = [XBio12/{XBio12 + (XBio13 + XBio14 + XBio16 + XBio17 + XBio18 + XBio19)/6}] ∗ [{(XBio12 + XBio13 + XBio14 + XBio16 + XBio17 + XBio18 + XBio19)/7}/{(XBio1 + XBio5)/2}]
Weight of Irpat = [{XBio12 + (XBio13 + XBio14 + XBio16 + XBio17 + XBio18 + XBio19)/6}/XBio12] ∗ [{(XBio12 + XBio13 + XBio14 + XBio16 + XBio17 + XBio18 + XBio19)/7}/{(XBio1 + XBio5)/2}]
where XBioi indicates the X value of bioclimatic factor Bioi in the spatial association test with R. shantungensis occurrence. Bio1, Bio5, Bio12, and Bio13, 14, 16, 17, 18, and 19 were related to Itav, Itmax, Irain, and Irpat, respectively. These bioclimatic factors were not only related to components of Climate Matching in CLIMEX but also spatially associated with R. shantungensis occurrence. From these processes, the actual weights that were used of each component were 0.61, 0, 0.39, 0.48, 0.49, 0, and 0 for Itmax, Itmin, Itav, Irain, Irpat, Ihum, and Ismst, respectively.

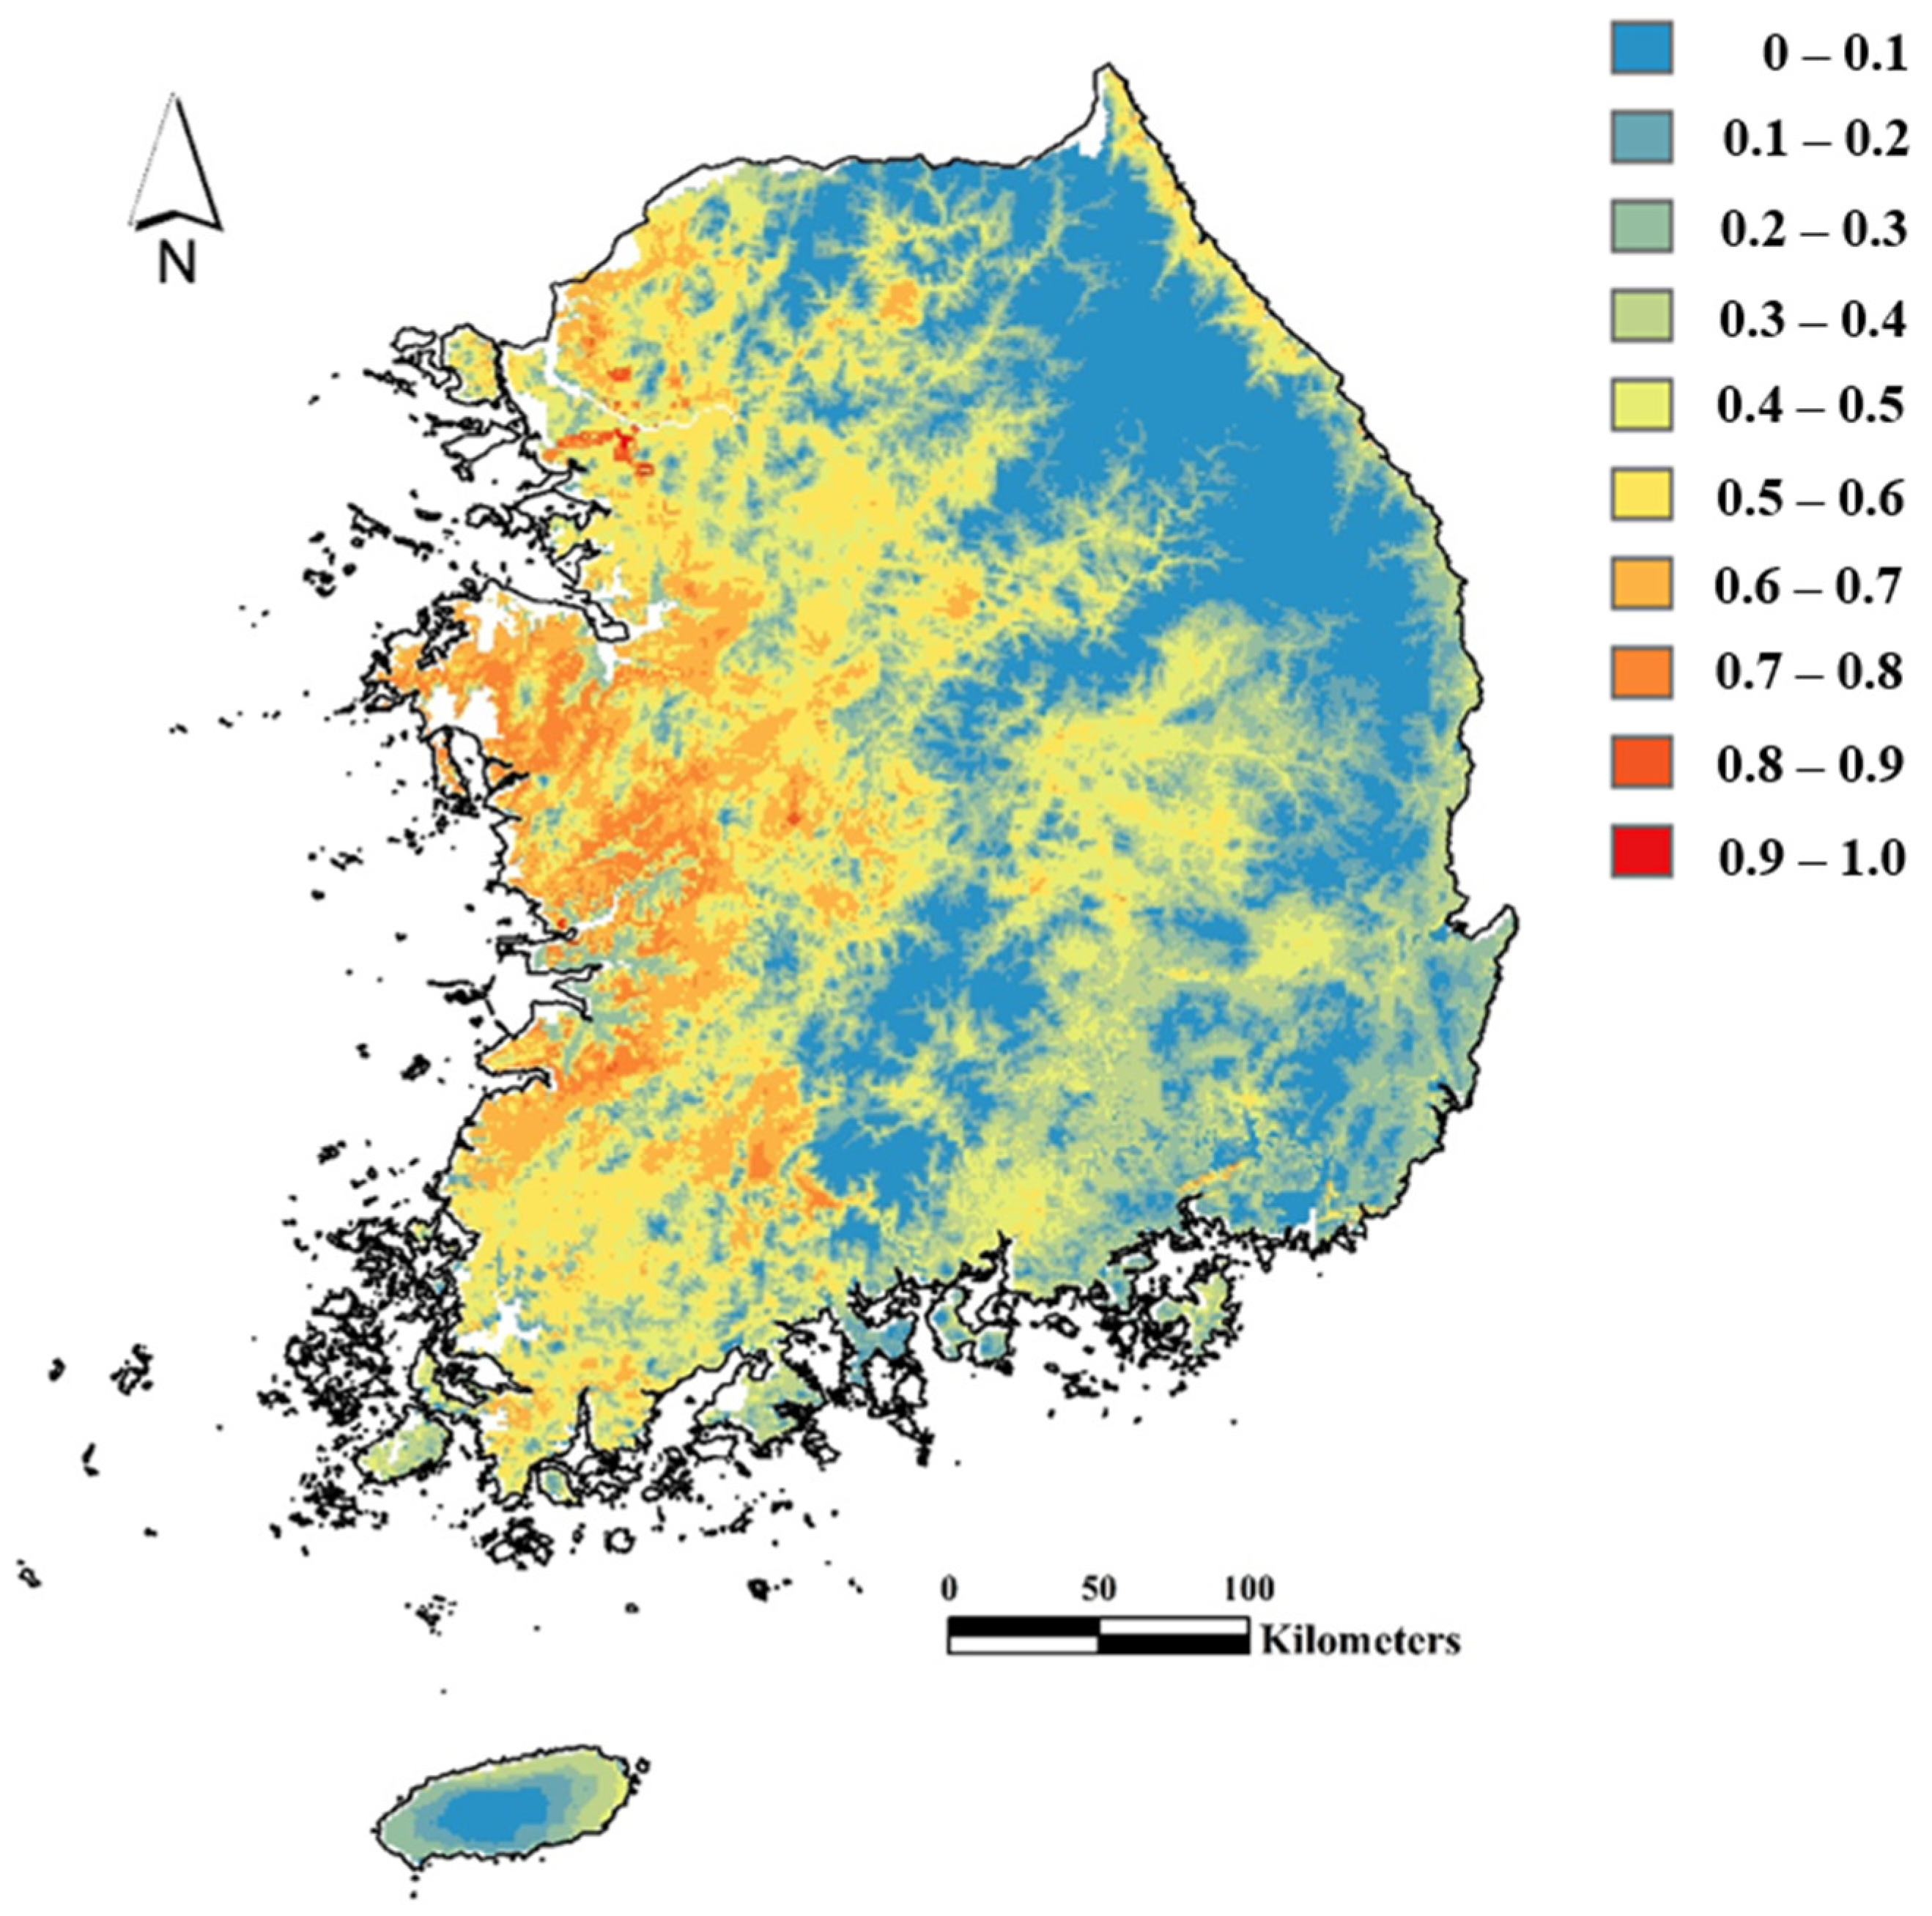
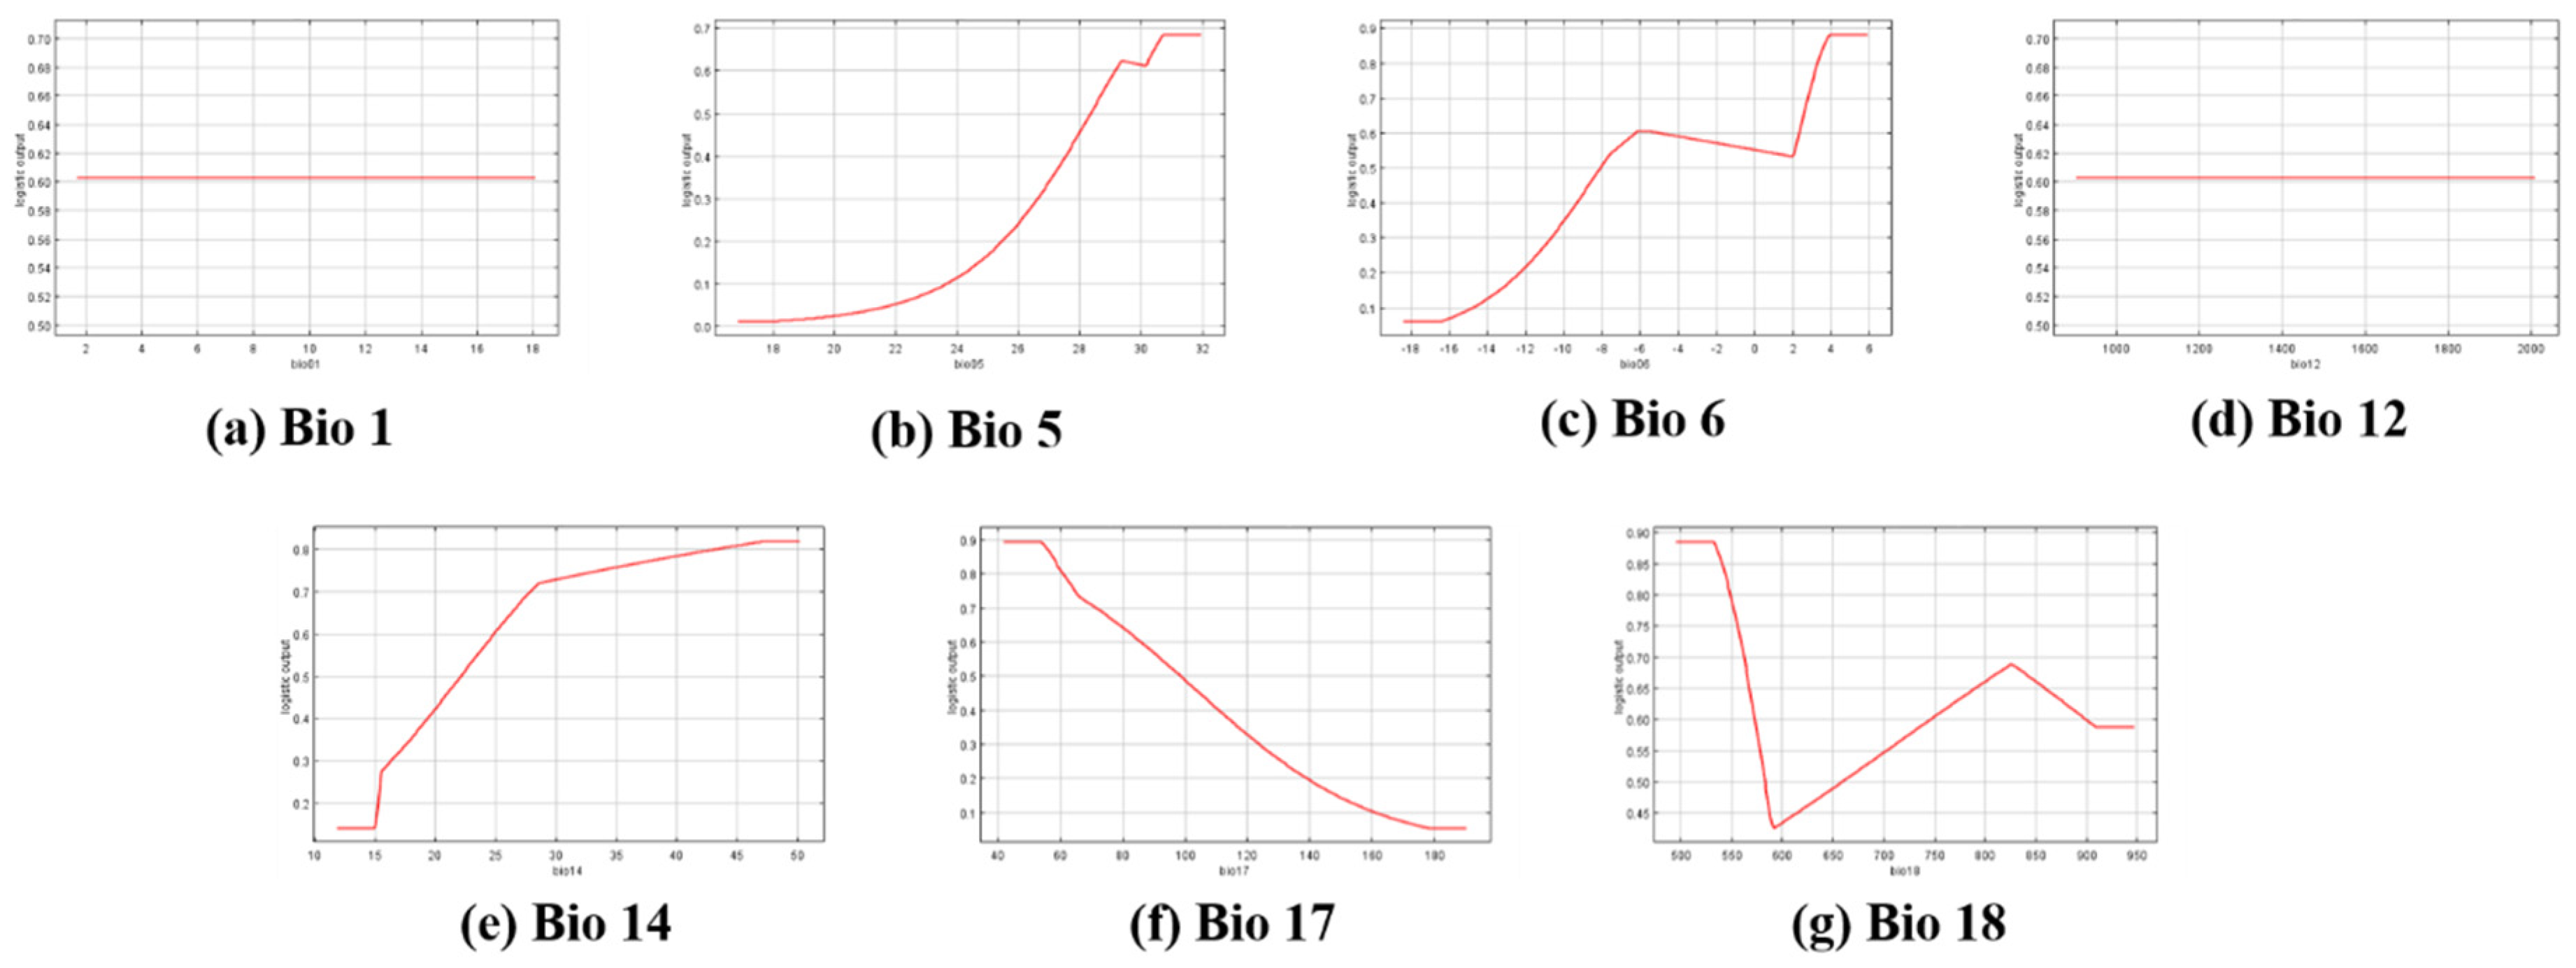
2.5. Prediction of Current Distribution for R. shantungensis with MaxEnt

Because MaxEnt requires data on presence [21], of the 295 data points, 175 data points on presence were used for prediction. The 132 data points from the new field survey were used as training data and the other (from the published paper) 43 data points were used as test data because the selected parameters should explain both the past (i.e., the test in this study) and the current data (i.e., training in this study) to avoid one of the criticisms of MaxEnt (i.e., that it is suitable for species of equilibrium status [9]). Thus, the test data in this study were not used to evaluate the model’s performance. Instead, they were used to select and exclude variables unrelated to the presence of R. shantungensis in Korea. In the average nearest neighbor test in ArcGIS 10.1, the training data showed a significantly (p < 0.01) clustered pattern, which could cause overfitting problems [22] against environmental variables. Thus, by reducing the spatial cluster of the data on the presence of R. shantungensis, spatial filtering [23] was executed by the expected mean distance (0.138124 decimal degrees) in the average nearest neighbor test (a hypothetical random distribution in the region of interest) using the ‘spatially rarefy occurrence data’ tool in the SDM toolbox of ArcGIS 10.1. Ultimately, 72 points among the 132 occurrence points were used as training data for MaxEnt modeling, and 43 points were used for test data.
To eliminate multi-collinear variables, which can lead to overfitting problems [24] or an ambiguous interpretation, a correlation test was executed in ArcGIS 10.1. If the correlation coefficient (r) was greater than 0.9 (r > 0.9, r < −0.9), only one variable was used for further analyses among pairs of correlated variables by considering the X values of spatial association tests among correlated variables (Table 1). Through these procedures, 13 variables (i.e., Bio1, Bio2, Bio3, Bio5, Bio6, Bio7, Bio12, Bio14, Bio17, Bio18, Footprint, Traffic volume, and Landcover) among the original 23 were preferentially selected. To avoid another criticism of MaxEnt (i.e., variable selection being irrelevant to the target species’ distribution due to MaxEnt’s processor) [8], spatially associated variables (i.e., Bio1, Bio5, Bio6, Bio12, Bio14, Bio17, Bio18, and Landcover) were used for MaxEnt modeling.
MaxEnt software version 3.4.1 [25] was initially executed with the default parameter settings (e.g., feature type, regularization multiplier, and 10,000 background points) using training data, test data, and eight pre-selected variables. In all executions of MaxEnt modeling, a jackknife test was conducted to measure variable importance and exclude unrelated variables. To reduce model complexity and eliminate unrelated variables, variables were excluded from the model under two conditions: First, the value of test gain was less than zero; and second, the gain value without one variable was higher than that in the case when all variables were used. These processes were repeated until there was no variable to be discarded. Through these stepwise procedures, seven variables (i.e., Bio1, Bio5, Bio6, Bio12, Bio14, Bio 17, and Bio18) were finally selected, and the estimated occurrence model for R. shantungensis was built.

2.6. Comparison between the Expected Occurrence by MaxEnt and the Actual Occurrence of R. shantungensis

In order to compare the absence of R. shantungensis between the observed and predicted values by the MaxEnt model, the predicted values of the MaxEnt model were extracted with 120 observed points (i.e., observed absence points in this study) in ArcGIS 10.1. The area under the curve (AUC) score of MaxEnt provides the predictive ability of the developed model. However, the actual absence points of R. shantungensis in Korea were aggregated in the western parts. They were not used in the MaxEnt modeling process. Thus, data on absence need to be evaluated to verify the prediction reliability of the MaxEnt model that is suggested in this study. If the extracted value was more than 0.5 at one point, R. shantungensis was considered to be present at that point. The prediction abilities of the MaxEnt model for observed occurrence were statistically compared to random probability (i.e., 50%) using a Chi-square test [26].

2.7. Prediction of Future Distributions of R. shantungensis in Korea

MaxEnt was also used to predict the future probability of R. shantungensis presence in Korea with the seven selected variables (i.e., Bio1, Bio5, Bio6, Bio12, Bio14, Bio 17, and Bio18) of the RCP 8.5 climate change scenario for the 2030s (2031–2040), the 2050s (2051–2060), the 2070s (2071–2080), and the 2090s (2091–2100).

3. Results

3.1. Habitat Suitability of R. shantungensis with CLIMEX

In all Korean territories, the CMI values were higher than 0.7, indicating that climatic conditions in all locations of Korea were similar to those of Zhejiang in China. However, the similarity of climatic conditions was lower in the eastern part of Korea than in the western part of Korea, where R. shantungensis mainly occurred (Figure 2).

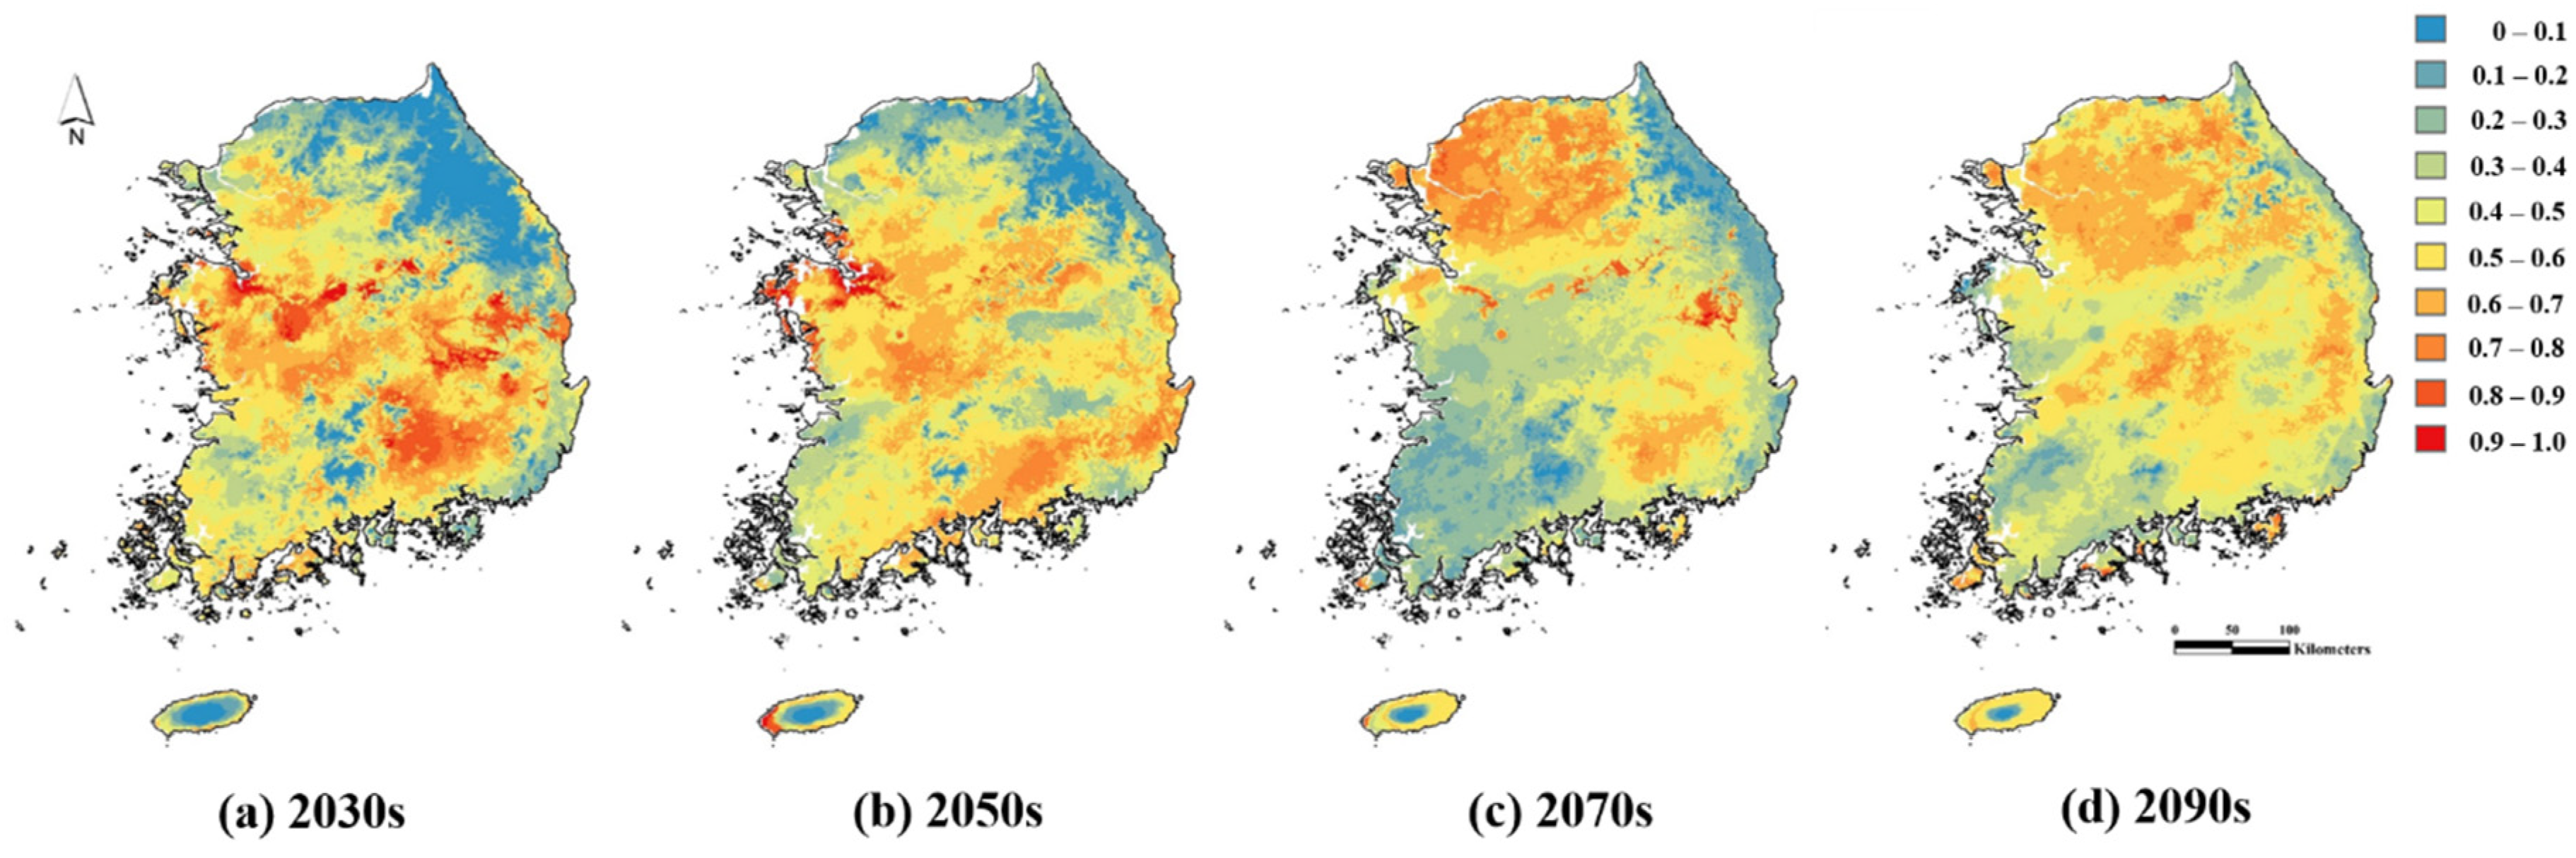
3.2. Prediction of Current and Future Distribution of R. shantungensis with MaxEnt

The AUC score of the training data in the MaxEnt model in this study was 0.78, which was larger than 0.75, indicating reliable predictive ability (Figure 3). The AUC score of the test data was 0.79, slightly higher than that of the training data. The contributions of Bio5, Bio1, Bio6, Bio14, Bio18, Bio 17, and Bio2 in this model were 41.2, 15.9, 15.7, 12.6, 7.1, 5.5, and 2.0%, respectively. According to the response curves for the variables related to the presence of R. shantungensis in Korea, each variable affected the possible presence of R. shantungensis in a different way (Figure 4): The maximum temperature of the warmest month (i.e., Bio5) showed a generally sigmoidal effect. The minimum temperature of the coldest month (i.e., Bio6) showed a sigmoidal effect until −6 °C, a negative effect between −6 °C and 2 °C, then an exponential effect after 2 °C. The precipitation of the warmest quarter (i.e., Bio18) showed two peaks around minimum and 825 mm. The precipitation of the driest month (i.e., Bio 14) showed endurance at a certain level of precipitation, and then an exponential effect. However, the precipitation of the driest quarter (i.e., Bio 17) showed a negative effect. Both the annual mean temperature (i.e., Bio1) and annual precipitation (i.e., Bio12) were favorable for the occurrence of R. shantungensis in Korea by maintaining an approximately 61% occurrence possibility.
The correctly predicted rate of MaxEnt in actually absent points was 86.7% by matching 102 points among 120, which was statistically (x2 = 64.5, p < 0.001) meaningful. Future presence probability maps of R. shantungensis in Korea were also developed with MaxEnt by using climatic data under the RCP 8.5 scenario for the 2030s, 2050s, 2070s, and 2090s (Figure 5). In the future distribution of R. shantungensis, Gyungsang-Do and Gangwon-Do were expected to have a high occurrence probability. Currently, R. shantungensis has been found at only a few points in Gyungsang-Do and Gangwon-Do in a survey of 2017. In the 2070s and 2090s, the occurrence probability of R. shantungensis is expected to be low in southwest Korea, where, to date, the occurrence of this pest has been severe.

4. Discussion

This study predicted the potential habitat suitability and current distribution probability of R. shantungensis in Korea using CLIMEX and MaxEnt. Both models, in general, well-described the observed distribution pattern of R. shantungensis in Korea. Accordingly, spatial analysis could be a useful tool for finding reliable variables to explain the distribution of a target species. Moreover, this study forecasted the future occurrence of R. shantungensis and found relevant environmental variables with the occurrence of R. shantungensis in Korea. These results could be helpful for preparing management strategies for R. shantungensis and national long-term agricultural plans in Korea.
The predicted current distribution of R. shantungensis in this study was generally similar to that of the previous study [4], but showed opposite results in a few areas (e.g., Kangwon-do parts overlapping with Kyunggi-do, eastern parts in Gyeongsang-do, and northern parts of Gyunggi-do) despite the fact that both studies used the same program (MaxEnt) and similar environmental variables. These areas were newly invaded areas by R. shantungensis within Korea after the study of Kim et al. [4]. These differences could potentially be caused by the correlative parameter selection process of MaxEnt [9]. The MaxEnt model for this spreading insect could have a high probability of selecting non-relevant variables due to the correlative modeling process in MaxEnt [8]. Kim et al. [4] did not speculate whether this pest distribution in Korea had reached equilibrium status. Kim et al. [4] also reported that precipitation and mean temperature of the warmest quarter, forest type, and landcover were the most important variables affecting R. shantungensis. Although these variables were able to predict R. shantungensis well at that time, they failed to accurately describe its distribution in 2017. Moreover, Kim et al. [4] did not explain why these variables were selected and how these variables affected the distribution of R. shantungensis. However, important variables in this study, i.e., maximum temperature of the warmest month, annual mean temperature, mean temperature of the coldest month, and precipitation in the driest month, could explain the data reported in Kim et al. [4] and the current data, indicating the strong relationship of these variables with the occurrence of R. shantungensis. Thus, results of this study would be more reliable for predicting the possible presence of R. shantungensis in Korea.
Correlative models, including MaxEnt, have the greatest advantage in that they can result in a higher matching rate between observed and predicted data than models using deterministic processors. However, correlative models have been subject to criticism [8,9,10]. This study attempted to minimize the disadvantages of MaxEnt. By using spatial analysis in variable selection processes, only variables that were relevant to R. shantungensis occurrence were used in the modeling process. Moreover, this study showed that the selected variables and their parameters could explain the occurrence of R. shantungensis in both the past and present by using two separate sets of data, although R. shantungensis is still spreading in Korea [1,2,3]. Multiple studies [27,28,29] have reported on the general characteristics of suitable variables related to the occurrence of a target species. Bradie and Leung [27] reviewed published results from MaxEnt and found that temperature and precipitation among environmental variables were generally related to target species’ occurrence. Petitpierre et al. [28] concluded that the variables having a direct impact on species physiology and fitness were related to species’ occurrence by reviewing MaxEnt studies. Braunisch et al. [29] suggested that variables related to target species occurrence should be selected in MaxEnt modeling, although they discussed methods to select variables in the case of an uncertain relationship between a species’ occurrence and its environments. The variables selected in this study also met the criteria of previous studies [27,28,29]. This study also showed a high accuracy of 86.7% at points where the data were not used in MaxEnt modeling. It is possible that the accuracy of the model’s prediction could be increased by data on absence [30] even though there is the potential for false absences [31]. However, the results of this study were able to predict the presence and absence of R. shantungensis well. Finally, the results from CLIMEX, one of the deterministic models, also showed that western parts of Korea were relatively more suitable for R. shantungensis than eastern parts, similar to the results from MaxEnt.
The results of this study indicated that seven environmental variables (i.e., Bio1, Bio5, Bio6, Bio12, Bio 14, Bio 17, and Bio18) were important for predicting the occurrence of R. shantungensis. It is reasonable to conclude that temperature-related variables (i.e., Bio1, Bio5, and Bio6) positively affect R. shantungensis occurrence because the metabolic rate with increasing temperature is normally increased up to its upper lethal temperature, and this is reflected in the developmental rate in insects due to their ectodermal characteristics [32]. It was proven that elevation, which is negatively correlated with Bio5, also negatively affected the occurrence of R. shantungensis [33]. Kim et al. [34] reported that high humidity was helpful for increasing the survival of R. shantungensis eggs during winter. Thus, Bio14 and 17 would be expected to have positive effects on R. shantungensis occurrence in Korea, while long-term rain during winter was predicted to negatively affect R. shantungensis occurrence in the MaxEnt modeling. Long-term and frequent rain during winter might cause overwintering eggs to die due to the ecological characteristics of R. shantungensis; eggs are laid between cracks of branches and covered with wools made by their mothers. Precipitation during summer (i.e., Bio18) showed two peaks at low precipitation (i.e., 500–530 mm) as well as at around 825 mm of precipitation. These two peaks could be caused more by the frequency of heavy rain in Korea during summer rather than absolute amounts of precipitation because heavy rain could affect the flight activities and survival of adults of R. shantungensis.
The results of this study indicated that the maximum temperature of the warmest month was the most important variable for predicting the occurrence of R. shantungensis, as it had a 41.2% contribution rate in the MaxEnt model. This month (i.e., August in Korea) matches the pre-ovipositional period of R. shantungensis in Korea. Female adults lay eggs inside cracks and cover their eggs with wool that they make [1]. Moreover, they should find a suitable habitat for the development of their progenies. These oviposition behaviors of R. shantungensis are expected to consume a large amount of energy. Thus, R. shantungensis adults may require significant feeding activity before oviposition and a high temperature would be helpful for their activities and ovary development. Their high energy requirement is also proven by their relatively long pre-oviposition period (i.e., over one month) considering their body sizes and temperature [1]. The annual mean temperature (15.9% in contribution rate) and precipitation (2% in contribution rate) were shown to constantly and positively contribute to R. shantungensis occurrence. This result is consistent with CLIMEX results showing that all areas in the Korean territory were a suitable habitat for R. shantungensis. Both mean temperature of the coldest month (15.7% in contribution rate) and precipitation of the driest month (12.6% in contribution rate) were related to overwintering of R. shantungensis. These variables were proven to be highly related to the occurrence of R. shantungensis in MaxEnt and SADIE as well as its ecology. Thus, prediction of R. shantungensis occurrence could be enabled in other non-invaded countries using these major variables that are related to its occurrence [21,28,35].
The occurrence of R. shantungensis as an invasive species was expected to be highly related to human-related variables (i.e., Traffic and Footprint in this study) because insect spread is generally correlated with human-related factors [36]. Moreover, there was a report that showed high contamination rates of R. shantungensis at rest areas of highways and roadsides [4]. However, this study showed that these human-related variables were not significantly (p < 0.05) related to the occurrence of R. shantungensis in Korea. This could be related to the high mortality of R. shantungensis eggs in cut trees [34]. Kang et al. [2] also reported that R. shantungensis was slowly spreading toward the middle parts of Gyungsang-Do, along the coastal areas of southern Korea, even though the direction of spread was toward Busan-Si with very high Traffic and Footprint values. In this study, one of the habitat-related variables, Landcover, was not selected by MaxEnt because the gain value was higher without than with this variable. This result could be related to the ecology of R. shantungensis, which has very broad host ranges [4]. In fact, this pest has broken out in various types of landcover, such as cities, orchards, agricultural fields, and forests. Thus, R. shantungensis would be expected to spread continuously, except for under conditions of transplanted trees contaminated with R. shantungensis.
Although a rapid spread is not to be expected, the spreading of R. shantungensis to Gyungsang-Do appeared to be inevitable because the habitat suitability of this region for R. shantungensis in CLIMEX was high (i.e., a CMI value > 0.7). The distribution probability of these areas in MaxEnt was the highest in Korea in the 2030s. Gyungsang-Do is economically and agriculturally important in Korea. It has large apple, persimmon, and chestnut export agricultural complexes. These plants are known to be good host plants for R. shantungensis. Thus, management of R. shantungensis is needed to minimize its economic impacts and slow its spread in Korea based on the current distribution, and the predicted distribution in the 2030s, of R. shantungensis.

5. Conclusions

An increasing number of invasive species are expected to continue to occur internationally due to increased trades, transportation, and human activities, as well as global warming [37]. Thus, the demand for species distribution models (SDMs) would be increased to determine current distribution, predict future distribution and habitat suitability, and identify associations between occurrence and the surrounding environment related to the occurrence of a target species. For more reliable SDMs, the selection of variables should be related to the characteristics of a target species. As an example, spatial association analysis was applied in this study. Parameters selected by spatial association analysis resulted in increased prediction accuracy and reliability for the occurrence of R. shantungensis in Korea. The results from CLIMEX and MaxEnt predicted that R. shantungensis currently has a higher occurrence probability in western areas than in eastern areas in Korea. However, it has great potential to spread eastward in the future. These results will be helpful for developing relevant management strategies and national long-term agricultural plans in Korea.

Author Contributions

Conceptualization, S.B. and J.-H.L.; methodology, S.B.; validation, S.B. and J.-H.L.; formal analysis, S.B. and M.-J.K.; investigation, S.B. and M.-J.K.; writing—original draft preparation, S.B.; writing—review and editing, S.B. and J.-H.L. All of the authors approved the final version.

Funding

This work was carried out with the support of “Research Program for Forest Science & Technology Development (Project No. FE0100-1988-01)” funded by National Institute of Forest Science, Republic of Korea. This work was partially supported by BK 21 plus.

Acknowledgments

We thank the officers from the Gyunggi and Chungnam Agricultural Research and Extension Service for surveying R. shantungensis occurrence.

Conflicts of Interest

The authors declare no conflicts of interest. The funders had no role in the design of the study; in the collection, analyses, or interpretation of data; in the writing of the manuscript, or in the decision to publish the results.

References

  1. Jo, S.J. Study on the control and ecology of Ricania shantungensis. J. Tree Health 2014, 19, 35–44. [Google Scholar]
  2. Kang, D.W.; Ha, J.B.; Lee, S.B.; Han, I.Y.; Kwon, J.H.; Choi, Y.J. Occurrence characteristics and distribution of Ricania shantungensis in Gyungsangnam-Do. In Proceedings of the 2016 Fall Meeting of Korean Society of Applied Entomology, Buyeo Lotte Resorts, Buyeo, Korea, 20–21 October 2016. [Google Scholar]
  3. Hong, S.J.; Lee, K.J.; Kim, S.T.; No, H.I.; Jung, J.Y. Current distribution and status of Ricania shantungensis in Korea. In Proceedings of the 2017 Fall Meeting of Korean Society of Applied Entomology, Wellihillipark Resort, Hoengseoung, Korea, 26–27 October 2017. [Google Scholar]
  4. Kim, D.E.; Lee, H.; Kim, M.J.; Lee, D.-H. Predicting the potential habitat, host plants, and geographical distribution of Pochazia shantungensis (Hemiptera: Ricaniidae) in Korea. Kor. J. Appl. Entomol. 2015, 54, 179–189. [Google Scholar] [CrossRef]
  5. Phillips, S.J.; Anderson, R.P.; Schapire, R.E. Maximum entropy modeling of species geographic distributions. Ecol. Modell. 2006, 190, 231–259. [Google Scholar] [CrossRef] [Green Version]
  6. Pearson, R.G. Species’ Distribution Modeling for Conservation Educators and Practitioners. Synthesis. American Museum of Natural History. Available online: http://ncep.amnh.org (accessed on 17 September 2018).
  7. Elith, J.; Phillips, S.J.; Hastie, T.; Dudik, M.; Chee, Y.E.; Yates, C.J. A statistical explanation of MaxEnt for ecologists. Divers. Distrib. 2011, 17, 43–57. [Google Scholar] [CrossRef]
  8. Zeng, Y.; Low, B.W.; Yeo, D.C.J. Novel methods to select environmental variables in MaxEnt: A case study using invasive crayfish. Ecol. Model. 2016, 341, 5–13. [Google Scholar] [CrossRef]
  9. Elith, J.; Leathwick, J.R. Species distribution models: Ecological explanation and prediction across space and time. Ann. Rev. Ecol. Evol. Syst. 2009, 40, 677–697. [Google Scholar] [CrossRef]
  10. Pearson, R.G.; Raxworthy, C.J.; Nakamura, M.; Peterson, A.T. Predicting species distributions from small numbers of occurrence records: a test case using cryptic geckos in Madagascar. J. Biogeo. 2007, 34, 102–117. [Google Scholar] [CrossRef]
  11. Jung, J.-M.; Lee, W.-H.; Jung, S. Insect distribution in response to climate change based on a model: Review of function and use of CLIMEX. Entomol. Res. 2016, 46, 223–235. [Google Scholar] [CrossRef]
  12. Seo, C.-W.; Park, Y.-R.; Choi, Y.-S. Comparison of species distribution models according to location data. J. Korean Soc. Geospat. Inform. Syst. 2008, 16, 59–64. [Google Scholar]
  13. Sutherst, R.W.; Maywald, G.F.; Kriticos, D.J. CLIMEX Version 3 User’s Guide; Hearne Scientific Software Pty Ltd.: Melbourne, Australia, 2007. [Google Scholar]
  14. Kwon, D.H.; Kim, S.-J.; Kang, T.-J.; Lee, J.H.; Kim, D.H. Analysis of the molecular phylogenetics and genetic structure of an invasive alien species, Ricania shantungensis, in Korea. J. Asia Pac. Entomol. 2017, 20, 901–906. [Google Scholar] [CrossRef]
  15. Chou, I.; Lu, J.S.; Huang, J.; Wang, S. Economic Insect Fauna of China, Fasc. 36; Homoptera Fulgoroidae. Science Press: Beijing, China, 1985. [Google Scholar]
  16. Hijmans, R.J.; Guarion, L.; Mathur, P. DIVA-GIS. Free GIS for Biodiversity Research, Version 7.5. Available online: http://www.diva-gis.org/ (accessed on 13 September 2018).
  17. Baek, S. Spatial and Temporal Distribution of Hemlock Woolly Adelgid (Hemiptera: Adelgidae) ovisacs And Its Associations with the Environment. Master Thesis, West Virginia University, Morgantown, WV, USA, 2015. [Google Scholar]
  18. Perry, J.N. Spatial analysis by distance indices. J. Anim. Ecol. 1995, 64, 303–314. [Google Scholar] [CrossRef]
  19. Perry, J.N.; Dixon, P. A new method for measuring spatial association in ecological count data. Ecoscience 2002, 9, 133–141. [Google Scholar] [CrossRef]
  20. Park, Y.-L.; Perring, T.M.; Farrar, C.A.; Gispert, C. Spatial and temporal distributions of two sympatric Homalodisca spp. (Hemiptera: Cicadellidae): Implications for areawide pest management. Agric. Ecosyst. Environ. 2006, 113, 168–174. [Google Scholar] [CrossRef]
  21. Phillips, S.J.; Dudík, M. Modeling of species distributions with Maxent: New extensions and a comprehensive evaluation. Ecography 2008, 31, 161–175. [Google Scholar] [CrossRef]
  22. Kramer-Schadt, S.; Niedballa, J.; Pilgrim, J.D.; Schröder, B.; Lindenborn, J.; Reinfelder, V.; Stillfried, M.; Heckmann, I.; Scharf, A.K.; Augeri, D.M.; et al. The importance of correcting for sampling bias in MaxEnt species distribution models. Divers. Distrib. 2013, 36, 1366–1379. [Google Scholar] [CrossRef]
  23. Boria, R.A.; Olson, L.E.; Goodman, S.M.; Anderson, R.P. Spatial filtering to reduce sampling bias can improve the performance of ecological niche models. Ecol. Model. 2014, 275, 73–77. [Google Scholar] [CrossRef]
  24. Dormann, C.F.; Elith, J.; Bacher, S.; Buchman, C.; Carl, G.; Carré, G.; García Marquéz, J.R.; Gruber, B.; Lafourcade, B.; Leitão, P.J.; et al. Collinearity: A review of methods to deal with it and a simulation study evaluating their performance. Ecography 2013, 36, 27–46. [Google Scholar] [CrossRef]
  25. Phillips, S.J.; Dudík, M.; Schapire, R.E. Maxent Software for Modeling Species Niches and Distributions (Version 3.4.1). Available online: http://biodiversityinformatics.amnh.org/open_source/maxent/ (accessed on 13 September 2018).
  26. SAS Institute. SAS/STAT User’s Guide, Version 9.3; SAS Institute: Cary, NC, USA, 2011. [Google Scholar]
  27. Bradie, J.; Leung, B. A quantitative synthesis of the importance of variables used in MaxEnt species distribution models. K. Biogeogr. 2017, 44, 1344–1361. [Google Scholar] [CrossRef]
  28. Petitpierre, B.; Broennimann, O.; Kueffer, C.; Daehler, C.; Guisan, A. Selecting predictors to maximize transferability of species distribution models: Lessons from cross-continental plant invasions. Global Ecol. Biogeogr. 2017, 26, 275–287. [Google Scholar] [CrossRef]
  29. Braunisch, V.; Coppers, J.; Arlettaz, R.; Suchant, R.; Schmid, H.; Bollmann, K. Selecting from correlated climate variables: A major source of uncertainty for predicting species distributions under climate change. Ecography 2013, 36, 971–983. [Google Scholar] [CrossRef]
  30. Brotons, L.; Thuiller, W.; Araujo, M.B.; Hirzel, A.H. Presence-absence versus presence-only modeling methods for predicting bird habitat suitability. Ecography 2004, 27, 437–448. [Google Scholar] [CrossRef]
  31. Hirzel, A.; Guisan, A. Which is the optimal sampling strategy for habitat suitability modeling. Ecol. Model. 2002, 157, 331–341. [Google Scholar] [CrossRef]
  32. Chapman, R.F. The Insects Structure and Function, 3rd ed.; Harvard University Press: Cambridge, MA, USA, 1982. [Google Scholar]
  33. Choi, Y.S.; Seo, H.Y.; Jo, S.H.; Hwang, I.S.; Yee, Y.S.; Park, D.G. Host preference of Ricania spp. (Hemiptera: Ricaniidae) at different developmental stages. Kor. J. Appl. Entomol. 2017, 56, 319–329. [Google Scholar]
  34. Kim, D.H.; Yang, C.R.; Kim, H.H.; Seo, M.H.; Yun, J.B. Effect of moisture content of pruned blueberry and peach twigs on hatchability of Ricania shantungensis (Hemiptera: Ricaniidae) eggs. Kor. J. Appl. Entomol. 2017, 56, 357–363. [Google Scholar]
  35. Duque-Lazo, J.; van Gils, H.; Groen, T.A.; Navarro-Cerrilo, R.M. Transferability of species distribution models: The case of phytophthora cinnamomi in Southwest Spain and Southwest Australia. Ecol. Model. 2016, 320, 62–70. [Google Scholar] [CrossRef]
  36. Lockwood, J.L.; Hoopes, M.A.; Marchetti, M.P. Invasion Ecology; Blackwell Publishing: Malden, MA, USA, 2007. [Google Scholar]
  37. Liebhold, A.M.; Tobin, P.C. Population ecology of insect invasions and their management. Annu. Rev. Entomol. 2008, 53, 387–408. [Google Scholar] [CrossRef] [PubMed]
Figure 1. Imaginary grids (30 km × 30 km) and observed points for the presence of Ricania shantungensis in Korea (, Presence; , Absence).
Forests 10 00490 g001
Figure 2. The climate similarity (i.e., the climate matching index (CMI) in CLIMEX) map in Korea compared to one of the most favorable climatic conditions for R. shantungensis populations: Zhejiang province in China. CMI > 0.5 indicates a suitable habitat for R. shantungensis.
Forests 10 00490 g002
Figure 3. Presence probability maps of R. shantungensis in Korea using the Maximum Entropy Model (MaxEnt).
Forests 10 00490 g003
Figure 4. The response curves for each variable related to the presence of R. shantungensis in Korea: (a) Bio 1; (b) Bio 5; (c) Bio 6; (d) Bio 12; (e) Bio 14; (f) Bio 17; (g) Bio 18.
Forests 10 00490 g004
Figure 5. Future presence probability maps of R. shantungensis in Korea using MaxEnt: (a) 2030s; (b) 2050s; (c) 2070s; (d) 2090s.
Forests 10 00490 g005
Table 1. A list of the 23 variables, including 19 bioclimatic variables, used in the prediction of the current distribution of R. shantungensis.
VariablesUnitRange
Bio1 = Annual mean temperature°C2.6–16.9
Bio2 = Mean diurnal range (Mean of monthly (max temp.–min temp.))°C5.0–12.9
Bio3 = Isothermality (Bio2/Bio7 × 100)-19.6–32.9
Bio4 = Temperature seasonality (standard deviation × 100)-707.6–1072.1
Bio5 = Max temperature of warmest month°C17.7–30.7
Bio6 = Min temperature of coldest month°C−18.8–4.1
Bio7 = Temperature annual range (Bio5–Bio6)°C25.2–40.4
Bio8 = Mean temperature of wettest quarter°C13.0–25.4
Bio9 = Mean temperature of driest quarter°C−11.2–10.5
Bio10 = Mean temperature of warmest quarter°C13.0–25.9
Bio11 = Mean temperature of coldest quarter°C−11.2–8.3
Bio12 = Annual precipitation°C995–1918
Bio13 = Precipitation of wettest monthmm208–403
Bio14 = Precipitation of driest monthmm15–47
Bio15 = Precipitation seasonality (coefficient of variation)-59.5–108.0
Bio16 = Precipitation of wettest quartermm557–1023
Bio17 = Precipitation of driest quartermm54–178
Bio18 = Precipitation of warmest quartermm530–910
Bio19 = Precipitation of coldest quartermm54–182
Elevationm−3–1819
Traffic volumeea834–176,191
Footprint-12–100
Landcover--
Table 2. Spatial association between the 22 environmental variables and the possible presence of R. shantungensis in Korea.
Environmental VariablesX1PEnvironmental VariablesXP
Bio 10.24660.0006Bio 120.30110.0011
Bio 2−0.09840.8373Bio 130.21420.0207
Bio 3−0.16920.9442Bio 140.4088<0.0001
Bio 40.04130.3443Bio 15−0.0160.5625
Bio 50.3881<0.0001Bio 160.26880.0035
Bio 60.24910.0046Bio 170.29370.0027
Bio 70.04980.3169Bio 180.3835<0.0001
Bio 80.3461<0.0001Bio 190.27150.0052
Bio 90.12350.1078Elevation−0.26110.9956
Bio 100.3812<0.0001Traffic0.03040.3830
Bio 110.22930.0151Footprint0.08330.2153
1 Index of association (X) with its associated probability (P). For a two-tailed test at the 95% confidence level, P < 0.025 indicates a significant positive association and P > 0.975 indicates a significant negative association.

