Article

What Drives Intensification of Land Use at Agricultural Frontiers in the Brazilian Amazon? Evidence from a Decision Game

1
Earth System Science Centre (CCST), National Institute for Space Research (INPE), São José dos Campos 12227-010, Brazil
2
Scion—New Zealand Forest Research Institute, Rotorua 3046, New Zealand
3
Institute for Food and Resource Economics, Center for Development Research, University of Bonn, 53113 Bonn, Germany
*
Author to whom correspondence should be addressed.
Forests 2019, 10(6), 464; https://doi.org/10.3390/f10060464
Submission received: 10 April 2019 / Revised: 3 May 2019 / Accepted: 8 May 2019 / Published: 29 May 2019
(This article belongs to the Section Forest Economics, Policy, and Social Science)

Abstract

:
Land-use change results from the decisions of diverse actors in response to economic and political contexts. Identification of underlying decision-making processes is key to understanding land-use patterns, anticipating trends, and designing effective environmental governance mechanisms. Here, we use a scenario-based decision game to examine hypothetical land-use decisions among four groups of rural producers in the municipalities of Sinop, Guarantã do Norte and Novo Progresso in the Brazilian Amazon. We simulate changes in agricultural prices, production cost, and frequency of environmental monitoring (in situ inspections) to understand how land-use decisions are made and change with shifts in economic and governance incentives. Hypothetical land-use decisions vary across scenarios, but not across study sites; environmental law enforcement influence land decisions, but not to the extent of dominating market factors and not for all types of producers. Decision games cannot substitute approaches to explain behavioral responses from observational data. However, they can provide immediate feedback on behavioral hypotheses before comprehensive observational data becomes available and support the development of models for land-use policy planning at local and regional scales.

1. Introduction

Population growth and changes in consumption patterns increase the demand for food and non-food biomass worldwide [1,2], exerting pressure on tropical forests [3,4]. Reverting historical trends of deforestation requires innovative political and technological strategies that reconcile sustainable development and conservation in the tropics. Such strategies are, however, often designed based on a limited understanding of how deforestation agents respond to policy and incentives under dynamic market conditions [5,6]. This study adopts an experimental approach to elucidate under what combination of market and policy incentives heterogeneous groups of local actors will adopt alternative land-use options. Our study area is composed of municipalities along the BR-163 highway that cut through one of Brazil’s most dynamic agricultural frontiers in the Cerrado and Amazon biomes.
A range of interdisciplinary and methodological perspectives have been adopted to study land-use decision-making processes in the Amazon region. Walker et al. [7], for example, stressed the role of farm size in explaining patterns of land-use change based on relationships between the availability of land for expansion, capital, and labor endowments. Walker and Homma [8] and Perz and Walker [9] emphasized aspects related to family structure and life cycles as fundamental factors to understand economic strategies and activities of farm-households. Vosti and Witcover [10] highlighted the importance of time horizons in land-use decisions, whereas Brondízio et al. [11] discussed the complexity of land-use dynamics focused on the diversity of actors and the importance of spatial and temporal scales. In general, these studies suggest that land-use determinants vary substantially by location biophysical factors, economic activity, and socio-historical contexts.
The BR-163 highway was built in the 1970s as part of a series of government-sponsored programs to promote occupation of the Brazilian midwestern and northern regions [12]. Since then, plans to complete the paving of the BR-163 have been politically controversial due to the associated risks of accelerating deforestation, forest degradation, land speculation, and tenure conflicts in the region [13,14]. The highway accompanies the transition between the Cerrado (south) and Amazon (north) biomes and is surrounded by protected areas with high conservation values in much of the northern state of Pará [15]. At the same time, the highway is one of the most important exportation routes of agricultural commodities throughout the Brazilian Amazon, in particular for soybean production [16].
Soy is the main agricultural commodity in Brazil and occupies 46% of the country’s cropland [17,18]. More than half of the observed soy expansion in Brazil during the early 2000s took place in the state of Mato Grosso, the largest producer and home to 30% of the country’s total cropland area [17]. Morton et al. [19] reported that 17% of the deforestation in Mato Grosso during the 2000–2004 period was associated with the establishment of new soy plantations. The same authors reported that after 2006 soy-driven deforestation decreased and became more fragmented and concentrated around agricultural centers along the BR-163. A similar pattern was reported by Gollnow and Lakes [20], who described a rapid expansion of soy over forests from 2001 to 2004, but observed that soy began to expand more on other, and previously established, agricultural lands thereafter. These changes in the deforestation patterns due to soy expansion, particularly in the state of Mato Grosso, were reportedly an effect of public policy and the so-called Soy Moratorium (SoyM) [21,22].
The SoyM was initiated in 2006 by the Brazilian Associations of Vegetable Oils Industries (ABIOVE) and Cereal Exporters (ANEC) in response to political and societal pressures. The organizations committed to not purchasing soybeans from deforested areas after July 2006 (a cutoff later extended to 2008) [23]. Although the recent (post-2006) expansion of soy area occurred predominantly on pastures [21,24], the SoyM may have been a driver of indirect land-use change processes in the region, displacing grazing activities further into the forest [25,26]. Furthermore, while the conversion of forests to soy decreased substantially in the Amazon after the SoyM, soy continued to expand into the Cerrado, a biome not contemplated in the supply-chain commitment [22,27]. The contribution of the SoyM to the deforestation slowdown has been questioned, because traceability limitations allowed perpetrators to commercialize their production through alternative means [27,28]. Similar zero-deforestation agreements targeting beef producers and meatpacking companies (so-called Terms of Adjustment of Conduct—TAC) were also adopted in Brazil, but early evidence suggests that TACs have so far been ineffective at reducing forest loss in the region [29].
Meanwhile, government efforts to monitor, punish, and restrict access to public credit and commodity markets have also been associated with declines in deforestation rates in Brazil and represent key components of the national Action Plan for Prevention and Control of Deforestation in the Legal Amazon (PPCDAm) launched in 2004 [23,30,31,32]. The plan was based on three pillars: Land planning, monitoring and control, and promotion of sustainable land-use activities. Among the most relevant activities promoted by PPDCAm was the launch of DETER (Real-time Deforestation Detection System), a satellite-based, “real-time” deforestation monitoring system, the 2005 ecological-economic zoning of BR-163, along with its sustainable management plan, and the establishment of the first Sustainable Forest Districts of Brazil, for the promotion of sustainable development initiatives [33,34]. The Reform of the Brazilian Forest Code in 2012 allegedly had counterproductive impacts on land-use change dynamics in the region [35] as it reduced the mandatory conservation reserve quota on private properties (i.e., Legal Reserves and Permanent Protected Areas). The new Code also granted amnesty to areas illegally deforested prior to July 2008.
Despite the overall success of Brazil’s strategy to reduce Amazon deforestation, forest loss began to rise again after 2012, particularly in municipalities located along the BR-163 [36,37]. A number of studies suggested knowledge gaps in our understanding of how conservation policy incentives affect land-use decisions over time and under changing economic conditions [38,39,40,41]. Our experimental approach to shed light on this topic is inspired by decision theory [42,43]. We obtained land-use change information from key local stakeholders with decision games (DGs). DGs are widely adopted in behavioral research [44,45,46,47], because multiple behavioral responses of the same individual to hypothetical scenarios can be observed in one experimental setup [48]. In the context of land use decisions, which are usually made once a year, this experimental approach can thus potentially help to anticipate results from long-term observational studies.

2. Materials and Methods
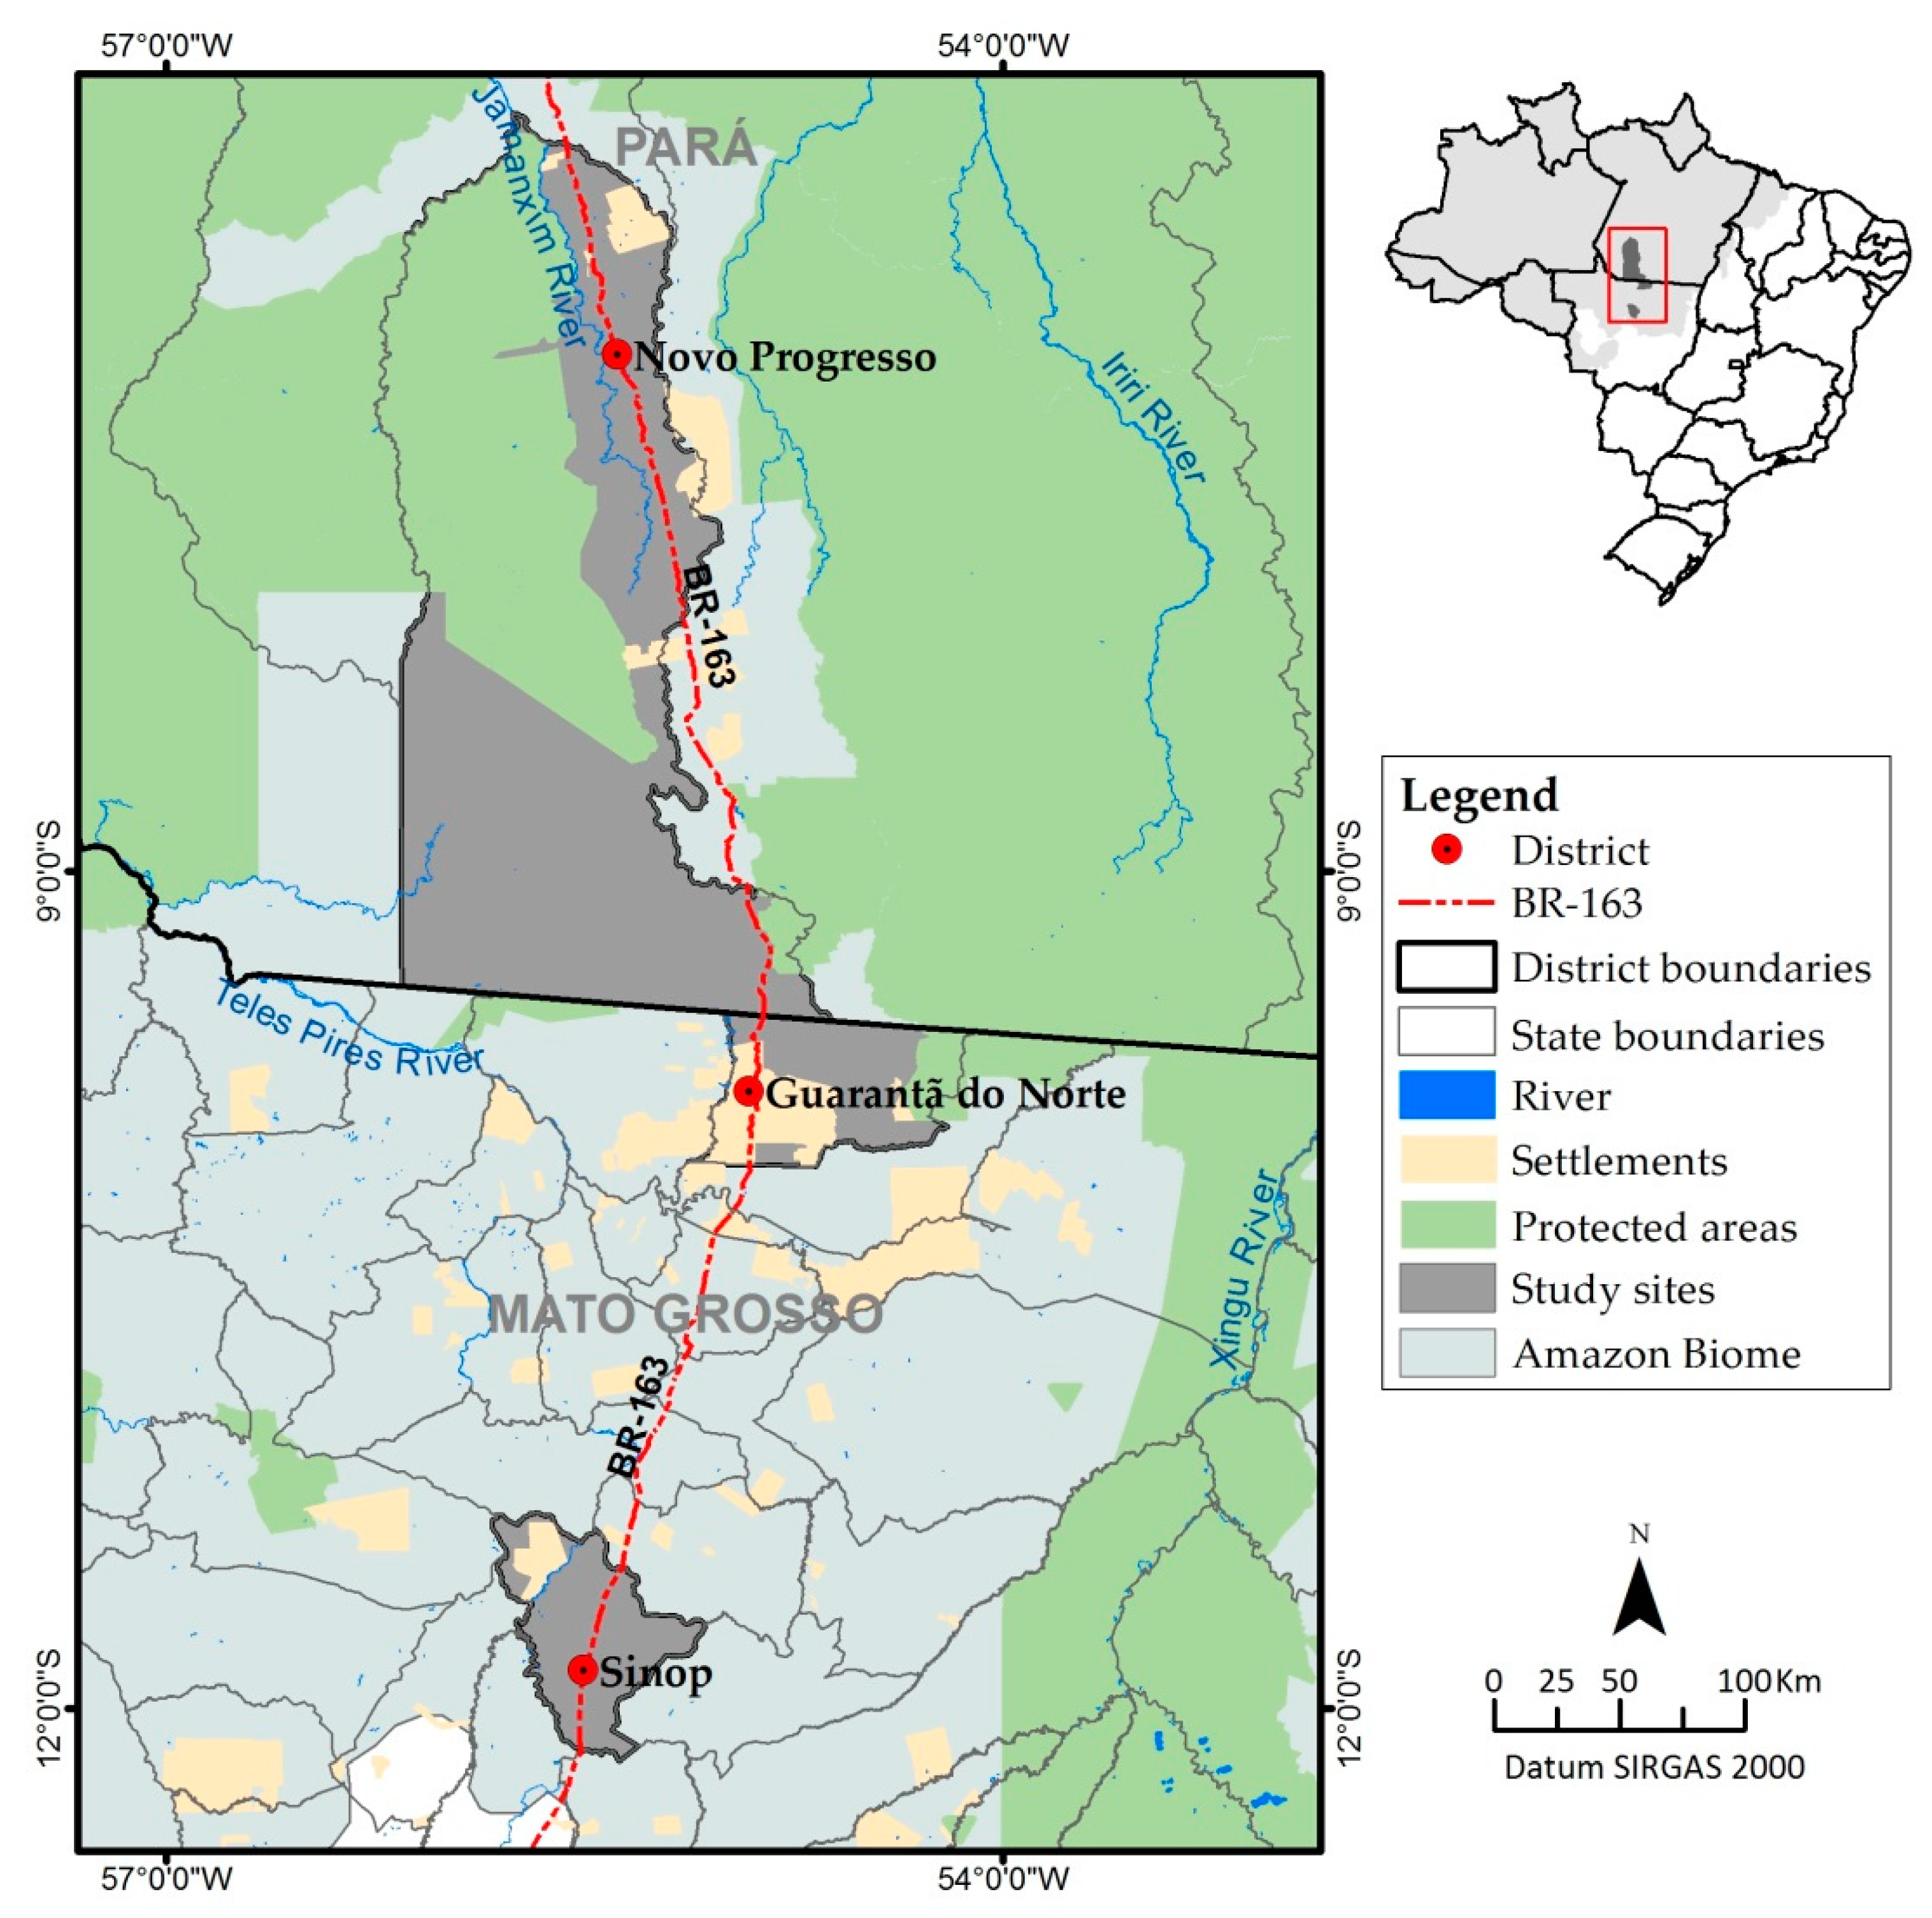
2.1. Study Site

Our study sites were in the Amazonian municipalities of Sinop and Guarantã do Norte, in the state of Mato Grosso, and Novo Progresso, in the state of Pará (Figure 1). These municipalities were selected due to their proximity to the BR-163 highway and their key role in developing the regional agricultural sector.
The history of the selected municipalities has been shaped by governmental colonization programs that invested in agricultural settlements and road infrastructure during the 1970s and 1980s [12]. Sinop evolved from a private colonization project into a municipality destined to capitalized and experienced commercial farmers [49]. Guarantã do Norte developed from public colonization projects designed to accommodate people who were displaced by the construction of hydroelectric dams in southern Brazil. Currently, 40% of the municipality’s territory is occupied by small landholdings (28,278 ha; 60% of all lots in the municipality) [49]. Novo Progresso emerged in a similar context, but in a more spontaneous process associated with the BR-163 highway construction [50].
Diverse economic activities have characterized these municipalities, including timber logging (Sinop used to be the most important timber-producing region in the Amazon) and gold mining (an activity of high importance in Guarantã do Norte and Novo Progresso during the 80s) [16]. However, with new regulations introduced in the 1990s, much of these activities were replaced by cattle ranching and soybean production. Today, Sinop is one of the most important agribusiness centers in Northern of Mato Grosso. Over 40% of the state territory is currently occupied by soy plantations (>140,000 ha) and 30% remains under forest cover. Guarantã do Norte boasts a diversified agricultural sector, with dairy farming as the main economic activity. Since 2002, the municipality has experienced some expansion of soy plantations. Yet, only 4% is occupied by annual crops (18,302 ha), with more than half of this being soy (9692 ha). Pastures remain the predominant land use in Guarantã do Norte, occupying 37% of the territory, followed by forest cover (32.5%) [17]. The economy of Novo Progresso is dominated by the cattle sector and the municipality is among the Amazonian municipalities with the largest deforestation rates [51]. In 2006, government programs to curb deforestation and mitigate the expected environmental impacts from paving the BR-163 highway resulted in the creation of new protected areas in the region. Protected areas in Novo Progresso have increased from 37% to 73% of total territory and have resulted in significant conflicts over land claims [13]. More recently, the municipality experienced increases in soy plantations. In the 2015–2016 period alone, the soy area in Novo Progresso grew from 2000 to 16,000 ha and the municipality became the sixth largest soy producer in the state of Pará [17].

2.2. Questionnaire and Decision Game

A decision game was set up to study the impact of changes in market environmental policy-related factors more formally. Decision games were first used in the military field to analyze tactics and discuss strategies. Later DGs were adopted in several research fields with diverse applications, especially in business [51], operational decisions [52,53], and logistics [54,55]. In general, DGs involve the use of scenarios for players to make decisions. In our application, the scenario design drew on Law Enforcement Theory [56,57], which asserts that an offence is the rational outcome of balancing expected benefits against the (often uncertain) level of punishment.
With the questionnaire, we collected basic farm-household data and background information with the application of questionnaires oriented to inform the decision game (see in Supplementary Materials). The questionnaires were applied in two rounds, before and after the games. During the first round, farmers answered questions about their (1) history and family structure, (2) past, present, and intended future land-use activities, (3) strategies for adoption of new technologies and land-use practices, and (4) challenges or difficulties in executing the activity. In the second round, questions focused on the reasons driving their decisions during the game and included (5) other factors (not covered in the game) that could also influence real-life decisions and (6) perceptions of environmental regulations and law enforcement mechanisms.

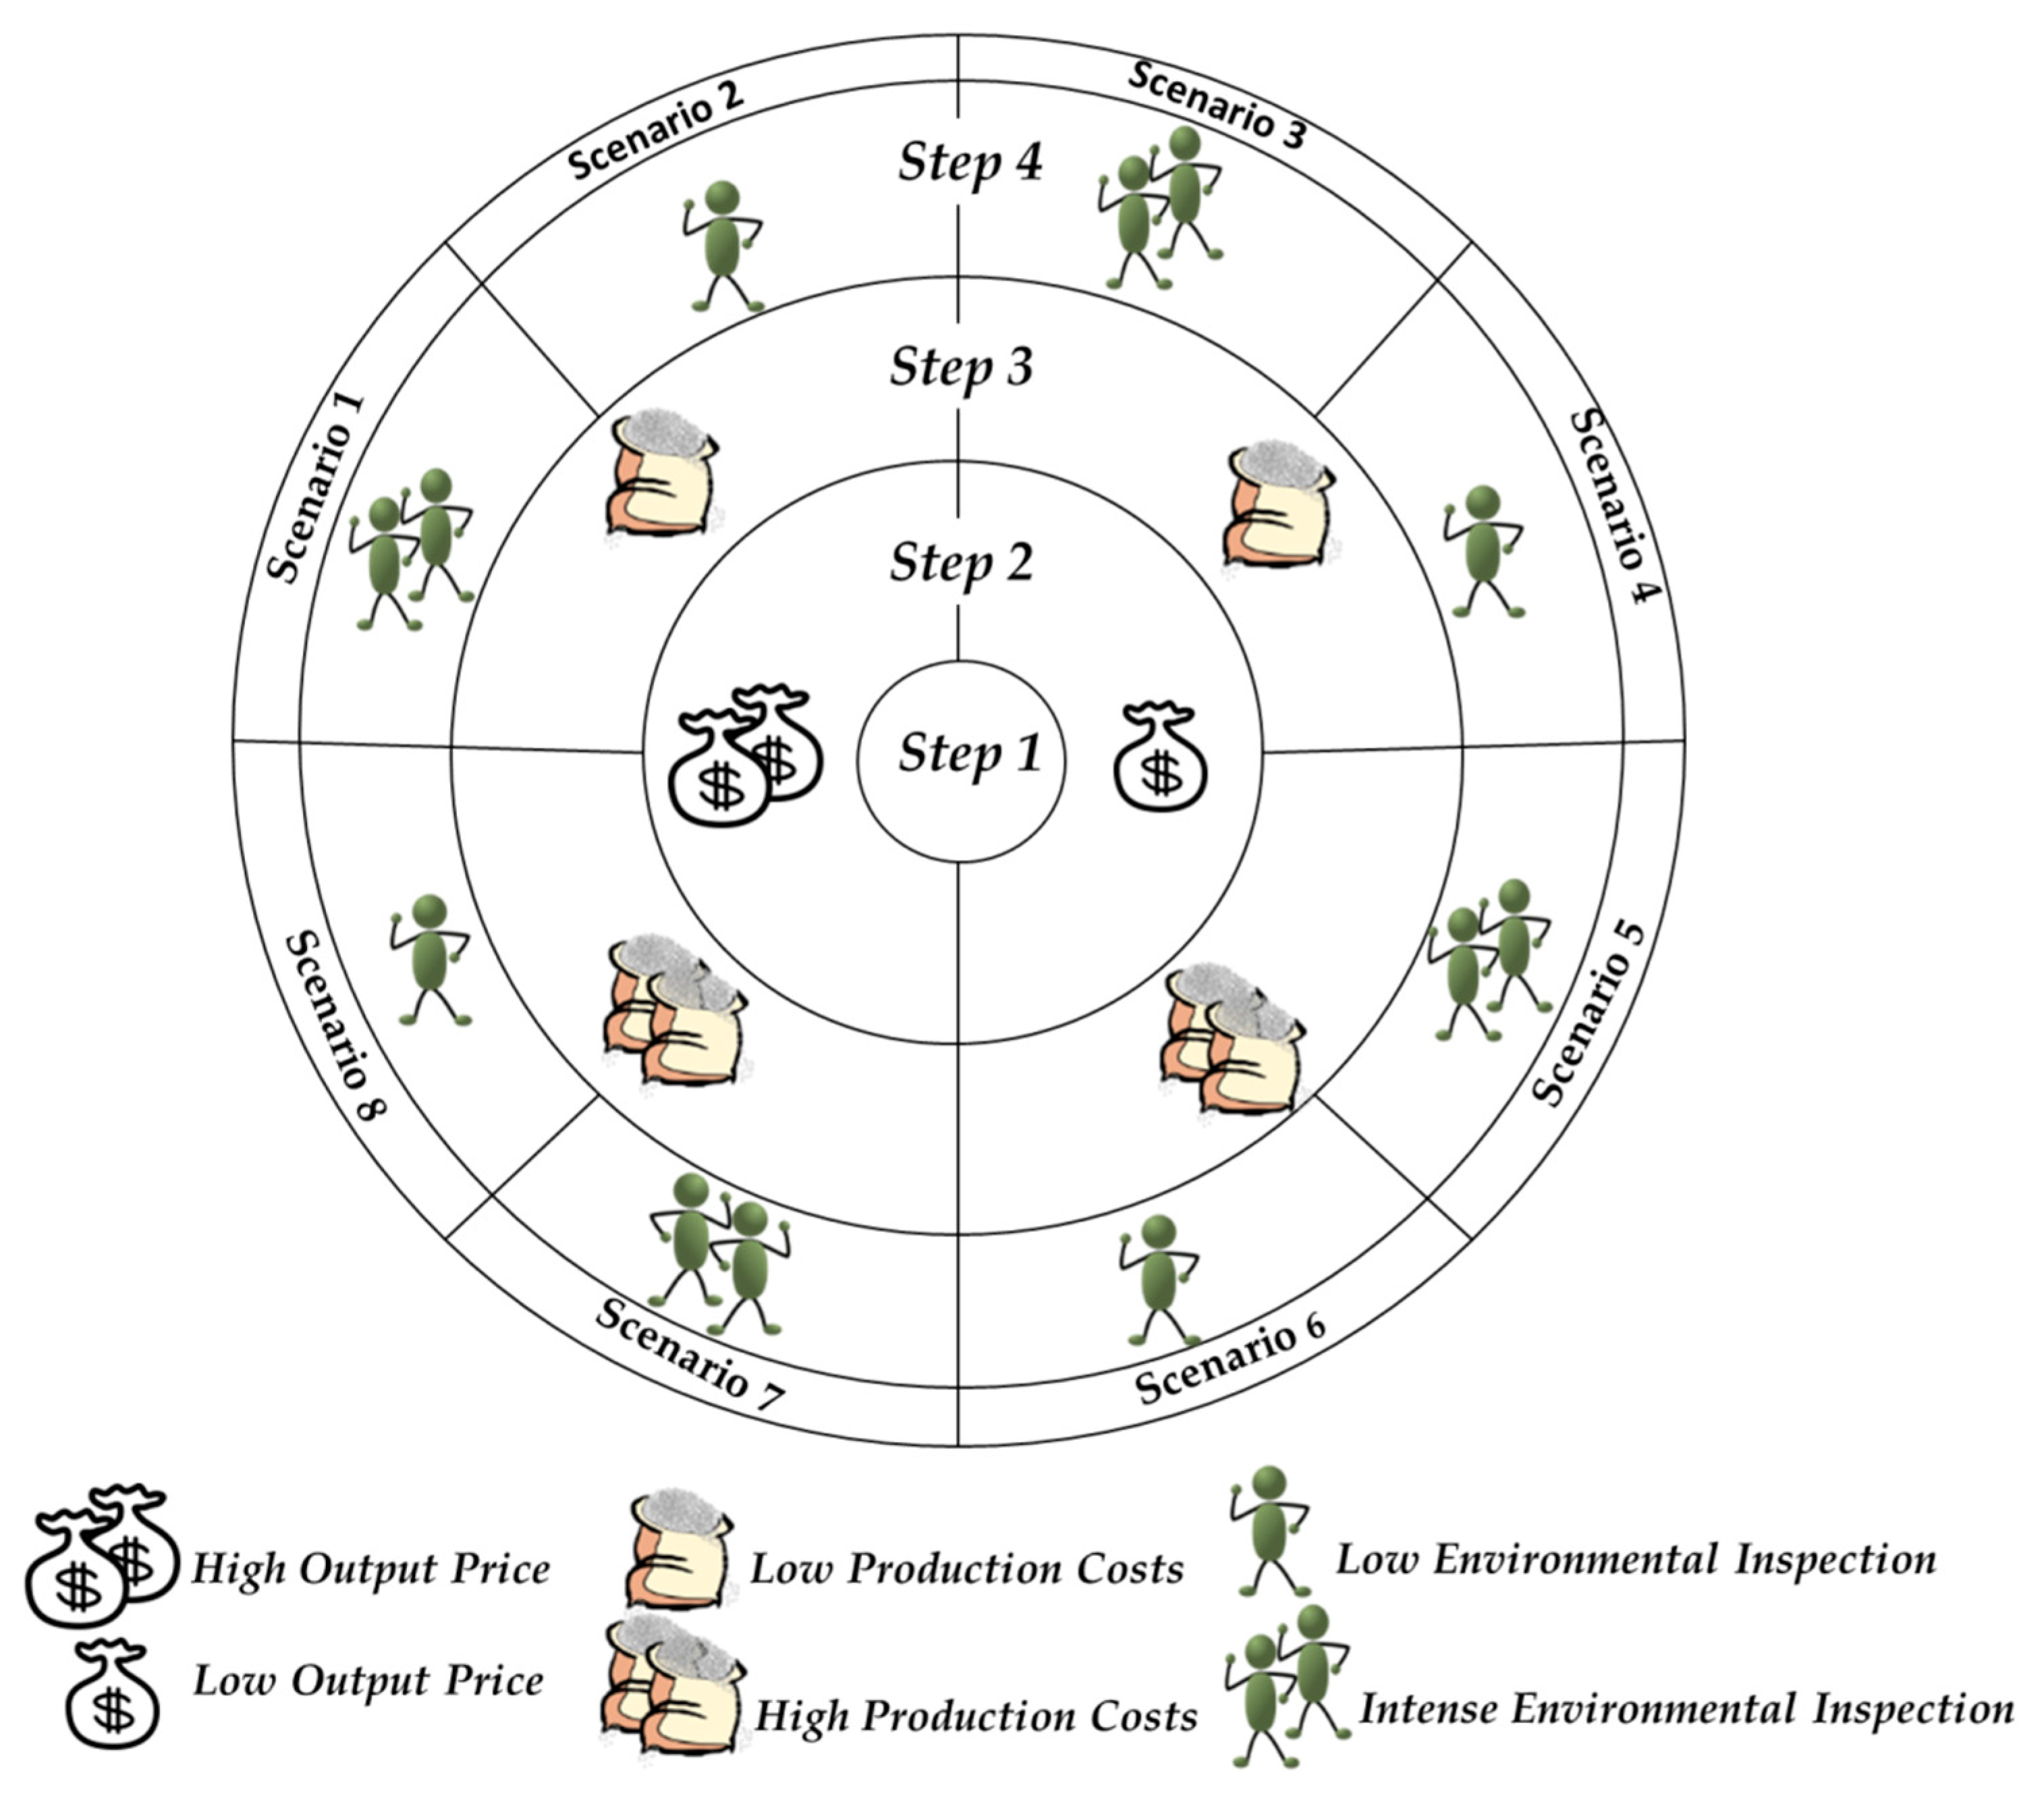
2.2.1. Attributes and Levels

To represent the market and policy forces that affect land-use outcomes, we chose agricultural prices, production costs, and environmental-inspection probability as the main variables in the decision game. For prices and costs, we defined two levels to use in the scenarios, low and high. Five classes were adopted to represent inspection-probability levels: Very low (0%–20%); low (20%–40%); medium (40%–60%); high (60%–80%); and very high (80%–100%). The scaling from “very low” to “very high” was based on farmer and expert consultations.

2.2.2. Focal Groups

We conducted a literature review of the land-use change history in each municipality to identify and select local deforestation agents and regional drivers. After a first field visit with pilot interviews, we classified farmers from the three municipalities into four groups: (1) Large soybean farmers; (2) large cattle ranchers; (3) small agricultural farmers; and (4) small dairy farmers. Classification criteria were (1) the dominant type of land use (livestock or different types of farming) and (2) the property size. We classified smallholders by farms with up to four fiscal modules (unit of measure in hectares created by the National Institute of Colonization and Agrarian Reform (INCRA) to classify properties. The size of a fiscal module varies by municipality according to the most important economic activities in the municipality and land demand. This definition was set by the Brazilian Law 8629 of 1993) (<360 ha in Sinop and Guarantã do Norte and <300 ha in Novo Progresso), whereas medium- and large-scale producers were assigned to a single class of farmers with properties bigger than four fiscal modules. Total farm numbers and property sizes were based on the Rural Environmental Registry (CAR), whereas dominant land uses were determined by overlaying of CAR polygons with land use maps (see Table 1).

2.2.3. Game Design and Application

The decision game was played on a round board with players represented by a chess pawn (Figure 2). The game was played once with each respondent. Sometimes, family members watched and contributed by discussing game decisions. The game began with the player sketching the farm in the center of the board with a description of current land use/cover and prices and costs associated with ongoing land-use activities. The property sketch was also used to indicate where possible land-use changes could be implemented in the farm.
In the second round of the game, agricultural prices changed to higher or lower levels. Price variations were simulated until a value (either high or low) induced a hypothetical shift in land use. The level and variation in price was based on current and historical trends in the region. In the next round of the game, players were exposed to changes in production costs, under both high and low agricultural-price scenarios. As previously described, production costs were changed to higher or lower levels for players to reveal decisions and update their farm sketches if necessary. Finally, in the fourth round, for each combination of high/low agricultural price/cost, the players were exposed to new scenarios with different probabilities of being inspected by law enforcement agents. The objective of this step was to identify whether changes in inspection probability (see probability classes defined above) either stimulated or discouraged certain land-use decisions in any of the price and cost scenarios defined in the previous stage. The game and the questionnaire application lasted 1.5 hours on average.
Agricultural prices were measured in standard units, i.e., soybean sack (60 kg), “arroba” of beef (15 kg), and liter of milk, whereas costs varied by type of land-use activity and respective main inputs, i.e., fertilizers, seeds, and machinery for soybean farmers and calf, salt, and pasture reform for cattle ranchers. A description of each resulting scenario can be seen in Table 2. We did not consider labor costs because respondents had difficulties quantifying household labor deployment.

2.2.4. Data Collection

Pilot interviews were conducted between August and September 2016. Semi-structured interviews, followed by the game sessions, took place in March and April 2017. The first set with 16 interviews was conducted with representatives of the following local and regional organizations: National Institute of Colonization and Agrarian Reform (INCRA); Brazilian Agricultural Research Corporation (EMBRAPA); Chico Mendes Institute for Biodiversity Conservation (ICMBio); Brazilian Institute of Environment and Renewable Natural Resources (IBAMA); two rural extension agencies (EMPAER and EMATER); Cargill Trade Union; four farmer associations (APROSOJA, APRONOP, Rural Producers of Itaituba and Santarém Unions); and two Secretariats of the Environment (in Guarantã do Norte and Itaituba), in addition to the local farmers.
During the second field visit (March to April 2017), 63 farmers from Sinop, Guarantã do Norte and Novo Progresso (21 from each municipality) were asked to respond to a semi-structured questionnaire and participate in the decision game. Additionally, two representatives from local rural associations (i.e., Union of Rural Producers and the Brazilian Association of Soybean Producers in Sinop; Association of Rural Producers and Union of Rural Producers in Novo Progresso; Cooperativa Agropecuária Mista Terra Nova and Dairy Cooperative of Mato Grosso in Guarantã do Norte) and two representatives from the municipal secretariats of the environment and agriculture in each municipality participated in the activities, totaling 75 participants (25 from each municipality).

2.3. Decision Analysis

Land-use change decisions and associated prices, costs, and probabilities of environmental inspection were used to estimate decision trees for each focal group, using the “rpart” package [53] available for R v.3.5.0 statistical software [54]. In the trees, the independent variables were prices, costs, and environmental-inspection probabilities and the dependent variables (or the target nodes) were the land-use decisions. The split based on the strongest association with the target variable became the first branch of the tree. Subsequent subdivisions followed the same procedure until the grouping of the independent variables was either no longer meaningful for new divisions or the last possible branch of the tree was reached [55]. The tree thus identified the order of relevance of variables for a given land-use decision and farmer group based on multiple observations from the game. Lastly, we used dispersion charts to report the land-use decisions for each focal group in each game scenario to facilitate visual interpretation of the results.

3. Results

Distinct characteristics were captured in the distribution of the farmers among the municipalities in terms of main land-use activities, agricultural suitability, and tenure status (Table 3).
Overall, five courses of action were identified based on the land-use change decisions taken by the farmers during the game sections: (1) Maintenance, i.e., continuation of the current land use; (2) selling/leasing of the property; (3) activity shift from cattle ranching to soy plantations; (4) intensification, i.e., investment in new technologies to increase productivity; (5) clearing, i.e., forest replacement by agriculture or pasture; and (6) expansion, i.e., land purchase.
On average, farmers revealed that the high agricultural prices which could lead to land-use change decisions needed to be ≈30% higher than the values during the time of the interviews (considered lower than average at the time), whereas low prices were those ≈10% lower than the values at the time of interviews (Table 4).

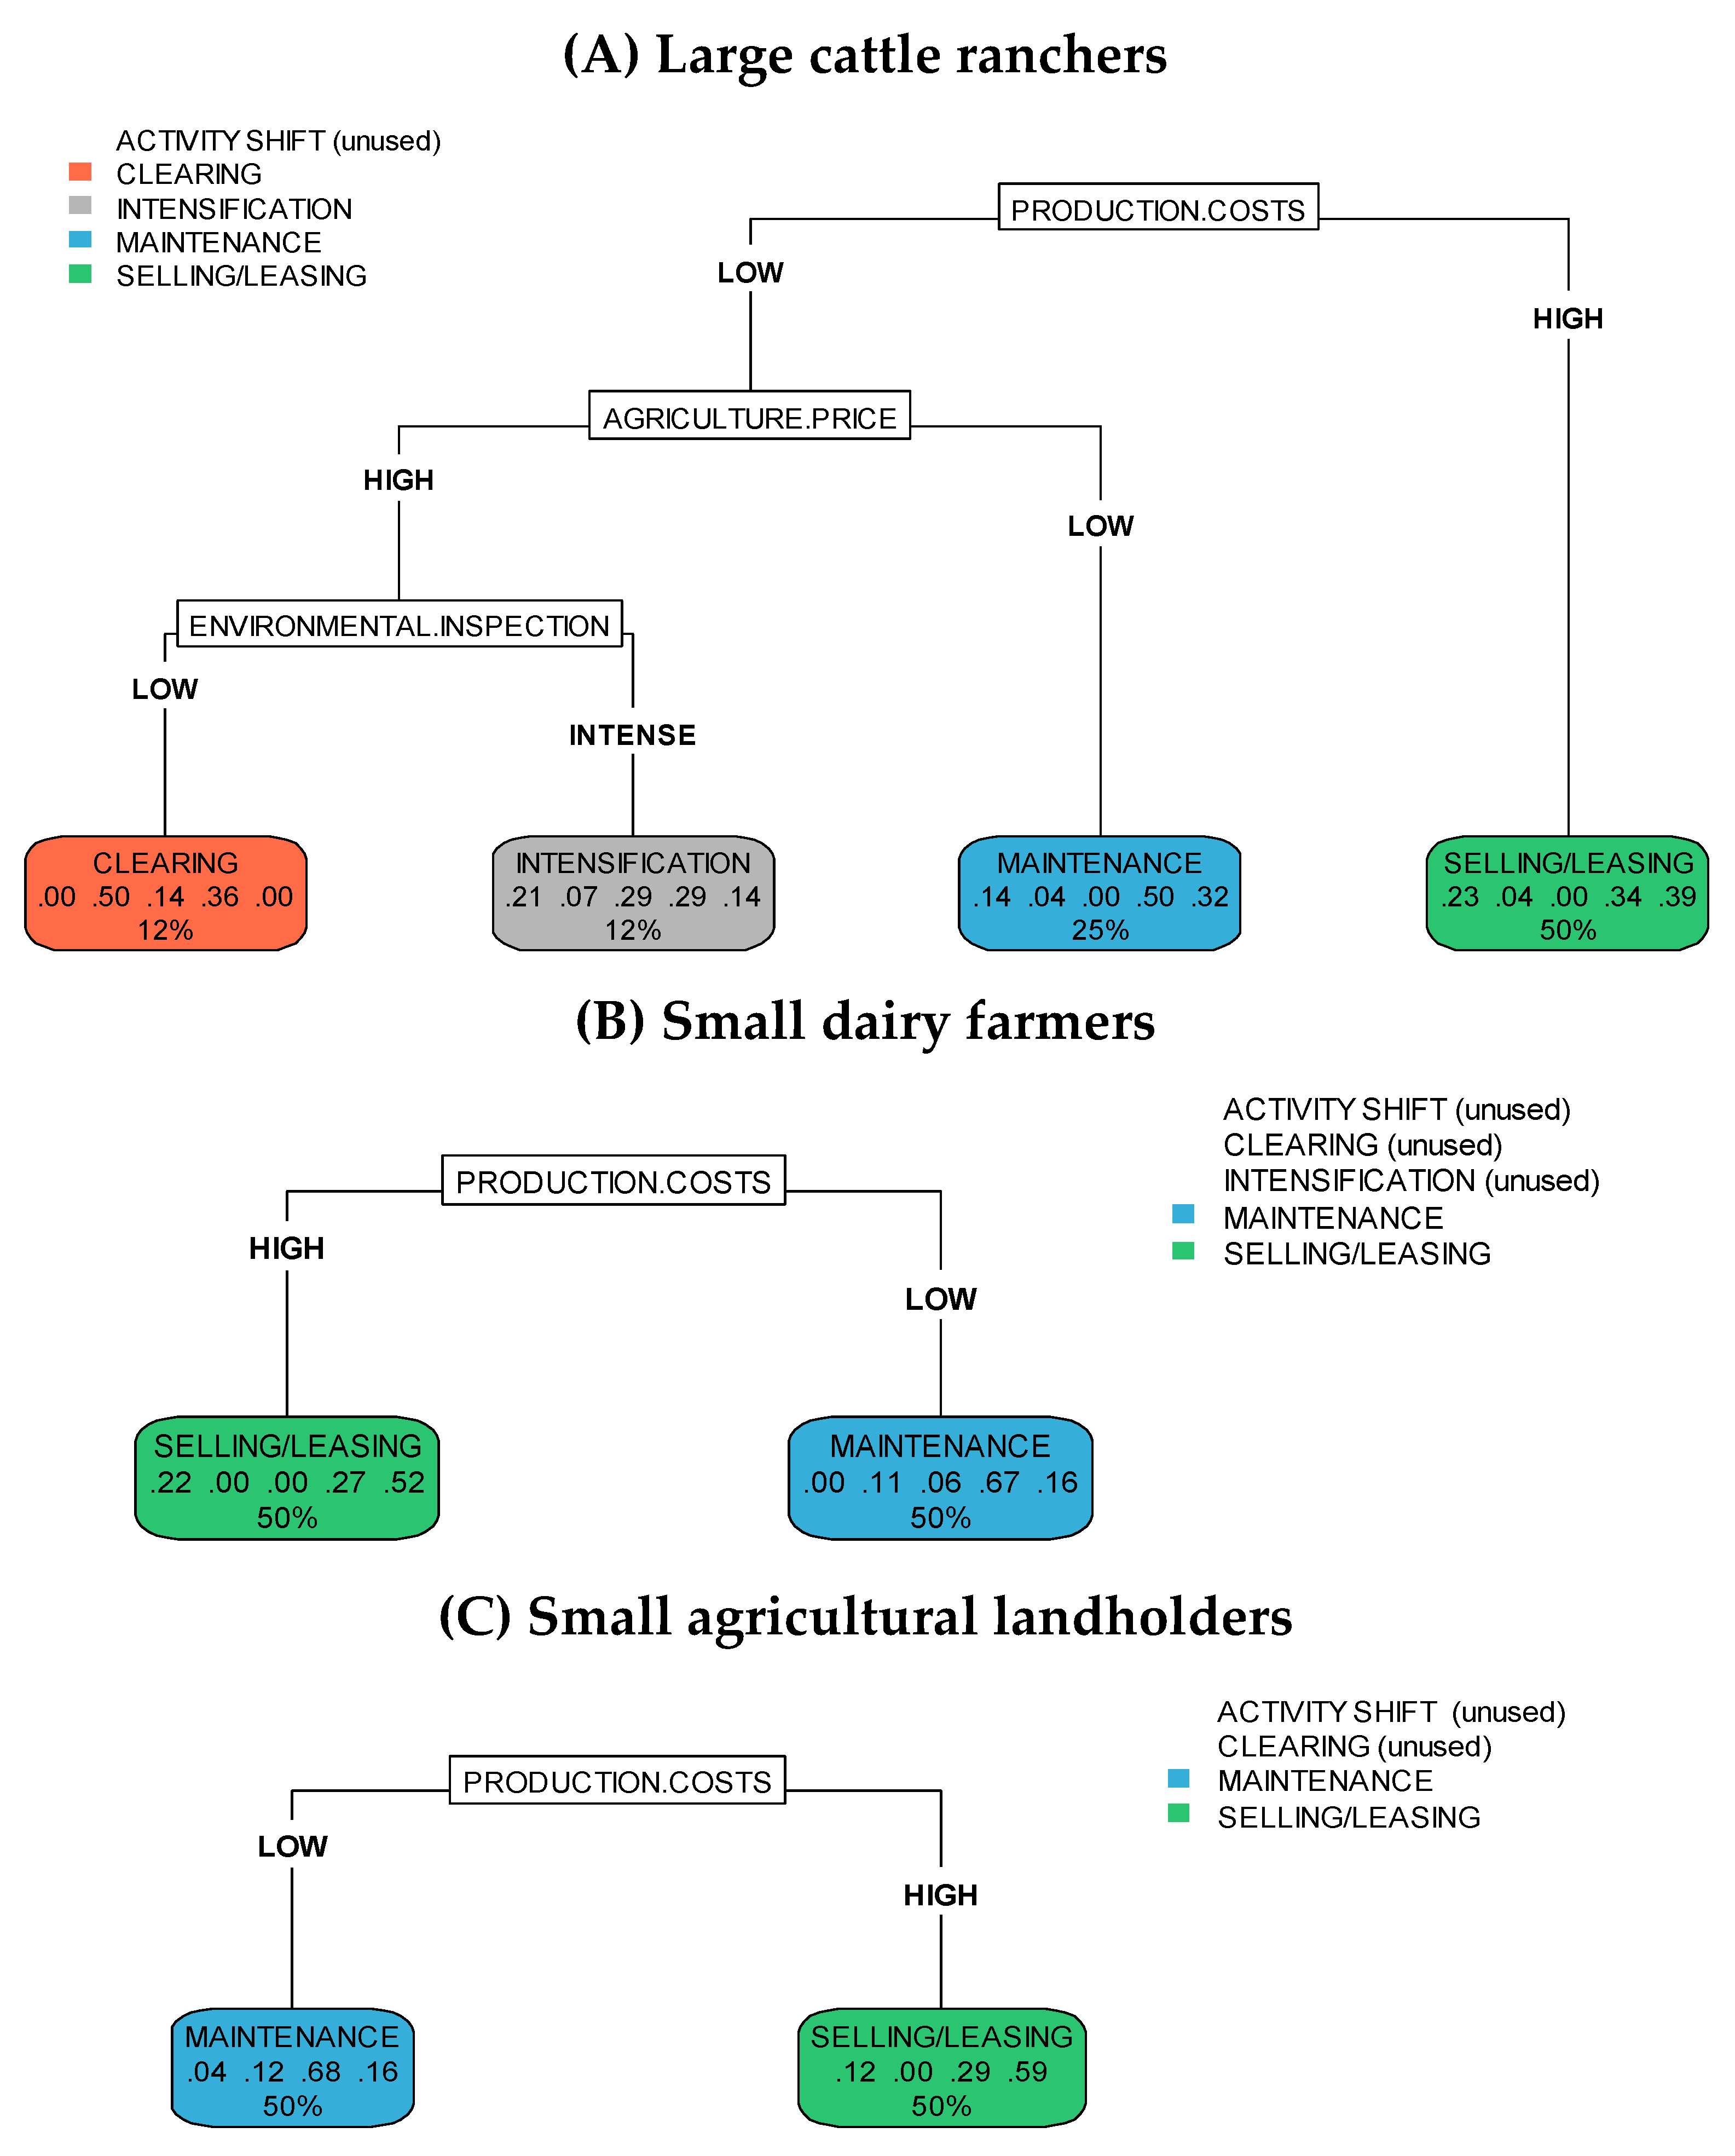
3.1. Land-Use Change Decision Trees

The distribution of the independent variables (i.e., agricultural prices, production costs, and environmental inspection probabilities) or land-use decision factors and their branch hierarchy in the decision trees were different for each group (Figure 3). These results indicate that each group adopts different decision strategies about land-use change in response to shifts in economic and law enforcement conditions. The large soybean producer group did not exhibit sufficient homogeneity in decision outcomes to justify inclusion in Figure 3.
In the large cattle ranchers’ decision tree, production cost was identified as the most important factor affecting land-use decisions, leading to 39% of the ranchers under a high-cost scenario to opt for the “selling/leasing” decision. Under the same conditions, another 34% of them opted to “maintain” the current land use, while 23% shifted their land-use activities. Agricultural prices represented the second most significant decision factor, but only under a low production-cost scenario. Given those conditions, low agricultural prices led to 50% of the ranchers choosing to: maintain” current practices, while another 32% opted to “sell/lease” their lots. The environmental inspection factor became a significant driver of land use decisions only under a combined scenario of low production costs and high agricultural prices. In this case, low inspection probabilities led 50% of the ranchers to “clear” their lots, while another 36% chose to maintain current land uses. In contrast, for high inspection probabilities, 29% of the ranchers opted to “intensify” agricultural production, another 29% opted to “maintain” the current land use, and 21% decided to shift to alternative land-use options (mainly soybean). Interestingly, although a violation of environmental regulations limits access to public credit access, respondents from this group did not mention capital constraints as an explanation for the land-use change decisions.
In the small agricultural landholders’ decision tree, only production costs significantly affected land-use change decisions. Under low-cost scenarios, the majority of smallholders (68%) opted for the “maintenance” of current practices, whereas when costs were high, 59% of the smallholders decided to “sell or lease” their farms and another 29% again chose to maintain existing land-use activities. Similarly, production costs were also the only significant decision factor for the group of small dairy farmers. For low-cost scenarios, 67% of the farmers chose to “maintain” current land-use practices, whereas under high-cost conditions, half of the farmers (52%) opted to “sell or lease” their lots, another 27% opted to “maintain” their existing activities, and 22% choose to “shift” land-use activities. Interestingly, both small farmer groups had the most difficulty determining their production costs during the game, which may have influenced the decision tree results. On the other hand, decisions to “lease or sell” their landholdings in scenarios of increasing production costs were often justified with the difficulty of financing up-front investments needed to initiate production cycles (Figure 4).
None of the land-use decision factors significantly influenced the choices of the large soybean farmers, who opted to “maintain” their practice under all game scenarios. Consequently, the minimum frequency of land-use change responses necessary for the branching of the decision tree was not reached (i.e., no meaningful significance). Overall, farmers from this group were more reluctant to engage in illegal deforestation activities, even under a low-inspection scenario, and reported previous high investments in technology, machinery, and skilled labor as the factors responsible for their unwillingness to shift land-use activities, even under a scenario of high-production costs and low-agricultural prices.

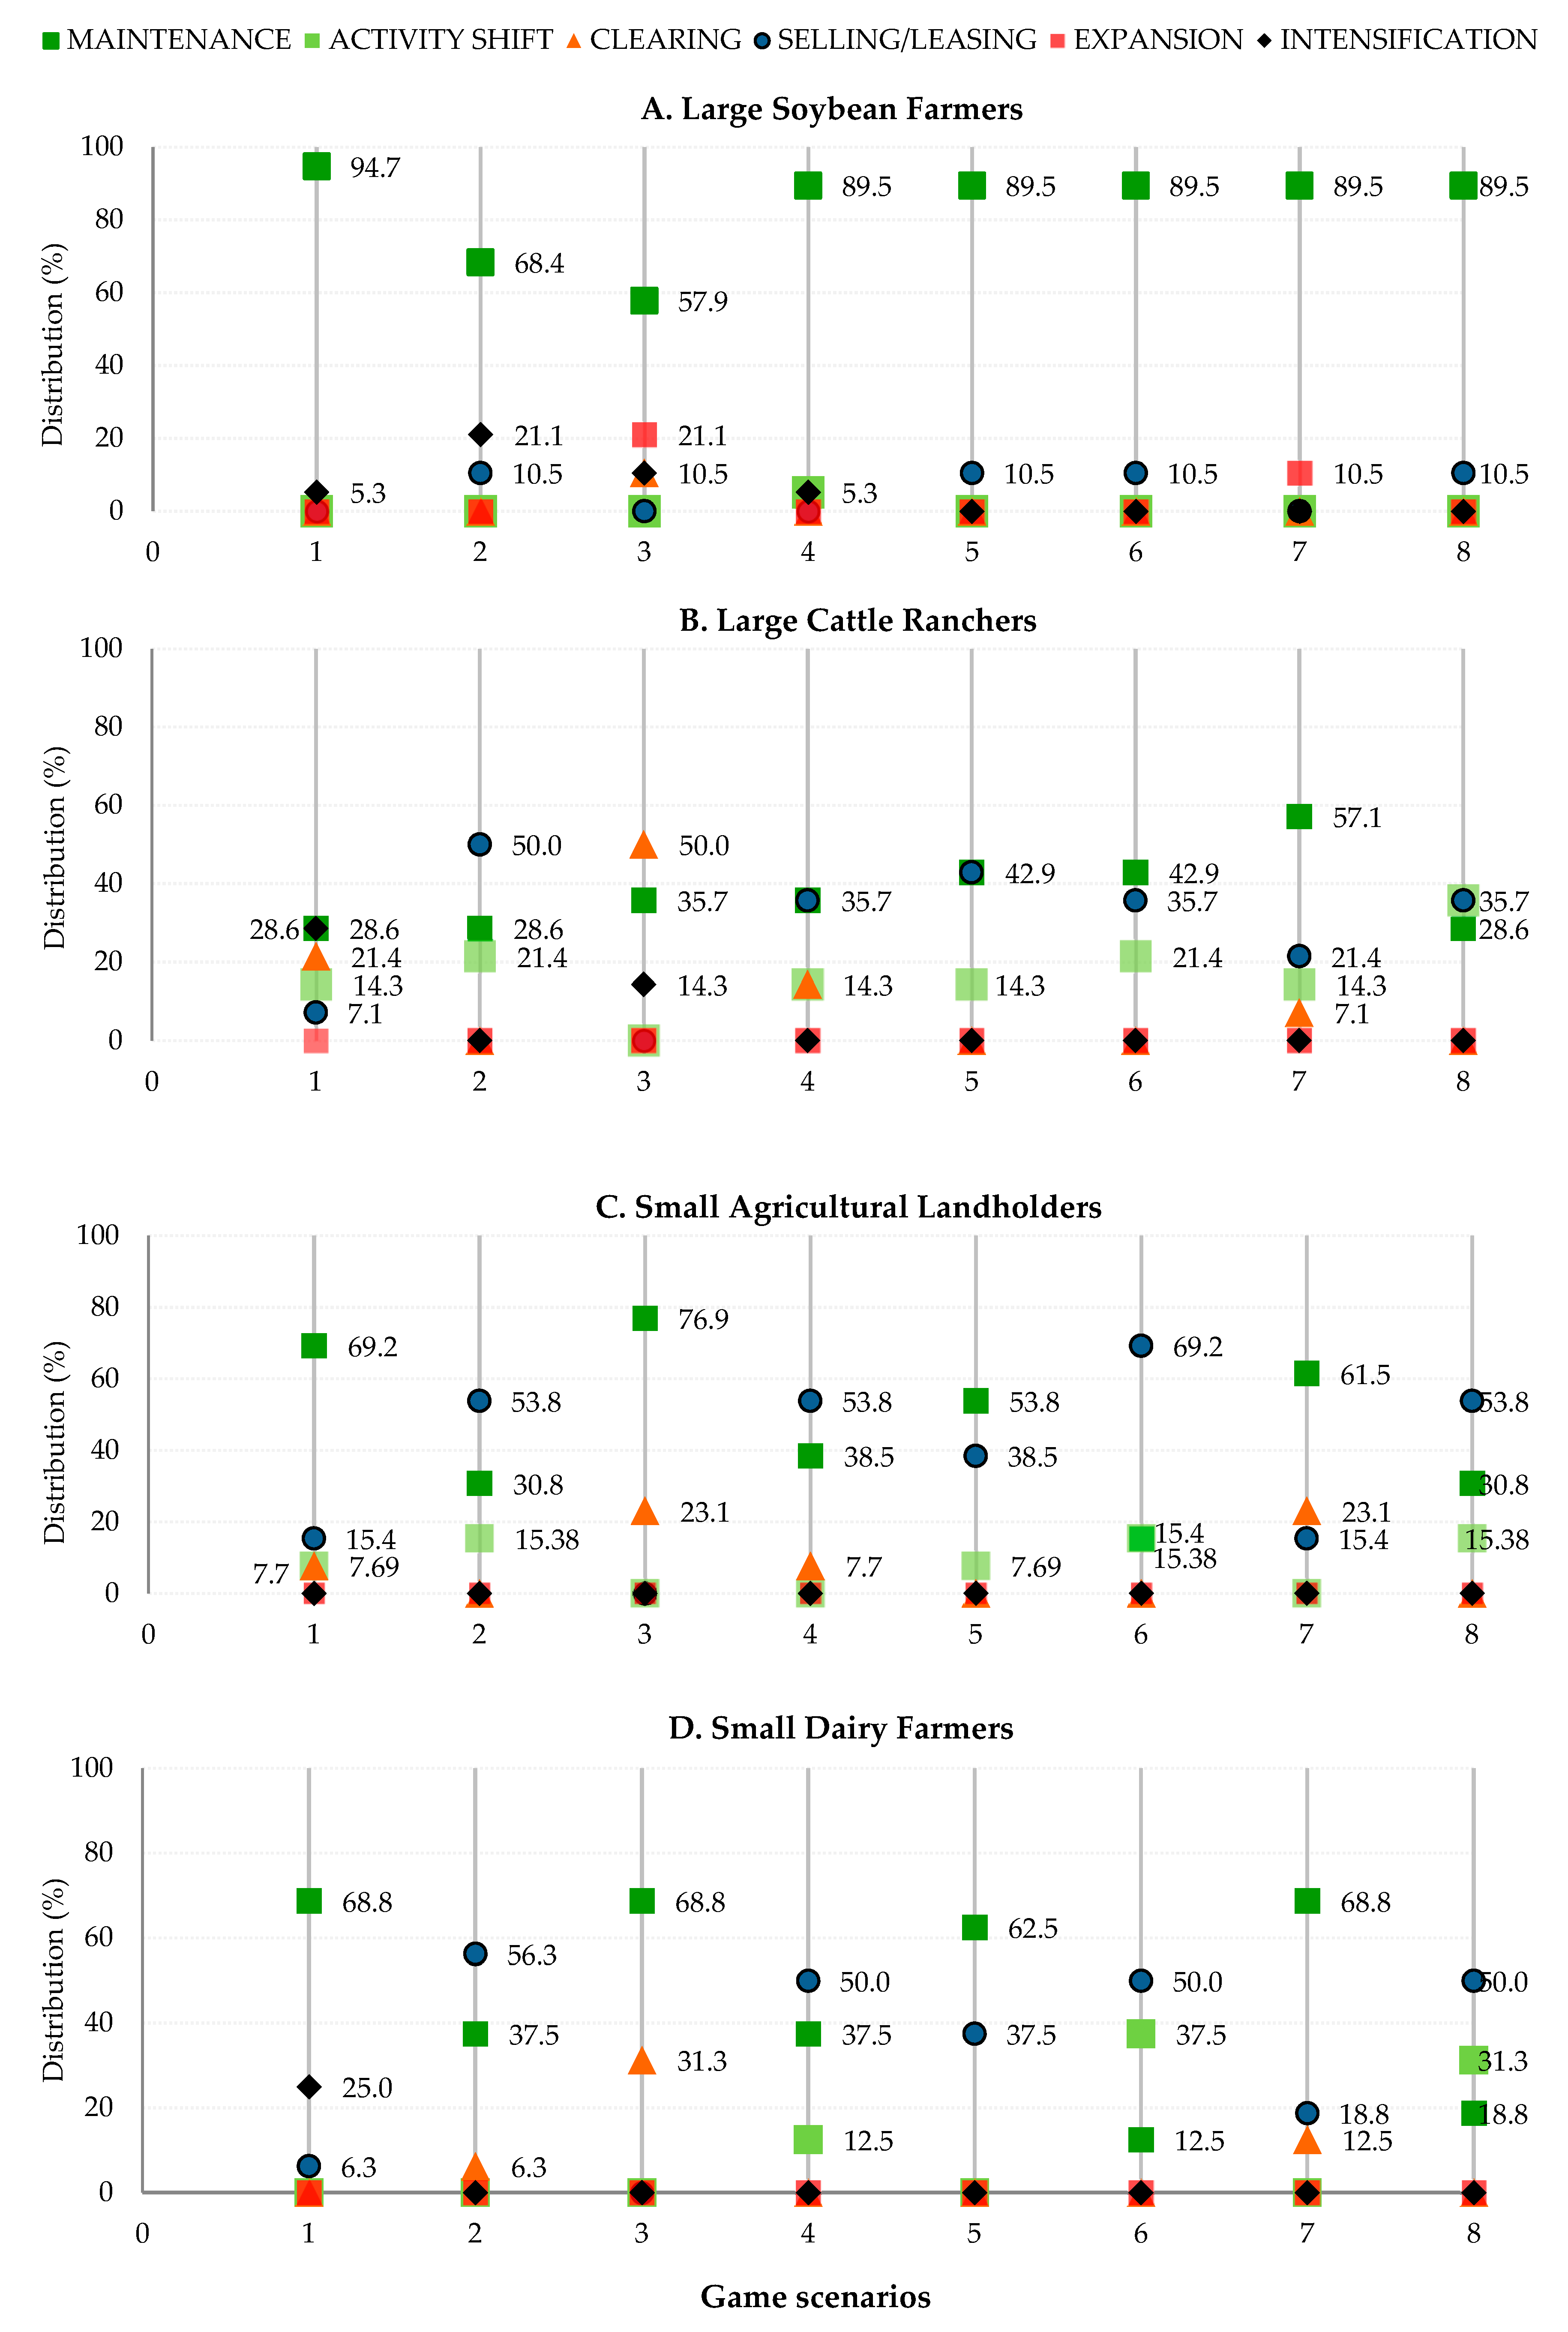
3.2. Dispersion Charts

Below, we present dispersion charts of the land-use change decisions of each farmer group under the game scenarios, irrespective of their inclusion in the decision trees (Figure 4).
For the group of large soybean farmers, “maintenance” was the most frequent land-use choice, irrespective of the game scenarios (Figure 4A). Nevertheless, changes in the probability of “maintenance” were more substantial for Scenarios 2 and 3 (under high agricultural prices). Declines in “maintenance” decisions were mainly associated with increases in intensification and “expansion” under Scenarios 2 and 3, respectively. Moreover, under the latter scenario, 21% of the soy farmers chose to deforest their lots. Those farmers reported selling their production to small agricultural traders that were not committed to the SoyM and hence had no market incentive to comply with environmental regulations under a low-enforcement context.
Land-use change decisions among large cattle ranchers varied substantially across scenarios (Figure 4). In general, low numbers of environmental inspections were associated with increases in the proportion of ranchers willing to deforest (e.g., Scenarios 1 vs. 3, 2 vs. 4, and 5 vs. 7). However, except for Scenario 3, most farmers reported that, even under favorable conditions, they would avoid deforestation because their land would be devalued due to the SoyM. In this case, they decided to “sell/lease” their land. Ranchers, on the other hand, did not mention the beef agreements (“TACs”) as an important decision factor, but stressed concern about environmental infractions leading to public credit access restrictions. Similarly, high production costs were often associated with “selling/leasing” decisions. In contrast, high-agricultural prices and low costs (Scenarios 1 and 3) was the only combination of factors leading to “intensification.” Despite acknowledging the benefits of grazing “intensification” (e.g., rotational pasture management and cattle confinement), ranchers reported the limited access to technical assistance, skilled labor, and new technologies as adoption barriers. Moreover, they reported slash-and-burn practices to be much cheaper than fertilizers and other soil-correction inputs required for “intensification.”
Most LUCC decisions among small agricultural landholders and dairy farmers were divided into “maintenance” and “selling/leasing”, and driven by the scenarios with low and high production costs, respectively (Figure 4C,D). These small farmers were the most likely to abandon agricultural activities. Interestingly, both groups also presented similar distributions of other land-use change decisions. A notable difference was that no small landholder opted for “intensification” under any simulated scenario, in contrast to 25% of the dairy farmers under Scenario 1. Some small landholders reported deforesting under low-inspection scenarios but indicated in the second part of the interview that they were aware of the potential costs of non-compliance with forest conservation law, such as credit constrains and market access. Interviews also revealed that farmers tended to have varying planning horizons when making land-use decisions. Some farmers reported that their decisions were influenced by the repayment periods of agricultural credits.

3.3. Evidence from Questionnaires

The questionnaires provided additional information to contextualize the game results. Of all the interviewees, 22% migrated to the region during the 1970s and 48% in the 1980s, all from southern Brazilian states. The remaining 30% of respondents moved to the region after 2000. Of this group, 27% came from Eastern Pará and migrated directly to Novo Progresso. The remaining 73% came from the states of Goiás, São Paulo, and Paraná and were distributed between the municipalities of Guarantã do Norte and New Progresso. Farmers highlighted the importance of their neighbors as sources of information about new technologies and alternative land-use activities, as well as the influence of local infrastructure (e.g., silos and processing facilities) and agricultural services (e.g., warehouses, supply shops, machinery rental, and farmer associations), technical assistance, and market access on land-use decisions. Moreover, they stressed land-use choices, particularly related to shifts” in activities, “expansion”, and forest “clearing”, to depend on the natural agricultural suitability of the land.
Decisions to “intensify” were less common than expected. Intensification was understood by all groups to be the increase of per-hectare productivity. However, intensification strategies were only widely adopted by soy producers. According to the cattle ranchers, the main barrier to intensification is the lack of technical assistance (40% of respondents) and high investment costs (44% of respondents). The remaining 16% reported a lack of need to intensify. When questioned about the motivations to adopt sustainable-production techniques, 75% of respondents mentioned a potential productivity gain, but no producer mentioned environmental conservation.
Heterogeneity in land-tenure status may explain some of these findings, given that many rural credit lines are conditioned on land ownership. In Guarantã do Norte, 56% of respondents declared to have obtained a land title during the 1970s and 1980s. In Novo Progresso, only 1% of interviewees formally owned their land, whereas in Sinop only 1% of the respondents did not hold a land title. Of the respondents who did not have a land title, 43% were large landholders and 57% were small.
All farmers referred to environmental regulations as a barrier to regional agricultural development. About 90% of the interviewees identified the Brazilian Forest Code (and the SoyM) as important land-use decision factors. On the other hand, environmental sanctions, such as fines and embargoes for the infraction of the code, are often evaded. According to interviewees, there are possibilities to contest fines in court or not to pay them. Of the total number of interviewees, 43% had already been fined by IBAMA (Brazilian Institute of Environment and Renewable Natural Resources). Of these, only 16% reported having solved the question by paying the fine or finalizing the contestation process, while the other 84% said they had appealed or were unable to pay the fine.

4. Discussion

A number of factors are known to influence land-use change, e.g., infrastructure development [56,57], land tenure [23,58], and agricultural prices [21,59]. However, it is ultimately the combined effects of these factors on the land-use decisions of local stakeholders that shape patterns and rates of deforestation. Hence, the study of local and focal groups of deforestation agents is key to understanding land-use change processes and informing policy design [41].
Sinop is an old agricultural frontier, characterized by good accessibility and low rates of forest loss, while Guarantã do Norte and Novo Progresso represent a new frontier, where land-use change processes are more intense [60]. Nonetheless, our findings suggest that land-use decisions do not vary by frontier context, but rather by farm groups.
Production cost was the most influential land-use decision factors for the groups of cattle ranchers and small agricultural landholders (even though many respondents were unsure about their costs). Although various studies have emphasized relative prices as key determinants of land-use change [21,61], our findings suggest that farmers somehow perceive increases in cost to be more relevant for investment decisions than changes in agricultural price. Further research is needed to explore the role of contextual conditions, such as risk aversion, social networks, infrastructure, and agricultural extension in determining the sensitivity of land-use decisions to input and output price changes [62].
We observed that farmers from different groups respond differently to changes in law enforcement, but, contrary to our expectation, the frequency of environmental inspections was the least important factor influencing land-use decisions in our study sites. Indeed, according to reports from the Brazilian government, only 12% of the 17,404 fines issued in 2016 were paid [63]. Given the lack of law compliance, Gibbs et al. [22] asserted that environmental regulations are unlikely to be effective without complementary supply-chain mechanisms, such as the SoyM.
Since the launch of the SoyM in 2006, most of the observed soy expansion in the Brazilian Amazon replaced old pasturelands [22], likely triggering a negative spillover effect that drove grazing activities into low-priced forests [26,64]. Observations from the decision game corroborate this conjecture, because cattle ranchers often chose to sell or lease their lots to soy farmers under the intense environmental-inspection scenarios. Ranchers acknowledged the constraints imposed by the moratorium to have increased the value of their previously deforested lands, as highlighted by Richards et al. [65]. However, our findings suggest a potentially secondary and positive spillover effect of the SoyM. Ranchers, who would otherwise expand the pastureland in their lots, restrained themselves from doing so over concern that illegal deforestation would devalue their properties and thus compromise future land transactions. Similarly, responses from the soy farmers indicated that the moratorium is a key factor influencing land-use decisions across our study sites, as it constrains the commercialization of soybeans produced in illegally converted areas after 2008.
In order to keep the decision game manageable for farmers, we had to limit the number of independent variables and corresponding scenarios within simple categories. This clearly represents a tradeoff vis-à-vis observational studies, which may, on the other hand, come with the limitation of insufficient variation in the exogenous factors under study here. Given the relatively small number of observations, we were not able to include additional variable, such as household characteristics, in the decision-tree analysis, which represents a potential bias that we sought to address by splitting the sample into farm types. Finally, we acknowledge that the farmers’ responses to changes in our three decision factors may have been influenced by ongoing events and initiatives in the study area, e.g., public investigations related to beef quality scandals led by IBAMA, the federal government’s decision to impose charges on rural workers for social assistance (FUNRURAL), and debates about new regulations for rural workers with implications for production costs, especially in large, commercial farms.

5. Conclusions

This study investigated the land-use decision-making process of local farmers from the Amazonian municipalities of Sinop, Guarantã do Norte and Novo Progresso along the BR-163 highway, under various hypothetical economic and political contexts. Analyses were based on the responses of farmers who participated in decision games and responded to semi-structured questionnaires. In the games, land-use change options included (1) “maintenance” or (2) “intensification” of their current land use, (3) “activity shift”, (4) “selling/leasing” of their property, (5) forest “clearing”, and (6) “expansion” (i.e., land acquisition). Farmers had to choose among these options under eight game scenarios with varying agricultural prices, production costs, and environmental-inspection intensities.
We identified four focal groups of farmers associated linked to land-use change in our study region: (1) Large soybean producers; (2) large cattle ranchers; (3) small agricultural landholders; and (4) small dairy farmers. We did not find differences in land-use decisions among farmers from the same groups across the study sites, but farmers in each group responded differently to the scenarios in the decision game. Production costs were consistently the most important factor influencing land-use decisions in all groups, while the intensity of environmental inspection was consistently the least important.
Despite mounting evidence for the effectiveness of anti-deforestation policies in Brazil, our results indicate that economic factors remain the dominant decision factor among the local stakeholders along the BR-163 highway, where planned and ongoing infrastructure investments are threatening the remaining natural forests. Our findings suggest that conservation policies must be flexible enough to adapt to the heterogeneity of local stakeholders in the region, with cattle ranchers being the most responsive to traditional disincentive-based policy instruments. Lastly, our decision-game approach may be a complementary cost-effective strategy to parameterize land-use change models that simulate the impacts of alternative policy and market scenarios.

Supplementary Materials

The following are available online at https://www.mdpi.com/1999-4907/10/6/464/s1.

Author Contributions

Investigation, N.N.; methodology, N.N.; supervision, J.B. and J.O.; writing—original draft, N.N.; writing—review and editing, T.A.P.W. and J.B.

Funding

This research was developed under the project “Forests in the global bioeconomy: developing multi-scale policy scenarios” project, supported by the German Federal Ministry for Economic Cooperation and Development (BMZ), through the Advisory Service on Agricultural Research for Development (Beratungsgruppe Entwicklungsorientierte Agrarforschung—BEAF), the Coordenação de Aperfeiçoamento de Pessoal de Nível Superior—Brazil (CAPES)—Finance Code 001, and the Program Partnerships for Enhanced Engagement in Research (PEER).

Acknowledgments

We would like to thank the farmers who contributed for this work. We are very grateful to the National Institute of Colonization and Agrarian Reform (INCRA); Brazilian Agricultural Research Corporation (EMBRAPA); Chico Mendes Institute for Biodiversity Conservation (ICMBio); Brazilian Institute of Environment and Renewable Natural Resources (IBAMA); the rural extension agencies EMPAER and EMATER, farmers associations and Secretaries of Environmental in Guarantã do Norte, Novo Progresso and Sinop for assistance and collaboration. We also thank the two anonymous reviewers for comments that substantially improved the manuscript.

Conflicts of Interest

This study contributes to a Ph.D. dissertation. The authors declare no conflict of interest.

References

  1. United Nations, Department of Economic and Social Affairs, P.D. World Population Prospects: The 2017 Revision, Methodology of the United Nations Population Estimates and Projections; United Nations, Department of Economic and Social Affairs, P.D: New York, NY, USA, 2017. [Google Scholar]
  2. Charles, H.; Godfray, J.; Garnett, T. Food security and sustainable intensification. Philos. Trans. R. Soc. B Biol. Sci. 2014, 369, 20120273. [Google Scholar]
  3. Carrasco, L.R.; Webb, E.L.; Symes, W.S.; Koh, L.P.; Sodhi, N.S. Global economic trade-offs between wild nature and tropical agriculture. PLoS Biol. 2017, 15, e2001657. [Google Scholar] [CrossRef]
  4. Armenteras, D.; Espelta, J.M.; Rodríguez, N.; Retana, J. Deforestation dynamics and drivers in different forest types in Latin America: Three decades of studies (1980–2010). Glob. Environ. Chang. 2017, 46, 139–147. [Google Scholar] [CrossRef]
  5. Le Polain de Waroux, Y.; Baumann, M.; Gasparri, N.I.; Gavier-Pizarro, G.; Godar, J.; Kuemmerle, T.; Müller, R.; Vázquez, F.; Volante, J.N.; Meyfroidt, P. Rents, Actors, and the Expansion of Commodity Frontiers in the Gran Chaco. Ann. Am. Assoc. Geogr. 2018, 8, 290–298. [Google Scholar] [CrossRef]
  6. Gibbs, H.K.; Munger, J.; L’Roe, J.; Barreto, P.; Pereira, R.; Christie, M.; Amaral, T.; Walker, N.F. Did Ranchers and Slaughterhouses Respond to Zero-Deforestation Agreements in the Brazilian Amazon? Conserv. Lett. 2016, 9, 32–42. [Google Scholar] [CrossRef]
  7. Walker, R.; Moran, E.; Anselin, L. Deforestation and Cattle Ranching in the Brazilian Amazon: External Capital and Household Processes. World Dev. 2000, 28, 683–699. [Google Scholar] [CrossRef]
  8. Walker, R.; Homma, A.K.O. Land use and land cover dynamics in the Brazilian Amazon: an overview. Ecol. Econ. 1996, 18, 67–80. [Google Scholar] [CrossRef]
  9. Perz, S.G.; Walker, R.T. Household Life Cycles and Secondary Forest Cover Among Small Farm Colonists in the Amazon. World Dev. 2002, 30, 1009–1027. [Google Scholar] [CrossRef]
  10. Vosti, S.A.; Witcover, J. Slash-and-burn agriculture - Household perspectives. Agric. Ecosyst. Environ. 1996, 58, 23–38. [Google Scholar] [CrossRef]
  11. Brondízio, E.S.; Cak, A.; Caldas, M.M.; Mena, C.; Bilsborrow, R.; Futemma, C.T.; Ludewigs, T.; Moran, E.F.; Batistella, M. Small farmers and deforestation in Amazonia. In Amazônia and Global Change; Wiley Blackwell: Hoboken, NJ, USA, 2013; pp. 117–143. [Google Scholar]
  12. Becker, B.K. Modelos e cenários para a Amazônia: o papel da ciência Revisão das políticas de ocupação da Amazônia: é possível identificar modelos para projetar cenários? Parcer. Estratégicas 2001, 6, 135–159. [Google Scholar]
  13. Castro, E. Políticas de ordenamento territorial, desmatamento e dinâmicas de fronteira. Novos Cad. NAEA 2007, 10, 105–126. [Google Scholar] [CrossRef]
  14. Fearnside, P.M. Brazil’s Cuiabá- Santarém (BR-163) Highway: The environmental cost of paving a soybean corridor through the Amazon. Environ. Manag. 2007, 39, 601. [Google Scholar] [CrossRef] [PubMed]
  15. Castro, R.B.; Albernaz, A.L. Consistency and use of information about threats in the participatory process for identification of priority conservation areas in the Brazilian Amazon. J. Nat. Conserv. 2016, 30, 44–51. [Google Scholar] [CrossRef]
  16. Coy, M.; Klingler, M. Frentes pioneiras em transformação: o eixo da BR-163 e os desafios socioambientais. Rev. Territ. Front. 2014, 7, 1–26. [Google Scholar] [CrossRef]
  17. IBGE - Instituto Brasileiro de Geografia e Estatística Produção Agrícola Municipal. Available online: https://sidra.ibge.gov.br (accessed on 9 September 2018).
  18. MDIC—Ministério da indústria comércio exterior e Serviços Balança Comercial. Available online: http://www.mdic.gov.br/ (accessed on 22 December 2018).
  19. Morton, D.C.; Noojipady, P.; Macedo, M.M.; Gibbs, H.; Victoria, D.C.; Bolfe, E.L. Reevaluating suitability estimates based on dynamics of cropland expansion in the Brazilian Amazon. Glob. Environ. Chang. 2016, 37, 92–101. [Google Scholar] [CrossRef] [Green Version]
  20. Gollnow, F.; Lakes, T. Policy change, land use, and agriculture: The case of soy production and cattle ranching in Brazil, 2001–2012. Appl. Geogr. 2014, 55, 203–211. [Google Scholar] [CrossRef]
  21. Macedo, M.N.; DeFries, R.S.; Morton, D.C.; Stickler, C.M.; Galford, G.L.; Shimabukuro, Y.E. Decoupling of deforestation and soy production in the southern Amazon during the late 2000s. Proc. Natl. Acad. Sci. 2012, 109, 1341–1346. [Google Scholar] [CrossRef] [PubMed] [Green Version]
  22. Gibbs, H.K.; Rausch, L.; Munger, J.; Schelly, I.; Morton, D.C.; Noojipady, P.; Soares-Filho, B.; Barreto, P.; Micol, L.; Walker, N.F. Brazil’s Soy Moratorium: Supply-chain governance is needed to avoid deforestation. Science (80-). 2015, 347, 377–378. [Google Scholar] [CrossRef]
  23. Fearnside, P. Deforestation of the Brazilian Amazon. Oxford Res. Encycl. Environ. Sci. 2017, 3–59. [Google Scholar]
  24. Kastens, J.H.; Brown, J.C.; Coutinho, A.C.; Bishop, C.R.; Esquerdo, J.C.D.M. Soy moratorium impacts on soybean and deforestation dynamics in Mato Grosso, Brazil. PLoS ONE 2017, 12, e0176168. [Google Scholar] [CrossRef] [PubMed]
  25. Dalla-Nora, E.L.; de Aguiar, A.P.D.; Lapola, D.M.; Woltjer, G. Why have land use change models for the Amazon failed to capture the amount of deforestation over the last decade? Land Use Policy 2014, 39, 403–411. [Google Scholar] [CrossRef]
  26. Arima, E.Y.; Richards, P.; Walker, R.; Caldas, M.M. Statistical confirmation of indirect land use change in the Brazilian Amazon. Environ. Res. Lett. 2011, 6, 024010. [Google Scholar] [CrossRef]
  27. Lima, M.; Antonio Da Silva Junior, C.; Rausch, L.; Gibbs, H.K.; Johann, J.A. Demystifying sustainable soy in Brazil. Land Use Policy 2018, 82, 349–352. [Google Scholar] [CrossRef]
  28. Silva, C.A.; Lima, M. Soy Moratorium in Mato Grosso: Deforestation undermines the agreement. Land Use Policy 2018, 71, 540–542. [Google Scholar] [CrossRef]
  29. Alix-Garcia, J.; Gibbs, H.K. Forest conservation effects of Brazil’s zero deforestation cattle agreements undermined by leakage. Glob. Environ. Chang. 2017, 47, 201–217. [Google Scholar] [CrossRef]
  30. Nepstad, D.; McGrath, D.; Stickler, C.; Alencar, A.; Azevedo, A.; Swette, B.; Bezerra, T.; DiGiano, M.; Shimada, J.; Da Motta, R.S.; et al. Slowing Amazon deforestation through public policy and interventions in beef and soy supply chains. Science (80-). 2014, 344, 1118–1123. [Google Scholar] [CrossRef] [PubMed]
  31. Sills, E.O.; Herrera, D.; Kirkpatrick, A.J.; Brandão, A.; Dickson, R.; Hall, S.; Pattanayak, S.; Shoch, D.; Vedoveto, M.; Young, L.; et al. Estimating the impacts of local policy innovation: The synthetic control method applied to tropical deforestation. PLoS ONE 2015, 10, e0132590. [Google Scholar] [CrossRef] [PubMed]
  32. Börner, J.; Kis-Katos, K.; Hargrave, J.; König, K. Post-crackdown effectiveness of field-based forest law enforcement in the Brazilian Amazon. PLoS ONE 2015, 10, e0121544. [Google Scholar] [CrossRef] [PubMed]
  33. Banerjee, O.; MacPherson, A.J.; Alavalapati, J. Toward a policy of sustainable forest management in Brazil: A historical analysis. J. Environ. Dev. 2009, 18, 130–153. [Google Scholar] [CrossRef]
  34. Freitas, F.L.M.; Sparovek, G.; Berndes, G.; Persson, U.M.; Englund, O.; Barretto, A.; Mörtberg, U. Potential increase of legal deforestation in Brazilian Amazon after Forest Act revision. Nat. Sustain. 2018, 1, 665–670. [Google Scholar] [CrossRef]
  35. Soares-Filho, B.; Rajão, R.; Macedo, M.; Carneiro, A.; Costa, W.; Coe, M.; Rodrigues, H.; Alencar, A. Cracking Brazil’s Forest Code. Science (80-). 2014, 344, 363–364. [Google Scholar] [CrossRef] [PubMed]
  36. Gollnow, F.; Hissa, L.D.B.V.; Rufin, P.; Lakes, T. Property-level direct and indirect deforestation for soybean production in the Amazon region of Mato Grosso, Brazil. Land Use Policy 2018, 78, 377–385. [Google Scholar] [CrossRef]
  37. Müller, H.; Rufin, P.; Griffiths, P.; de Barros Viana Hissa, L.; Hostert, P. Beyond deforestation: Differences in long-term regrowth dynamics across land use regimes in southern Amazonia. Remote Sens. Environ. 2016, 186, 652–662. [Google Scholar] [CrossRef] [Green Version]
  38. Baylis, K.; Honey-Rosés, J.; Börner, J.; Corbera, E.; Ezzine-de-Blas, D.; Ferraro, P.J.; Lapeyre, R.; Persson, U.M.; Pfaff, A.; Wunder, S. Mainstreaming Impact Evaluation in Nature Conservation. Conserv. Lett. 2016, 9, 58–64. [Google Scholar] [CrossRef]
  39. Moutinho, P.; Guerra, R.; Azevedo-Ramos, C. Achieving zero deforestation in the Brazilian Amazon: What is missing? Elem. Sci. Anthr. 2016, 4, 000125. [Google Scholar] [CrossRef] [Green Version]
  40. Le Tourneau, F.M. Is Brazil now in control of deforestation in the Amazon? CyberGeo Eur. J. Geogr. 2016. [Google Scholar] [CrossRef]
  41. Börner, J.; Baylis, K.; Corbera, E.; Ezzine-de-Blas, D.; Ferraro, P.J.; Honey-Rosés, J.; Lapeyre, R.; Persson, U.M.; Wunder, S. Emerging evidence on the effectiveness of tropical forest conservation. PLoS ONE 2016, 11, e0159152. [Google Scholar] [CrossRef] [PubMed]
  42. Edwards, W. The theory of decision making. Psychol. Bull. 1954, 51, 380. [Google Scholar] [CrossRef] [PubMed]
  43. Hansson, S.O. Decision Theory A Brief Introduction; Department of Philosophy and the History of Technology, Ed.; Royal Institute of Technology: Stockholm, Sweden, 1994. [Google Scholar]
  44. Singh, C.; Dorward, P.; Osbahr, H. Developing a holistic approach to the analysis of farmer decision-making: Implications for adaptation policy and practice in developing countries. Land Use Policy 2016, 59, 329–343. [Google Scholar] [CrossRef]
  45. Linkous, E.; Skuzinski, T. Land use decision-making in the wake of state property rights legislation: Examining the institutional response to Florida’s Harris Act. Land Use Policy 2018, 77, 603–612. [Google Scholar] [CrossRef]
  46. Celio, E.; Grêt-Regamey, A. Understanding farmers’ influence on land-use change using a participatory Bayesian network approach in a pre-Alpine region in Switzerland. J. Environ. Plan. Manag. 2016, 59, 2079–2101. [Google Scholar] [CrossRef]
  47. Lee, D. Game theory and neural basis of social decision making. Nat. Neurosci. 2008, 11, 404–409. [Google Scholar] [CrossRef] [PubMed]
  48. Ringland, G.; Schwartz, P.P. Scenario Planning: Managing for the Future; John Wiley & Sons, Inc.: Hoboken, NJ, USA, 1998; ISBN 047197790X. [Google Scholar]
  49. Fernández, A.J.C. Do cerrado à Amazônia: as estruturas sociais da economia da soja em Mato Grosso, Universidade do Rio Grande do Sul, 2007, Vol. Doutorado. Available online: https://lume.ufrgs.br/handle/10183/14276 (accessed on 3 May 2017).
  50. Oliveira, A.U. Oliveira BR-163 Cuiabá-Santarém: Geopolítica, grilagem, violência e mundialização. In Amazônia Revelada: os decaminhos ao longo da rodovia BR-163; CNPq: Brasília, Brazil, 2005; pp. 67–187. ISBN 8586821632. [Google Scholar]
  51. INPE PRODES—Monitoramento da Floresta Amazônica Brasileira por Satélite. Available online: http://www.obt.inpe.br/OBT/assuntos/programas/amazonia/prodes (accessed on 15 December 2018).
  52. INPE Monitoramento da floresta Amazônica Brasileira por satélite. Available online: http://www.obt.inpe.br (accessed on 15 October 2018).
  53. Therneau, T.M.; Atkinson, E.J.; Foundation, M. An Introduction to Recursive Partitioning Using the RPART Routines. Available online: https://cran.r-project.org/web/packages/rpart (accessed on 13 June 2018).
  54. Team R.C. A Language and Environment for Statistical Computing; R Foundation for Statistical Computing: Vienna, Austria, 2017. [Google Scholar]
  55. Therneau, T. A Short Introduction to Recursive Partitioning; Orion Technical Report 21.; Stanford University, Department of Statistics: Stanford, CA, USA, 1983. [Google Scholar]
  56. Pfaff, A.; Robalino, J.; Reis, E.J.; Walker, R.; Perz, S.; Laurance, W.; Bohrer, C.; Aldrich, S.; Arima, E.; Caldas, M.; et al. Roads & SDGs, tradeoffs and synergies: Learning from Brazil’s Amazon in distinguishing frontiers. Economics 2018, 12, 1–26. [Google Scholar]
  57. Soares Filho, B.; Nepstad, D.; Curran, L.M.; Cerqueira, G.C.; Garcia, R.A.; Ramos, C.A.; Voll, E.; McDonald, A.; Lefebvre, P.; Schlesinger, P. Modelling conservation in the Amazon basin. Nature 2006, 440, 520. [Google Scholar] [CrossRef]
  58. Cattaneo, A. Deforestation in the Brazilian Amazon: Comparing the Impacts of Macroeconomic Shocks, Land Tenure, and Technological Change. Land Econ. 2001, 77, 219–240. [Google Scholar] [CrossRef]
  59. Hargrave, J.; Kis-Katos, K. Economic Causes of Deforestation in the Brazilian Amazon: A Panel Data Analysis for the 2000s. Environ. Resour. Econ. 2013, 54, 471–494. [Google Scholar] [CrossRef]
  60. Schielein, J.; Börner, J. Recent transformations of land-use and land-cover dynamics across different deforestation frontiers in the Brazilian Amazon. Land Use Policy 2018, 76, 81–94. [Google Scholar] [CrossRef]
  61. Assunção, J.; Gandour, C.; Rocha, R. Deforestation Slowdown in the Brazilian Amazon: Prices or Policies? Environ. Dev. Econ. 2015, 20, 697–722. [Google Scholar] [CrossRef]
  62. Richards, P. It’s not just where you farm; It’s whether your neighbor does too. How agglomeration economies are shaping new agricultural landscapes. J. Econ. Geogr. 2018, 18, 84–110. [Google Scholar] [CrossRef]
  63. IBAMA - Instituto Brasileiro do Meio Ambiente e dos Recursos Naturis Renováveis. Available online: https://www.ibama.gov.br/relatorios (accessed on 12 June 2018).
  64. Barona, E.; Ramankutty, N.; Hyman, G.; Coomes, O.T. The role of pasture and soybean in deforestation of the Brazilian Amazon. Environ. Res. Lett. 2010, 5, 024002. [Google Scholar] [CrossRef]
  65. Richards, P.D.; Walker, R.T.; Arima, E.Y. Spatially complex land change: The indirect effect of Brazil’s agricultural sector on land use in Amazonia. Glob. Environ. Chang. 2014, 29, 1–9. [Google Scholar] [CrossRef] [PubMed]
Figure 1. Study sites.
Forests 10 00464 g001
Figure 2. Game board. Eight scenarios resulting from changes in agricultural price, production cost, and frequency of environmental inspection.
Forests 10 00464 g002
Figure 3. Decision trees of the farmer groups: (A) Large cattle ranchers tree, (B) Small dairy farmers tree, and (C) Small agricultural landholders. The most relevant land-use decision factors (i.e., agricultural prices, production costs, or environmental-inspection probabilities) are displayed at the top of the tree. Only significant decision factors are displayed. Colored boxes represent the most frequent land-use change decision under each scenario. Absolute numbers displayed inside colored boxes represent the distribution of the decisions among farmers and correspond to the decisions in each tree’s legend (e.g., .00, .50, .14, .36, and .00 in red box “clearing” of the cattle ranchers group correspond to “activity shift”, “clearing”, “intensification”, “maintenance”, and “selling/leasing” decisions, respectively).
Forests 10 00464 g003
Figure 4. The dispersion charts of the land-use change decisions revealed by each group of producers under the game scenarios. (A) the land use decisions from the group of Large soybean farmers, (B) Large cattle ranchers, (C) Small agricultural landholders, and (D) Small dairy farmers.
Forests 10 00464 g004
Table 1. Focal groups of farms by municipality and main drivers of forest loss.
SiteProducer GroupQuantity Based on CAR ¹Drivers of Land Use Change
SinopLarge soybean farmers25Sinop has relatively better infrastructure and is well connected to neighboring municipalities. It is considered a regional reference center for agricultural services and trade. Main land-use change drive is soybean, particularly involving the conversion of pastures to cropland [16,17,52].
Large cattle ranchers15
Small agricultural landholders946
Small dairy farmers101
Guarantã do NorteLarge soybean farmers4Guarantã do Norte is part of a milk-production belt in Mato Grosso. Main land-use change drives are soybean (much of it replacing old pastures) and cattle ranching [17,52].
Large cattle ranchers25
Small agricultural landholders64
Small dairy farmers499
Novo ProgressoLarge soybean farmers3Cattle ranching is the main land use in Novo Progresso. Mining and logging, targeting international markets, have expanded recently and became important components of the local economy. Main land-use change drivers are soybean and cattle ranching, in addition to logging and gold mining [17,52].
Large cattle ranchers163
Small agricultural landholders206
Small dairy farmers1210
¹ Rural Environmental Registry.
Table 2. The eight scenarios resulted from variations in agricultural prices, production cost, and frequency of environmental inspection. Variations were based on ongoing values for prices and costs and producers’ perception of inspection frequencies.
ScenarioAgricultural PricesProduction CostsEnvironmental Inspection Intensity ¹
1HighLowHigh
2HighHighHigh
3HighLowLow
4HighHighLow
5LowLowHigh
6LowHighHigh
7LowLowLow
8LowHighLow
¹ Low and high intensities correspond to environmental inspection probabilities of 0%–39% and 40%–100%, respectively.
Table 3. Distribution of farmer groups in the study sites.
Producers’ Groups% of Total Interviewees
SinopGuarantã do NorteNovo Progresso
Large soybean producers21%5%25%
Large cattle ranchers11%5%55%
Small agriculturalists66%25%8%
Small dairy farmers2%65%12%
Table 4. Mode (minimum and maximum) values of real, high, and low agricultural prices.
Farmers Group (Product)Current Values ¹ (Brazilian Real)High Values (Brazilian Real)Low Values (Brazilian Real)
Large soybean producers (60 kg sack of soybeans)49 (46–60)75 (70–81)45 (40–55)
Small agricultural landholders (60 kg sack of soybeans)55 (50–55)75 (65–80)45 (43–48)
Cattle ranchers (15 kg of beef)110 (108–115)130 (130–160)100 (100–110)
Small dairy farmers (liter of milk)1.10 (100–120)1.30 (120–150)1.00 (100–110)
1 Common unit of measurement for beef.

