Article

Evaluation of Forest Conversion Effects on Soil Erosion, Soil Organic Carbon and Total Nitrogen Based on 137Cs Tracer Technique

1
Co-Innovation Center for Sustainable Forestry in Southern China of Jiangsu Province, Key Laboratory of Soil and Water Conservation and Ecological Restoration of Jiangsu Province, Nanjing Forestry University, Nanjing 210037, China
2
Nanjing Institute of Environmental Sciences, Ministry of Ecology and Environment, Nanjing 210042, China
*
Author to whom correspondence should be addressed.
Forests 2019, 10(5), 433; https://doi.org/10.3390/f10050433
Submission received: 8 April 2019 / Revised: 3 May 2019 / Accepted: 13 May 2019 / Published: 20 May 2019

Abstract

:
Soil erosion can affect the horizontal and the vertical distribution of soil carbon at the landscape scale. The 137Cs tracer technique can overcome the shortcomings of traditional erosion research and has proven to be the best method to study soil erosion. To understand the responses of soil organic carbon and nitrogen to soil erosion and forest conversion in the development of slope economic forests in rocky mountain areas, three representative types of economic forests that were all formed after clear-cutting and afforestation on the basis of CBF (coniferous and broad-leaved mixed forests) were selected: CF (chestnut forests) with small human disturbance intensity, AF (apple forests), and HF (hawthorn forests) with high interference intensity. The results showed that all land use types have significantly eroded since 1950; the average annual loss of soil was 0.79 mm in the CBF, 2.31 mm in the AF, 1.84 mm in the HF, and 0.87 mm in the CF. The results indicated aggravation of soil erosion after the transformation of the CBF into an economic forest. The economic forest management reduced the average carbon storage and accelerated nutrient loss. The better vegetation coverage and litter coverage of CF made them stand out among the three economic forest varieties. Therefore, when developing economic forests, we should select species that can produce litter to ensure as much soil conservation as possible to reduce the risk of soil erosion.

1. Introduction

Forest ecosystems play a significant role in climate change mitigation by the uptake of a substantial portion of carbon dioxide (CO2) from the atmosphere as well as their long-term deposition into biomass and soil [1,2]. Afforestation has proven to be an effective method for increasing C stocks [3,4,5]. However, the growth of the economy and the population drove up demand for forest products, facilitating forest conversion. Many studies showed that such forest conversion (i.e., forest-for-economic forest) may lead to soil erosion and other ecological problems [6,7]. Similarly, soil erosion—which is a worldwide problem with both social and environmental consequences—has proven to lead to lateral and vertical migration of nutrients [8].
The dynamic research on soil carbon and nitrogen storage and migration has attracted increasingly more scholars’ attention worldwide [9,10,11]. In recent years, scholars have carried out extensive studies on the effects of soil erosion on soil organic carbon in sloping farmland [12,13,14,15,16,17,18,19,20]. However, few studies have been reported on soil erosion caused by forest transformation and the horizontal migration of soil nutrients. Therefore, it was necessary to systematically study how SOC (soil organic carbon) and TN (total nitrogen) respond to soil erosion after forest conversion.
China has the greatest area of forest plantations on a global scale, consisting of one fourth of the total plantation area [21]. Since the 1960s, the area of forests has rapidly increased to satisfy the ever-growing requirements for wood and other forest products in northeastern China, which has led to a series of serious ecological and environmental problems, such as soil erosion (especially water erosion) [22]. After transforming forests into economic forests, the structure of forests become uniform. Climate, biomass production, and plant distribution can also be totally changed [23,24,25]. Researchers have found reductions in soil C storage following forest conversion from natural forests to plantations [26,27]. In order to facilitate forest management, shrubs and weeds in forests are often removed. Such a change of vegetation cover can affect both the biological and the chemical properties of the soil, such as belowground C and nutrient storage [28]. Previous studies have also reported that water erosion is a pivotal process that can affect the horizontal migration and the redistribution of SOC and TN [29,30]. However, there have been few reports on how natural forest conversion into economic forests affects soil erosion, SOC, and TN. This is an important environmental issue that has not been well quantified.
Soil erosion caused by man-made, forced interference has received more and more attention [31,32,33,34,35]. Most of these studies made use of traditional RUSLE (revised universal soil loss equation) and evaluated large-scale changes in soil erosion intensity and spatial patterns by remote sensing and GIS. Traditional erosion research methods often miss information such as the soil erosion process and the land use change [36,37], while the 137Cs tracer technology can overcome the shortcomings of traditional erosion research [38]. Under the background of global large-scale nuclear explosion tests in the 1950s and the 1970s, the 137Cs tracer method was developed, and it has been widely used in soil erosion research at different spatial scales around the world since the 1990s [20,39]. This method has the characteristics of simplicity, high quantification degree, low research cost, and reliable results. It has been proven to be the best method to study soil erosion [40].
In this study, the goal was to explore the influence of forest conversion on soil erosion and carbon and nitrogen migration by using 137Cs in order to provide a theoretical basis for the further rational utilization and protection of soil resources and to assist the in-depth study on the regional carbon and nitrogen balance. The specific goals were to answer the following questions: (a) How do the characteristics of soil thickness and nutrient change with forest conversion? (b) How does forest conversion affect the vertical distribution characteristics of soil organic carbon and total nitrogen after forest conversion? (c) How does the storage of SOC and TN change after forest conversion? (d) Through the comparison of the studied forest types, which is the best forest type for conversion? In order to assess how forest conversion into economic forests affects soil erosion as well as SOC and TN, this study chose the study area of the great Wu mountain valley. The basin is situated at the starting point of the Belt Road, Lianyungang, which was originally a coniferous and broad-leaved mixed forest (CBF). However, in the 1970s, the economic forest should have transformed in a short time.

2. Materials and Methods
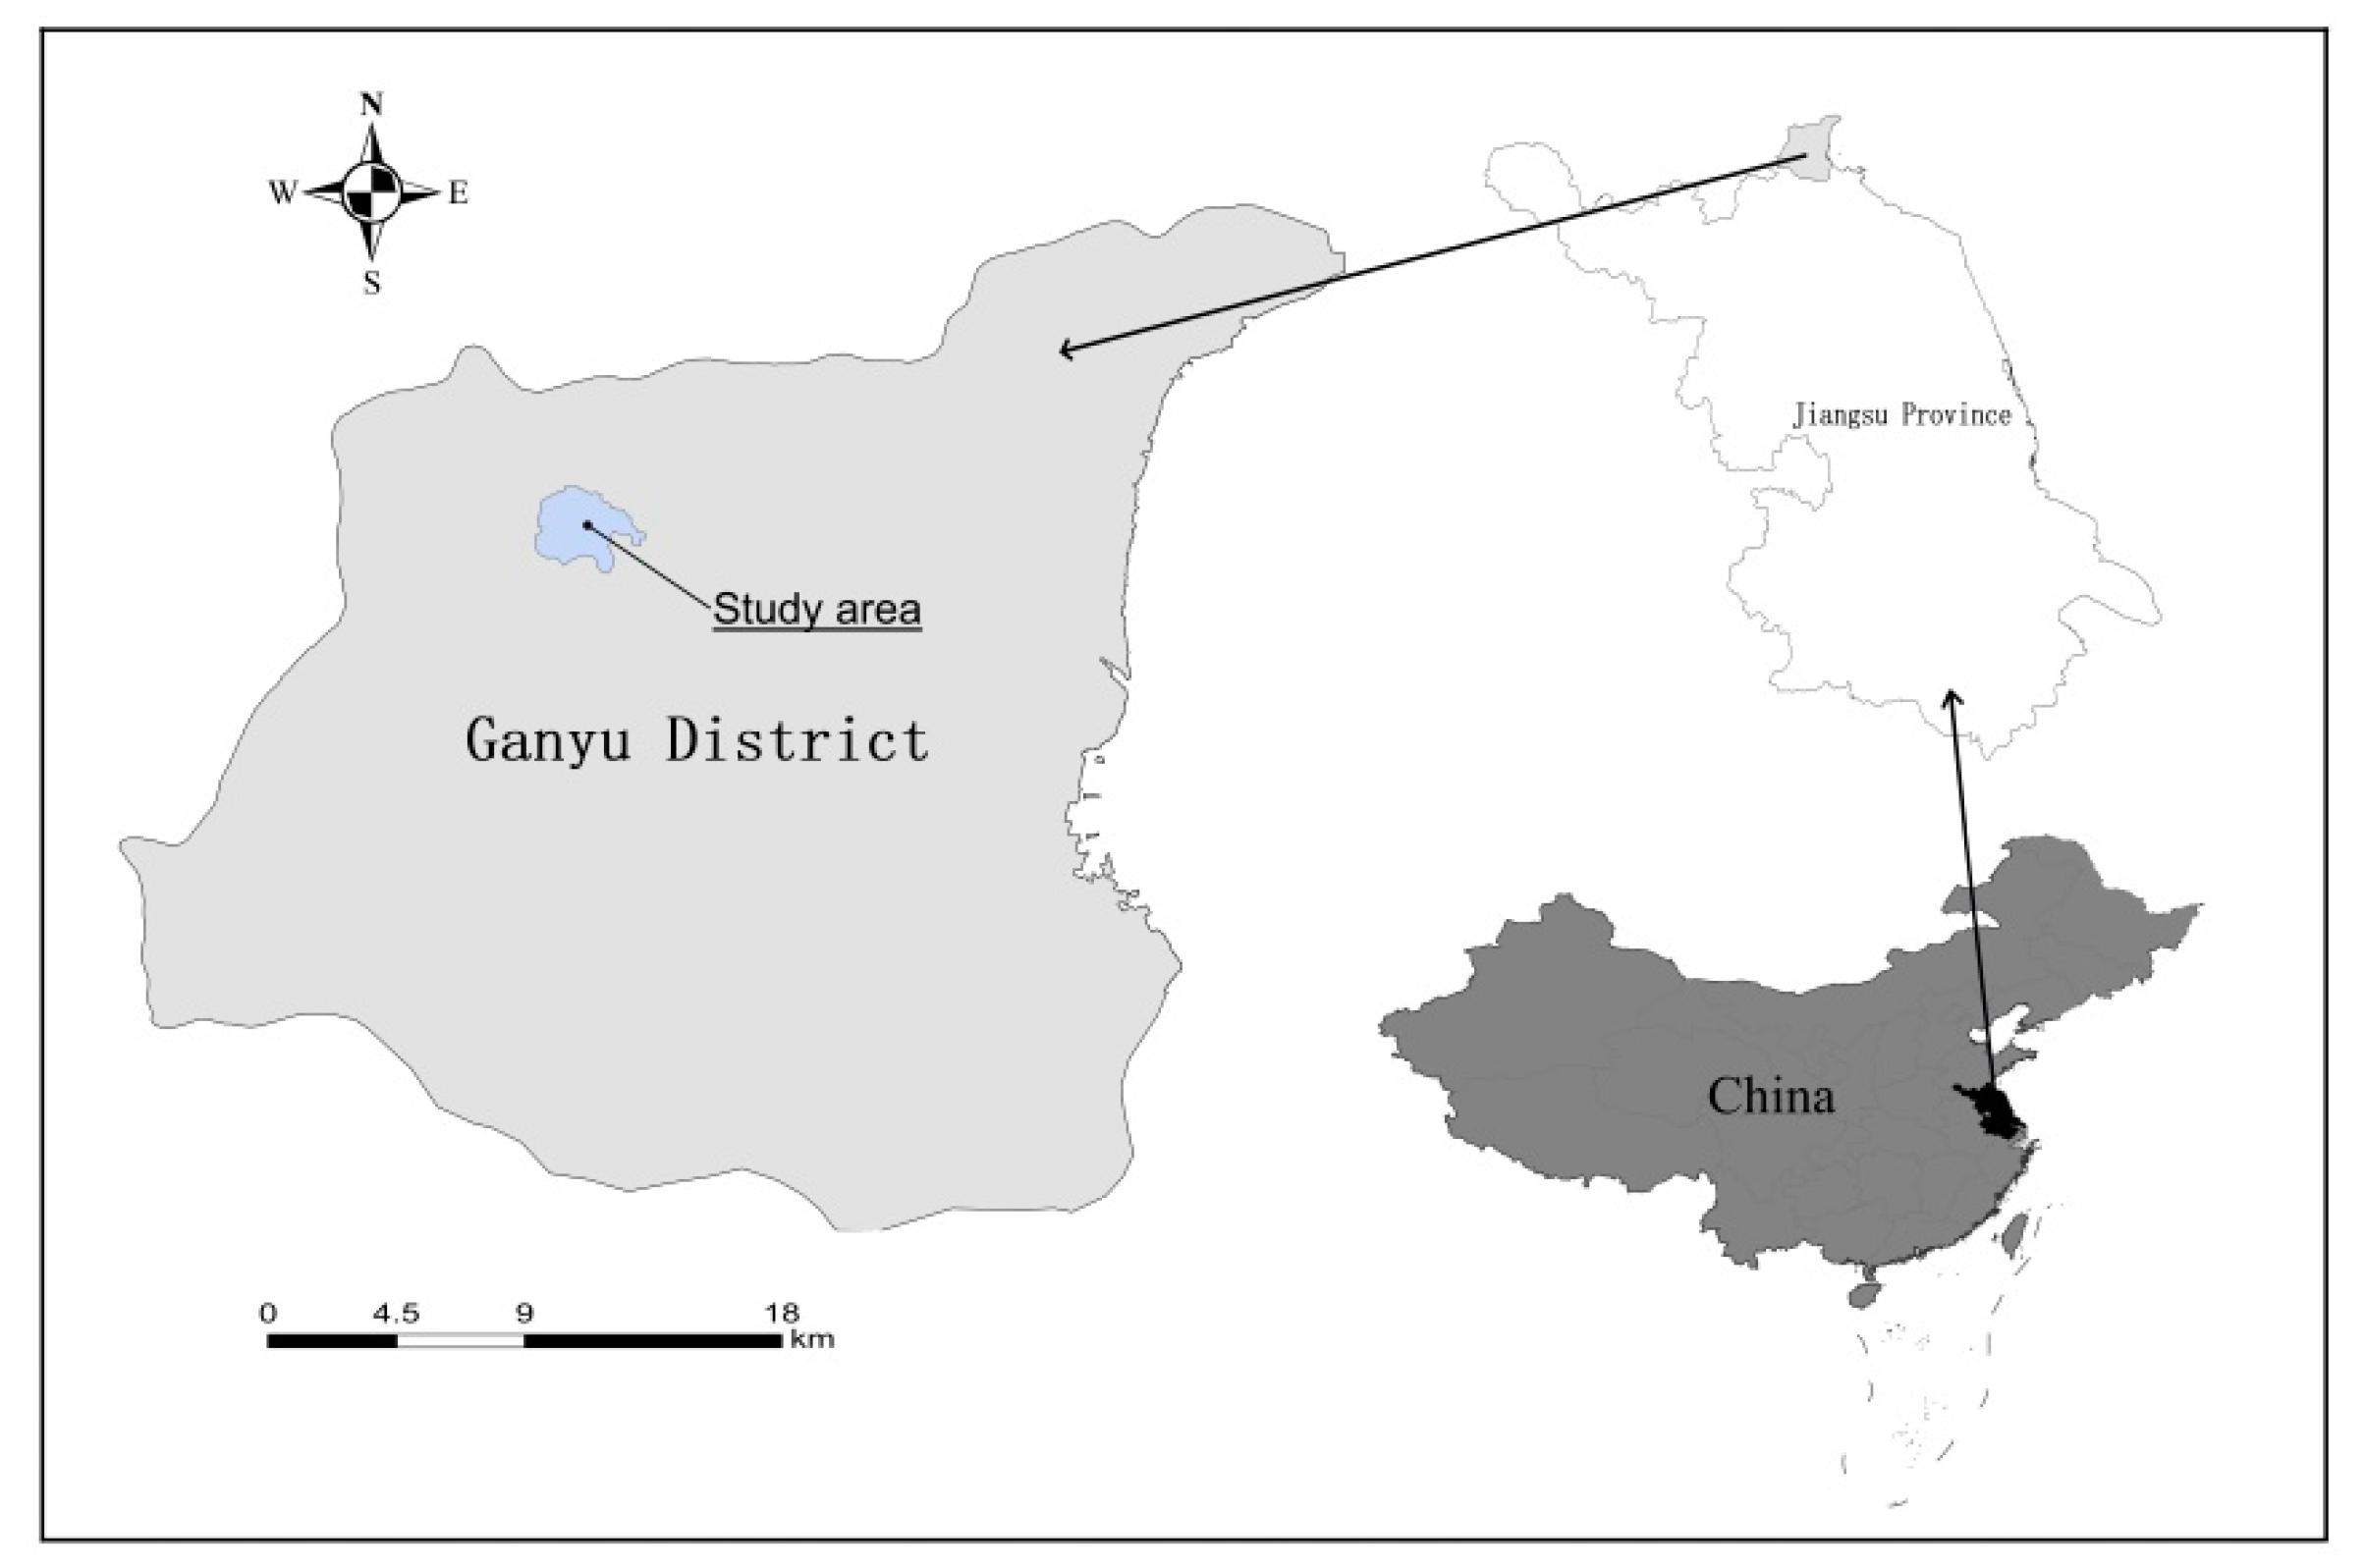
2.1. Study Sites

Dawu Mountain (35°11′ E, 118°50′ N) is located in the northwest of Ganyu District, Lianyungang, Jiangsu province, Southeast China (Figure 1). It belongs to a warm-temperate maritime monsoon climate with four distinct seasons, an average annual temperature of 13.9 °C, an annual rainfall of 976.6 mm, a frost-free period of 216 days, and average annual sunshine of 2534 h. The soil is a subcategory of coarse-grained brown soil with more sand and gravel in the topsoil. The vegetation is a temperate deciduous broad-leaved forest area dominated by artificial forests, supplemented by a small amount of natural deciduous broad-leaved forests and evergreen coniferous forests, including secondary vegetation such as Masson pine, broad-leaved trees, and arborvitae, and economic trees such as hawthorn and chestnut. Most of the research area was originally planted on the open forestland at the end of the 20th century. By the beginning of the 21st century, part of the plantation forest was in a state of natural regeneration, and some plantations were transformed into economic forests. In the experimental area, coniferous and broad-leaved mixed forests are the representative stand types of planted forests. The main tree species include Pinus massoniana Lamb., Platycladus orientalis (L.) Franco, sapling trees, and Metasequoia glyptostroboides Hu et W. C. Cheng, and there are herbs and humus layers under the forest. The hawthorn forest, the chestnut forest, and the apple forest are all economic forests that have been transformed by a mixed forest of coniferous and broad-leaved forest in which the surface of the chestnut forest is covered with litter, the surfaces of the hawthorn and the apple forests are exposed, and there are obvious artificial tilling traces. Basic information of different land use types was shown in Table 1.
In July 2016, field sampling was conducted to avoid the influence of topography, landforms, and elevation on the results of the study. Based on field surveys, the same parent material and relative geographical location were selected on the slope according to the principles of typicality and representativeness. According to the principles of typicality and representativeness, three sites, each of which has the same parent material and relatively centralized geographical location, were selected on the sloping land, including the HF (hawthorn forest), the AF (apple forest), the CF (chestnut forest), and the CBF. The three economic forests (HF, AF, and CF) were all formed after clear-cutting and afforestation on the basis of coniferous and broad-leaved mixed forests. The CBF was replanted after the replanting of the woodland. The forest age is approximately 10 years, and the slope is 10°~15°, from which it can be assumed that the soil properties of all the plots were similar before the economic forest regeneration. The CBF is an artificial forest with no interference. The CF is an economic forest with less human interference intensity, while the HF and the AF are economic forests with greater interference intensity.

2.2. Sampling and Measuring Methods

Using the S-shaped sampling strategy, five sampling points in each sample were placed. The soil samples were collected by 0–10, 10–20, and 20–30 cm, and the same soil samples were mixed into three layered soil samples. At the same time, the soil samples were collected using a 100 cm3 standard ring knife. In order to determine the content of the nuclide in the soil, the whole sample of the 0–20 cm soil and the spaced 5 cm stratified sample were collected with the diameter of a 5 cm soil drill. After returning to the laboratory, the soil sample collected by the non-earth drills was naturally air-dried, and plant debris, small stones, and organisms were removed. Some of them were kept, as they were found along the natural cracks to form small clusters of approximately 1 cm3 to classify the aggregates. The other part was milled through a 2 mm sieve and was used for the determination of soil-related properties. After removing the stone weeds, the soil samples used for the determination of isotopes were naturally air-dried after being ground through a 20-mesh sieve, dried in an oven at 105 °C to a constant weight, cooled to room temperature, and weighed with a precision of 0.001 g (ultimately weighing 300 g).
The physical and the chemical properties of the soil were measured according to the national standard. The soil bulk density was measured by the ring knife method. The pH was measured by an acidity meter. The total nitrogen, carbon, and nitrogen ratio and the ratio of carbon and hydrogen were measured by the element analyzer. The organic carbon content of the soil was oxidized with the potassium dichromate-external heating method. The mechanical composition was measured by a laser particle size analyzer (grading standard: 0.002, 0.05, and 2 mm). The specific surface area of the soil was analyzed using an ASAP2020 automatic surface area and pore size distribution analyzer (Micromeritics Instrument Corp, Atlanta, GA, USA). The soil water-soluble organic carbon was determined by weighing 5 g over a 2 mm screen soil in a 100 mL centrifuge tube, adding 25 mL of water, shaking, centrifuging, and taking the supernatant and filtering with a 0.45 µm microporous membrane to obtain the solution. At last, it was poured into a TOC (total organic carbon) sample tube and measured on a Shimadzu TOC-VCPH automatic analyzer [41]. The test of the nuclide 137Cs used the background gamma spectrometer produced by the ORTEC Company (Dallas, TX, USA) of the United States and the C coaxial high pure germanium probe of the type GEM-40190 of the probe. The measurement time of each sample was 25,000 s, and the specific activity of the soil sample was calculated by a comparison with the standard source.

2.3. Calculation of the Soil 137Cs

In this study, the top of Dawu Mountain was chosen as the background value point because there was no artificial activity on the top of the mountain, and the terrain was flat. The woodland structure i0s dominated by arbors, and the meadows are dominated by Pinus massoniana. Through the determination of two background value sampling points, the background value of 137Cs was determined to be 1732.48 Bq/m2. The 137Cs content in soil was calculated using Formula (1).
C P I = i = 1 n 1000 × C i × B d i × D i
CPI is 137Cs per unit area activity of the sampling point, Bq/m2; i is the sampling sequence number; n is the sampling layer number; 1000 is the unit correction factor; Ci is the specific activity of 137Cs in the sampling layer i, Bq/kg; Bdi is the soil bulk density of the sampling layer of layer i, g/cm3; Di is the depth of sampling layer I, m.
The soil erosion modulus was calculated using the following models:
A ( d ) = A r e f ( 1 e λ d )
h = 1 ( t 1963 ) λ ln [ ( 1 Y 100 ) ]
Y = 100 ( A r e f A ) / A r e f
E R = 10000 × h × D
A(d) is the total area activity of the soil above depth d, Bq/m2; Aref is the 137Cs area activity background value, Bq/m2; λ is the profile index of 137Cs depth distribution, cm−1. T is the sampling year; Y is the 137Cs area activity of the measured relative background value reduction percentage, %, D is the soil bulk density, g/cm3; h is the erosion of years of erosion thickness, m/a; ER is the soil erosion modulus, t/(km2·a).

2.4. Calculation the Storage and Loss of Soil Carbon and Nitrogen

The xth nutrient density per unit soil area is:
D x = 0.01 i = 1 n C i × d i × b i
where Dx is the xth nutrient density (g/m2); Ci is the xth nutrient content in the soil i layer (g/kg); bi is the bulk density of the i layer soil (g/cm3); di is the thickness of the i layer of soil (cm).
The absolute loss of the xth nutrient per unit area is:
L X = 10 × C X × D × h
where LX is the absolute loss of the xth nutrient (t/km2); CX is the xth nutrient content in the soil (g/kg); D is the soil bulk density (kg/m3); h is the average annual loss of the soil thickness (m).
The relative loss rate of soil nutrient per unit area:
R = L X / D X
where R is the relative loss rate of the nth nutrient per unit area (%).

2.5. Data Processing and Analysis

Mean values were calculated for each of the variables, and one-way ANOVA was used to evaluate forest type and soil depth on the measured variables for pairwise comparison. The least significant difference (LSD) test was used for mean comparison of two forest types at the same soil depth and different soil depth in the same forest type at p < 0.05. The relationships between the 137Cs and SOC or TN were evaluated by Pearson’s correlation analysis. These statistical analyses were completed with the R language (Vienna University: Vienna, Austria) and SPSS 19.0. (SPSS Inc: Chicago, IL, USA). The graphics were plotted with Origin software (Publisher: city, country OriginLab: Northampton, MA, USA).

3. Results

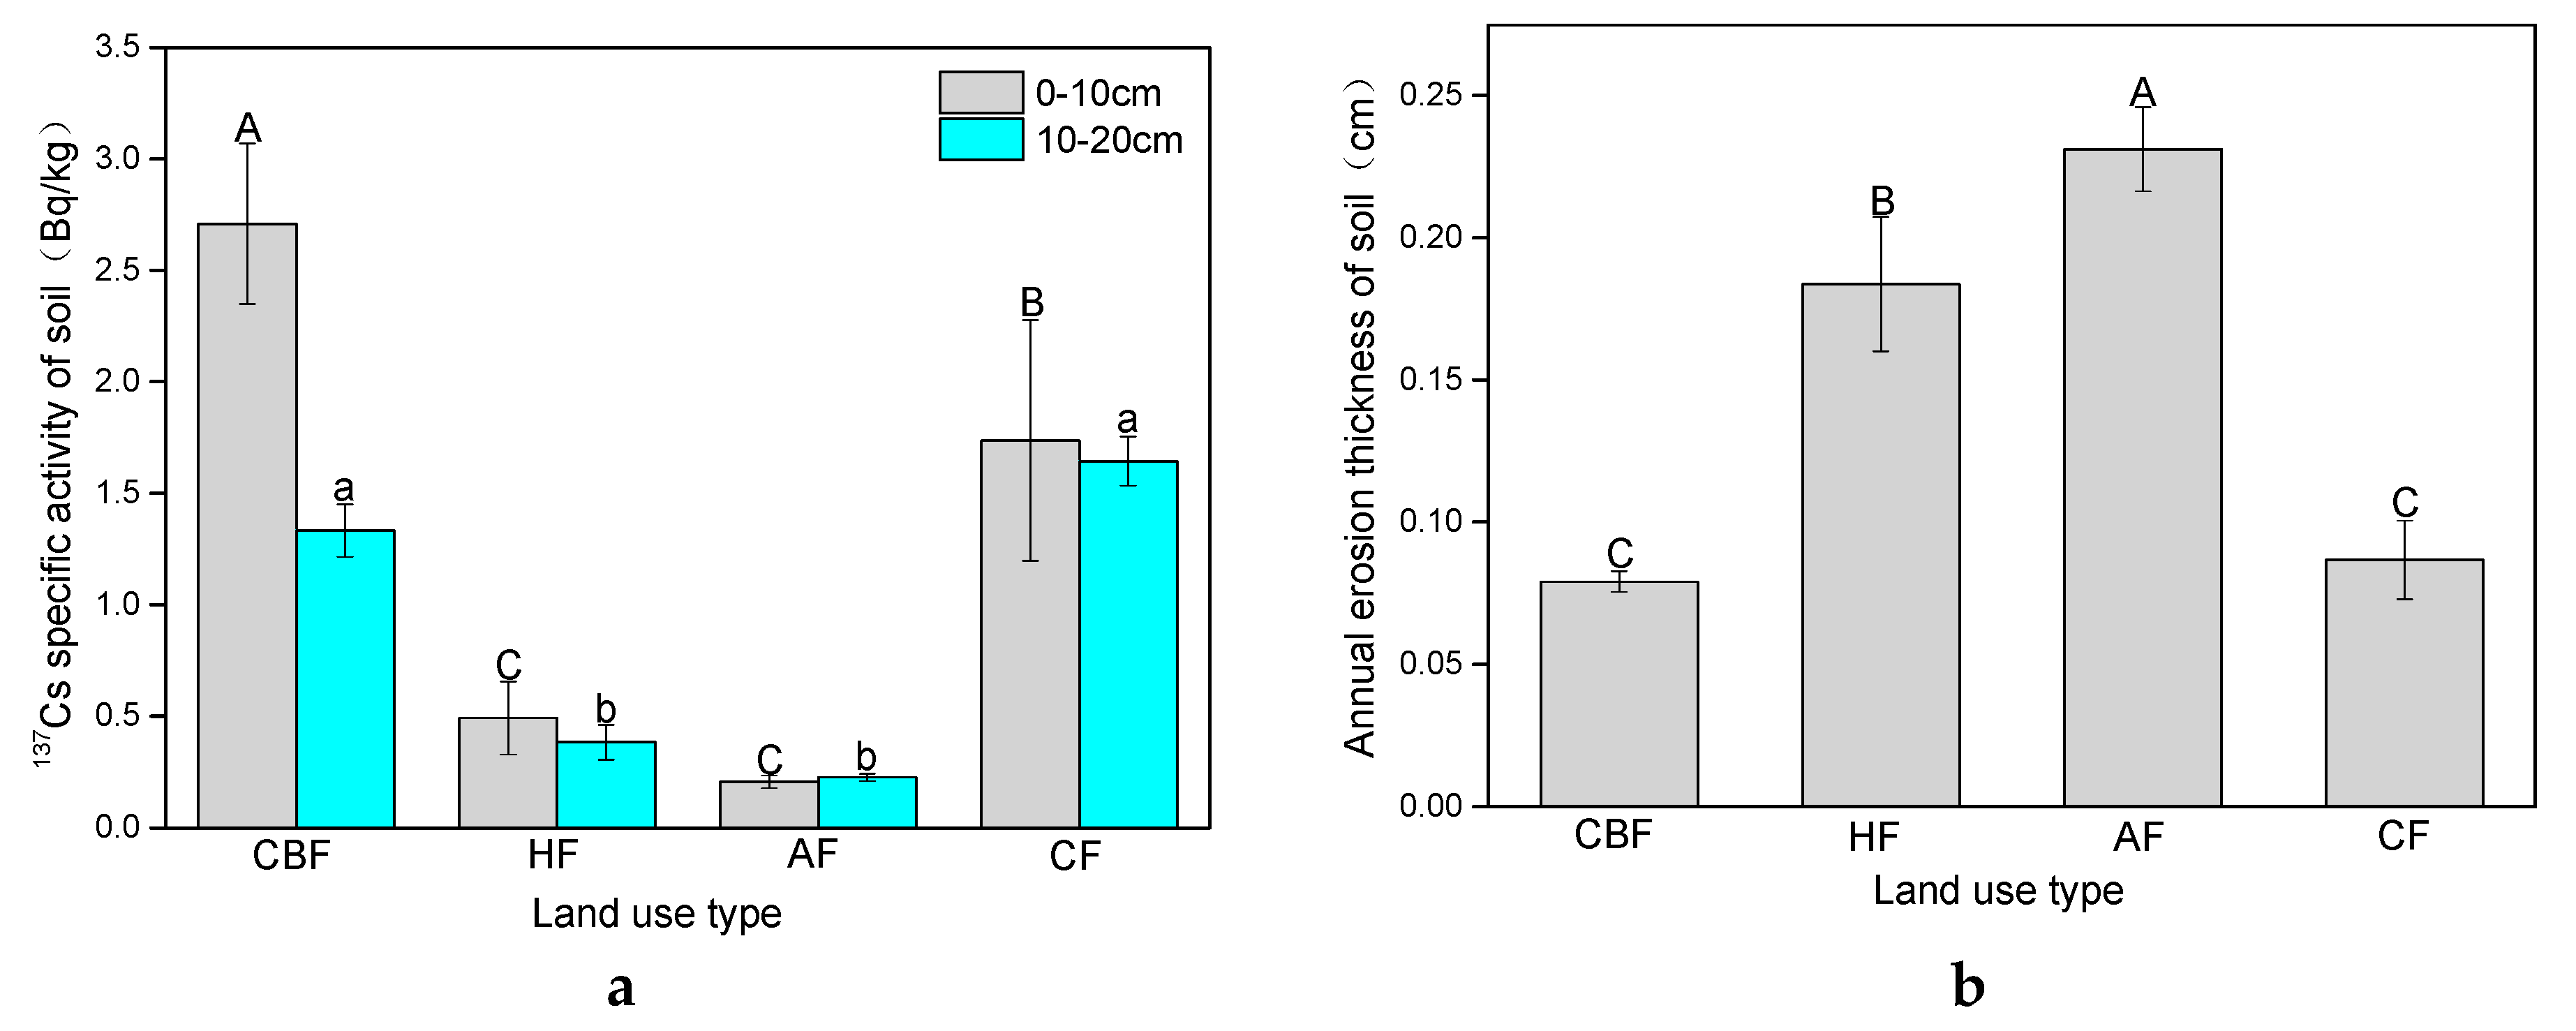
3.1. Characteristics of 137Cs and Annual Erosion Modulus after Forest Conversion.

In comparison with the CBF, the specific activity of the 137Cs decreased to 92%, 82%, and 36% at the 0–10 cm soil depth in AF, HF, and CF, respectively (Figure 2A). The CBF had the largest difference between the two soil layers, with the 0–10 cm layer 2.04 times that of the 10–20 cm layer. The specific activities of the 137Cs in CH and CF were 1.28 and 1.06 times greater in 0–10 cm layer compared to the 10–20 cm layer, respectively. The results of the LSD analysis showed that, in the 0–10 cm soil layer, the average 137Cs activity of the soil in CBF was significantly greater than that of the other three land use depths. In the 10–20 cm soil depth, the average 137Cs specific activities in CBF and CF were significantly higher than those in HF and AF.
Compared with the background value, the 137Cs content of all land use types was significantly lower than the background value of 1732.48 Bq·m2. Among them, CBF decreased the least, which was 68.43% (Table 2). AF decreased the most by 96.50%. The annual soil erosion thickness for different land use types followed the order of AF (2.31 mm) > HF (1.84 mm) > CF (0.87 mm) > CBF (0.79 mm). In comparison with the CBF, the annual soil erosion thickness of AF and HF increased 192% and 133%, respectively (Figure 2B). Moreover, the annual soil erosion thickness significantly differed between the CBF and the economic forests (AF and HF). However, there was no significant difference between CBF and CF. The correlation analysis showed that the 137Cs activity in the soil showed a significant positive correlation with the content of soil organic carbon and total nitrogen (p < 0.05) (Table 3).

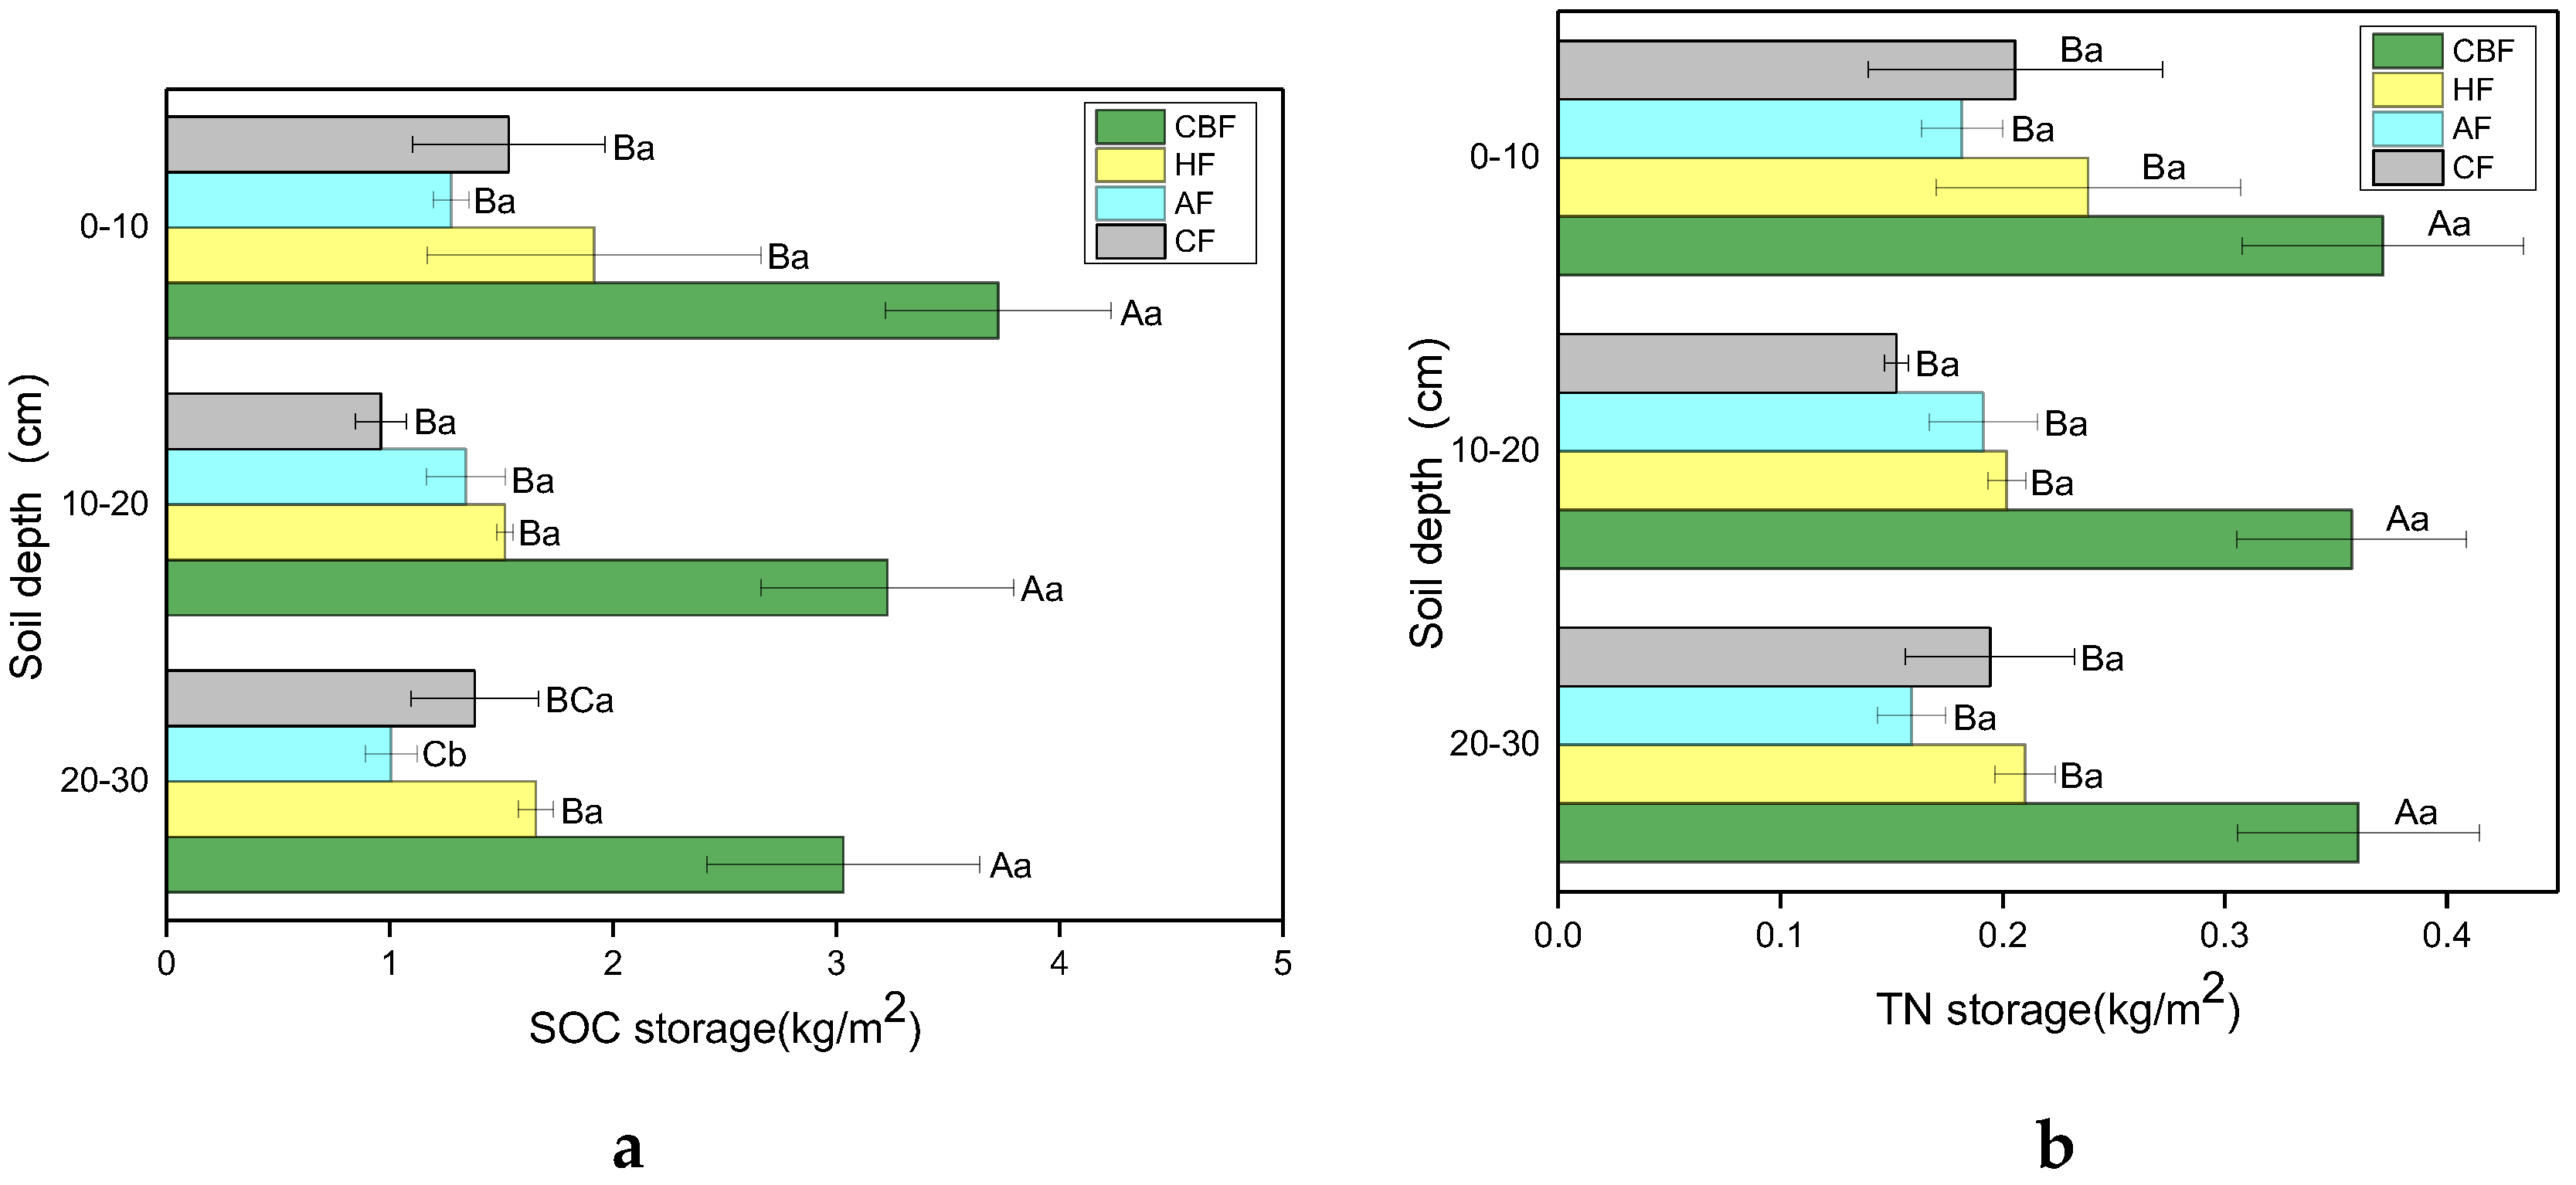
3.2. SOC and TN Storage after Forest Conversion

The average SOC and TN storages in the CBF were 3.33 kg/m2 and 0.36 kg/m2, respectively, and the economic forest management reduced the SOC storage and the TN storage of the soil (Figure 3). In comparison with the CBF, the SOC storage and the TN storage in AF were the lowest, decreasing by 63.66% and 52.78%. The SOC (TN) storages in HF and CF decreased by 49.25% (38.89%) and 61.26% (50%), respectively. The results of the LSD analysis showed that the SOC and the TN storage in different land use types did not change significantly with the soil layers. Among three economic forests, the SOC and the TN storage of the CF were significantly greater than those of the other three types of land use (p < 0.05). In the 20–30 cm soil layer, the SOC storage of the HF was significantly higher than that of the AF (p < 0.05). In the other two layers, there was no significant difference in the SOC storage of the three economic forests.

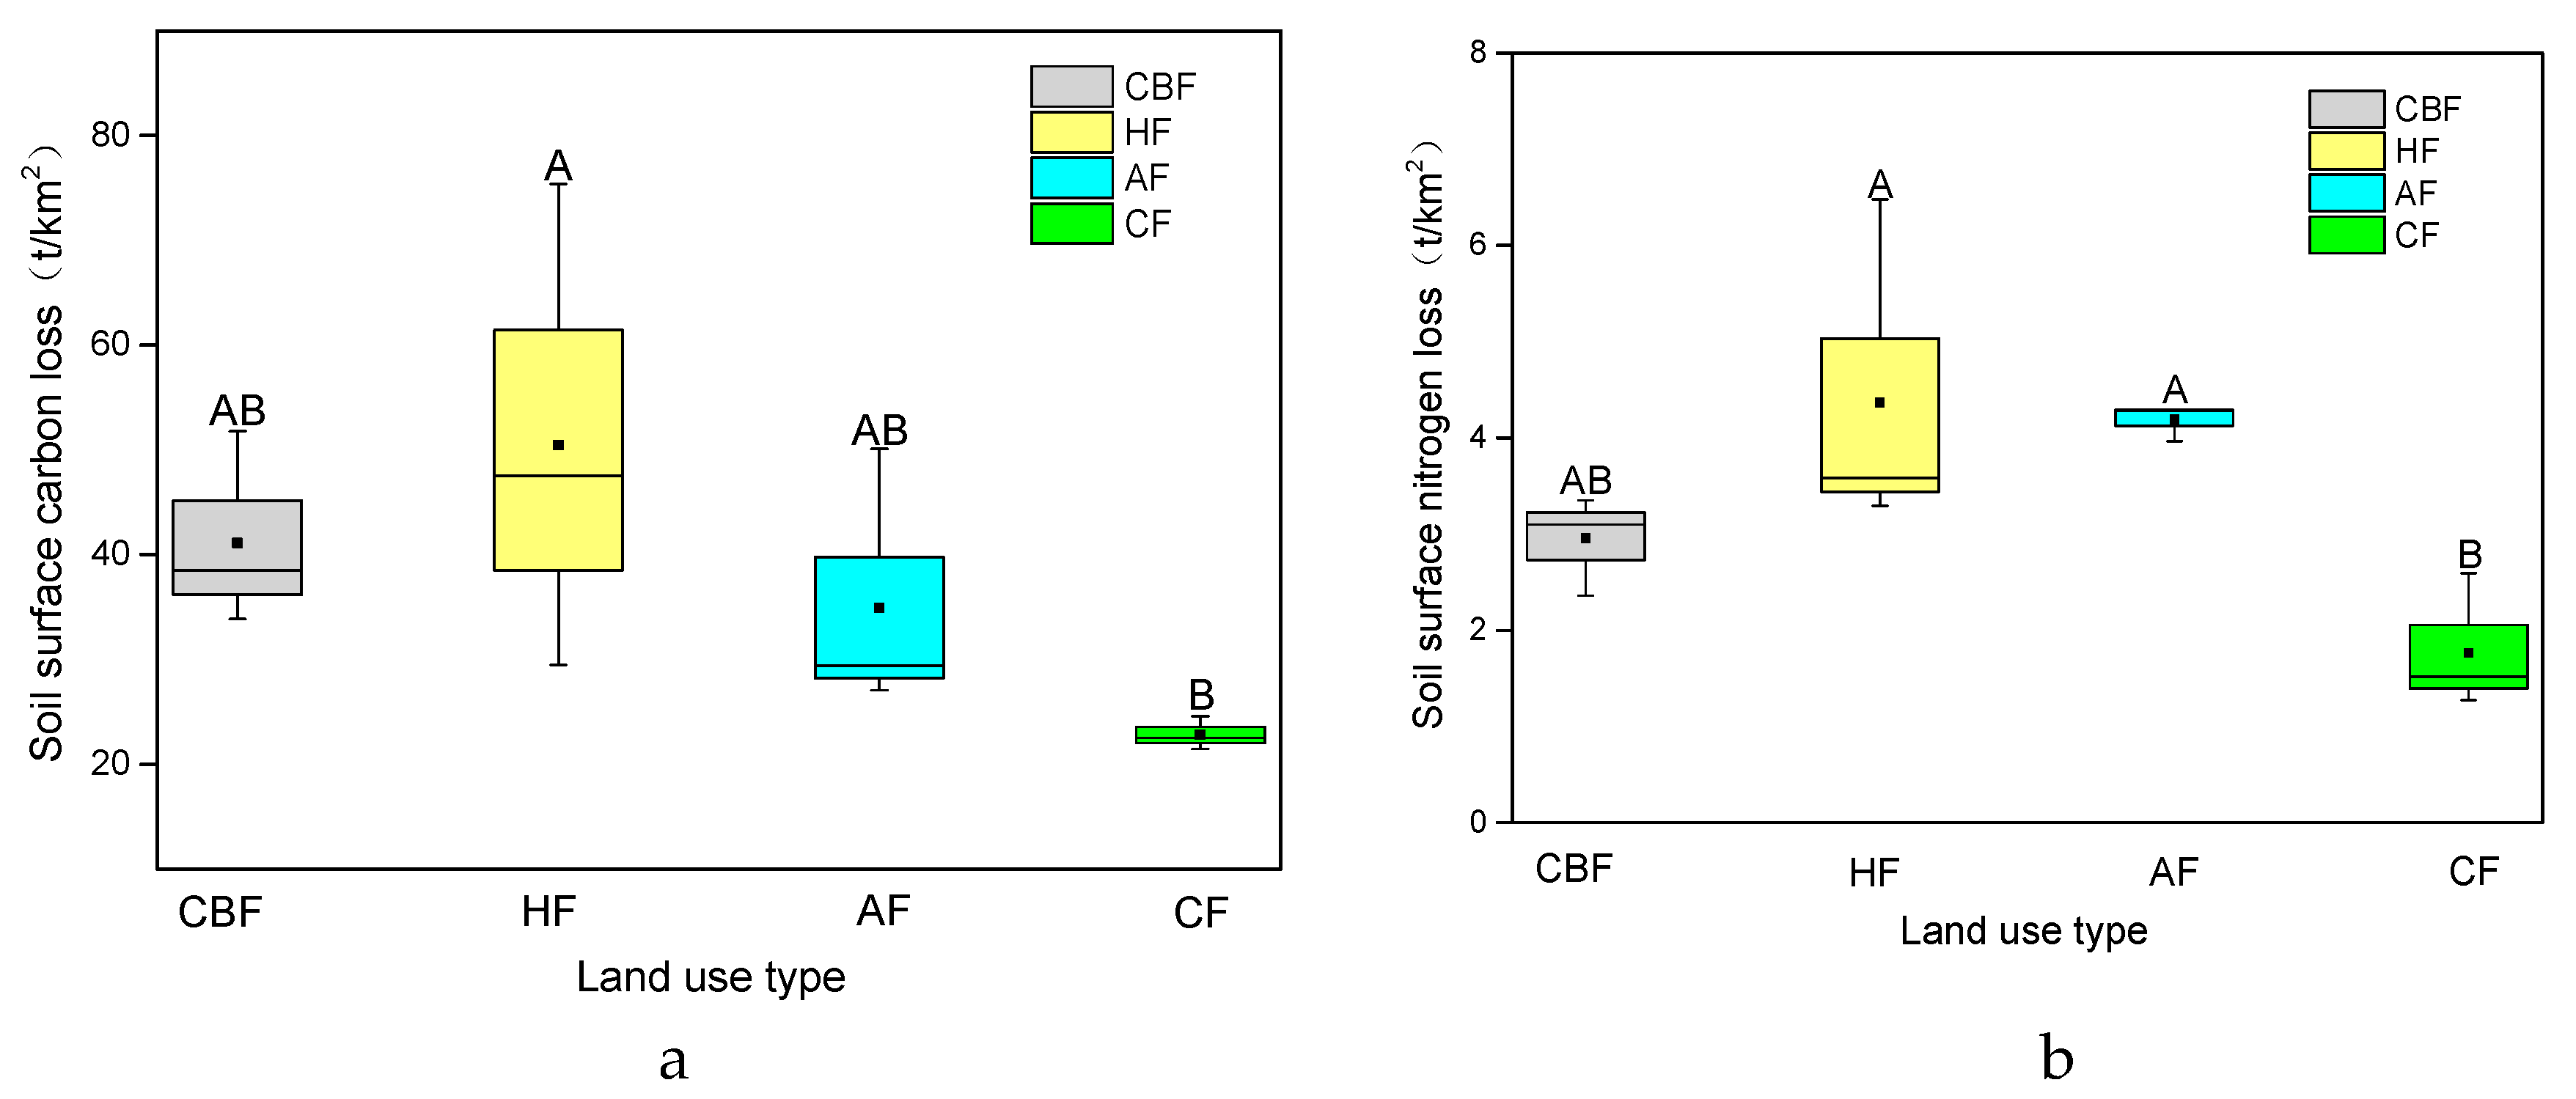
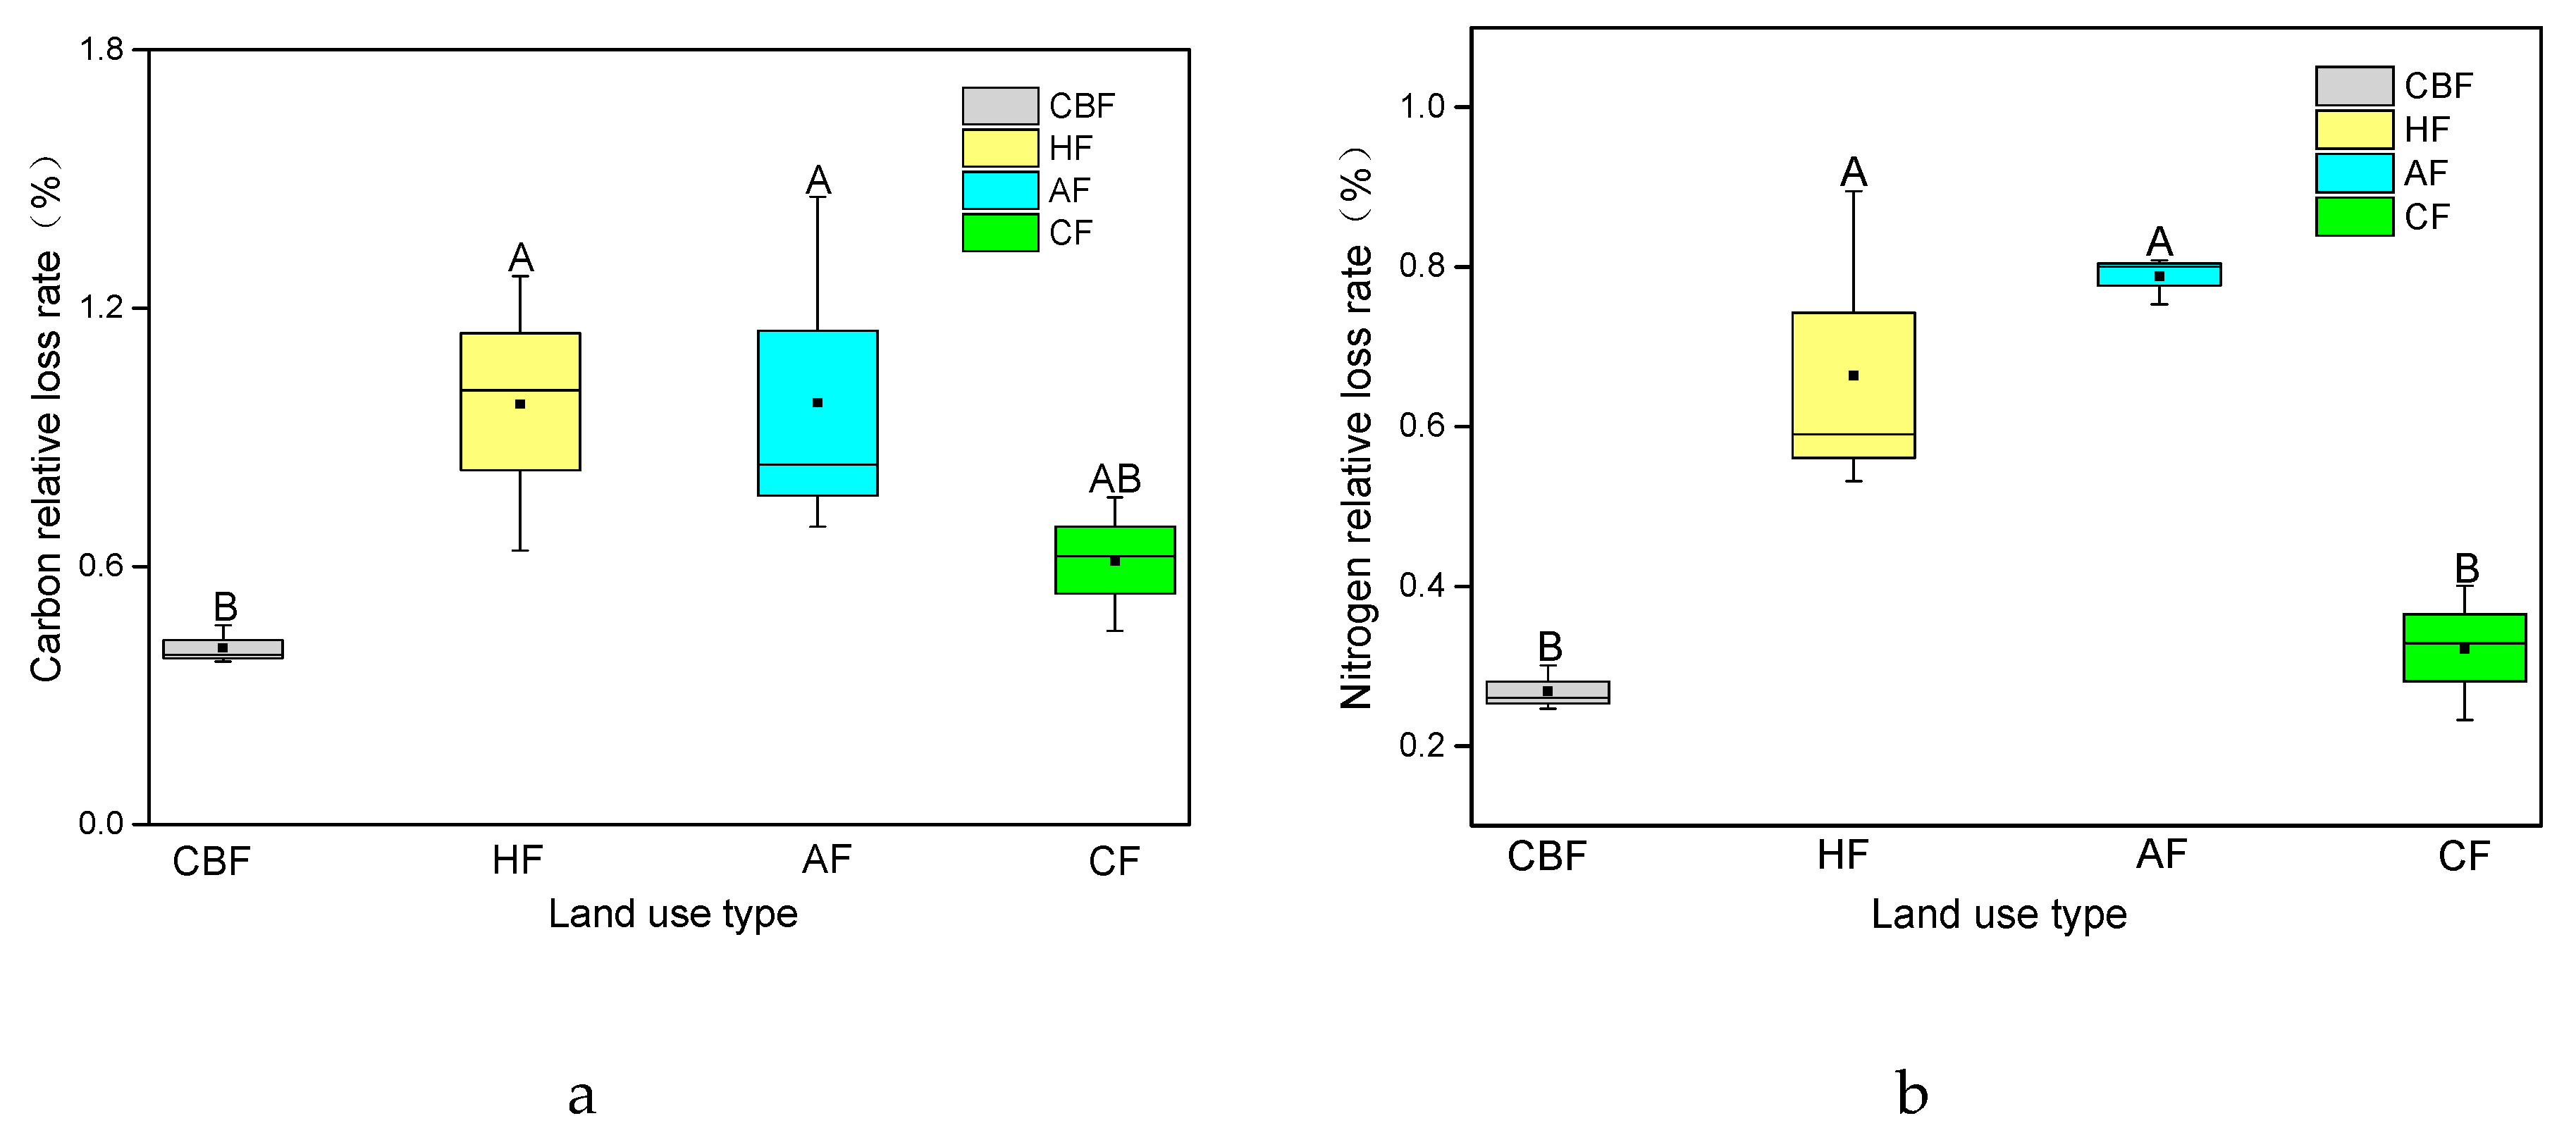
3.3. SOC and TN Losses after Forest Conversion

The annual loss of topsoil carbon in CBF was 41.37 t/km2. HF had the most topsoil carbon loss, which was 50.78 t/km2 (Figure 4A). The results of the LSD analysis showed that the annual loss of topsoil carbon in HF was significantly greater than that in CF. The annual loss of topsoil nitrogen in CBF was 2.95 t/km2 (Figure 4B). The annual loss of topsoil nitrogen in HF, AF, and CF was 1.51, 1.42, and 0.61 that of CBF, respectively. The LSD analysis results showed that the annual loss of topsoil nitrogen of HF and AF was significantly greater than it was for CF (p < 0.05).
As shown in Figure 5A, the annual relative loss rate of SOC in the CBF was 0.41%. The economic forest construction increased the annual carbon soil relative loss rate. In comparison with the CBF, the AF was the largest, being 2.43 times that of the CBF. The annual relative churn rates of HF and CF were 2.36 and 1.49 times that of CBF, respectively. The results of the LSD analysis showed that the rates of the soil carbon loss per year in the soil of HF and AF were significantly greater than that in the CBF soil (p < 0.05).
The annual relative loss of TN in the CBF was 0.27%. The construction of economic forests increased the annual relative loss rate of TN. In comparison with the CBF, the AF loss was the largest—2.93 times that of CBF. The HF and the CF were 2.48 times and 1.19 times that of the CBF, respectively. The LSD analysis results showed that the annual rates of TN loss in the HF and the AF were significantly greater than those in the CF and the CBF (p < 0.05).

4. Discussion

4.1. Soil Erosion after Forest Conversion

The acquisition of the background value was the key to tracing soil erosion by nuclides [42,43]. The background value of 137Cs can be obtained by the long-term monitoring of radioactive settlement, or it can be determined by selecting the correct reference points [44]. In this study, the background value of 137Cs was 1732.48 Bq/m2. Similar research on the Yimeng mountain area showed that the background value was 1602 Bq/m2, which was close to this study [45]. In addition, according to the global simulated nuclear explosion 137Cs background value model of Walling [46], the simulation background value of the study area was 1467 Bq/m2, which was roughly equivalent to the background value of this study area. This indicates that the measured background value was reliable. Compared with the background value, all land use types underwent extremely serious soil erosion. It was reported that, in the Ganyu District of Lianyungang City, the high stone content in the soil made it more vulnerable to soil erosion. It has become a key area for soil erosion control [47,48,49].
The annual soil erosion thickness value of CBF was the lowest, which was 0.79 mm. The soil erosion moduli of AF, HF, and CF were all higher than CBF (Figure 2). The results indicated that CBF conversion to economic forests led to more severe soil erosion. As is shown in Table 1, compared with economic forests, CBF had the largest LAI (leaf area index), which indicated that CBF had high vegetation cover, which was consistent with previous studies. Binkley and Giardina [25] reported that, after being intercepted by canopy, the energy of raindrops was reduced to almost zero when they reached the soil. This explained why the thickness of soil loss in the CBF was the smallest. Among the three types of economic forests, the soil loss thickness of the CF was the smallest. CBF and CF had more litter cover on the surface than HF and AF. (Table 1). It has been reported that good litter cover reduces the ability of rain to wash the surface, which then reduces the loss of soil sediment [50,51,52]. We can further draw the conclusion that, when forests are converted into economic forests, it is necessary to select trees that can improve vegetation coverage and litter thickness so as to effectively reduce soil erosion. In this study, it was found that CF could better reduce soil erosion, which can be applied to the forestry construction in this area. However, in other areas, where environmental conditions may be different, the benefits of chestnut forests may not be realized. Therefore, more suitable tree species need to be selected according to local conditions. The potential benefits of chestnut forests observed in this study may depend more on the depth of litter in the study site. The abundance of litter depends not only on the defoliation but also on the management of forests in a variety of ways to maintain litter. Therefore, in addition to selecting suitable species for soil and water conservation, proper forest management is particularly important.
The annual soil erosion thickness was AF > HF > CF > CBF (Figure 2 A). The change trend was the same as the specific surface area of soil (Figure 6). The BET (Brunner Emmett Tellermethod) specific surface area of the soils increased with the management of the economic forests. Among them, AF increased by 43.46%, while HF and CF increased by 20.09% and 5.61%, respectively. The specific surface area of soil is an important indicator of soil quality and an intuitive expression of land use at a micro-scale [53,54,55]. The specific surface area contains abundant information, such as material migration, tillage methods, parent material structure, and so on. An increase in the specific surface area of an economic forest can increase the soil porosity and the macroaggregate content. Therefore, both water holding capacity and anti-erosion ability of soil are weakened. This is consistent with the conclusions of our research. Conversion into economic forests and improper management will aggravate soil erosion.

4.2. The Contact of Erosion and SOC and TN

The order of average SOC and TN storage was CBF > HF > CF > AF (Figure 3). This result indicated that the economic forest management reduced the SOC storage and the TN storage of the soil. It has been reported that the forest conversion can directly or indirectly affect many processes in the carbon–nitrogen biogeochemical cycle of ecosystems [55], such as changing the input and the degradation of organic matter and the physical protection of carbon and nitrogen by aggregates [56]. In addition, the SOC storage in the CBF decreased obviously as the soil layer deepened, which was consistent with the conclusions of related research done by Ma W et al. [7].
The results showed that the order of annual loss of SOC in the soil surface was HF > CBF > AF > CF (Figure 4). The reasons for this were two-fold. On one hand, erosion caused the absolute loss of nutrients. As was shown in Table 3, 137Cs had a significant correlation with SOC. It was reported that the redistribution of soil carbon and nitrogen under soil erosion was generally divided into two aspects—lateral migration and vertical migration [57,58,59]. Water was the main cause of soil erosion, which was accompanied by the whole process of soil particle dispersion, migration, and deposition. Soil carbon and nitrogen, as important parts of the soil, were usually lost in both sediment-bound and runoff-dissolved states during erosion [60,61]. On the other hand, when the soil itself carried a high content of organic carbon, the absolute loss of nutrients was high. SOC content in CF and CBF was relatively rich in itself. When soil erosion was milder, there was a high absolute loss rate.
Compared with the absolute loss, the annual relative loss rate of soil carbon and nitrogen could better show the overall situation of soil carbon and nitrogen under different land use types, which was an effective index for characterizing the soil quality degradation [62]. The results showed that the relative loss rate of the CBF was significantly smaller than those of the AF and the HF, which were similar to the soil layer loss thickness distribution. This indicated that the soil carbon and the nitrogen loss in the AF and the HF were serious and should have been strengthened to reduce the soil erosion and the loss of nutrients as well as to improve the soil quality [63]. In addition, it was found that the rate of soil carbon loss per year under different land use types was obviously greater than that of soil nitrogen relative loss. This was consistent with relevant studies [64].
The correlation analysis showed that the 137Cs activity in the soil showed a significant positive correlation with the content of soil organic carbon and total nitrogen (Table 3), which indicated that the contents of soil carbon and nitrogen under different land use modes in the area were closely related to soil erosion. This was consistent with earlier reports by Cheng J X et al. [65,66].

5. Conclusions and Deficiencies

The results showed that the conversion of coniferous broad-leaved mixed forests into the economic forests aggravated soil erosion. The average annual soil loss thickness of CBF was 0.79 mm, while those of AF, HF, and CF were 2.31 mm, 1.84 mm, and 0.87 mm, respectively. Economic forest management reduced the average carbon storage of soil, and the ranges from big to small were AF, CF, and HF by 63.66%, 61.26%, and 49.25%, respectively. The soil erosion process directly leads to the loss of soil carbon and nitrogen, which has a negative impact on the development of local agriculture and forestry. In the process of practical application, we should pay attention when forests are converted into economic forests, as it is necessary to select trees that can improve vegetation coverage and litter thickness in order to effectively reduce soil erosion. However, there are still some problems and shortcomings in this paper, such as the relative contribution rate of soil erosion and land use change to soil carbon and nitrogen loss, which could not be concluded from the existing data and will be more detailed in future experiments.

Author Contributions

Data interpretation, Y.X.; Data analysis, X.Z.; Manuscript drafting, X.Z.; Research design, Q.D.; Manuscript revision, J.L. Basic structure of this thesis, H.L.

Funding

This research was supported by National Natural Science Foundation of China (No. 31870600), Nation Key R&D program of China (2017YFC0505505), Priority Academic Program Development of Jiangsu Higher Education Institutions (PAPD).

Conflicts of Interest

The authors declare no conflict of interest.

References

  1. Sun, Y.; Gu, L.; Dickinson, R.E.; Norby, R.J.; Pallardy, S.G.; Hoffman, F.M. Impact of mesophyll diffusion on estimated global land CO₂ fertilization. Proc. Natl. Acad. Sci. USA 2014, 111, 15774–15779. [Google Scholar] [CrossRef] [PubMed]
  2. Tharammal, T.; Bala, G.; Narayanappa, D.; Nemani, R. Potential roles of CO2 fertilization, nitrogen deposition, climate change, and land use and land cover change on the global terrestrial carbon uptake in the twenty-first century. Clim. Dyn. 2018, 52, 1–14. [Google Scholar] [CrossRef]
  3. Li, D.; Niu, S.; Luo, Y. Global patterns of the dynamics of soil carbon and nitrogen stocks following afforestation: A meta-analysis. New Phytol. 2012, 195, 172–181. [Google Scholar] [CrossRef]
  4. Vilén, T.; Cienciala, E.; Schelhaas, M.J.; Verkerk, P.J.; Lindner, M.; Peltola, H. Increasing carbon sinks in European forests: Effects of afforestation and changes in mean growing stock volume. Forestry 2016, 89, 82–90. [Google Scholar] [CrossRef]
  5. Lebenya, R.M.; Huyssteen, C.W.V.; Preez, C.C.D. Change in soil organic carbon and nitrogen stocks eight years after conversion of sub-humid grassland to Pinus and Eucalyptus forestry. Soil Res. 2018, 56, 318. [Google Scholar] [CrossRef]
  6. Jiang, W.; Yang, S.; Yang, X.; Ning, G. Negative impacts of afforestation and economic forestry on the Chinese Loess Plateau and proposed solutions. Quat. Int. 2016, 399, 165–173. [Google Scholar] [CrossRef]
  7. Ma, W.; Li, Z.; Ding, K.; Huang, B.; Nie, X.; Lu, Y.; Xiao, H. Soil erosion, organic carbon and nitrogen dynamics in planted forests: A case study in a hilly catchment of Hunan Province, China. Soil Tillage Res. 2016, 155, 69–77. [Google Scholar] [CrossRef]
  8. Gómez, J.A.; Campos, M.; Guzmán, G.; Castillollanque, F.; Vanwalleghem, T.; Lora, Á.; Giráldez, J.V. Soil erosion control, plant diversity, and arthropod communities under heterogeneous cover crops in an olive orchard. Environ. Sci. Pollut. Res. Int. 2017, 25, 1–13. [Google Scholar] [CrossRef]
  9. Jian, S.; Li, J.; Ji, C.; Wang, G.; Mayes, M.A.; Dzantor, K.E.; Hui, D.; Luo, Y. Soil extracellular enzyme activities, soil carbon and nitrogen storage under nitrogen fertilization: A meta-analysis. Soil Biol. Biochem. 2016, 101, 32–43. [Google Scholar] [CrossRef] [Green Version]
  10. Gentsch, N.; Mikutta, R.; Alves, R.J.E.; Barta, J.; Gittel, A.; Hugelius, G.; Kuhry, P.; Lashchinskiy, N.; Palmtag, J.; Richter, A. Storage and transformation of organic matter fractions in cryoturbated permafrost soils across the Siberian Arctic. Biogeosciences 2015, 12, 2697–2743. [Google Scholar] [CrossRef]
  11. Murty, D.; Kirschbaum, M.U.F.; Mcmurtrie, R.E.; Mcgilvray, H. Does conversion of forest to agricultural land change soil carbon and nitrogen? a review of the literature. Glob. Chang. Biol. 2010, 8, 105–123. [Google Scholar] [CrossRef]
  12. Fang, H.Y.; Sheng, M.L.; Sun, L.Y.; Cai, Q.G. [Using 137Cs and 210Pb(ex) to trace the impact of soil erosion on soil organic carbon at a slope farmland in the black soil region]. Ying Yong Sheng Tai Xue Bao 2013, 24, 1856–1862. [Google Scholar]
  13. Nie, X.J.; Zhao, T.Q.; Qiao, X.N. Impacts of soil erosion on organic carbon and nutrient dynamics in an alpine grassland soil. Soil Sci. Plant Nutr. 2013, 59, 660–668. [Google Scholar] [CrossRef] [Green Version]
  14. Zhao, P.; Sheng, L.; Wang, E.; Chen, X.; Deng, J.; Zhao, Y. Tillage erosion and its effect on spatial variations of soil organic carbon in the black soil region of China. Soil Tillage Res. 2018, 178, 72–81. [Google Scholar] [CrossRef]
  15. Borrelli, P.; Paustian, K.; Panagos, P.; Jones, A.; Schütt, B.; Lugato, E. Effect of Good Agricultural and Environmental Conditions on erosion and soil organic carbon balance: A national case study. Land Use Policy 2016, 50, 408–421. [Google Scholar] [CrossRef] [Green Version]
  16. Li, Y.; Zhang, Q.W.; Reicosky, D.C.; Lindstrom, M.J.; Bai, L.Y.; Li, L. Changes in soil organic carbon induced by tillage and water erosion on a steep cultivated hillslope in the Chinese Loess Plateau from 1898–1954 and 1954–1998. J. Geophys. Res. Biogeosci. 2015, 112, 531–532. [Google Scholar] [CrossRef]
  17. Maïga-Yaleu, S.; Guiguemde, I.; Yacouba, H.; Karambiri, H.; Ribolzi, O.; Bary, A.; Ouedraogo, R.; Chaplot, V. Soil crusting impact on soil organic carbon losses by water erosion. Catena 2013, 107, 26–34. [Google Scholar] [CrossRef]
  18. Dialynas, Y.G.; Bastola, S.; Bras, R.L.; Marin-Spiotta, E.; Silver, W.L.; Arnone, E.; Noto, L.V. Impact of hydrologically driven hillslope erosion and landslide occurrence on soil organic carbon dynamics in tropical watersheds. Water Resour. Res. 2016, 52, 8895–8919. [Google Scholar] [CrossRef]
  19. Janeau, J.L.; Gillard, L.C.; Grellier, S.; Jouquet, P.; Le, T.P.Q.; Luu, T.N.M.; Ngo, Q.A.; Orange, D.; Pham, D.R.; Tran, D.T. Soil erosion, dissolved organic carbon and nutrient losses under different land use systems in a small catchment in northern Vietnam. Agric. Water Manag. 2014, 146, 314–323. [Google Scholar] [CrossRef]
  20. Zhang, J.H.; Wang, Y.; Li, F.C. Soil organic carbon and nitrogen losses due to soil erosion and cropping in a sloping terrace landscape. Soil Res. 2015, 53, 87–96. [Google Scholar] [CrossRef]
  21. Rogowski, A.S.; Tamura, T. Movement of 137Cs by Runoff, Erosion and Infiltration on the Alluvial Captina Silt Loam. Health Phys. 1963, 11, 1333–1340. [Google Scholar] [CrossRef]
  22. Ge, F.L.; Zhang, J.H.; Su, Z.A.; Nie, X.J. Response of changes in soil nutrients to soil erosion on a purple soil of cultivated sloping land. Acta Ecol. Sin. 2007, 27, 459–463. [Google Scholar] [CrossRef]
  23. Zhuang, J.Y.; Zhang, J.C.; Yang, Y.; Zhang, B.; Li, J. Effect of forest shelter-belt as a regional climate improver along the old course of the Yellow River, China. Agrofor. Syst. 2016, 91, 1–9. [Google Scholar] [CrossRef]
  24. Hartanto, H.; Prabhu, R.; Ase, W.; Asdak, C. Factors affecting runoff and soil erosion: Plot-level soil loss monitoring for assessing sustainability of forest management. For. Ecol. Manag. 2003, 180, 361–374. [Google Scholar] [CrossRef]
  25. Dan, B.; Giardina, C. Why do Tree Species Affect Soils? The Warp and Woof of Tree-soil Interactions. Biogeochemistry 1998, 42, 89–106. [Google Scholar]
  26. Scott, N.A.; Tate, K.R.; Ross, D.J.; Parshotam, A. Processes influencing soil carbon storage following afforestation of pasture with Pinus radiata at different stocking densities in New Zealand. Soil Res. 2006, 44, 85–96. [Google Scholar] [CrossRef]
  27. Lü, M.; Xie, J.; Chao, W.; Guo, J.; Wang, M.; Liu, X.; Chen, Y.; Chen, G.; Yang, Y. Forest conversion stimulated deep soil C losses and decreased C recalcitrance through priming effect in subtropical China. Biol. Fertil. Soils 2015, 51, 857–867. [Google Scholar] [CrossRef]
  28. Lord, W.J.; Vlach, E. Responses of Peach Trees to Herbicides, Mulch, Mowing, and Cultivation. Weed Sci. 1973, 21, 227–229. [Google Scholar]
  29. Zhang, X.; Li, Z.; Tang, Z.; Zeng, G.; Huang, J.; Guo, W.; Chen, X.; Hirsh, A. Effects of water erosion on the redistribution of soil organic carbon in the hilly red soil region of southern China. Geomorphology 2013, 197, 137–144. [Google Scholar] [CrossRef]
  30. Wright, A.C. A model of the redistribution of disaggregated soil particles by rainsplash. Earth Surf. Process. Landf. 2010, 12, 583–596. [Google Scholar] [CrossRef]
  31. Kateb, H.E.; Zhang, H.; Zhang, P.; Mosandl, R. Soil erosion and surface runoff on different vegetation covers and slope gradients: A field experiment in Southern Shaanxi Province, China. Catena 2013, 105, 1–10. [Google Scholar] [CrossRef]
  32. Wei, L.; Zhang, B.; Wang, M. Effects of antecedent soil moisture on runoff and soil erosion in alley cropping systems. Agric. Water Manag. 2007, 94, 54–62. [Google Scholar] [CrossRef]
  33. Zhang, Z.; Liu, S.; Dong, S. Ecological Security Assessment of Yuan River Watershed Based on Landscape Pattern and Soil Erosion. Procedia Environ. Sci. 2010, 2, 613–618. [Google Scholar] [CrossRef] [Green Version]
  34. Vieira, D.C.S.; Fernández, C.; Vega, J.A.; Keizer, J.J. Does soil burn severity affect the post-fire runoff and interrill erosion response? A review based on meta-analysis of field rainfall simulation data. J. Hydrol. 2015, 523, 452–464. [Google Scholar] [CrossRef]
  35. Klaminder, J.; Yoo, K.; Giesler, R. Soil carbon accumulation in the dry tundra: Important role played by precipitation. J. Geophys. Res. Biogeosci. 2009, 114, 126. [Google Scholar] [CrossRef]
  36. Solaimani, K.; Modallaldoust, S.; Lotfi, S. Investigation of land use changes on soil erosion process using geographical information system. Int. J. Environ. Sci. Technol. 2009, 6, 415–424. [Google Scholar] [CrossRef] [Green Version]
  37. Cotler, H.; Ortega-Larrocea, M.P. Effects of land use on soil erosion in a tropical dry forest ecosystem, Chamela watershed, Mexico. Catena 2006, 65, 107–117. [Google Scholar] [CrossRef]
  38. Rodway-Dyer, S.J.; Walling, D.E. The use of 137Cs to establish longer-term soil erosion rates on footpaths in the UK. J. Environ. Manag. 2010, 91, 1952–1962. [Google Scholar] [CrossRef] [PubMed]
  39. Mabit, L.; Klik, A.; Benmansour, M.; Toloza, A.; Geisler, A.; Gerstmann, U.C. Assessment of erosion and deposition rates within an Austrian agricultural watershed by combining 137Cs, 210Pbex and conventional measurements. Geoderma 2009, 150, 231–239. [Google Scholar] [CrossRef]
  40. Sheng, L.; Lobb, D.A.; Kachanoski, R.G.; Mcconkey, B.G. Comparing the use of the traditional and repeated-sampling-approach of the 137 Cs technique in soil erosion estimation. Geoderma 2011, 160, 324–335. [Google Scholar]
  41. Zhang, G.; Weiliang, G.U.; Shulan, J.I.; Liu, Z.; Peng, Y.; Wang, Z. Preparation of polyelectrolyte multilayer membranes by dynamic layer-by-layer process for pervaporation separation of alcohol/water mixtures. J. Membr. Sci. 2006, 280, 727–733. [Google Scholar] [CrossRef] [Green Version]
  42. Silva, J.; Mello, J.W.V.; Abrahão, W.A.P.; Fontes, M.P.F.; Junior, L.S.; Ferreira, V.P.; Taddei, M.H.T.; Rocha, O.F.; Gilkes, R.J.; Prakongkep, N. Multi-element background for trace elements and radionuclides in soil from Minas Gerais State, Brazil. In Proceedings of the 19th World Congress of Soil Science: Soil Solutions for a Changing World, Brisbane, Australia, 1–6 August 2010; Symposium 3.5.2 Risk Assessment and Risk Based Remediation 2010. pp. 40–43. [Google Scholar]
  43. Gosman, A.; Blažíček, J. Study of the diffusion of trace elements and radionuclides in soils. J. Radioanal. Nucl. Chem. 1994, 182, 179–191. [Google Scholar] [CrossRef]
  44. Lu, J.G.; Huang, Y.; Li, F.; Wang, L.; Li, S.; Hsia, Y. The investigation of 137Cs and 90Sr background radiation levels in soil and plant around Tianwan NPP, China. J. Environ. Radioact. 2006, 90, 89–99. [Google Scholar] [CrossRef]
  45. Zhang, M.L.; Yang, H.; Xu, C.A.; Yang, J.D.; Liu, X.H. A preliminary study on soil erosion in Yimeng mountainous area using Cs tracer. Acta Pedol. Sin. 2010, 47, 408–414. [Google Scholar]
  46. Walling, D.E.; He, Q.; Blake, W. Use of 7Be and 137Cs measurements to document short- and medium-term rates of water-induced soil erosion on agricultural land. Water Resour. Res. 1999, 35, 3865–3874. [Google Scholar] [CrossRef]
  47. Estifanos, A. Assessment Of Micro-Watershed Vulnerability For Soil Erosion In Ribb Watershed Using GIS And Remote Sensing. Ph.D. Thesis, Mekelle University, Mekelle, Ethiopia, 2014. [Google Scholar]
  48. Jain, S.; Goel, M.K. Assessing the vulnerability to soil erosion of the Ukai Dam catchments using remote sensing and GIS. Int. Assoc. Sci. Hydrol. Bull. 2002, 47, 31–40. [Google Scholar] [CrossRef] [Green Version]
  49. Zhao, Y.; Wang, E.; Cruse, R.M.; Chen, X. Characterization of seasonal freeze-thaw and potential impacts on soil erosion in northeast China. Can. J. Soil Sci. 2012, 92, 567–571. [Google Scholar] [CrossRef]
  50. Clarke, P.J.; Prior, L.D.; French, B.J.; Vincent, B.; Knox, K.J.E.; Bowman, D.M.J.S. Using a rainforest-flame forest mosaic to test the hypothesis that leaf and litter fuel flammability is under natural selection. Oecologia 2014, 176, 1123–1133. [Google Scholar] [CrossRef]
  51. Pan, C.; Wang, Q.; Ruan, X.; Li, Z. Biological Activity and Quantification of Potential Autotoxins from the Leaves of Picea Schrenkiana. Chin. J. Plant Ecol. 2009, 27, 245–262. [Google Scholar]
  52. Pagel-Wieder, S.; Fischer, W.R. Short communication Estimation of the specific surface area of soil particles by adsorption of polyvinylalcohol in aqueous suspension. J. Plant Nutr. Soil Sci. 2015, 164, 441–443. [Google Scholar] [CrossRef]
  53. Dolinar, B. Prediction of the soil-water characteristic curve based on the specific surface area of fine-grained soils. Bull. Eng. Geol. Environ. 2015, 74, 697–703. [Google Scholar] [CrossRef]
  54. Dunjo, G.; Pardini, G.; Gispert, M. The role of land use-land cover on runoff generation and sediment yield at a microplot scale, in a small Mediterranean catchment. J. Arid Environ. 2004, 57, 239–256. [Google Scholar] [CrossRef]
  55. Fang, Y.; Gundersen, P.; Vogt, R.D.; Koba, K.; Chen, F.; Xi, Y.C.; Yoh, M. Atmospheric deposition and leaching of nitrogen in Chinese forest ecosystems. J. For. Res. 2011, 16, 341–350. [Google Scholar] [CrossRef]
  56. Koch, J.A.; Makeschin, F. Carbon and nitrogen dynamics in topsoils along forest conversion sequences in the Ore Mountains and the Saxonian lowland, Germany. Eur. J. For. Res. 2004, 123, 189–201. [Google Scholar] [CrossRef]
  57. Wu, J.; Huang, J.; Liu, D.; Li, J.; Zhang, J.; Wang, H. Effect of 26 Years of Intensively Managed Carya cathayensis Stands on Soil Organic Carbon and Fertility. Sci. World J. 2014, 2014, 1–6. [Google Scholar]
  58. Feng, W.; Zheng, S.; Jiang, J.; Xia, J.; Liang, J.; Zhou, J.; Luo, Y. Methodological uncertainty in estimating carbon turnover times of soil fractions. Soil Biol. Biochem. 2016, 100, 118–124. [Google Scholar] [CrossRef] [Green Version]
  59. Guo, X.; Meng, M.; Zhang, J.; Chen, H.Y.H. Vegetation change impacts on soil organic carbon chemical composition in subtropical forests. Sci. Rep. 2016, 6, 29607. [Google Scholar] [CrossRef]
  60. Chen, C.Y.; Hou, H.P.; Qiang, L.; Ping, Z.; Zhang, Z.Y.; Dong, Z.Q.; Ming, Z. Effects of planting density on photosynthetic characteristics and changes of carbon and nitrogen in leaf of different corn hybrids. Acta Agron. Sin. 2010, 36, 871–878. [Google Scholar] [CrossRef]
  61. Abbasi, M.K.; Tahir, M.M.; Sabir, N.; Khurshid, M. Impact of the addition of different plant residues on nitrogen mineralization–immobilization turnover and carbon content of a soil incubated under laboratory conditions. Solid Earth 2015, 6, 197–205. [Google Scholar] [CrossRef] [Green Version]
  62. Moldan, F.; Kjønaas, O.J.; Stuanes, A.O.; Wright, R.F. Increased nitrogen in runoff and soil following 13 years of experimentally increased nitrogen deposition to a coniferous-forested catchment at Gårdsjön, Sweden. Environ. Pollut. 2006, 144, 610–620. [Google Scholar] [CrossRef]
  63. Wang, Y.; Fu, B.; Lü, Y.; Chen, L. Effects of vegetation restoration on soil organic carbon sequestration at multiple scales in semi-arid Loess Plateau, China. Catena 2011, 85, 58–66. [Google Scholar] [CrossRef] [Green Version]
  64. Yuan, D.H.; Wang, Z.Q.; Chen, X.; Guo, X.B.; Zhang, R.L. Losses of nitrogen and phosphorus under different land use patterns in small red soil watershed. Acta Ecol. Sin. 2003, 23, 188–198. [Google Scholar]
  65. Conant, R.T.; Paustian, K. Spatial variability of soil organic carbon in grasslands: Implications for detecting change at different scales. Environ. Pollut. 2002, 116, S127–S135. [Google Scholar] [CrossRef]
  66. Dong, J.; Yang, D.Y.; Zhou, B.; Xu, Q.M. Study on Soil Erosion Rates in the Three Gorges Reservoir Area Using ~(137)Cs Tracing Method. J. Soil Water Conserv. 2006, 20, 1–5. [Google Scholar]
Figure 1. Location of the study site.
Forests 10 00433 g001
Figure 2. 137Cs levels and the annual loss in soil depth under different land use types. Note: bars represent ± SE of the mean (n = 3). Different letters indicate significant differences in the same layer and different land use types (p < 0.05). (a) represents specific activity of soil 137Cs in each layer with different land use types; (b) represents average annual loss thickness of soil in different land use types.
Forests 10 00433 g002
Figure 3. The TN and the SOC stocks under different land use types. Note: bars represent ± SE of the mean (n = 3). Different capital letters indicate significant differences of different land use types in the same soil layer, and different lower-case letters indicate significant differences of different soil layers in the same land use types. (a,b) represent the reserves of organic carbon and nitrogen, respectively.
Forests 10 00433 g003
Figure 4. Soil surface carbon and nitrogen loss under different land use types. Note: the boxplot consists of five statistics: minimum, upper quartile, median, lower quartile, and maximum. The center of the boxplot is the median. Bars represent ± SE of the mean (n = 3). Different capital letters indicate that the difference between different land use types of the same soil layer is significant. (a,b) represent the surface loss of carbon and nitrogen, respectively.
Forests 10 00433 g004
Figure 5. The carbon and nitrogen relative loss rates under different land use types. Note: the boxplot consists of five statistics: minimum, upper quartile, median, lower quartile, and maximum. The center of the boxplot is the median. Bars represent ± SE of the mean (n = 3). Different capital letters indicate that the difference between different land use types of the same soil layer is significant. (a,b) represent the relative loss of carbon and nitrogen, respectively.
Forests 10 00433 g005
Figure 6. Soil pore structure under different land use patterns.
Forests 10 00433 g006
Table 1. Basic information of different land use types.
Land Use TypeForest Age (year)LAILitter Thickness (mm)Slope (°)AspectpHSoil Bulk Density/g cm3Sand/%Silt%Clay%
HF112.1015SE5.67 ± 0.271.42 ± 0.1230.84 ± 5.0565.00 ± 5.634.16 ± 0.36
CF132.51.111SE5.95 ± 0.341.43 ± 0.0531.57 ± 7.8364.66 ± 6.663.77 ± 0.18
AF102.2013SE5.48 ± 0.261.47 ± 0.1841.07 ± 8.6556.63 ± 4.362.29 ± 0.23
CBF253.21.313SE5.67 ± 0.271.44 ± 0.1236.59 ± 7.5360.21 ± 6.963.20 ± 0.41
Note: all data are expressed in mean ± SE (standard error), which were calculated based on three samples. CBF: coniferous and broad-leaved mixed forest; HF: hawthorn forest; AF: apple forest; CF: chestnut forest; LAI: leaf area index.
Table 2. 137Cs loss in different land use types.
Land Use TypesDepth/cm137Cs Content/Bq·m−2Percentage 137Cs Loss/%
CBF0–20546.9268.4
HF0–20123.8892.9
AF0–2060.6096.5
CF0–20495.8971.4
Table 3. Correlation between 137Cs and soil chemical properties.
TNTPTKSOCDOCC/NC/H
Cor.0.54 **−0.18−0.030.56 **0.110.49 *0.40
P0.0060.390.990.0050.600.020.05
N24242424242424
TN: total nitrogen; TP: total phosphorus; TK: total kalium; SOC: soil organic carbon; DOC: dissolved organic carbon; C/N: carbon/ nitrogen; C/H: carbon/hydrogen. * Significant correlation was found at the level of α = 0.05 and ** at the level of α = 0.01.

