Evaluating Goal Programming as a Backcasting Tool to Assess the Impact of Local Stakeholder Determined Policies on the Future Provision of Ecosystem Services in Forested Landscapes


Abstract
1. Introduction
2. Materials and Methods
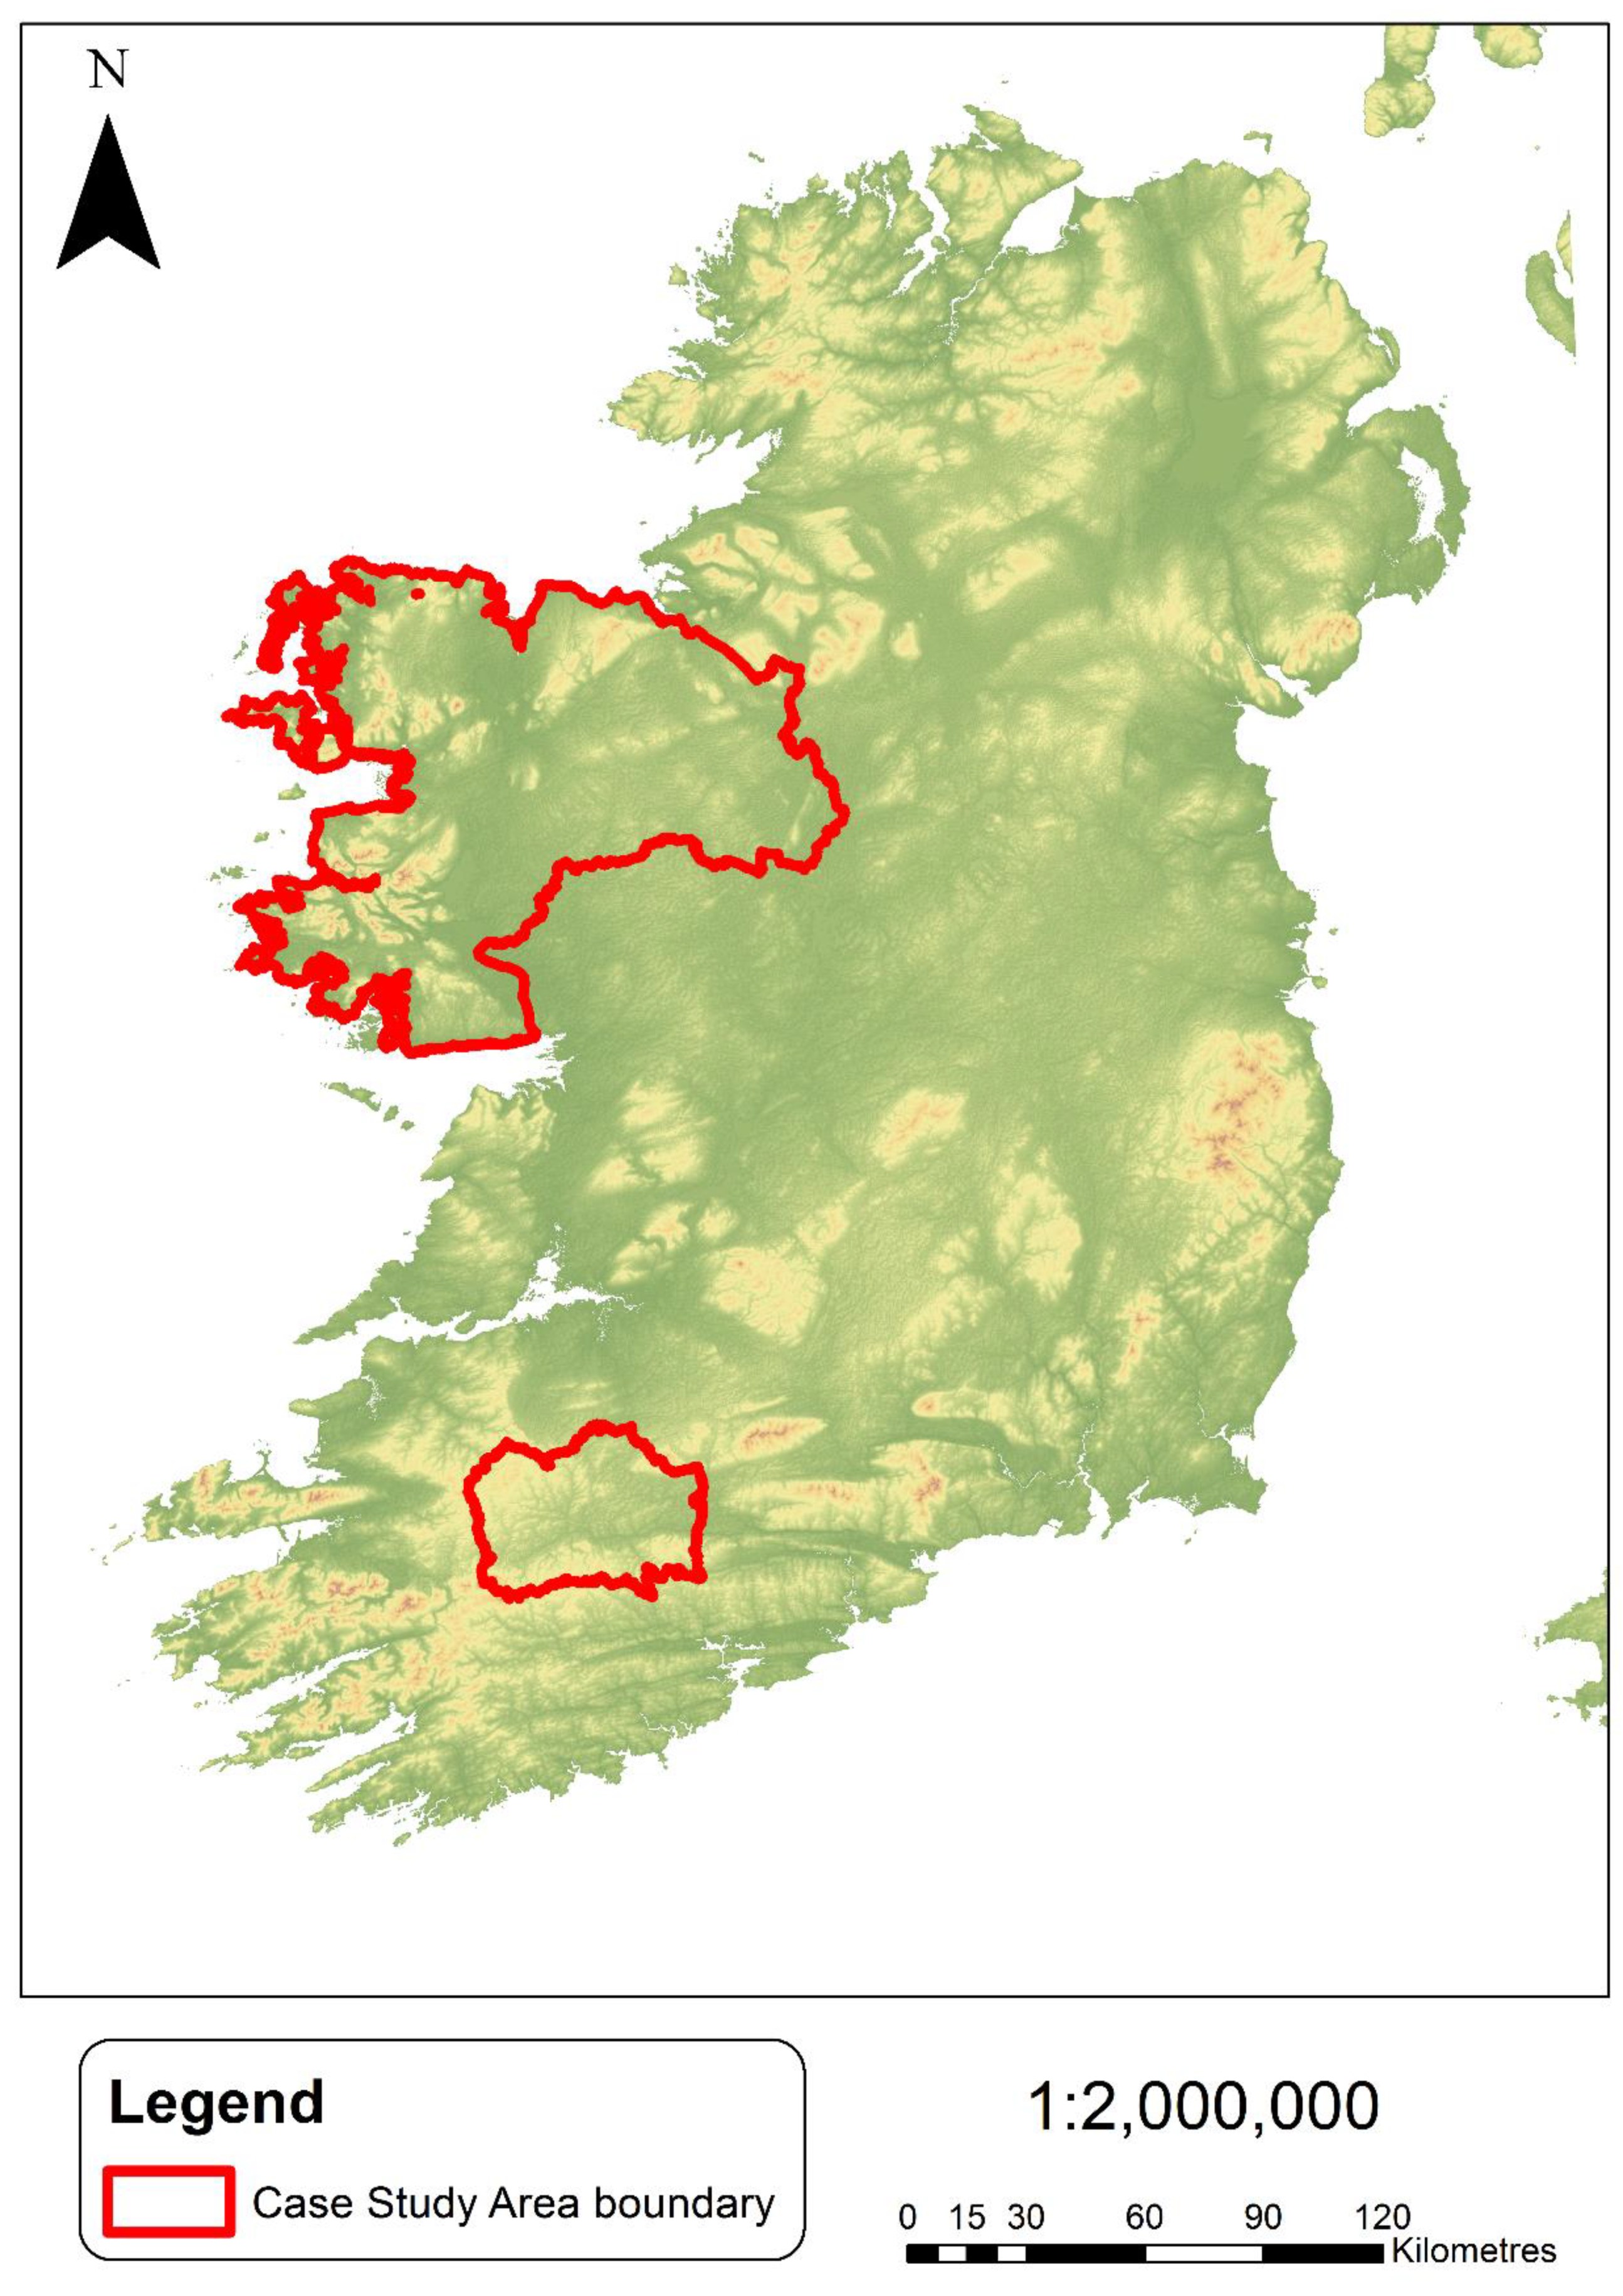
2.1. Western Peatlands
2.2. Newmarket
2.3. Ecosystem Service Quantification
2.4. Backcasting Policies
- They were asked to outline their desired ES provision levels by the year 2042, with 2012 ES provisions as a starting point [26];
- Based on their desired provision levels in 2042, they were asked to identify policies that could be implemented in 2012 that would move the provision of ESs in the desired direction from the levels in 2012.
2.5. Goal Programming Model and Backcasting Policies
2.5.1. Backcasting Policy 1: Genetically Improved Sitka Spruce (GI)
2.5.2. Backcasting Policy 2: Subsidised Mandatory Public Access for All Forests (Rec)
2.5.3. Backcasting Policy 3: Introduction of Measures to Reduce Water Sedimentation Risk (Water)
2.5.4. National Level Stakeholder Involvement
3. Results
3.1. Backcasting Policy 1: Genetically Improved Sitka Spruce (GI) (Newmarket Only)
3.2. Backcasting Policy 2: Public Access to All Forests (Rec)
3.2.1. Western Peatlands
3.2.2. Newmarket
3.3. Backcasting Policy 3: Introduction of Measures to Reduce Water Sedimentation Risk (Water) (WP Only)
3.4. Implementing Backcasting Policies Simultaneously
3.4.1. GI and Rec in Newmarket
3.4.2. Rec and Water in Western Peatland
3.5. Robustness Assessment
3.5.1. Robustness Assessment for Newmarket
3.5.2. Robustness Assessment for Western Peatland
3.5.3. National Level Stakeholder Involvement
4. Discussion
5. Conclusions
Author Contributions
Funding
Acknowledgments
Conflicts of Interest
Appendix A

| Stakeholder Groups | Stage 1: Interviews | Stage 2: Workshop | Stage 3: Workshop 2 | Key Interests/Stake |
|---|---|---|---|---|
| Primary Stakeholders | ||||
| Farmer Forest Owners | √√√√ | √ | – | Premium payments/money; timber and non-timber production e.g., wood fuel/biomass |
| Private Forest Owner/Investor | √ | √ | √ | Premium payments/money; timber and non-timber production e.g., wood fuel/biomass. |
| Public Forest Company/Coillte | √ | √ | √ | Commercial timber production, financial benefits from land management, bioenergy development, forest recreation and biodiversity protection. |
| Secondary Stakeholders | ||||
| National Forest Authority (Forest Service) | √ | √ | √ | Responsible for implementing national forest policies and ensuring SFM practices |
| National Parks and Wildlife (NPWS) | √ | – | – | Biodiversity conservation |
| Inland Fisheries Ireland | √ | √ | √ | Water resource and catchment protection |
| Non-Governmental Organisation/Local Community representative | √ | √ | √ | Forest contribution to rural development/jobs |
| Sawmill Industry | – | √ | – | Timber supply |
| Environmental Protection Agency | – | – | √ | Statutory body for the balanced and sustainable protection and management of the environment |
| Tertiary Stakeholders | ||||
| Local County Council and Recreational Groups | √ | √ | – | Tourism development, hiking and walking |
| Scientists and Ecologists | √ | – | Forest research and development | |
| Teagasc | √ | √ | √ | Rural development and farm forestry advisory/training |
| Biomass Industries | – | √ | √ | Biomass as a source of energy |
| Deer Hunters | √ | – | – | Deer hunting |
| Sea Angler/Fishermen | √ | – | – | Fishing for recreational purposes |
| Number of Stakeholders’ Involved | 14 | 11 | 8 | |
References
- Forest Service. Forest Service Appropriate Assessment Procedure—Appendix B Appropriate Assessment Procedure (AAP) Requirements Regarding Hen Harrier SPAs and Afforestation; Forest Service: Johnstown Castle Estate, Wexford, Ireland, 2012. [Google Scholar]
- Moorkens, E.A. Conservation Management of the Freshwater Pearl Mussel Margaritifera margaritifera. In Irish Wildlife Manuals; Dúchas, The Heritage Service: Dublin, Ireland, 1999; Volume 8. [Google Scholar]
- Phillips, H.; Corrigan, E.; McDonagh, M.; Fairgrieve, M.; Farrelly, N.; Redmond, J.; Barrett, F.; Twomey, M. All Ireland Roundwood Production Forescast 2016–2035; COFORD: Dublin, Ireland, 2016. [Google Scholar]
- Barrett, F.; Somers, M.J.; Nieuwenhuis, M. PractiSFM—An Operational Multi-Resource Inventory Protocol for Sustainable Forest Management; CABI: Wallingford, UK, 2007; pp. 224–237. [Google Scholar] [CrossRef]
- Nieuwenhuis, M.; Tiernan, D. The Impact of the Introduction of Sustainable Forest Management Objectives on the Optimisation of PC-based Forest-level Harvest Schedules. For. Policy Econ. 2005, 7, 689–701. [Google Scholar] [CrossRef]
- Turner, B.J.; Chikumbo, O.; Davey, S.M. Optimisation Modelling of Sustainable Forest Management at the Regional Level: An Australian Example. Ecol. Modell. 2002, 153, 157–179. [Google Scholar] [CrossRef]
- Alcamo, J.; Bennett, E.M. Ecosystems and Human Well-Being: A Framework for Assessment; Island Press: Washington, DC, USA, 2003. [Google Scholar]
- King, R.T. Wildlife and management. N. Y. State Conserv. 1966, 20, 8–11. [Google Scholar]
- Gómez-Baggethun, E.; de Groot, R.; Lomas, P.L.; Montes, C. The History of Ecosystem Services in Economic Theory and Practice: From Early Notions to Markets and Payment Schemes. Ecol. Econ. 2010, 69, 1209–1218. [Google Scholar] [CrossRef]
- Westman, W.E. How Much Are Nature’s Services Worth? Science 1977, 197, 960–964. [Google Scholar] [CrossRef]
- MEA. Millennium Ecosystem Assessment. Available online: http://www.unep.org/maweb/en/index.aspx (accessed on 5 October 2013).
- De Groot, R.S.; Alkemade, R.; Braat, L.; Hein, L.; Willemen, L. Challenges in Integrating the Concept of Ecosystem Services and Values in Landscape Planning, Management and Decision Making. Ecol. Complex. 2010, 7, 260–272. [Google Scholar] [CrossRef]
- Ní Dhubháin, Á.; Fléchard, M.-C.; Moloney, R.; O’Connor, D. Stakeholders’ Perceptions of Forestry in Rural Areas—Two Case Studies in Ireland. Land Use Policy 2009, 26, 695–703. [Google Scholar] [CrossRef]
- Bonsu, N.O.; Dhubháin, Á.N.; O’Connor, D. Understanding forest resource conflicts in Ireland: A case study approach. Land Use Policy 2015. [Google Scholar] [CrossRef]
- Fléchard, M.-C.; Carroll, M.S.; Cohn, P.J.; Ní Dhubháin, Á. The Changing Relationships between Forestry and the Local Community in Rural Northwestern Ireland. Can. J. For. Res. 2007, 37, 1999–2009. [Google Scholar] [CrossRef]
- Tiernan, D. Redesigning Afforested Western Peatlands in Ireland. In After Wise Use—The Future of Peatlands; Irish Peatland Society: Tullamore, Ireland, 2008. [Google Scholar]
- Cregan, M.; Murphy, W. A Review of Forest Recreation Research Needs in Ireland; COFORD: Dublin, Ireland, 2006. [Google Scholar]
- Bonsu, N.O.; Dhubháin, Á.N.; O’Connor, D. Evaluating the use of an Integrated Forest Land-Use Planning Approach in addressing Forestry Conflicting Demands: Experience within an Irish Forest Landscape. Futures 2016. [Google Scholar] [CrossRef]
- FSC. FSC Standard for Chain of Custody Certification; Forestry Stewardship Council: Bonn, Germany, 2011. [Google Scholar]
- FSC. Forestry Stewardship Council. Available online: https://ie.fsc.org/index.htm (accessed on 26 November 2013).
- PEFC (Ireland) Ltd. PEFC Irish Forest Certification Ireland, 2nd ed.; PEFC (Ireland) Ltd.: Cork, Ireland, 2014. [Google Scholar]
- Robinson, J.B. Energy Backcasting a Proposed Method of Policy Analysis. Energy Policy 1982, 10, 337–344. [Google Scholar] [CrossRef]
- Sandström, C.; Carlsson-Kanyama, A.; Lindahl, K.B.; Sonnek, K.M.; Mossing, A.; Nordin, A.; Nordström, E.-M.; Räty, R. Understanding Consistencies and Gaps Between Desired Forest Futures: An Analysis of Visions From Stakeholder Groups in Sweden. Ambio 2016, 45 (Suppl. 2), 100–108. [Google Scholar] [CrossRef]
- De Bruin, J.O.; Kok, K.; Hoogstra-Klein, M.A. Exploring the Potential of Combining Participative Backcasting and Exploratory Scenarios for Robust Strategies: Insights from the Dutch Forest Sector. For. Policy Econ. 2017, 85, 269–282. [Google Scholar] [CrossRef]
- Renou, F.; Farrell, E.P. Reclaiming Peatlands for Forestry: The Irish Experience. In Restoration of Boreal and Temperate Forests; CRC Press: Boca Raton, FL, USA, 2005. [Google Scholar]
- Corrigan, E.; Nieuwenhuis, M. A Linear Programming Model to Biophysically Assess Some Ecosystem Service Synergies and Trade-Offs in Two Irish Landscapes. Forests 2016, 7, 128. [Google Scholar] [CrossRef]
- BFC. Yield Models for Forest Management; Forestry Commission: Alice Holt Lodge, UK, 1973 to 1980.
- Barrett, F.; Nieuwenhuis, M.; Doyle, M. The PractiSFM Multi-resource Inventory Protocol and Decision Support System: A Model to Address the Private Forest Resource Information Gap in Ireland. Irish For. 2009, 64, 5–20. [Google Scholar]
- Wilson, M.; Gittings, T.; O’Halloran, J.; Kelly, T.; Pithon, J. The Distribution of Hen Harriers in Ireland in Relation to Land-Use Cover, Particularly Forest Cover; COFORD: Dublin, Ireland, 2006. [Google Scholar]
- Wilson, M.; Irwin, S.; O’Donoghue, B.; Kelly, T.; O’Halloran, J. The Use of Forested Landscapes by Hen Harriers in Ireland; COFORD: Dublin, Ireland, 2010. [Google Scholar]
- Wilson, M.W.; Irwin, S.; Norriss, D.W.; Newton, S.F.; Collins, K.; Kelly, T.C.; O’Halloran, J. The Importance of Pre-Thicket Conifer Plantations for Nesting Hen Harriers Circus cyaneus in Ireland. Ibis 2009, 151, 332–343. [Google Scholar] [CrossRef]
- Sivertun, Å.; Prange, L. Non-point Source Critical Area Analysis in the Gisselö Watershed Using GIS. Environ. Modell. Softw. 2003, 18, 887–898. [Google Scholar] [CrossRef]
- Levy, P.E.; Hale, S.E.; Nicoll, B.C. Biomass Expansion Factors and Root: Shoot Ratios for Coniferous Tree Species in Great Britain. Forestry 2004, 77, 421–430. [Google Scholar] [CrossRef]
- Teobaldelli, M.; Somogyi, Z.; Migliavacca, M.; Usoltsev, V.A. Generalized Functions of Biomass Expansion Factors for Conifers and Broadleaved by Stand Age, Growing Stock and Site Index. For. Ecol. Manag. 2009, 257, 1004–1013. [Google Scholar] [CrossRef]
- Cairns, M.A.; Brown, S.; Helmer, E.H.; Baumgardner, G.A. Root Biomass Allocation in the World’s Upland Forests. Oecologia 1997, 111, 1–11. [Google Scholar] [CrossRef]
- FAO. Development of the National-Level Criteria and Indicators for the Sustainable Management of Dry Forest of Asia: Workshop Report; Asia-Pacific Forestry Commission: Bangkok, Thailand, 2000. [Google Scholar]
- Smith, J.E.; Heath, L.S.; Jenkins, J.C. Forest Volume to-Biomass Models and Estimates of Mass for Live and Standing Dead Trees of U.S. Forests; U.S. Department of Agriculture, Forest Service, Northeastern Research Station: Newtown Square, PA, USA, 2013; p. 57.
- Flaherty, S.; Patenatue, G.; Close, A.; Lurz, P.W.W. The Impact of Forest Stand Structure on Red Squirrel Habitat Use. Forestry 2012, 85, 437–444. [Google Scholar] [CrossRef]
- Fennessy, J. The Collection Storage, Treatment and Handling of Broadleaved Tree Seed; COFORD: Dublin, Ireland, 2002. [Google Scholar]
- Fennessy, J. The Collection, Storage, Treatment and Handling of Conifer Tree Seed; COFORD: Dublin, Ireland, 2002. [Google Scholar]
- Bryce, J.M.; Macdonald, D.W. Projected Changes in Red Squirrel Habitats in Craigvinean Forest. Scott. For. 2000, 54, 87–90. [Google Scholar]
- Waters, C.; Lawton, C. Red Squirrel Translocation in Ireland; Department of the Environment Heritage and Local Government, Ed.; National Parks and Wildlife Service: Dublin, Ireland, 2011. [Google Scholar]
- Smith, G.; O’Donoghue, S.; Iremonger, S.; Gittings, T.; Pithon, J.; O’Halloran, J.; Wilson, M.; O’Donnell, V.; Kelly, D.; French, L.; et al. Assessment of Biodiversity at Different Stages of the Forest Cycle; National Council for Forest Research and Development and the Environmental Protection Agency: Dublin, Ireland, 2005. [Google Scholar]
- O’Halloran, J.; Irwin, S.; Kelly, D.; Kelly, T.; Mitchell, F.; Coote, L.; Oxbrough, A.; Wilson, M.; Martin, R.; Moore, K.; et al. Management of Biodiversity in a Range of Irish Forest Types; Department of Agriculture, Fisheries and Food: Dublin, Ireland, 2011. [Google Scholar]
- Edwards, D.M.; Jay, M.; Jensen, F.S.; Lucas, B.; Marzano, M.; Montagné, C.; Peace, A.; Weiss, G. Public Preferences Across Europe for Different Forest Stand Types as Sites for Recreation. Ecol. Soc. 2012, 17, 27. [Google Scholar] [CrossRef]
- Bonsu, N.O. Understanding and Managing Ireland’s Forest Resource Conflicts: Addressing Stakeholder’s Competing Demands via an Integrated Forest Land-Use Planning Approach. Ph.D. Thesis, University College Dublin, Dublin, Ireland, 2016. [Google Scholar]
- Bonsu, N.O.; Dhubháin, Á.N.; O’Connor, D. Evaluating the use of an Integrated Forest Land-use Planning Approach in Addressing Forest Ecosystem Services Conflicting Demands: Experience within an Irish Forest Landscape. Futures 2017, 86, 1–17. [Google Scholar] [CrossRef]
- Corrigan, E. An Optimisation Based System for the Investigation of Forestry-Related Land-Use Policy and Industry Changes in Ireland. Ph.D. Thesis, University College Dublin, Dublin, Ireland, 2016. [Google Scholar]
- Corrigan, E.; Nieuwenhuis, M. Using Goal-Programming to Model the Effect of Stakeholder Determined Policy and Industry Changes on the Future Management of and Ecosystem Services Provision by Ireland’s Western Peatland Forests. Sustainability 2017, 9, 11. [Google Scholar] [CrossRef]
- Phillips, H.; Thompson, D. Economic Benefits and Guidelines for Planting Improved Washington Sitka Spruce; COFORD: Dublin, Ireland, 2010. [Google Scholar]
- The Irish Sports Council. The Economic Value of Trails and Forest Recreation in the Republic of Ireland—Final Report; Fitzpatrick Associates Economic Consultants: Dublin, Ireland, 2005. [Google Scholar]
- Diaz-Balteiro, L.; González-Pachón, J.; Romero, C. Goal Programming in Forest Management: Customising Models for the Decision-maker’s Preferences. Scand. J. For. Res. 2012, 28, 166–173. [Google Scholar] [CrossRef]
- Nieuwenhuis, M. Operations Research in Forestry. Irish For. 1989, 46, 51–58. [Google Scholar]
- Lee, C.-S.; Wen, C.-G. Fuzzy Goal Programming Approach for Water Quality Management in a River Basin. Fuzzy Sets Syst. 1997, 89, 181–192. [Google Scholar] [CrossRef]
- Cheng, H.-W. A Satisficing Method for Fuzzy Goal Programming Problems with Different Importance and Priorities. Qual. Quan. 2013, 47, 485–498. [Google Scholar] [CrossRef]
- Diaz-Balteiro, L.; Gonzalez-Pachon, J.; Romero, C. Forest Management with Multiple Criteria and Multiple Stakeholders: An Application to Two Public Forests in Spain. Scand. J. For. Res. 2009, 24, 87–93. [Google Scholar] [CrossRef]
- Aldea, J.; Martínez-Peña, F.; Romero, C.; Diaz-Balteiro, L. Participatory Goal Programming in Forest Management: An Application Integrating Several Ecosystem Services. Forests 2014, 5, 3352–3371. [Google Scholar] [CrossRef]
- Hotvedt, J.E. Application of Linear Goal Programming to Forest Harvest Scheduling. South. J. Agric. Econ. 1983, 15, 103–108. [Google Scholar] [CrossRef]
- Borges, J.G.; Garcia-Gonzalo, J.; Bushenkov, V.; McDill, M.E.; Marques, S.; Oliveira, M.M. Addressing Multicriteria Forest Management With Pareto Frontier Methods: An Application in Portugal. For. Sci. 2014, 60, 63–72. [Google Scholar] [CrossRef]
- Borges, J.G.; Marques, S.; Garcia-Gonzalo, J.; Rahman, A.U.; Bushenkov, V.; Sottomayor, M.; Carvalho, P.O.; Nordström, E.-M. A Multiple Criteria Approach for Negotiating Ecosystem Services Supply Targets and Forest Owners’ Programs. For. Sci. 2017, 63, 49–61. [Google Scholar] [CrossRef]
- Eggers, J.; Holmström, H.; Lämås, T.; Lind, T.; Öhman, K. Accounting for a Diverse Forest Ownership Structure in Projections of Forest Sustainability Indicators. Forests 2015, 6, 4001–4033. [Google Scholar] [CrossRef]
- Hengeveld, G.M.; Schüll, E.; Trubins, R.; Sallnäs, O. Forest Landscape Development Scenarios (FoLDS)–A framework for integrating forest models, owners’ behaviour and socio-economic developments. For. Policy Econ. 2017, 85, 245–255. [Google Scholar] [CrossRef]
- Rinaldi, F.; Jonsson, R.; Sallnäs, O.; Trubins, R. Behavioral Modelling in a Decision Support System. Forests 2015, 6, 311–327. [Google Scholar] [CrossRef]
- Orazio, C.; Cordero Montoya, R.; Régolini, M.; Borges, J.; Garcia-Gonzalo, J.; Barreiro, S.; Botequim, B.; Marques, S.; Sedmák, R.; Smreček, R.; et al. Decision Support Tools and Strategies to Simulate Forest Landscape Evolutions Integrating Forest Owner Behaviour: A Review from the Case Studies of the European Project, INTEGRAL. Sustainability 2017, 9, 599. [Google Scholar] [CrossRef]
- Kline, J.D.; Mazzotta, M.J. Evaluating Tradeoffs Among Ecosystem Services in the Management of Public Lands; Gen. Tech. Rep. PNWGTR-865; U.S. Department of Agriculture, Forest Service, Pacific Northwest Research Station: Portland, OR, USA, 2012; p. 48.
- Biber, P.; Borges, J.; Moshammer, R.; Barreiro, S.; Botequim, B.; Brodrechtová, Y.; Brukas, V.; Chirici, G.; Cordero-Debets, R.; Corrigan, E.; et al. How Sensitive Are Ecosystem Services in European Forest Landscapes to Silvicultural Treatment? Forests 2015, 6, 1666–1695. [Google Scholar] [CrossRef]
- ALTERFOR. Alternative Models and Robust Decision Making for Future Forest Management. Available online: https://www.alterfor-project.eu/ (accessed on 26 March 2019).

| Entire Case Study Area | Western Peatlands | Newmarket |
| Area (approximately in ha) | 1,060,000 | 188,000 |
| Forested area (approximately in ha) | 116,000 | 32,000 |
| Average temperature (°C) | 11–12 | 8–9 |
| Typical annual rainfall (mm) | West: 2000 East: 1200–1400 | 1200–1400 |
| Forested land only (as of 2012) | ||
| Forest ownership | ||
| Coillte Private | 64% 36% | 68% 32% |
| Yield potential | ||
| Productive forestry 1 Unproductive forestry | 82% 18% | 85% 15% |
| Age class distribution | ||
| 0–10 years 11–20 years 21–30 years 31–40 years 41–50 years 51 years or over | 26% 36% 19% 13% 5% 1% | 14% 36% 28% 14% 6% 2% |
| Soil type | ||
| Brown earths and brown podzolics Lithosols Gleys/peaty gleys and gleyed grey brown podzolics Flushed blanket peat Cutaway raised bogs | 5% 12% 17% 48% 18% | 58% 9% 26% 7% 0% |
| Elevation | ||
| Less than 200 m | 93% | 26% |
| Distance to watercourse | ||
| Less than 200 m Between 200 and 400 m More than 400 m | 56% 26% 19% | 27% 28% 45% |
| Ecosystem Service | Range */Unit | Source |
|---|---|---|
| Timber | m3 | Forest growth and yield models used from British Forestry Commission (BFC) [27] |
| Deer cover | 1–10 | Relative suitability scores for forest land [28] ** |
| Deer forage | 1–10 | Relative suitability scores for forest land [28] ** |
| Hen harrier | 1–10 | [29,30,31] for forest land-uses, a distinction was made between first and subsequent rotation forests ** |
| Water sedimentation risk | 1–100 | [32] to indicate risk level based on soil type, upslope contributing area, distance from watercourse and land-use |
| Carbon | Tons Carbon (TC) | For conifers, individual tree root:shoot ratios from [33] and multiplied by the stems ha−1; For broadleaves, aboveground biomass on stand level based on equations from [34] and belowground biomass using [35]. Basic density for species from [36] and it was assumed that 50% of biomass was carbon [37] |
| Red squirrel | 1–10 | The relative suitability of canopy and species as a food source [38,39,40,41,42] |
| Nesting birds | 1–10 | For forests, species richness information from sampling published in [43,44] ** |
| Ground vegetation | 1–10 | For forests, species richness information from sampling published in [43,44] ** |
| Recreation | 1–10 | Scores for the Great Britain region were used [45]; a member of the Agricultural Ecology group determined relative permanence and structure of agricultural land-uses. Relative recreation scores were then assigned |
| Potential Future | Forest Certification * | Demand for Pulpwood | Demand for Sawnwood | Forest Policies and Regulations *** | Afforestation Premiums | |
|---|---|---|---|---|---|---|
| BAU | Same ** | Same | Same | Same | Same | |
| 2 | Same | 10% increase in price | 10% increase in price | Same | Same | |
| 3 | Attitude change only | 10% increase in price | Same | Water measures | New afforestation grants and premiums removed from 2012 onwards | |
| 4 | Same | Same | 10% decrease in price | Water measures | All afforestation premiums are increased by 20% |
| Potential Future | Demand for Sawnwood | Demand for Pulpwood | Demand for Rural Development * | Water Protection ** | Replanting Requirement *** | Sustainable Forest Management (SFM) **** |
|---|---|---|---|---|---|---|
| Business As Usual (BAU) | Same | Same | No combined heat and power (CHP) plant | Same | Same | Same |
| 2 | Same | Same | No CHP plant | Same | Lifted | Same |
| 3 | 10% increase in price | 10% increase in price | CHP plant built | Same | Same | Same |
| 4 | 10% increase in price | 10% increase in price | CHP plant built | Water measures | Same | SFM measures |
| 5 | Same | Same | No CHP plant | Water measures | Same | SFM measures |
| Development Stage | Native Woodland Site | Continuous Cover Forestry | Traditional Forest Management | ||||||
|---|---|---|---|---|---|---|---|---|---|
| Conifer | BL1 | Mixed | Conifer | BL | Mixed | Conifer | BL | Mixed | |
| Establishment | 15.00 | 17.50 | 20.00 | 15.00 | 17.50 | 17.50 | 5.00 | 12.50 | 12.50 |
| Young | 15.00 | 30.00 | 25.00 | 15.00 | 25.00 | 25.00 | 10.00 | 17.50 | 20.00 |
| Medium | 25.00 | 40.00 | 40.00 | 30.00 | 37.50 | 32.50 | 15.00 | 25.00 | 25.00 |
| Adult | 35.00 | 50.00 | 45.00 | 32.50 | 40.00 | 42.50 | 22.50 | 30.00 | 30.00 |
| Owner Type | Utility Factor |
|---|---|
| Coillte | 0.00 |
| Private forest owners | 0.50 |
| Tillage farmers | 0.75 |
| Ruminant farmers | 1.00 |
| Harvesting System | Pulp | Stake | Small Sawlog | Large Sawlog | Broadleaf (Firewood) |
|---|---|---|---|---|---|
| Harvester and forwarder | 26 | 41 | 53 | 61 | 42 |
| Harvester and cable system | 23 | 38 | 50 | 58 | 39 |
| Motor manual and cable system | 20 | 35 | 47 | 55 | 36 |
| Assortment | Volume (m3 ha−1) | Revenue (€ ha−1) | ||
|---|---|---|---|---|
| Harvester and Forwarder | Harvester and Cable Extraction | Motor Manual and Cable Extraction | ||
| (No Change) | ||||
| Pulp | 16 | 416.00 | 368.00 | 320.00 |
| Stake | 2 | 82.00 | 76.00 | 70.00 |
| Small sawlog | 79 | 4187.00 | 3950.00 | 3713.00 |
| Large sawlog | 175 | 10,675.00 | 10,150.00 | 9625.00 |
| Total | 272 | 15,360.00 | 14,544.00 | 13,728.00 |
| Scaling factor (new total divided by original total) | 0.947 | 0.894 | ||
| Potential Future (PF) | Potential Future with Rec | |
|---|---|---|
| BAU | 28.02% | 34.14% |
| 2 | 28.29% | 34.12% |
| 3 | 33.16% | 35.73% |
| 4 | 34.62% | 37.50% |
| Potential Future | Timber (m3) | Deer Cover (1–10) | Deer Forage (1–10) | Hen Harrier (1–10) | Water Sedimentation Risk (0–100) | Carbon (T C) | Red Squirrel (1–10) | Nesting Birds (1–10) | Ground Vegetation (1–10) | Recreation (1–10) |
|---|---|---|---|---|---|---|---|---|---|---|
| Initial (2012) | 329,705 | 2.18 | 5.14 | 4.67 | 6.25 | 1,250,855 | 0.24 | 9.18 | 3.77 | 2.61 |
| Desired | 355,625 | 2.50 | 3.20 | 2.60 | 2.00 | 6,750,000 | 2.20 | 8.79 | 3.80 | 6.00 |
| BAU | 337,577 | 2.28 | 5.20 | 4.27 | 6.31 | 2,064,619 | 0.40 | 9.09 | 3.83 | 2.75 |
| BAUGI | 352,000 | 2.30 | 5.19 | 4.24 | 6.33 | 2,051,228 | 0.41 | 9.09 | 3.82 | 2.73 |
| BAURec | 329,642 | 2.36 | 5.19 | 4.26 | 6.14 | 2,284,492 | 0.48 | 9.00 | 3.9 | 2.95 |
| BAUGI&Rec | 329,642 | 2.36 | 5.19 | 4.26 | 6.14 | 2,284,492 | 0.48 | 9.00 | 3.9 | 2.95 |
| PF2 | 344,829 | 2.35 | 5.17 | 4.19 | 6.27 | 2,016,714 | 0.41 | 9.06 | 3.81 | 2.72 |
| PF2GI | 347,653 | 2.35 | 5.16 | 4.18 | 6.27 | 2,007,045 | 0.41 | 9.06 | 3.8 | 2.67 |
| PF2Rec | 335,375 | 2.36 | 5.19 | 4.26 | 6.14 | 2,238,418 | 0.48 | 9.00 | 3.9 | 2.94 |
| PF2GI&Rec | 329,710 | 2.37 | 5.20 | 4.49 | 6.15 | 2,288,900 | 0.46 | 9.00 | 3.9 | 2.96 |
| PF3 | 85,989 | 2.58 | 5.34 | 4.68 | 5.44 | 3,268,961 | 0.49 | 8.93 | 4.05 | 3.19 |
| PF3GI | 85,926 | 2.58 | 5.34 | 4.68 | 5.44 | 3,278,134 | 0.48 | 8.93 | 4.05 | 3.19 |
| PF3Rec | 92,673 | 2.62 | 5.34 | 4.58 | 5.42 | 3,461,891 | 0.55 | 8.87 | 4.07 | 3.26 |
| PF3GI&Rec | 93,109 | 2.62 | 5.34 | 4.58 | 5.42 | 3,511,123 | 0.55 | 8.87 | 4.07 | 3.26 |
| PF4 | 262,479 | 2.51 | 5.20 | 4.39 | 5.54 | 2,444,454 | 0.54 | 8.95 | 3.94 | 3.05 |
| PF4GI | 268,076 | 2.51 | 5.20 | 4.40 | 5.54 | 2,429,849 | 0.54 | 8.96 | 3.94 | 3.04 |
| PF4Rec | 258,883 | 2.49 | 5.24 | 4.36 | 5.62 | 2,641,675 | 0.54 | 8.92 | 3.98 | 3.19 |
| PF4GI&Rec | 263,205 | 2.48 | 5.23 | 4.37 | 5.62 | 2,634,293 | 0.54 | 8.92 | 3.98 | 3.19 |
| Potential Future | Potential Future | Potential Future + Water Backcasting Policy | ||||
|---|---|---|---|---|---|---|
| Type 1 | Type 2 | Total | Type 1 | Type 2 | Total | |
| BAU | 3.59 | 0 | 3.59 | 1.91 | 2.88 | 4.79 |
| 2 | 2.74 | 0 | 2.74 | 1.50 | 1.64 | 3.14 |
| 3 | 3.59 | 0 | 3.59 | 1.65 | 3.04 | 4.69 |
| 4 | 4.83 | 0 | 4.83 | 3.28 | 2.64 | 5.92 |
| 5 | 6.36 | 0 | 6.36 | 4.20 | 2.57 | 6.77 |
| Potential Future | Timber (m3) | Deer Cover (1–10) | Deer Forage (1–10) | Hen Harrier (1–10) | Water Sedimentation Risk (0–100) | Carbon (T C) | Red Squirrel (1–10) | Nesting Birds (1–10) | Ground Vegetation (1–10) | Recreation (1–10) |
|---|---|---|---|---|---|---|---|---|---|---|
| Initial (2012) | 902,806 | 4.76 | 3.21 | 2.70 | 4.13 | 4,596,809 | 2.03 | 6.63 | 4.30 | 3.01 |
| Desired | 1,300,000 | 4.80 | 4.25 | 4.80 | To decrease | 13,500,000 | 3.75 | 7.50 | 5.00 | To increase |
| BAU1 | 812,954 | 4.79 | 4.15 | 2.89 | 4.58 | 5,368,476 | 2.40 | 6.75 | 4.95 | 4.05 |
| BAU1Rec | 801,492 | 4.79 | 4.20 | 2.88 | 4.49 | 5,544,390 | 2.37 | 6.73 | 4.96 | 4.31 |
| BAU1Water | 804,603 | 4.77 | 4.19 | 2.88 | 3.38 | 5,531,162 | 2.33 | 6.73 | 4.97 | 4.24 |
| BAU1Rec&Water | 786,310 | 4.76 | 4.25 | 2.88 | 3.37 | 5,829,555 | 2.44 | 6.72 | 5.00 | 4.45 |
| PF2 | 830,278 | 4.98 | 4.27 | 3.59 | 4.58 | 4,960,456 | 2.30 | 6.99 | 4.89 | 4.17 |
| PF2Rec | 820,511 | 4.97 | 4.32 | 3.57 | 4.51 | 5,155,018 | 2.29 | 6.97 | 4.91 | 4.40 |
| PF2Water | 808,048 | 4.96 | 4.37 | 3.66 | 3.23 | 5,345,316 | 2.32 | 6.99 | 4.94 | 4.50 |
| PF2Rec&Water | 826,521 | 4.98 | 4.32 | 3.67 | 3.25 | 5,100,024 | 2.27 | 7.00 | 4.90 | 4.25 |
| PF3 | 805,041 | 4.75 | 4.13 | 2.85 | 4.55 | 5,445,164 | 2.38 | 6.71 | 4.94 | 4.05 |
| PF3Rec | 793,869 | 4.75 | 4.16 | 2.84 | 4.47 | 5,578,775 | 2.36 | 6.70 | 4.96 | 4.27 |
| PF3Water | 783,822 | 4.75 | 4.19 | 2.83 | 3.38 | 5,659,044 | 2.39 | 6.69 | 4.97 | 4.32 |
| PF3Rec&Water | 778,508 | 4.75 | 4.20 | 2.83 | 3.37 | 5,703,695 | 2.37 | 6.69 | 4.98 | 4.38 |
| PF4 | 749,803 | 4.69 | 4.39 | 4.17 | 3.74 | 5,261,437 | 2.04 | 6.41 | 5.03 | 4.53 |
| PF4Rec | 741,682 | 4.70 | 4.40 | 4.17 | 3.73 | 5,383,794 | 2.03 | 6.40 | 5.04 | 4.67 |
| PF4Water | 803,414 | 4.68 | 4.25 | 4.30 | 3.42 | 4,617,958 | 1.92 | 6.50 | 4.92 | 4.15 |
| PF4Rec&Water | 823,573 | 4.73 | 4.26 | 4.50 | 3.45 | 4,532,851 | 1.85 | 6.48 | 4.93 | 4.33 |
| PF5 | 755,407 | 4.77 | 4.44 | 3.77 | 3.72 | 5,534,104 | 2.22 | 6.56 | 5.05 | 4.60 |
| PF5Rec | 745,231 | 4.78 | 4.44 | 3.73 | 3.70 | 5,742,926 | 2.21 | 6.53 | 5.06 | 4.76 |
| PF5Water | 800,385 | 4.78 | 4.25 | 3.59 | 3.41 | 4,884,514 | 2.24 | 6.72 | 4.92 | 4.13 |
| PF5Rec&Water | 819,017 | 4.77 | 4.18 | 3.69 | 3.48 | 4,725,067 | 2.15 | 6.75 | 4.89 | 4.15 |
| Ecosystem Service | GI | Rec | GI&Rec |
|---|---|---|---|
| Timber | 3 | 1 | 3 |
| Deer cover | 4 | 3 | 3 |
| Deer forage | 4 | 2 | 2 |
| Hen harrier | 3 | 3 | 3 |
| Water sedimentation risk | 3 | 3 | 3 |
| Carbon | 1 | 4 | 4 |
| Red squirrel | 3 | 4 | 4 |
| Nesting birds | 4 | 0 | 0 |
| Ground vegetation | 2 | 4 | 4 |
| Recreation | 3 | 4 | 4 |
| Number of ESs whose provision is improved or sustained in three or more potential futures when backcasting policies are implemented | 8 | 7 | 8 |
| Backcasting Policy | Scenario | |||
|---|---|---|---|---|
| BAU | PF2 | PF3 | PF4 | |
| GI | 6 | 7 | 8 | 7 |
| Rec | 8 | 6 | 9 | 5 |
| GI&Rec | 9 | 6 | 9 | 6 |
| Total | 23 | 19 | 26 | 18 |
| Ecosystem Service | Rec | Water | Rec&Water |
|---|---|---|---|
| Timber | 0 | 2 | 2 |
| Deer cover | 4 | 2 | 4 |
| Deer forage | 5 | 3 | 3 |
| Hen harrier | 1 | 2 | 2 |
| Water sedimentation risk | 5 | 5 | 5 |
| Carbon | 5 | 3 | 3 |
| Red squirrel | 0 | 3 | 1 |
| Nesting birds | 0 | 3 | 3 |
| Ground vegetation | 5 | 3 | 3 |
| Recreation | 5 | 3 | 3 |
| Number of ESs whose provision is improved or sustained in three or more potential futures when backcasting policies are implemented | 6 | 7 | 7 |
| Backcasting Policy | Scenario | ||||
|---|---|---|---|---|---|
| BAU | PF2 | PF3 | PF4 | PF5 | |
| Rec | 6 | 5 | 6 | 7 | 6 |
| Water | 5 | 8 | 7 | 4 | 5 |
| Rec&Water | 6 | 8 | 6 | 5 | 4 |
| Total | 17 | 21 | 19 | 16 | 15 |
© 2019 by the authors. Licensee MDPI, Basel, Switzerland. This article is an open access article distributed under the terms and conditions of the Creative Commons Attribution (CC BY) license (http://creativecommons.org/licenses/by/4.0/).
Share and Cite
Corrigan, E.; Nieuwenhuis, M. Evaluating Goal Programming as a Backcasting Tool to Assess the Impact of Local Stakeholder Determined Policies on the Future Provision of Ecosystem Services in Forested Landscapes. Forests 2019, 10, 386. https://doi.org/10.3390/f10050386
Corrigan E, Nieuwenhuis M. Evaluating Goal Programming as a Backcasting Tool to Assess the Impact of Local Stakeholder Determined Policies on the Future Provision of Ecosystem Services in Forested Landscapes. Forests. 2019; 10(5):386. https://doi.org/10.3390/f10050386
Chicago/Turabian StyleCorrigan, Edwin, and Maarten Nieuwenhuis. 2019. "Evaluating Goal Programming as a Backcasting Tool to Assess the Impact of Local Stakeholder Determined Policies on the Future Provision of Ecosystem Services in Forested Landscapes" Forests 10, no. 5: 386. https://doi.org/10.3390/f10050386
APA StyleCorrigan, E., & Nieuwenhuis, M. (2019). Evaluating Goal Programming as a Backcasting Tool to Assess the Impact of Local Stakeholder Determined Policies on the Future Provision of Ecosystem Services in Forested Landscapes. Forests, 10(5), 386. https://doi.org/10.3390/f10050386