Abstract
Urbanization leads to the occupation of green areas, directly contributing to a high level of fragmentation of urban green spaces, which, in turn, results in numerous socioeconomic and environmental problems. Consequently, an understanding of the relationships between patterns of urban green spaces and urbanization processes is essential. Although previous quantitative studies have examined this relationship, they have not included an exploration of spatial heterogeneities in the effects of urbanization on the spatial patterns of urban green areas. We therefore applied a spatiotemporal perspective to examine the above relationship, while considering the wider planning context. First, we quantified the extent of fragmentation of urban green spaces using landscape metrics comprising the largest patch index (LPI) and landscape shape index (LSI). Next, using the calculated spatial metrics and nighttime light data (NTL) for central Beijing for the period 1992–2016, we applied a geographically weighted regression model to assess variations in the spatiotemporal effects of urbanization on the fragmentation of urban green spaces. The results showed that urbanization initially occurred mainly in the northern parts of Beijing, whereas urbanization of southern urban fringe areas occurred after 2008. The reduction in green spaces along with increasing fragmentation and complex spatial patterns are indicative of issues relating to Beijing’s rapid urbanization and planning policies. This study contributes to an understanding of how urbanization influences fragmentation of urban green spaces and offers insights for the planning of urban green spaces from the perspective of promoting sustainability.
1. Introduction
Urbanization can be defined as a process of population aggregation within cities that results in sequential economic and social changes [1]. In China, the urbanization rate (i.e., the urban population as a percentage of the total population) increased from 17.9% in 1978 to 56.7% in 2016 and is expected to reach 70% by 2050 [2]. Previous studies have demonstrated that urbanization is often associated with a change in the pattern of urban green spaces [3]. This pattern entails occupation of green spaces [4] and directly contributes to a high level of fragmentation of urban green spaces that relates to morphological changes of green patches and their dispersion in space [5]. As crucial components of urban landscapes and ecosystems, urban green spaces play key roles in the provision of environmental services [6,7], contributing to improved physical health [8], fulfilling the psychological needs of urban citizens [9], and bringing about social and economic benefits [6,10]. The degradation and fragmentation of urban green spaces can lead to many environmental and socioeconomic problems [11,12]. Specifically, degradation of these spaces may result in the destruction of animals’ habitats, a reduction of biodiversity, and disruption of urban ecosystems [13]. Fragmentation is associated with an increased likelihood of biological invasions, a decline in the health of urban ecosystems, and deterioration in the quality of human living and working environments, thus hindering the achievement of sustainability [5]. Given the importance of green space in urban areas, a systematic and comprehensive understanding of the dynamics and spatiotemporal characteristics of the fragmentation of urban green spaces in relation to processes of rapid urbanization can contribute to informed decision making and the formulation of appropriate green policies.
Previous qualitative studies have demonstrated that urbanization plays a crucial role in determining the spatial patterns of urban green areas [3,14,15,16,17,18,19]. However, most of these studies have not explored spatial heterogeneities in the effects of urbanization on these spatial patterns. Moreover, because urbanization is a complex process, entailing both spatial and temporal variation across different cities [20], its characteristics cannot be fully captured through an analysis of spatial changes confined to one time period. It is necessary to explore quantitative relationships between spatial patterns of urban green areas and urbanization relating to spatiotemporal changes [21]. To address this gap, we focused especially on spatial and temporal heterogeneities in an examination of the relationships between spatial patterns of green spaces and urbanization, set against a context of wider planning policies.
An assessment of the spatiotemporal effects of urbanization on the fragmentation of urban green spaces requires an analysis of spatial and temporal changes relating urbanization with the fragmentation of urban green spaces. Landscape fragmentation metrics have been widely applied in studies using different quantitative representations to reveal the characteristics of urban spatial patterns. With a focus on spatial patterns, many of these studies have applied landscape metrics in combination with spatial-temporal gradient analysis to investigate fragmentation processes [5,22,23,24] and dynamics [3,17,25]. In this study, we applied landscape fragmentation metrics to measure the extent of fragmentation of urban green spaces. Previous studies were constrained by the lack of accurate and timely data indicating levels of urbanization in different sections of urban areas. The introduction of nighttime stable light (NTL) images has provided a new perspective that can be applied in spatial explorations of urbanization processes. These images have been widely used in recent studies to map urbanization processes [26,27], estimate populations [28], monitor changes in urban landscapes [29], and model economic activities [30,31]. Several studies have applied these data in combination with other methods to extract urban built-up areas with a high degree of accuracy [32,33,34,35,36]. Geographically weighted regression (GWR) is a spatial model that can be used to assess relationships between spatial patterns and their driving forces. Given that GWR is an established model that has been widely applied in studies on spatially varying relationships [37,38,39], it was used in this study to assess interactions between urbanization and levels of fragmentation of urban green spaces.
Given central Beijing’s rapid urbanization process, which has resulted in extensive loss of green spaces and dramatic changes in their spatial patterns, this area was selected for this analysis. It is a representative area in terms of its rapid urbanization process over the last two decades. It is also a representative area in terms of the evolution of various types of land use, making it an appropriate site for assessing changes in land use and in spatial patterns of landscapes. Whereas previous studies have primarily examined spatiotemporal changes of urban green spaces in built-up areas of Beijing [19,40,41], few have simultaneously explored spatial and temporal changes of urban green spaces and their relation to rapid urbanization processes in the context of wider planning policies.
Our aim in this study was, therefore, to apply both spatial and temporal perspectives in a case study of Beijing to advance understanding on processes of fragmentation of urban green spaces in relation to urbanization processes in the context of wider planning policies. Our main objectives were: (1) to examine the spatial pattern of the fragmentation process of urban green spaces within central Beijing using a time-series of remotely sensed images taken in 1992, 2000, 2008, and 2016 along with a set of landscape metrics; (2) to identify urbanization processes in different parts of central Beijing using NTL data; and (3) to explore the relationships between fragmentation of urban green spaces and urbanization in different central portions of this urban area to inform policy making.
2. Urbanization and Planning of Green Spaces in Beijing
Starting from the 1980s, Chinese cities have experienced the phenomenon of time–space compression of urbanization, accompanied by demographic changes, economic growth, redevelopment of inner city areas, and peri-urbanization, set against a background of wider national reform. This time–space compression relating to the urbanization process has also triggered dramatic changes in the spatial patterns of landscape, including trends of occupation of green spaces [42,43], loss of farmland, and fragmentation of landscapes [44]. Although efforts to develop new public green spaces and to preserve existing green spaces have been evident in some cities, various empirical studies on individual cities reveal an overall trend of decreasing urban green cover [45].
As China’s capital, Beijing has undergone an extremely rapid process of urban development over the last three decades. The city’s existing urban structure is the outcome of different versions of master plans and the market force. The earliest of these plans was the Master Plan of 1958, at which time, the total area of the inner greenbelt was 314 km2. As a result of considerable pressure associated with the drive for urbanization, the Master Plan of 1992 indicated that the area of this greenbelt had decreased to 240 km2 [46].
Beijing’s important role in economic, industrial, and international affairs was emphasized in the Urban Master Plan of 1992, as evidenced in the planning of new development zones, including high-tech industrial zones, a new Central Business District (CBD) in the area east of Tiananmen, and several large-scale residential zones in suburban areas. On the one hand, housing in the city’s core area was in short supply, and housing prices had risen and were higher than those in suburban areas [47]. On the other hand, considerable efforts were expended in improving urban roads and public transportation in suburban areas. By the 1990s, the construction of the Second and Third Ring Roads had been completed. The Fourth and Fifth Ring Roads were completed in 2001 and 2003, respectively. Moreover, the promotion of policy instruments and spatial policies resulted in the development of industrial and business parks [32]. Further, starting from the vicinity of the Fourth Ring Road and extending to the Fifth Ring Road in the north, several large residential neighborhoods, namely Huilongguan, Tiantongyuan, and Wangjing were gradually established over a period of time [48]. Beijing’s successful application to host the 2008 Summer Olympics provided further impetus for the city’s urban development process. To facilitate the spatial restructuring of Beijing propelled by the hosting of the Olympics, a “two axes—two belts” spatial structure and multiple functional centers were proposed in the Beijing Urban Master Plan of 2004 (Figure 1). However, because the northern area accommodated most of the Olympic facilities, this part had more and better infrastructure compared with the southern part, which is also reflected in higher housing prices in the former area [49,50].
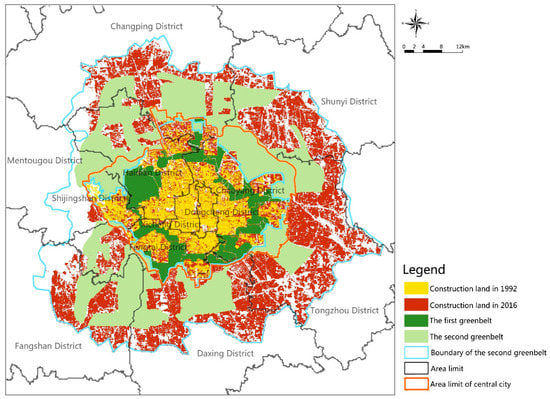
Figure 1.
The spatial distribution of urbanization and greenbelt in central Beijing.
On the one hand, the government has made considerable efforts to promote urban development, and on the other hand, it has shown an inclination to control the encroachment, through urban development, on green spaces. Since the 1990s, many of the planning policies formulated for the city have also entailed the preservation and creation of green spaces (see Table 1). In particular, after Beijing’s successful application to host the Summer Olympics in 2008, efforts to improve green planning of the northern Olympic area were intensified. However, although the first and second greenbelts were considered significant in official documents, these areas were fragmented [46]. With different policy initiatives along with rampant urban extension over the last three decades, Beijing serves as an ideal case for examining how rapid urbanization, set against the wider policy context, influences spatial and temporal changes within urban green spaces.

Table 1.
Green planning policies.
3. Methodology
3.1. Study Area
Beijing is located in northern China, adjacent to the city of Tianjin and Hebei Province. It covers an area of about 16,411 square kilometers, and its geographic coordinates are 39°26′ N to 41°03′ N and 115°25′ E to 117°30′ E. Statistical data indicate that Beijing’s gross domestic product (GDP) was 2301.459 billion Yuan and its urbanization rate was 86.5% in 2016 [51].
This study focuses on central Beijing, which is the functional core area of the capital. It encompasses the entire area of the districts of Dongcheng, Xicheng, Chaoyang, Fengtai, Shijingshan, most of the Haidian District, and small portions of the Changping, Daxing, and Mentougou Districts (Figure 2). Together, these areas covered an area of 1088 square kilometers, with a population of more than 8.5 million in 2016 [52].
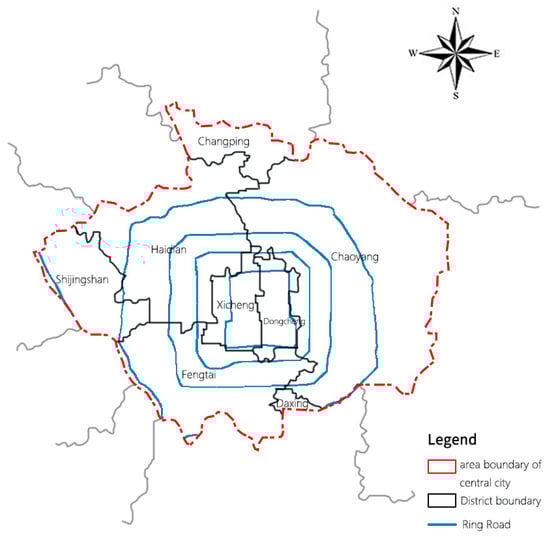
Figure 2.
The location of the study area.
3.2. Data
The “fragmentation of urban green spaces” and “urbanization” are important processes. Particular data and variables were used to test statistical hypotheses of spatiotemporal effects of urbanization on the fragmentation of urban green spaces.
Guided by previous studies [2,3,5,53], the fragmentation of urban green spaces was assessed by two selected landscape metrics: largest patch index and landscape shape index. We used FRAGSTATS (Version 4, https://www.umass.edu/landeco/research/fragstats/fragstats.html) to calculate several landscape pattern indices which can express the fragmentation degree of green space, including patch density, edge density, largest patch index, perimeter-to-area ratio, fractal dimension, and landscape shape index, and found that the numerical ranges of largest patch index (LPI) and landscape shape index (LSI) are obviously larger than those of other indices. Therefore, only these two indices were selected as dependent variables for further analysis. They can depict the fragmentation of urban green spaces from the perspectives of patch size and edge complexity respectively (Table 2). Among them, LPI is used to decipher landscape dominance. Generally, a low value indicates the fragmented status of the landscape, whereas a higher LPI value indicates the potentially unifying influence of a single dominant land-use patch. When there is only one patch in the landscape, LPI is equal to 100. LSI is applied to determine the complexity of a landscape. A higher value indicates a more fragmented and complex landscape.
Table 2.
Landscape metrics used in this study.
These two metrics can be calculated based on the Landsat images. They were processed using the ERDAS Imagine system (Version 8.5, ESRI, Atlanta, GA 30329-2137, USA) to obtain information on urban green spaces in central Beijing for the years 1992, 2000, 2008, and 2016. Six categories of land use were identified: grassland, farmland, water bodies, forested land, wasteland, and built-up land (Figure 3). The land use maps were divided into 30 m × 30 m grids using the Create Fishnet tool in ArcGIS (Environmental Systems Research Institute, Version 10.2, ESRI, Redlands, CA, USA).
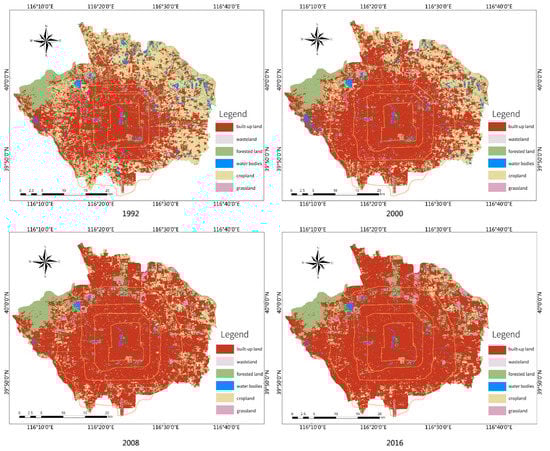
Figure 3.
Interpretive maps depicting land use in central Beijing in 1992, 2000, 2008, and 2016.
The urbanization processes were assessed by nighttime light data as the independent variable. As we have previously noted, NTL data enable an exploration of urbanization from a spatial perspective. Taking into account the spatial heterogeneities of the natural elements, NTL data are generated by spatial interpolation and could provide a finer resolution than administrative data for units-based spatial research. Accordingly, we applied NTL data for areas of 1 km × 1 km in 1992, 2000, 2008, and 2016, that were processed and archived at the National Geophysical Data Center [54].
3.3. Analytical Methods
3.3.1. Analysis of Landscape Pattern Index Values of Urban Green Spaces
To determine the impacts of changing urban green spaces during the period 1992–2016, we used the following two landscape metrics: the largest patch index (LPI) and the landscape shape index (LSI), which can indicate the extent of fragmentation of urban green spaces. Table 2 provides detailed definitions for each of these metrics. For each of the four years considered, the values of both landscape metrics were calculated using the FRAGSTATS (Version 4) program [55].
3.3.2. Light Inversion
The NTL data were obtained and recorded using Defense Meteorological Satellite Program-Operational Linescan System (DMSP-OLS) sensors. The data were obtained for areas of 1 km × 1 km for four years (1992, 2000, 2008, and 2016), and variations were calculated using GIS software (Figure 4). The normalized difference vegetation index (NDVI) index was used to construct the Vegatation Adjusted NTL Urban Index (VANUI) to improve the accuracy of the inversion results [56]. To verify the accuracy of the data, we took 1992, 2000, 2008 and 2016 as sample years, adding the results from the light inversion to obtain the total value for each area. The relationship between the light inversion data and the annual GDP values for each area were examined using regression analysis, which revealed that the inversion results from the NTL data were representative of the economic development of central Beijing, with an R2 value greater than 0.6 (Figure 5).
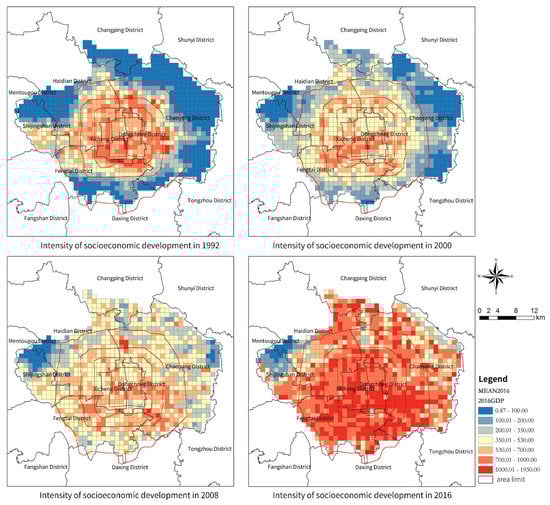
Figure 4.
Urbanization intensity (light inversion) in central Beijing in the years 1992, 2000, 2008, and 2016.
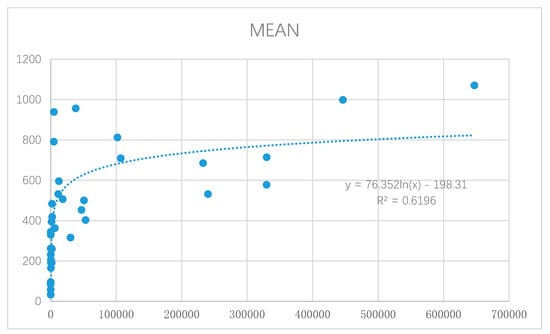
Figure 5.
A regression curve of the regional light index mean and gross domestic product (GDP) per capita values in 1992, 2000, 2008, and 2016.
3.3.3. Geographically Weighted Regression
In this study, we applied ordinary least squares (OLS) regression and GWR to quantify the relationship between fragmentation of urban green spaces and urbanization.
The OLS model was expressed as:
where xi represents the independent variables, y represents the dependent variables, β0 is the intercept, βi represents the coefficient of xi, k is the number of independent variables, and ε denotes the error term.
Y = β0 + ∑βixi + ε,
The GWR model, which extends traditional OLS regression, has been used widely to identify spatially varying relationships through the generation of a set of local-specific coefficients, which is appropriate for measuring non-stationary variations across space [21,38,57].
The GWR model can be expressed as:
where uj and vj denote the spatial positions of location j, β0 (uj,vj) is the intercept, and βi (uj,vj) is the local estimated coefficient for the independent variable of xij.
The estimation of parameters βi (uj,vj) was performed using the following equation:
where W(uj,vj) denotes an n × n matrix, the diagonal elements of which refer to the geographical weighting of observation data for observation i, while the off-diagonal elements have a value of 0. The weight matrix was calculated for each point i, for which parameters were estimated.
The GWR method entails the establishment of a kernel bandwidth to determine the extent of spatial dependence. The distance decay function is then used to weight all of the observations within the spatial unit, assuming that the influences exerted by closer observations are more significant than those of more distant observations.
We applied the Gaussian distance decay function to express geographic weights:
where wij denotes the weight for observation j within the neighborhood of observation i, dij denotes the distance between observations i and j, and h denotes the kernel bandwidth. We calculated the correlation coefficients between the landscape metrics and urbanization indicators to investigate potential linear relationships existing between them.
4. Results and Discussion
4.1. An Analysis of the Spatiotemporal Evolution of the Fragmentation of Urban Green Spaces
4.1.1. Largest Patch Index
As shown in Table 3, during the study period, the LPI values of farmland, forested land, and water bodies decreased, whereas the LPI value of grassland showed an increasing trend. Of these categories of urban green space, farmland showed the largest reduction in its LPI value, which decreased from 5.66 in 1992 to 0.22 in 2016. This finding indicates a gradual weakening of the previously dominant position of farmland in central Beijing. Overall, the total LPI value of all of the urban green spaces decreased significantly from 21.41 to 4.42 during the study period, suggesting that urban green spaces have been affected by human activities that have gradually resulted in the transformation of green spaces into built-up land.
Table 3.
Largest patch index values of green space in central Beijing for the period 1992–2016.
Spatial metrics were calculated using the ArcGIS program to explore the spatiotemporal evolution of the LPI values of urban green spaces in central Beijing during the period 1992–2016 (Figure 6). Changes in the LPI values of urban green spaces revealed a circular spatial distribution pattern from 1992 to 2000. In central Beijing, LPI values decreased by more than 70%, overall, with the exception of the Dongcheng, Xicheng, and Shijingshan Districts. From 2000 to 2008, more LPI values showed increases in western and central areas, whereas more LPI values showed decreases in the outermost eastern region. There was an expansion in areas demonstrating positive LPI values, especially in the Xicheng and Fengtai Districts, compared with the previous period. The decreasing LPI values of green spaces were concentrated outside of the Fifth Ring Road, especially in the northeastern area. This finding indicated that fragmentation of urban green spaces had intensified in this area prior to 2008. From 2008 to 2016, the pattern of changes in LPI values was more complex. During this period, the areas with positive LPI values were concentrated in the northeastern areas located between the Fourth and Fifth Ring Roads, as well as outside of the Fifth Ring Road. The areas demonstrating negative LPI values were located partly in the south and partly in the center of the study area, which indicated further fragmentation of urban green spaces toward the south. In sum, the LPI values of urban green spaces in central Beijing decreased during the study period. Spatially, the fragmentation took place from the Fourth Ring Road to the more northeast region outside the Fifth Ring Road, and then to some southern areas of the central city.
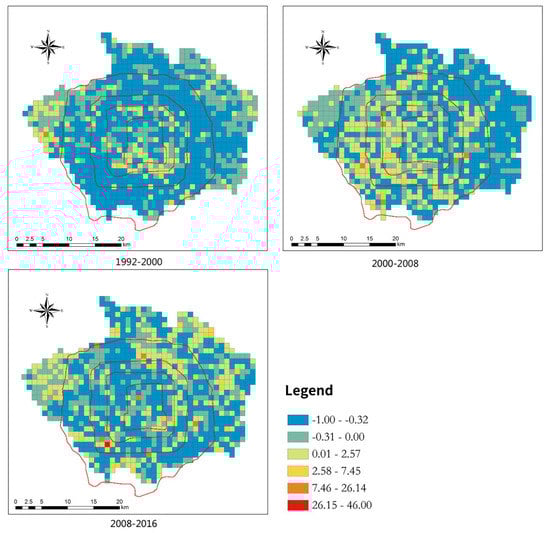
Figure 6.
Changes in the largest patch index values of urban green spaces in central Beijing during the period 1992–2016.
4.1.2. Landscape Shape Index
As shown in Table 4, the LSI values of farmland, water bodies, forested land, and grassland in central Beijing showed a decreasing trend during the study period. However, the LSI value of the total area of green spaces showed an increasing trend, rising from 86.15 in 1992 to 104.37 in 2016. Specifically, the LSI value of farmland increased from 89.57 to 98.41 from 1992 to 2000, and then decreased after 2000. The LSI value of grassland increased to some extent from 1992 to 2000 and then decreased during the period 2000–2008, subsequently increasing again, but reaching a lower value compared with the value in 1992. The LSI values of forested land and water bodies showed a clear decreasing pattern during the period 1992–2016. These results indicate that human interventions resulted in the simplification of the shapes of forested land and water bodies and, conversely, increased complexity in the shapes of green landscapes.
Table 4.
Landscape shape index values of green spaces in central Beijing during the period 1992–2016.
Figure 7 depicts the spatiotemporal evolution of LSI values of urban green spaces in central Beijing from 1992 to 2016. During the period 1992–2000, the LSI values of urban green spaces indicated a patch-like spatial distribution. The southeastern part of the Haidian District, the northwestern part of the Shijingshan District, the northern part of the Fengtai District, and the transition area located between the Dongcheng and Chaoyang Districts demonstrated negative LSI values for urban green spaces, indicating that the fragmentation degree of urban green spaces in these areas were weak. However, the LSI values of urban green spaces increased significantly outside of the Fourth Ring Road, especially in the northeastern part of the central city. The shapes of urban green spaces in these regions were more complex and fragmented. From 2000 to 2008, the variations in the LSI values of urban green spaces resulted in a disorderly spatial structure. Areas with decreasing LSI values extended further south, and areas with increasing LSI values were concentrated in the northern part, indicating greater complexity of urban green spaces in the latter part of the city. During the period 2008–2016, the areas with decreasing LSI values were concentrated in the central part, whereas there were more areas with increasing LSI values. Consequently, 60% of the study area demonstrated increased complexity and fragmentation. The above findings thus reveal greater complexity and fragmentation in relation to the shapes of urban green spaces during the entire study period.
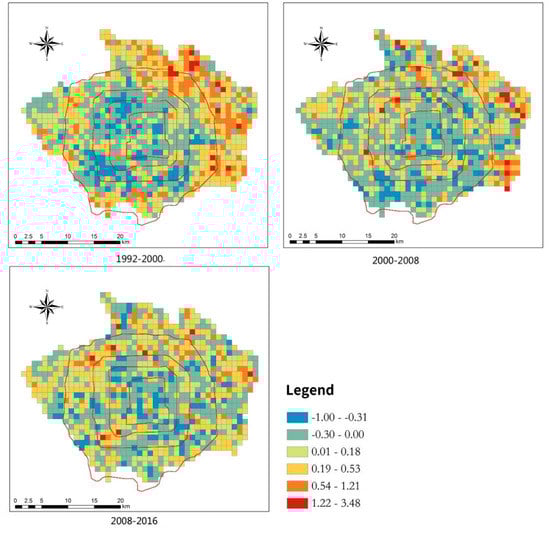
Figure 7.
Changes in the landscape shape index values of urban green spaces in central Beijing from 1992 to 2016.
4.2. Comparison of the Results of the OLS and GWR Models
The statistical spatial analysis was conducted using Macroecology software, and the simulation results of the GWR model were obtained consequently. In addition, to compare and verify the reliability of the GWR model, we applied the sigma model and calculated the Akaike information criterion (AIC) for both the OLS and GWR models (see Table 5). The LPI and LSI index variation sigma values generated from the GWR model were lower than those generated with the OLS model, and the GWR residual value also declined significantly. Moreover, the AIC values obtained with the GWR model were significantly lower than those obtained with the OLS model, indicating a closer approximation of the GWR model to the actual situation [58]. In all cases, and for different periods, lower sigma and AIC values were obtained with the GWR model than with the OLS model, demonstrating the better performance of the GWR model in determining relationships between fragmentation of urban green spaces and urbanization.
Table 5.
Simulation results for the geographically weighted regression (GWR) and ordinary least squares (OLS) models.
4.3. The Effect of Urbanization on the Fragmentation of Urban Green Spaces
The influences of urbanization on two landscape metrics varied regarding the values of R2. The higher R2 of 0.563 indicated that NTL had a strong ability to explain the evolution of LSI. In contrast, NTL had a relatively poor explanatory capacity for the change of LPI. The impact of NTL on LSI was more direct than that of LPI. Highly correlated with LSI, NTL can directly affect the dispersion of green space in space. The indirect influence of the NTL factor on LPI indicated that LPI may be also affected by other factors such as GDP, population density, land use policies, and urban planning. However, the NTL data could explain the spatial and temporal changes of LPI in relation to the urbanization.
The spatially varying coefficients indicated that relationships existed between fragmentation of urban green spaces and urbanization during different periods. As shown in Figure 8, the effects of urbanization on variations in LPI values differed across the entire study area during different periods. Overall, from 1992 to 2008, significant negative correlation coefficients (with values below zero) were observed in the study area. An evident reduction in areas demonstrating negative urbanization effects on LPI values was correlated with the ongoing urbanization process. In particular, during the period 2008–2016, variations in LPI values in southern areas were positively correlated with urbanization. From 2000 to 2008, a layered structure resulting from the impact of urbanization on changes in LPI values in Beijing was evident. Moving from the center to the boundary of the study area, variations in the influence of urbanization gradually became apparent, with its negative influence being more significant in the urban periphery than in the city core. There was a significant increase in the LPI value of southwestern Beijing, which was a newly developing area, during the period 2008–2016, especially in the Shijingshan and Fengtai Districts. Conversely, during previous periods, urbanization was negatively associated with variations in LPI values in the same area. Several parks were developed in the southwestern districts during the period 2008–2016, which may account for the positive correlations between urbanization and variations in LPI values in these places.
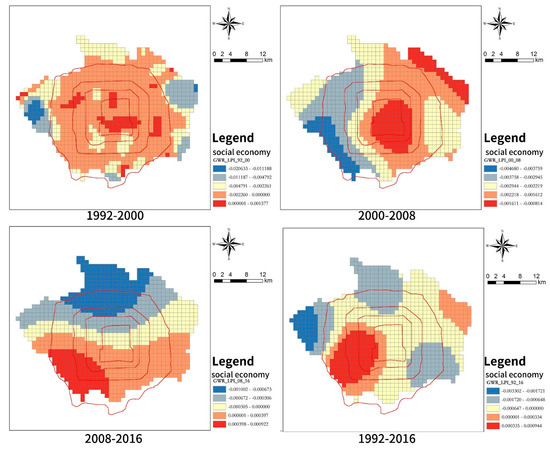
Figure 8.
Spatial distribution map of coefficients between urbanization and largest patch index values of green space in central Beijing during the period 1992–2016.
Figure 9 shows the varying spatiotemporal effects of urbanization on LSI values. During the period 1992–2000, LSI values and urbanization were negatively correlated in most parts of the study area, while significantly positive correlations were observed only in city fringe areas and rural areas, especially in Huilongguan, Beiyuan, and Gongzhufen. During the period 2000–2008, variations in LSI values in the central areas were negatively correlated with urbanization. However, because of insufficient space for further development within the city core, the impacts of rapid urbanization on the LSI values of urban green spaces may have been dispersed after 2000, resulting in a greater number of irregular patches in the coefficient map. This could be explained as a relay-race effect of changes in landscape spatial patterns in response to urbanization: the former city core gradually became stabilized, whereas the city fringes underwent rapid transformations in the spatial patterns of their landscapes [59]. Fringe and rural areas with more significantly positive effects expanded during the period 2008–2016. This was particularly apparent in the southern part of the study area, where accelerating urbanization could have led to more complex patterns of urban green spaces than those observed during other periods.
Figure 9.
Spatial distribution map of coefficients between urbanization values and landscape shape index values of green spaces in central Beijing from 1992 to 2016.
Generally, from 1992 to 2016, the urbanization process had a greater influence on green spaces in the northern part of the city, and especially the northwestern part. Moreover, urbanization drove the process of fragmentation of green spaces first in northern suburban areas and then gradually, over time, in southern areas. These results are also correlated with the different phases of urbanization in Beijing.
4.4. Implications for Urban Green Space Planning and Urbanization
This study shows that there was temporal change and spatial heterogeneity in the impacts of urbanization on fragmentation of urban green spaces. Using GWR to measure correlation coefficients between NTL and landscape patterns could provide valuable references for the planning of an urban green system. The results of the study shed light on different phases of Beijing’s urbanization process from a spatial perspective, revealing the association of urban growth with more complex spatial patterns of urban green space patterns. Overall, since the 1990s, urbanization has been apparent in northern parts of Beijing. Urbanization of the southern part mainly occurred after 2000. Driven by different green planning policies, the spatial and temporal associations between urbanization and green space fragmentation display some unique patterns (e.g., a positive association between urbanization and variations in LPI values between 2008 and 2016). Although the government has attempted to control encroachment on green spaces prompted by urban development, it seems that some of these policies have failed to meet their objectives. The two greenbelts underwent fragmentation during different phases of urbanization, which may have been caused by significant conflicts between the goals of real estate development and green space protection. Over the years, compensation prices relating to the occupation of green spaces have been considerably lower than the economic benefits gained from real estate and other business activities, which greatly enhanced the appeal of new developments [46]. Another possible reason for the ineffectiveness of greening policies was the distribution of planning responsibilities among different governmental departments. Thus, competing interests could have led to the implementation of conflicting plans in the same area. However, some policies may have been implemented more effectively. For example, the development of the Olympic Park, which is located along the east–west axis between the northern Fourth and Fifth Ring Roads, has led to an increase in urban green spaces. The intervention of this policy to promote “the face of the country” has resulted in more effective implementation of this type of green planning. However, the overall decline in green spaces along with increasing fragmentation and complexity in their spatial patterns is also indicative of other issues relating to Beijing’s green planning, including the uneven distribution of green spaces and poor planning/construction of urban green spaces (e.g., a focus on beautification rather than on ecological principles).
Thus a dilemma exists as a result of encroachment on green spaces via urbanization and concurrent policies, and plans for the construction of urban green spaces. From the perspective of sustainability, the most appropriate strategy would be to maintain natural green spaces and prevent their encroachment, prompted by urban development, as this would improve ecological connectivity and integration, thus effectively supporting ecosystems. Although boundaries for ecological areas have been proposed within Beijing’s new Master Plan, their effectiveness is contingent on how they are implemented. Recently, a trend of vigorous development has been evident in southern cities. Attention should therefore focus on protecting natural green spaces from the outset. At the same time, new green spaces can be developed in urbanized areas, which would also improve their living environments. According to Beijing’s new Master Plan, the government will vacate an area of land of approximately 32 km2 within central Beijing. This vacated land would be considered to be developed into green spaces rather than being developed as real estate. A sustainability-oriented perspective is needed in planning and development that entails a consideration of ecological principles along with extensive efforts to ensure the optimal quantity, spatial distribution, and quality of green spaces.
5. Conclusions
In this study, we examined the varying spatiotemporal effects of urbanization on the fragmentation of urban green space in central Beijing using calculated spatial metrics at local levels and DMSP/OLS nighttime light data inputted into a GWR model. The spatiotemporal perspective adopted is this study can facilitate a comprehensive understanding of spatial and temporal heterogeneities in the relationships between spatial patterns of green spaces and urbanization, which is rarely discussed in previous literature. The results of the GWR model revealed how urbanization processes within the central city influenced spatial patterns of urban green during different periods. They indicated that rapid urbanization not only led to the occupation of green spaces but it also directly contributed to a high level of fragmentation of urban green spaces. The main sites of urbanization during the initial stage were northern parts of the city. However, because of insufficient space to accommodate further development, the urban fringes in the southern parts also underwent urbanization, especially after 2008. The results of this study suggest that urban fringes and rural areas underwent dramatic changes in the spatial patterns of their green areas during the study period. Moreover, a majority of the varying policies introduced by the government for protecting green spaces and constructing new green areas seem to have failed.
Changes in the spatial patterns of urban green areas were found to be closely associated with Beijing’s dynamic spatial structure, which was affected by its rapid urbanization and by urban policies. The green planning of Beijing in the future will undoubtedly be influenced by wider urban policies and by the new Master Plan. Planning responsibilities that were previously distributed across different planning departments have been merged with the recently established Ministry of Natural Resources, which may contribute to improved implementation of different planning policies. From the perspective of sustainability, concerted efforts will be needed to protect existing natural green spaces, while simultaneously planning and introducing more high-quality and equally distributed urban green spaces in space are essential under the purview of a consistent and strategic spatial planning system. Meanwhile, future green space planning requires considering residents’ perceptions via more public participation as physical planning may not be able to meet people’s real needs. Continuous and effective evaluation on urban green spaces is also required for reviewing planning policies and their implementation.
Although this study integrates multiple data sources and analytical methods to improve the reliability of the results, it still has several limitations. First, landscape patterns are scale-dependent and associated influences in relation to urbanization are also sensitive to spatial scales [42]. The grid size of land use was chosen as 30 m × 30 m in this study. It does not consider smaller green areas, that may be newly introduced or be the consequence from the fragmentation of the existing dominated green areas, which can still contribute to the overall green infrastructure in central Beijing. Secondly, most of urbanization data are limited by statistical units; the NTL data were applied to assess the urbanization process. It could not comprehensively reveal the spatial differentiation of the impacts of urbanization factors on fragmentation of urban green spaces. In the future, the scale effect of landscape patterns should be further explored using higher precision satellite images. As to the urbanization factors, population density and gross domestic product should be measured more finely to explain and understand the underlying relationships between the urbanization process and fragmentation of urban green spaces. Ecosystem service changes of urban forests in relation to urbanization is also one of the future research foci in ecology and geography.
Author Contributions
Conceptualization, F.L., W.Z.; methodology, F.L. and J.L.; software, F.L. and J.L.; validation, F.L.; formal analysis, F.L., W.Z.; investigation, F.L.; resources, F.L. and J.L.; data curation, F.L. and J.L.; writing—original draft preparation, F.L.; writing—review and editing, F.L., W.Z., Y.W., S.X. and S.G.; visualization, F.L. and J.L.; supervision, F.L. and X.L.; project administration, F.L. and X.L.; funding acquisition, F.L., X.L. and C.Y.
Funding
This research was funded by the Beijing Natural Science Foundation (Grant NO. 8194071); Humanities and Social Sciences Fund of the Ministry of Education (NO. 19YJC760042); China Postdoctoral Science Foundation (NO. 2018M641222); the Fundamental Research Funds for the Central Universities (NO. BLX201808), National Natural Science Foundation of China (Grant No.31670704), Research and Development Plan of Beijing Municipal Science and Technology Commission (Grant No.D17110900710000), and State Key Laboratory of Subtropical Building Science (Grant No.2017ZB09).
Acknowledgments
We thank Radhika Johari from Liwen Bianji, Edanz Editing China (www.liwenbianji.cn/ac), for editing the English text of the draft of this manuscript.
Conflicts of Interest
The authors declare no conflicts of interest.
References
- Han, J.; Hayashi, Y.; Cao, X.; Imura, H. Application of an integrated system dynamics and cellular automata model for urban growth assessment: A case study of Shanghai, China. Landsc. Urban Plan. 2009, 91, 133–141. [Google Scholar] [CrossRef]
- Shen, J.; Cheng, S.; Gunson, A.J.; Wan, H. Urbanization, sustainability and the utilization of energy and mineral resources in China. Cities 2005, 22, 287–302. [Google Scholar] [CrossRef]
- Kong, F.; Nakagoshi, N. Changes of Urban Green Spaces and Their Driving Forces: A Case Study of Jinan City, China. J. Int. Dev. Coop. 2005, 11, 97–109. [Google Scholar]
- Harrison, P.; Pearce, F. AAAS Atlas of Population and Environment; University of California Press: Berkeley, CA, USA, 2001. [Google Scholar]
- Tian, Y.; Jim, C.Y.; Tao, Y.; Shi, T. Landscape ecological assessment of green space fragmentation in Hong Kong. Urban For. Urban Green. 2011, 10, 79–86. [Google Scholar] [CrossRef]
- Chiesura, A. The role of urban parks for the sustainable city. Landsc. Urban Plan. 2004, 68, 129–138. [Google Scholar] [CrossRef]
- Zeng, H.; Wu, X.B. Utilities of edge-based metrics for studying landscape fragmentation. Comput. Environ. Urban Syst. 2005, 29, 159–178. [Google Scholar] [CrossRef]
- Takano, T.; Nakamura, K.; Watanabe, M. Urban residential environments and senior citizens’ longevity in megacity areas: The importance of walkable green spaces. J. Epidemiol. Community Health 2002, 56, 913–918. [Google Scholar] [CrossRef] [PubMed]
- Ulrich, R.S. Natural Versus Urban Scenes Some Psychophysiological Effects. Environ. Behav. 1981, 13, 523–556. [Google Scholar] [CrossRef]
- Coley, R.L.; Sullivan, W.C.; Kuo, F.E. Where Does Community Grow?The Social Context Created by Nature in Urban Public Housing. Environ. Behav. 1997, 29, 468–494. [Google Scholar] [CrossRef]
- Botequilha Leitato, A.; Ahern, J. Applying landscape ecological concepts and metrics in sustainable landscape planning. Landsc. Urban Plan. 2002, 59, 65–93. [Google Scholar] [CrossRef]
- Marulli, J.; Mallarach, J.M. A GIS methodology for assessing ecological connectivity: Application to the Barcelona Metropolitan Area. Landsc. Urban Plan. 2005, 71, 243–262. [Google Scholar] [CrossRef]
- Kim, K.H.; Pauleit, S. Landscape character, biodiversity and land use planning: The case of Kwangju City Region, South Korea. Land Use Policy 2007, 24, 264–274. [Google Scholar] [CrossRef]
- You, H. Quantifying Urban Fragmentation under Economic Transition in Shanghai City, China. Sustainability 2016, 8, 21. [Google Scholar] [CrossRef]
- Byomkesh, T.; Nakagoshi, N.; Dewan, A.M. Urbanization and green space dynamics in Greater Dhaka, Bangladesh. Landsc. Ecol. Eng. 2012, 8, 45–58. [Google Scholar] [CrossRef]
- Yi, Y.; Zhao, Y.; Ding, G.; Gao, G.; Shi, M.; Cao, Y. Effects of Urbanization on Landscape Patterns in a Mountainous Area: A Case Study in the Mentougou District, Beijing, China. Sustainability 2016, 8, 1190. [Google Scholar] [CrossRef]
- Li, Y.; Liu, G. Characterizing Spatiotemporal Pattern of Land Use Change and Its Driving Force Based on GIS and Landscape Analysis Techniques in Tianjin during 2000–2015. Sustainability 2017, 9, 894. [Google Scholar] [CrossRef]
- Zhou, X.; Wang, Y.C. Spatial-temporal dynamics of urban green space in response to rapid urbanization and greening policies. Landsc. Urban Plan. 2011, 100, 268–277. [Google Scholar] [CrossRef]
- Ju, H.; Zhang, Z.; Zuo, L.; Wang, J.; Zhang, S.; Wang, X.; Zhao, X. Driving forces and their interactions of built-up land expansion based on the geographical detector—A case study of Beijing, China. Int. J. Geogr. Inf. Sci. 2016, 30, 2188–2207. [Google Scholar] [CrossRef]
- Torrens, P.M. Calibrating and Validating Cellular Automata Models of Urbanization. In Urban Remote Sensing: Monitoring, Synthesis and Modeling in the Urban Environment; Wiley: Hoboken, NJ, USA, 2011. [Google Scholar]
- Li, C.; Zhao, J.; Xu, Y. Examining spatiotemporally varying effects of urban expansion and the underlying driving factors. Sustain. Cities Soc. 2017, 28, 307–320. [Google Scholar] [CrossRef]
- Hepcan, Ş. Analyzing the pattern and connectivity of urban green spaces: A case study of Izmir, Turkey. Urban Ecosyst. 2013, 16, 279–293. [Google Scholar] [CrossRef]
- Inostroza, L.; Baur, R.; Csaplovics, E. Urban sprawl and fragmentation in Latin America: A dynamic quantification and characterization of spatial patterns. J. Environ. Manag. 2013, 115, 87. [Google Scholar] [CrossRef]
- Tao, Y.; Li, F.; Wang, R.; Zhao, D. Research progress in the quantitative methods of urban green space patterns. Acta Ecol. Sin. 2013, 33, 2330–2342. [Google Scholar] [CrossRef]
- Wei, Y.; Zhang, Z. Assessing the fragmentation of construction land in urban areas: An index method and case study in Shunde, China. Land Use Policy 2012, 29, 417–428. [Google Scholar] [CrossRef]
- Yi, K.; Tani, H.; Li, Q.; Zhang, J.; Guo, M.; Bao, Y.; Wang, X.; Li, J. Mapping and Evaluating the Urbanization Process in Northeast China Using DMSP/OLS Nighttime Light Data. Sensors 2014, 14, 3207–3226. [Google Scholar] [CrossRef] [PubMed]
- Zhang, Q.; Seto, K.C. Mapping urbanization dynamics at regional and global scales using multi-temporal DMSP/OLS nighttime light data. Remote Sens. Environ. 2011, 115, 2320–2329. [Google Scholar] [CrossRef]
- Lo, C.P. Modeling the Population of China Using DMSP Operational Linescan System Nighttime Data. Photogram. Eng. Remote Sens. 2001, 67, 1037–1048. [Google Scholar]
- Yu, B.; Shu, S.; Liu, H.; Song, W.; Wu, J.; Wang, L.; Chen, Z. Object-based spatial cluster analysis of urban landscape pattern using nighttime light satellite images: A case study of China. International Int. J. Geogr. Inf. Sci. 2014, 28, 2328–2355. [Google Scholar] [CrossRef]
- Doll, C.N.H.; Muller, J.P.; Morley, J.G. Mapping regional economic activity from night-time light satellite imagery. Ecol. Econ. 2006, 57, 75–92. [Google Scholar] [CrossRef]
- Li, X.; Xu, H.; Chen, X.; Li, C. Potential of NPP-VIIRS Nighttime Light Imagery for Modeling the Regional Economy of China. Remote Sens. 2013, 5, 3057–3081. [Google Scholar] [CrossRef]
- Yang, Y.; He, C.; Zhang, Q.; Han, L.; Du, S. Timely and accurate nationalscale mapping of urban land in China using Defense Meteorological Satellite Program’s Operational Linescan System nighttime stable light data. J. Appl. Remote Sens. 2013, 7, 073535. [Google Scholar] [CrossRef]
- Gan, B.; Yang, Y. The Study on Urban Built-up Change Information Extraction Method Using DMSP /OLS Data—A Case Study of Shaanxi Province. Urban Geotech. Investig. Surv. 2014, 6, 5–9. [Google Scholar]
- Su, Y.; Chen, X.; Wang, C.; Zhang, H.; Liao, J.; Ye, Y.; Wang, C. A new method for extracting built-up urban areas using DMSP-OLS nighttime stable lights: A case study in the Pearl River Delta, southern China. GISci. Remote Sens. 2015, 52, 218–238. [Google Scholar] [CrossRef]
- Huang, Q.; Yang, X.; Gao, B.; Yang, Y.; Zhao, Y. Application of DMSP/OLS nighttime light images: A meta-analysis and a systematic literature review. Remote Sens. 2014, 6, 6844–6866. [Google Scholar] [CrossRef]
- Ma, X.; Tong, X.; Liu, S.; Luo, X.; Xie, H.; Li, C. Optimized Sample Selection in SVM Classification by Combining with DMSP-OLS, Landsat NDVI and GlobeLand30 Products for Extracting Urban Built-Up Areas. Remote Sens. 2017, 9, 236. [Google Scholar] [CrossRef]
- Brunsdon, C.; Fotheringham, A.S.; Charlton, M.E. Geographically Weighted Regression: A Method for Exploring Spatial Nonstationarity. Geogr. Anal. 1996, 28, 281–298. [Google Scholar] [CrossRef]
- Fotheringham, A.S.; Brunsdon, C.; Charlton, M. Geographically Weighted Regression: The Analysis of Spatially Varying Relationships. Am. J. Agric. Econ. 2002, 86, 554–556. [Google Scholar]
- Sheehan, K.R.; Strager, M.P.; Welsh, S.A. Advantages of Geographically Weighted Regression for Modeling Benthic Substrate in Two Greater Yellowstone Ecosystem Streams. Environ. Model. Assess. 2013, 18, 209–219. [Google Scholar] [CrossRef]
- Zhao, J.; Ouyang, Z.; Xu, W.; Zheng, H.; Meng, X. Sampling adequacy estimation for plant species composition by accumulation curves—A case study of urban vegetation in Beijing, China. Landsc. Urban Plan. 2010, 95, 113–121. [Google Scholar] [CrossRef]
- Qian, Y.; Zhou, W.; Li, W.; Han, L. Understanding the dynamic of greenspace in the urbanized area of Beijing based on high resolution satellite images. Urban For. Urban Green. 2015, 14, 39–47. [Google Scholar] [CrossRef]
- Li, H.; Peng, J.; Liu, Y.; Hu, Y. Urbanization impact on landscape patterns in Beijing City, China: A spatial heterogeneity perspective. Ecol. Indic. 2017, 82, 50–60. [Google Scholar] [CrossRef]
- Kong, F.; Nakagoshi, N. Spatial-temporal gradient analysis of urban green spaces in Jinan, China. Landsc. Urban Plan. 2006, 78, 147–164. [Google Scholar] [CrossRef]
- Su, S.; Xiao, R.; Jiang, Z.; Zhang, Y. Characterizing landscape pattern and ecosystem service value changes for urbanization impacts at an eco-regional scale. Appl. Geogr. 2012, 34, 295–305. [Google Scholar] [CrossRef]
- Chen, W.Y.; Hu, F.Z.Y. Producing nature for public: Land-based urbanization and provision of public green spaces in China. Appl. Geogr. 2015, 58, 32–40. [Google Scholar] [CrossRef]
- Li, F.; Wang, R.; Paulussen, J.; Liu, X. Comprehensive concept planning of urban greening based on ecological principles: A case study in Beijing, China. Landsc. Urban Plan. 2005, 72, 325–336. [Google Scholar] [CrossRef]
- Zhou, Y.; Ma, L.J.C. Economic restructuring and suburbanization in China. Appl. Geogr. 2000, 21, 205–236. [Google Scholar]
- Yang, Z.; Cai, J.; Ottens, H.F.L.; Sliuzas, R. Beijing. Cities 2011, 31, 491–506. [Google Scholar] [CrossRef]
- Zou, Y.; Mason, R.; Zhong, R. Modeling the polycentric evolution of post-Olympic Beijing: An empirical analysis of land prices and development intensity. Urban Geogr. 2015, 36, 735–756. [Google Scholar] [CrossRef]
- Deng, Y.; Gyourko, J.; Wu, J. Land and House Price Measurement in China (No. w18403); National Bureau of Economic Research: Cambridge, MA, USA, 2012. [Google Scholar]
- National Statistical Yearbook. 2016. Available online: http://www.stats.gov.cn/tjsj/ndsj/2016/indexch.htm (accessed on 19 February 2018).
- Beijing Regional Statistical Yearbook. 2016. Available online: http://www.bjstats.gov.cn/nj/qxnj/2016/zk/indexch.htm (accessed on 19 February 2018).
- Geneletti, D. Using spatial indicators and value functions to assess ecosystem fragmentation caused by linear infrastructures. Int. J. Appl. Earth Obs. Geoinf. 2004, 5, 1–15. [Google Scholar] [CrossRef]
- National Geophysical Data Center. Available online: http://www.ngdc.noaa.gov (accessed on 8 April 2018).
- FRAGSTATS: Spatial Pattern Analysis Program for Categorical Maps. Available online: https://www.umass.edu/landeco/research/fragstats/downloads/fragstats_downloads.html (accessed on 1 June 2012).
- Zhuo, L.; Zhang, X.; Zheng, J.; Tao, H.; Guo, Y. An EVI-based method to reduce saturation of DMSP/OLS nighttime light data. Acta Geogr. Sin. 2015, 70, 1339–1350. [Google Scholar]
- Gao, J.; Li, S. Detecting spatially non-stationary and scale-dependent relationships between urban landscape fragmentation and related factors using Geographically Weighted Regression. Appl. Geogr. 2011, 31, 292–302. [Google Scholar] [CrossRef]
- Wang, Q.; Ni, J.; Tenhunen, J. Application of a geographically-weighted regression analysis to estimate net primary production of Chinese forest ecosystems. Glob. Ecol. Biogeogr. 2005, 14, 379–393. [Google Scholar] [CrossRef]
- Weng, Y.-C. Spatiotemporal changes of landscape pattern in response to urbanization. Landsc. Urban Plan. 2007, 81, 341–353. [Google Scholar] [CrossRef]
© 2019 by the authors. Licensee MDPI, Basel, Switzerland. This article is an open access article distributed under the terms and conditions of the Creative Commons Attribution (CC BY) license (http://creativecommons.org/licenses/by/4.0/).