Article

Comparative Assessment of Vegetation Dynamics under the Influence of Climate Change and Human Activities in Five Ecologically Vulnerable Regions of China from 2000 to 2015

1
Department of Geography, School of Geography and Tourism, Shaanxi Normal University, Xi’an 710119, China
2
State Key Laboratory of Urban and Regional Ecology, Research Center for Eco-Environmental Science, Chinese Academy of Sciences, Beijing 100085, China
3
School of Tourism &Research Institute of Human Geography, Xi’an International Studies University, Xi’an 710128, China
*
Author to whom correspondence should be addressed.
Forests 2019, 10(4), 317; https://doi.org/10.3390/f10040317
Submission received: 31 January 2019 / Revised: 2 April 2019 / Accepted: 4 April 2019 / Published: 7 April 2019
(This article belongs to the Section Forest Ecology and Management)

Abstract

:
Ongoing climate change and human activities have a great effect on vegetation dynamics. Understanding the impact of climate change and human activities on vegetation dynamics in different ecologically vulnerable regions has great significance in ecosystem management. In this study, the predicted NPP (Net Primary Productivity) and the actual NPP based on different ecological process data and models were combined to estimate the vegetation dynamics and their driving forces in the Northern Wind-sand, Loess Plateau, Arid Desert, Tibetan Plateau, and Karst regions from 2000 to 2015. The results indicated that the NPP in all ecologically vulnerable regions showed a restoration trend, except for that in the Karst region, and the percentage of areas in which NPP increased were, in order, 78% for the Loess Plateau, 71% for the Northern Wind-sand, 69% for the Arid Desert, 54% for the Tibetan Plateau, and 31% for the Karst regions. Vegetation restorations in the Northern Wind-sand and Arid Desert regions were primarily attributable to human activities (86% and 61% of the restoration area, respectively), indicating the success of ecological restoration programs. The Loess Plateau had the largest proportion of vegetation restoration area (44%), which was driven by combined effects of climate and human factors. In the Tibetan Plateau, the vegetation changes due to climate factors were primarily distributed in the west, while those due to human factors were primarily distributed in the east. Human activities caused nearly 60% of the vegetation degradation in the Karst region. Based on these results, it is recognizable that regional climate conditions are the key factor that limits ecological restoration. Therefore, future policy-making should pay more attention to the local characteristics of different ecological vulnerable regions in regional ecosystem management to select reasonable restoration measures, improve restoration efficiency, and maximize the benefits of ecological restoration programs.

1. Introduction

China is one of the most ecologically degraded countries in the world, and also among the first countries that started research on and practice of ecological restoration [1]. Because of the fragile natural environment and the unreasonable exploitation and use of natural resources in some parts of China, ecological problems such as vegetation degradation, soil erosion, and desertification in these areas have become more prominent [2]. Previous research has categorized those areas with serious ecological problems into five ecologically vulnerable regions: the Northern Wind-sand, Loess Plateau, Arid Desert, Tibetan Plateau, and Karst regions [3,4]. Since the 1990s, the Chinese government has approved and implemented a large number of ecological conservation and restoration projects in these five regions (e.g., the “Natural Forest Protect Project” (NFPP), the “Grain for Green Program” (GGP), and the “Three-North Shelterbelt Project” (TNSP), etc.) [5,6]. Some of these have shown impressive results, and some are still in the phases of exploration and adjustment. Multiple studies have pointed out that due to the implementation of ecological programs, the vegetation coverage and biomass in these ecologically vulnerable regions have improved effectively, and soil erosion and land degradation have decreased significantly [7,8]. However, recent studies have argued that, limited by the differences in local climate factors, some inappropriate ecological restoration measures, which ignored the local objective climate conditions in ecologically vulnerable regions, have caused a low survival rate of restored plants and even local ecosystem deterioration [9,10,11]. Therefore, it is necessary to carry out studies that perform comparative estimates of the vegetation dynamics under the influence of climate change and human activities in different ecologically vulnerable regions to characterize existing ecological restoration programs’ effects and plan future programs. Such research results will help to reveal the key driving factors in the ecosystem restoration process and provide a basis for the rational design of regional ecological restoration measures.
Due to the development of space science and technology, more and more studies have begun to use remote sensing data to estimate the NPP (Net Primary Productivity) of terrestrial ecosystems, and to study the spatial distribution of vegetation dynamics caused by different driving factors [12,13,14,15]. NPP refers to the net amount of solar radiation that vegetation converts to plant organic matter through photosynthesis [16]. It plays an important role in regulating terrestrial ecosystems’ carbon circulation and maintaining ecosystem health, and is widely used as an indicator in studies of vegetation’s sensitivity to different driving factors [17]. Adopted with different ecological process data and models, vegetation dynamics influenced solely by climate factors (temperature and precipitation) can be estimated as the predicted NPP (NPPp), and the vegetation dynamics influenced by both climate and human factors can be estimated as the actual NPP (NPPa). Thus, the differences between NPPa and NPPp can illustrate the human-induced vegetation dynamics [18,19], and this methodology has been used successfully on both regional and national scales to determine the effects of climate and human factors on vegetation dynamics [20,21].
In this study, NPP was combined with a scenario simulation method to estimate vegetation dynamics and their driving forces in the five ecologically vulnerable regions indicated above from 2000 to 2015. Based on the change trends of different kinds of NPP, six possible conditions were developed to quantify vegetation restoration or degradation under the influence of climate change and human activities. The purpose of the study was to investigate the roles of climate and human factors in the vegetation dynamics in the five regions from 2000 to 2015. Specifically, our goals were to: (1) quantify the vegetation dynamics in the five ecologically vulnerable regions, and (2) explore the effects of different driving forces on them. The results of this study not only reflect the vegetation dynamics in ecologically vulnerable regions overall since the implementation of ecological restoration programs, but also serve as a firm basis for policy and decision-making for future ecological programs.

2. Data and Methods

2.1. Study Area

The five ecologically vulnerable regions involved in this study are the Northern Wind-sand, Loess Plateau, Arid Desert, Tibetan Plateau, and Karst regions (Figure 1). The Northern Wind-sand region is located in the north of China (38°50′–46°40′ N, 109°30′–119°20′ E), and covers approximately 4.6 × 10⁵ km2, including Beijing, Tianjin, central Inner Mongolia, northern Hebei, and parts of Shanxi. The region has a typical temperate continental monsoon climate characterized by arid and semi-arid conditions [22]. Grassland is the dominant vegetation in the area, and consequently, the primary ecological problems in the region are grassland degradation and land desertification caused by grazing [23]. To solve those problems, ecological restoration projects, including returning grazing land to grassland and the TNSP, were implemented.
The Loess Plateau region is located in the middle and upper reaches of the Yellow River in northern China (33°43′–41°16′ N, 100°54′–114°33′ E), and has an area of 6.3 × 10⁵ km2. The climate types from southeast to northwest are warm temperate, semi-humid, semi-arid, and arid, respectively [24]. The vegetation distribution on the Loess Plateau has obvious zonal characteristics, including forest-steppe, steppe, and desert-steppe from the south to north. Due to human interference, such as farmland reclamation, deforestation, and urban expansion, etc., ecological problems, including vegetation destruction and soil erosion, in the Loess Plateau are very serious. Multiple ecological restoration projects (NFPP, GGP, and TNSP) were implemented in this area to alleviate the soil erosion and vegetation degradation problems [25].
The Arid Desert region encompasses approximately 17.5 × 10⁵ km2 in northwestern China, including parts of Gansu, Xinjiang, and Inner Mongolia provinces (34°22′–49°33′ N, 73°32′–109°30′ E). A temperate continental arid and semi-arid climate dominates the region, with an average annual temperature of 9–12 ℃ and an annual precipitation of 10–400 mm [26]. It primarily consists of two types of desert vegetation: typical temperate and mountain desert vegetation. The Arid Desert region is covered by widespread sandy deserts and gobi deserts, where severe desertification occurs. The vegetation degradation in this region is closely associated with unreasonable land use, including over-grazing and over-reclamation [27]. A series of ecological restoration projects, such as returning grazing land to grassland, the GGP, and the NFPP, were implemented in the region to improve the ecological environment.
The Tibetan Plateau region is situated in south-western China (26°00′–39°47′ N, 73°19′–104°47′ E), covering an area of 25 × 105 km2, with an average elevation of 3584 m. The average annual temperature of the plateau hinterland is below 0 °C, and the annual precipitation is 100–300 mm [28]. The three main types of ecosystems in the Tibet Plateau are alpine meadows, alpine steppe, and alpine deserts. Grassland degradation caused by overgrazing is a major ecological problem in the region. Therefore, the primary target of ecological restoration programs, including returning grazing land to grassland, “black soil beach”, and rodent management in this area, is to alleviate the alpine grassland degradation [29].
The Karst region is located in the southwest of China (20°54′–30°08′ N, 103°36′–114°15′ E), and covers approximately 9.9 × 10⁵ km2, including Guizhou, Guangxi, and Hunan province, and has a primarily monsoon climate. The principal vegetation types are evergreen and deciduous shrubs, evergreen coniferous forests, and evergreen and deciduous broad-leaved forests [30]. Pure and impure carbonate rocks dominate the bedrock in the region, along with inappropriate land use, including farmland reclamation, deforestation, etc. All these lead to big ecological problems, such as vegetation degradation and rocky desertification [31]. To solve the problems, ecological restoration projects, including the NFPP, the GGP, and the Karst Rocky Desertification Comprehensive Control and Restoration Project, were implemented in the region.

2.2. Dataset

The climate data involved in modeling NPP, including temperature, precipitation, and solar radiation, came from the National Meteorological Information Center of China (http://data.cma.cn/). The NDVI (Normalized Difference Vegetation Index) data came from the Moderate-resolution Imaging Spectroradiometer (MODIS) NDVI product, which was used to calculate the proportion of photosynthetically active radiation in the CASA model, and can be obtained from the Level-1 and Atmosphere Archive & Distribution System (LAADS) Distributed Active Archive Center (DAAC) (https://ladsweb.modaps.eosdis.nasa.gov). The scope of major ecological programs and the land-use maps were derived from the Chinese Academy of Sciences Earth Databank (http://data.casearth.cn/). We interpolated and resampled all of the data into a 250-m resolution using ArcGIS v10.2 software (Environmental Systems Research Institute, Inc., Redlands, CA, USA) [32,33]. According to the land use map and the NDVI data, we also excluded all NDVI pixels with an average value of less than 0.05 and excluded pixels with land-use types that were always bare land or urban areas from 2000 to 2015, so as to avoid the influence of clouds, bare land, and non-plant areas on the accuracy of the research results [8,14].

2.3. Estimate of Predicted NPP

This study adopted the Miami model to calculate the NPPp. Based on Liebig’s limit factor law and the correlation between biomass and meteorological factors, the Miami model was developed with an assumption of the ideal state in which the vegetation productivity dynamics are only affected by basic climate factors [34]. Due to its rationality and effectiveness, the Miami model has been extensively applied in different regions of the world [35,36]. The model can be described as follows:
NPP p = min { ( 3000 1 + exp ( 1.315 0.119   t ) ) , ( 3000 [ 1 exp ( 0.000664   r ) ] ) }
in which t and r are the annual average temperature (°C) and annual precipitation (mm), respectively. The result of NPPp indicates the annual potential NPP (g C·m−2·year−1). For more information on the model calculation, refer to Zhou et al. [34] and Wang et al. [14].

2.4. Estimate of Actual NPP

The Carnegie-Ames-Stanford Approach (CASA) model was used to estimate the actual NPPa in this study. The CASA model is a type of vegetation light use efficiency model based on the principle of resource balance [37]. Because of its relatively simple parameters and accurate results, the CASA model is extensively applied in retrieval research on NPP [7,17,38]. The model is
NPP a ( x ,   t ) = A P A R ( x ,   t ) × ε ( x ,   t )
in which APAR (MJ·m−2) is the photosynthetically active radiation in pixel x over time period t and ε (g C·MJ−1) represents the actual light energy use. The models of APAR and ε are
A P A R ( x ,   t ) = S O L ( x ,   t ) × 0.5 × F P A R ( x ,   t )
F P A R = ( N D V I ( x , t ) N D V I i , min ) ( F P A R max F P A R min ) N D V I i , max N D V I i , min + F P A R min
ε ( x ,   t ) = T ε 1 ( x ,   t ) × T ε 2 ( x ,   t ) × W ε ( x ,   t ) × ε max
in which SOL (MJ·m−2) is the total solar radiation in pixel x over time period t, FPAR is the proportion of photosynthetically active radiation, and the constant of 0.5 represents the proportion of total solar radiation (0.4–0.7 μm). NDVImax and NDVImin are the maximum and minimum NDVI value in the whole area, respectively. Constants of 0.95 and 0.001 represent FPARmax and FPARmin, respectively. Tε1(x, t) and Tε2(x, t) represent the temperature stress coefficients at low and high temperatures, respectively; Wε(x, t) is the water stress coefficient; and εmax indicates the maximum light energy conversion rate under ideal conditions. For more details on the parameters’ calculation, refer to Feng et al. [7] and Wang et al. [14].

2.5. Estimate of the Driving Scenarios

The distinction between the NPPp and NPPa represents the effects of human activities on vegetation dynamics (NPPh). The formula is
NPP h = NPP a NPP p
We used the ordinary least-squares regression to calculate the change trend of different kinds of NPP, and the formula was
S l o p e = i = 1 n x i y i 1 n ( i = 1 n x i ) ( i = 1 n y i ) i = 1 n x i 2 1 n ( i = 1 n x i ) 2
in which xi represents the years from 2000 to 2015 (1 to n, n = 16), and yi represents the three kinds of NPP (NPPp, NPPa, and NPPh) in year xi. A positive value of the slope indicates that the vegetation dynamics showed a restoration trend, while the opposite result indicates that vegetation dynamics showed a degradation trend [39,40].
Meanwhile, the significant change trend of the three kinds of NPP (NPPp, NPPa, and NPPh) was tested by the Pearson’s correlation coefficient. The formula was
r = n i = 1 n x i y i i = 1 n x i i = 1 n y i n i = 1 n x i 2 ( i = 1 n x i ) 2 n i = 1 n y i 2 ( i = 1 n y i ) 2
where xi and yi are the years from 2000 to 2015 (1 to n, n = 15) and the NPP for each year, respectively. The positive value of r indicates an increasing trend of NPP, while the opposite result indicates a decreasing trend. If 0.497 < r < 1 or −1 < r < −0.497, the result represents a significant change trend for each pixel.
Consequently, six types of potential conditions indicating the different influences of climate change and human activities on vegetation dynamics can be set by the change trend of the NPPa (Sa), NPPp (Sp), and NPPh (Sh; Table 1). Condition 1 represents the vegetation restoration primarily caused by human factors; condition 2 represents the vegetation restoration primarily caused by climate factors; condition 3 represents the vegetation restoration primarily caused by both climate and human factors; condition 4 represents the vegetation degradation primarily caused by human factors; condition 5 represents the vegetation degradation primarily caused by climate factors; and condition 6 represents the vegetation degradation primarily caused by both climate and human factors [41,42,43].

3. Results

3.1. Spatio-Temporal Dynamic Analysis of NPPa

The spatio-temporal dynamics of the NPPa in the five ecologically vulnerable regions from 2000 to 2015 was estimated and the results are shown in Figure 2 and Table 2. The change trend of the NPPa varied in different regions. The Loess Plateau region had the largest percentage of areas in which NPPa increased among all five regions, with 78% of the regional vegetation being restored. Furthermore, 46% of the Loess Plateau region showed a significant increasing trend in NPPa (p < 0.05), which was chiefly found in the middle of the region. Areas with a significant decreasing trend in NPPa (p < 0.05) accounted for 7% of the total area, and were primarily located in the south of the plateau. Among the ecologically vulnerable regions, the Northern Wind-sand region had the second largest percentage of areas in which NPPa increased. However, unlike the Loess Plateau, only 16% of the area in this region showed a significant increasing trend in NPPa (p < 0.05), which was primarily concentrated in the north and south of the area. Correspondingly, the Northern Wind-sand region had the minimum percentage of area in which NPPa decreased significantly (p < 0.05). The following two were the Arid Desert and the Tibetan Plateau regions, and 21% and 14% of the two areas showed a significant increasing trend in NPPa (p < 0.05), which were primarily in the east of the Arid Desert region and the north of the Tibetan Plateau region, respectively. The Tibetan Plateau had the second largest percentage of areas among the ecologically vulnerable regions in which NPPa decreased. Compared with the other four regions, the vegetation in the Karst region showed a largely degrading trend. Nearly 70% of the regional NPPa showed a decreasing trend, and the areas with a significant decreasing trend in NPPa (p < 0.05) accounted for 21%, which was located in the middle of the region.

3.2. Vegetation Restoration under the Influence of Different Driving Factors

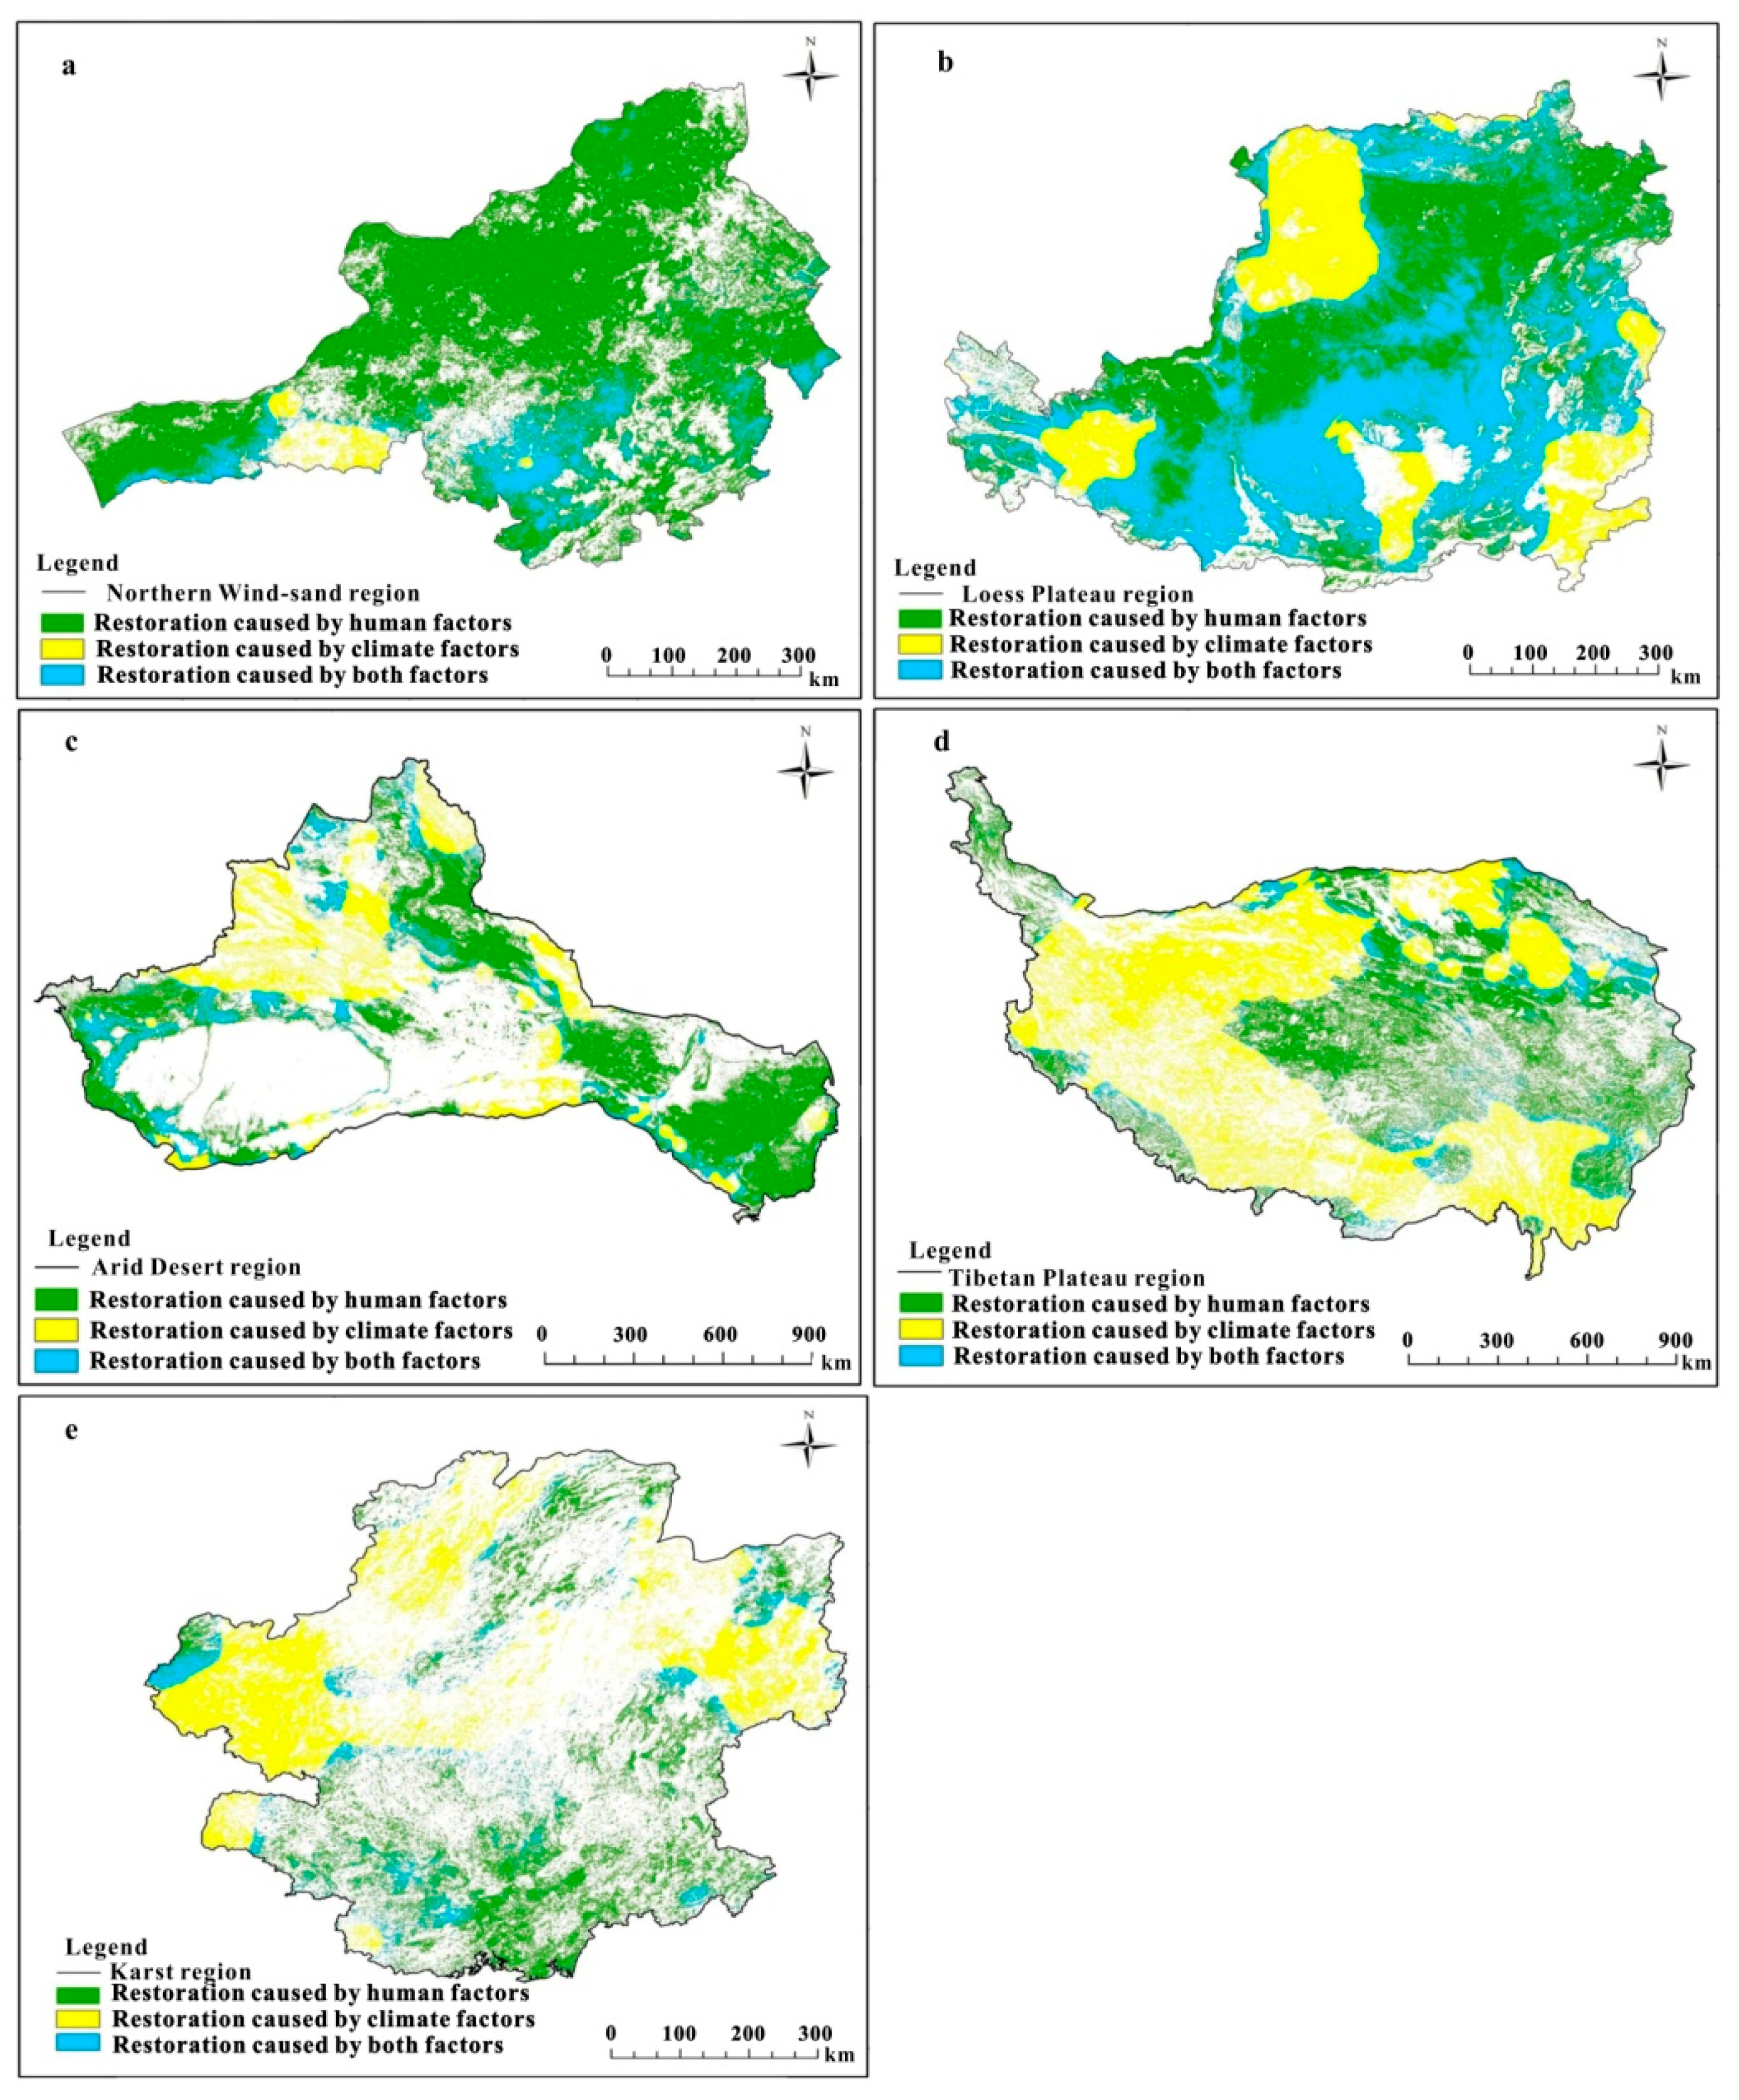
The spatial distribution and statistical results of the vegetation restoration influenced by climate and human factors in the five ecologically vulnerable regions from 2000 to 2015 are shown in Figure 3 and Figure 4. The results indicated that vegetation restoration influenced by different factors in the whole areas is similar to that in the NPPa significantly changed areas. In the Northern Wind-sand region, the vegetation restoration was primarily attributable to human activities, which accounted for 86% of the total vegetation restored (73% of the vegetation significantly restored). The Arid Desert region had the second largest area ratio of vegetation restoration that was primarily caused by human activities, and the restoration area was primarily located in the middle and east of the region. The area ratios of human-induced vegetation restoration in the Karst region, Tibetan Plateau region, and Loess Plateau region were 46%, 42%, and 39% of the whole area, and 51%, 44%, and 37% of the vegetation significantly restored areas, respectively, which also showed obvious spatial heterogeneity. For example, the human-induced vegetation restoration area in the Karst region was located in the south, and in the Tibetan Plateau and the Loess Plateau, they were in the east and north of the region, respectively. In contrast to the human factors, the vegetation restoration influenced by climate changes had its own spatial characteristics. The Tibetan Plateau region had the largest area ratio of vegetation restoration that was primarily caused by climate changes, which was mainly located in the west of the region. The area ratios of vegetation restoration primarily caused by climate changes in other ecologically vulnerable regions were 43%, 25%, 18%, and 2% of the whole area, and 33%, 25%, 12%, and 1% of the vegetation significantly restored areas in the Karst, Arid Desert, Loess Plateau, and Northern Wind-sand regions, respectively.

3.3. Vegetation Degradation under the Influence of Different Driving Factors

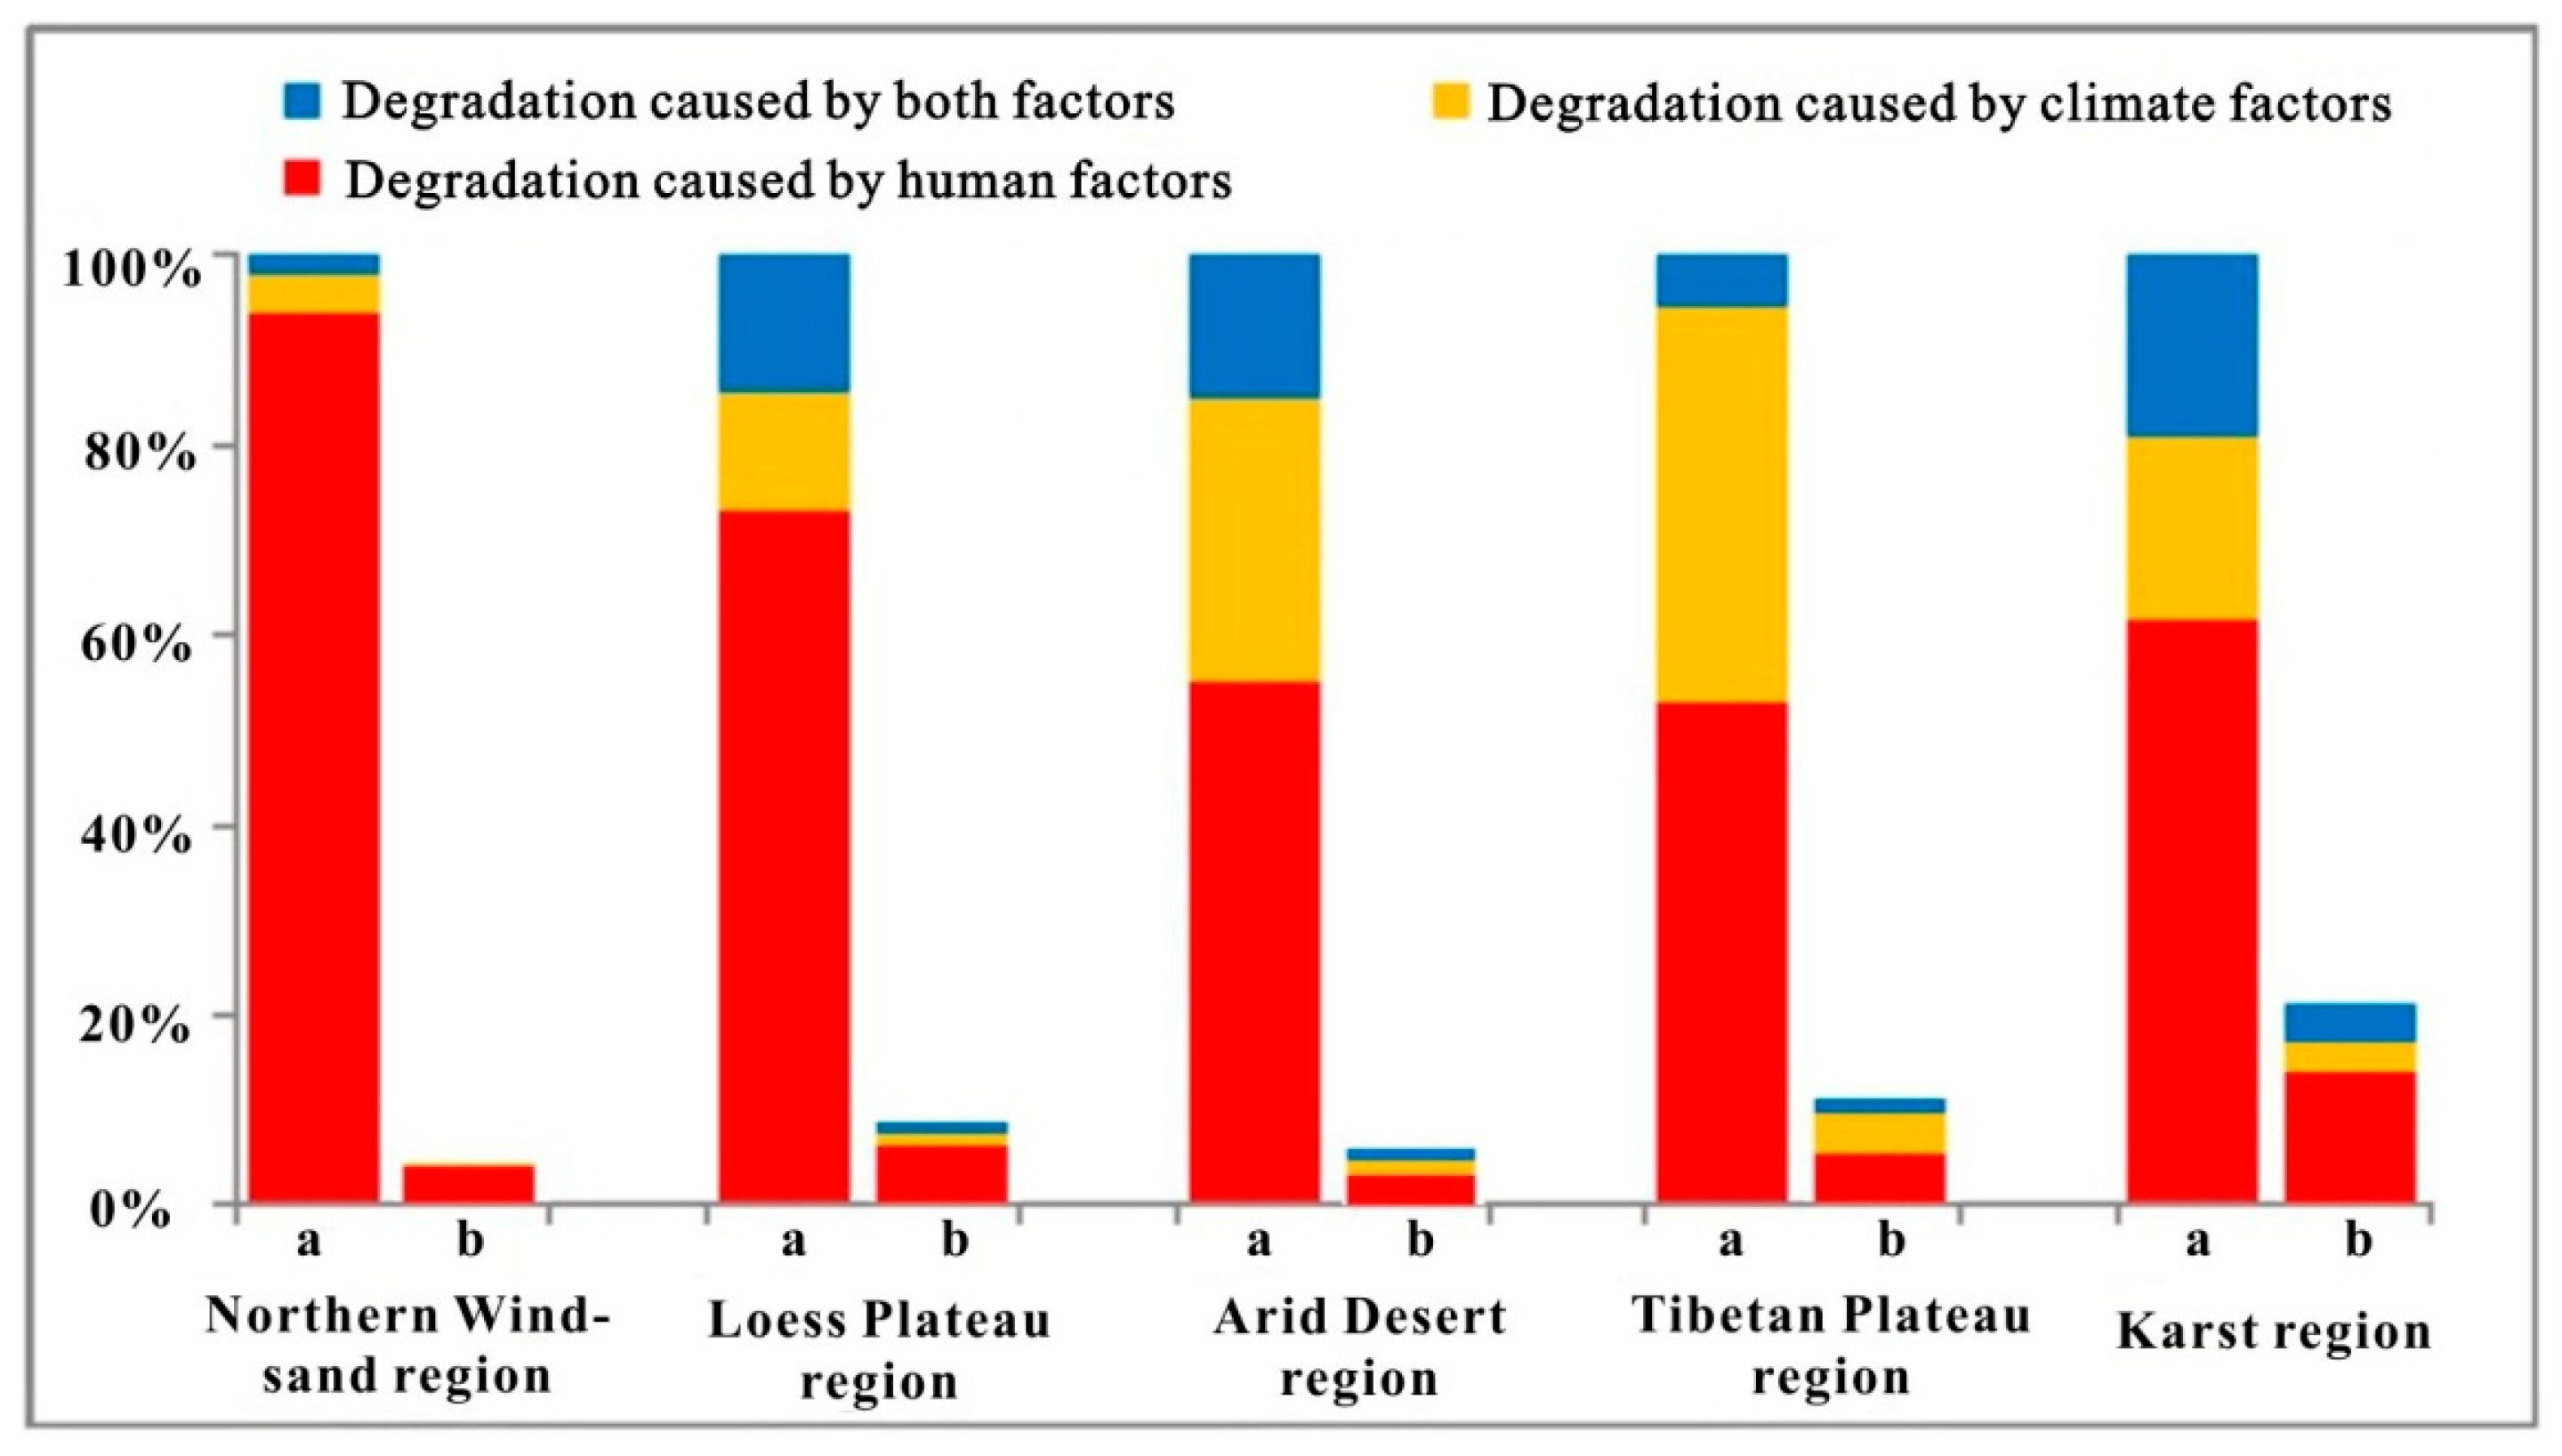
The relative roles of climate change and human activities in the process of vegetation degradation in the five ecologically vulnerable regions from 2000 to 2015 were also analyzed and are shown in Figure 5 and Figure 6. The results revealed that the vegetation degradation influenced by different factors in the whole areas and in the NPPa significantly changed areas is still consistent. In the Northern Wind-sand region, the vegetation degradation was mostly influenced by human activities, which accounts for 94% of the total degraded vegetation (97% of the vegetation significantly degraded). The Loess Plateau region had the second largest area ratio of vegetation degradation primarily caused by human activities, and it was mainly located in the south of the region. The area ratios of human-induced vegetation degradation in the Karst, Arid Desert, and Tibetan Plateau regions were 62%, 55%, and 53% of the whole area, and 65%, 52%, and 47% of the significantly degraded areas, respectively. The human-induced vegetation degradation areas in the Karst region were located both in the south and north of the area. In the Arid Desert and Tibetan Plateau region, human factors played a major role in the north and east of the region, respectively. The vegetation degradation affected by climate changes also had its own spatial characteristics. Similar to the vegetation restoration area, the Tibetan Plateau region had the largest area ratio of vegetation degradation that was primarily caused by climate changes, and it was mainly located in the west of the region. The area ratios of climate-induced vegetation degradation in other ecologically vulnerable regions were 30%, 19%, 12%, and 4% of the whole area, and 27%, 15%, 14%, and 1% of the vegetation significantly degraded areas in the Arid Desert, Karst, Loess Plateau, and Northern Wind-sand regions, respectively.

4. Discussion

Previous studies have indicated that vegetation dynamics have been affected by climate and human factors, which fundamentally altered regional ecosystem productivity [2,20]. This study adopted NPP as an indicator to present a general picture of vegetation dynamics in five ecologically vulnerable regions, and assessed the influences of climate change and human activities quantitatively.

4.1. Vegetation Restoration

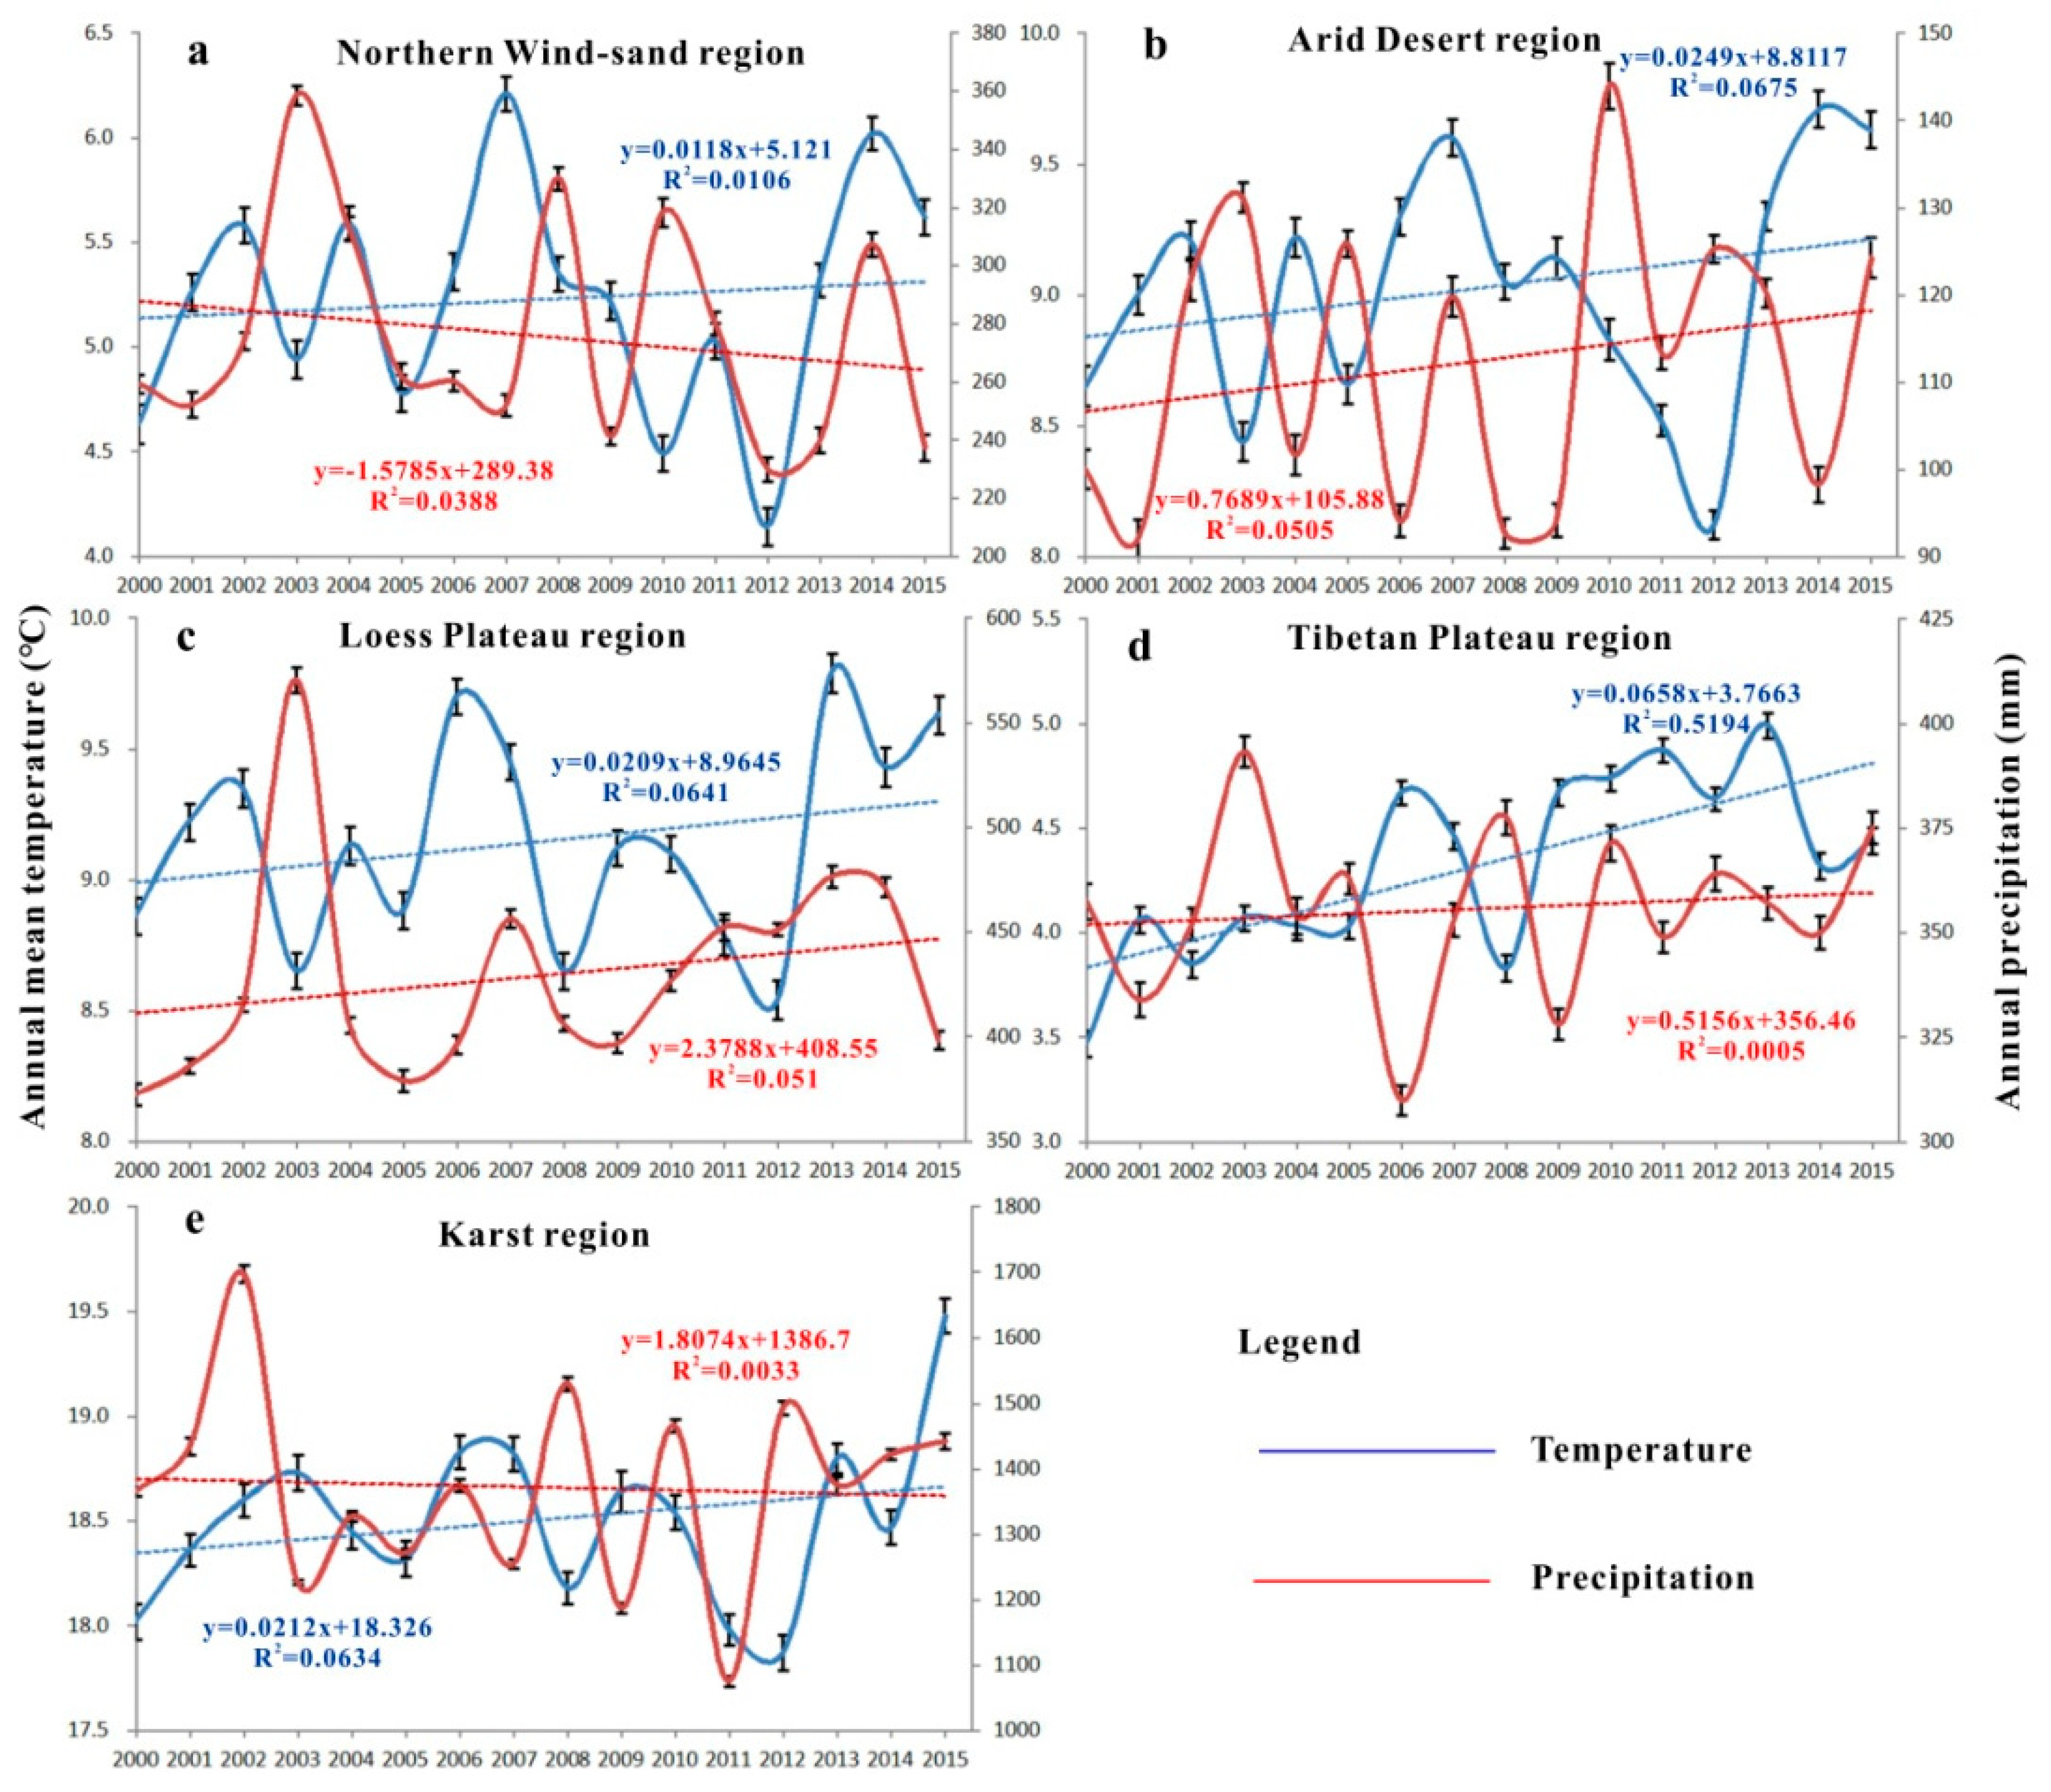
The analysis of vegetation restoration under the influence of different driving factors indicated that human factors dominated the vegetation restoration in the Northern Wind-sand region (Figure 2 and Figure 3). This result was closely related to the ecological programs that have been implemented in the area, especially in areas where vegetation is significantly restored. The main vegetation types in the region are forest and grassland, and the corresponding ecological programs, such as the Beijing–Tianjin Sand Source Control Project and the return of grazing to grassland project, significantly improved the local vegetation NPP (Figure 7). Based on the result of the variation in annual mean temperature and annual precipitation in the Northern Wind-sand region from 2000 to 2015, the climate in the region has generally become warmer (0.12 °C/10 year) and drier (−16 mm/10 year) over the past 16 years (Figure 8), which was consistent with previous studies [20,22,44]. Drought meteorological conditions are clearly not conducive to vegetation’s growth, which means that human activities indeed play a more active role in vegetation restoration within the region. Multiple studies have shown that under the influence of ecological programs, sand storms in the area have reduced significantly, and the human-induced restoration activities have prevailed over the relatively dry natural conditions, and improved the vegetation productivity in the region significantly [44,45].
Similar to the Northern Wind-sand region, vegetation restoration in the Arid Desert region was also mainly caused by human activities (Figure 2 and Figure 3). Both of the ecologically vulnerable regions are located in arid and semi-arid areas in China, and the vegetation restoration programs dominated by human activities are crucial for both regions in protecting the local ecological environment from their limiting climate factors [26]. Moreover, compared with the Northern Wind-sand region, the Arid Desert region benefited from more ecological programs in vegetation significantly restored areas, including the NFPP, the GGP, and the TNSP (Figure 2 and Figure 7) [46]. Nonetheless, climate factors still caused 25% of the vegetation restoration in the Arid Desert region (Figure 3). These areas were primarily concentrated in the Tianshan Mountain and Altai Mountain areas. Deng et al. [47] pointed out in their study that the main sources of water for vegetation in these mountain areas are rivers and melting snow on the mountains rather than precipitation. Further, the increasing temperatures (0.25 °C/10 year) in the Arid Desert region have increased the water supply and benefited the vegetation around mountains (Figure 8) [48].
The Loess Plateau region had the greatest percentage of vegetation restoration areas among all five ecologically vulnerable regions (Figure 2). Sun et al. [49] and Lv et al. [5] pointed out in their research that vegetation coverage and carbon sequestration significantly increased in the Lvliang mountain area, north Shaanxi, and the Liupan mountain area in the Loess Plateau region, and were closely related to the ongoing ecological programs, such as the NFPP and the GGP (Figure 7). In this study, human activities also considerably affected vegetation restoration in these areas, and caused a significant increase in regional vegetation NPPa. However, different from other ecologically vulnerable regions, the Loess Plateau had the largest proportion of vegetation restoration area with the combined effects of climate and human factors, either in the entire region or in the NPPa significantly increased areas (Figure 3). Previous studies pointed out that water resource is one of the key factors that limit vegetation growth in the plateau [24,50]. According to the change trend analysis of regional meteorological factors, the Loess Plateau has become warmer and wetter in recent years (0.21 °C/10 year and 23.79 mm/10 year) (Figure 8). Abundant precipitation and elevated temperature have extended the growing season and promoted the growth of regional vegetation effectively [49]. Meanwhile, in the north of the plateau, the main vegetation type is grassland that has relatively low water demands (Figure 9), and the adequate rainfall has improved the soil moisture and brought conditions favorable for vegetation growth [24]. The promotion of vegetation growth by meteorological factors, combined with the ecological restoration programs implemented widely throughout the plateau, has led to a wide distribution of vegetation restoration areas in the Loess Plateau under the influence of combined effects.
Generally, the vegetation in the Tibetan Plateau showed a restoration trend over the study period, and the dynamic changes in vegetation caused by climate factors were primarily distributed in the west of the plateau, while those affected by human factors were largely in the east. These results agree well with those of Zhang et al. [51] and Chen et al.’s [52] studies, which indicated that human activities in this region are limited and concentrated in the east of the plateau, where the elevation is relatively low and the terrain is flat. Among all five ecologically vulnerable regions, the Tibetan Plateau had the largest proportion of vegetation restoration under the influence of climate factors (Figure 3) [53,54]. Especially in the north of the plateau, where the vegetation NPPa is significantly increased, the vegetation dynamics caused by climate factors are widely distributed. In general, the temperature and precipitation in the Tibetan Plateau showed an increasing trend (0.65 °C/10 year, 5.16 mm/10 year) from 2000 to 2015 (Figure 8). Previous studies have indicated that the effect of temperature on vegetation in the plateau is more pronounced than that of moisture. Higher temperatures and more solar radiation can prolong the vegetation’s growing season and enhance photosynthesis [51,55]. Meanwhile, vegetation restoration in the eastern Tibetan Plateau was attributable to human factors in this study (Figure 3). The residents in the Tibetan Plateau are predominantly Tibetans, and grazing is their main source of income. To reduce grassland degradation caused by grazing, ecological restoration measures, such as returning grazing land to grassland, ecological immigration, “black soil beach”, and rodent management have been carried out successively and achieved remarkable results (Figure 7) [56,57].
To solve the vegetation degradation and rocky desertification problems in the Karst region, the state and local Chinese governments have implemented a series of ecological programs, such as the NFPP, GGP, and Karst Rocky Desertification Comprehensive Control and Restoration Project (Figure 7) [31]. However, the rugged terrain in the Karst area, especially in the rocky desertification areas, has brought great challenges to the development of ecological restoration projects. In this study, the vegetation restoration caused by human factors in the Karst area was found to be concentrated in the south of the region in Guangxi province, which was consistent with Tong et al.’s [30] research. The terrain there is relatively flat, with the temperature and precipitation more suitable for the implementation of a number of ecological programs (average temperature, 24 °C, and annual precipitation, 1662 mm) [30]. Meanwhile, due to fact that the Karst region is located in a subtropical monsoon area and precipitation is relatively abundant, the correlation between temperature and vegetation dynamics is more significant [58]. The results of this study indicate that the vegetation dynamics in the northwest of the Karst region were mainly caused by climate factors, where the NPPa significantly increased. Based on the analysis of the change in annual mean temperature, the temperature in the region has increased at a rate of 0.21 °C/10 year (Figure 8). Cai et al. [59] pointed out that the temperature in the north of the Karst region had increased faster than in the south, and the increased temperature had promoted the vegetation’s photosynthesis and accelerated plant growth, which had led to a trend of vegetation restoration caused by climate factors.

4.2. Vegetation Degradation

The results of the driving forces analysis of the regions with degraded vegetation showed that human factors also caused the degradation in the Northern Wind-sand region to a large extent, especially in the NPPa significantly decreased areas, which are concentrated in the north and south of the region (Figure 2 and Figure 5). The spatial distribution of land use indicates that the main vegetation types in these regions are grassland and forest, respectively (Figure 9). The grassland degradation affected by human factors is primarily related to grazing activities. Previous studies have shown that the number of livestock in Inner Mongolia has increased by nearly 50% in the past decade [20]. Despite measures such as fence and rotation grazing, local grazing pressures still exist because of the significantly increased livestock, and this pressure is concentrated in particular areas because of herders’ centralized locations, and has resulted in local grassland degradation [11,45]. In the south of the Northern Wind-sand region, the construction of a large number of shelterbelts has also put significant pressure on the water resources’ carrying capacity of the local environment. For example, it has been reported that the Beijing–Tianjin sand source area is facing a shortage of water resources [23]. Inappropriate ecological restoration measures will increase regional soil water consumption, reduce the survival rate of restored vegetation, and even lead to the degradation of vegetation in the area restored [1,60].
A similar situation had occurred in the Arid Desert region, where human factors also dominated vegetation degradation (Figure 5), and both grazing and inappropriate ecological restoration measures had a negative effect on vegetation dynamics in the area [27]. However, in contrast to the Northern Wind-sand region, part of the vegetation degradation in the Arid Desert region was primarily caused by climate factors, particularly in areas where vegetation was significantly degraded. These areas were also mainly distributed around the Tianshan and Altai Mountains. Melted snow caused by a temperature rise and the slightly increased precipitation (7.7 mm/10 year) still cannot fully meet the requirements of vegetation under arid conditions, resulting in different change trends of vegetation dynamics [61].
The vegetation degradation in the Loess Plateau region was still primarily caused by human activities (Figure 5). Based on the spatial distribution of land use types, the degraded areas primarily consisted of forest and farmland (Figure 9). Farmland reclamation and deforestation are the principal reasons for vegetation degradation in these areas [25]. In addition, large-scale afforestation activities have pushed the regional water resource carrying capacity close to its limit [9]. In such cases, restoring vegetation with the wrong plant species will easily degrade the environment.
Although more than half of the vegetation in the Tibetan Plateau showed a restoration trend in this study, 46% of the vegetation in the region remained degraded (Figure 2). Human activities’ adverse effects were the main factors in vegetation degradation in the plateau, especially for the areas where NPPa decreased significantly, which are concentrated in the east of the region (Figure 5). Because of the overpopulation, a single income source, backward grazing methods, and the increased number of livestock, the grassland environment in the area has suffered continuous damage [51,52]. In addition to overgrazing, excessive agricultural reclamation, timber cutting, and Chinese herbal medicine and mineral extraction have further exacerbated the regional environmental conditions [57,62]. Meanwhile, the vegetation degradation caused by climate factors in the Tibetan Plateau was concentrated in the southwest of the plateau (Figure 5). Gao et al. [63] pointed out in their study that there was an obvious negative correlation between vegetation productivity and precipitation in the southwestern Tibetan Plateau. Increased rainfall led to decreased temperatures and solar radiation, which inhibited plant photosynthesis, while precipitation also increased soil erosion and reduced the content of soil organic matter, which eventually led to the decline in vegetation productivity [51].
The Karst region had the greatest percentage of degraded and significantly degraded vegetation areas among all five ecologically vulnerable regions, which were widely distributed throughout the region and mainly caused by human activities (Figure 2 and Figure 5). As one of the poorest areas in China, the Karst region has more than 30 million people living in poverty. Overpopulation and low-yielding agricultural production methods have forced people there to overdevelop the surrounding forest resources as their source of production and living, which has led to terrible deterioration in the region’s ecological environment [64]. In addition, based on the analysis of changes in meteorological factors shown in Figure 8, the Karst region has become warmer and drier (0.21 °C/10 year and −18.07 mm/10 year). Previous studies have also pointed out that this area has suffered several droughts in recent years [65,66]. Using inappropriate species in vegetation restoration and the lack of effective management have caused the vegetation productivity to degrade under drought conditions, which has ultimately led to vegetation degradation influenced by climate and human factors.

4.3. Limitations of Method

The method of distinguishing the driving forces of vegetation dynamics in this study adopted the NPP as an indicator, which has been used widely and verified in multiple studies on different research scales [11,19,34]. Although the models used to estimate the NPP were selected carefully, limitations still exist. This study assumed an ideal condition for vegetation growth in which only climate and human factors affected vegetation dynamics. However, many different factors may influence vegetation dynamics, such as animal activities, pests, vegetation species, and diseases [19]. Further, the results of this study are also constrained by the accuracy and resolution of the remote data. Thus, in future studies, the models and parameters should be adjusted and improved further, so that the results will represent the actual situation more closely.

5. Conclusions

This study used NPP as an indicator to compare the vegetation dynamics under the influence of climate change and human activities in five ecologically vulnerable regions of China from 2000 to 2015. The results indicated that, except for the Karst region, the vegetation in other ecologically vulnerable regions all showed a restoration trend. Among them, the vegetation restoration in the Northern Wind-sand and Arid Desert region was primarily caused by human activities. The Loess Plateau had the largest area proportion of restored vegetation attributable to combined effects of climate and human factors. The vegetation dynamics affected by different driving factors in the Tibetan Plateau demonstrated clear spatial characteristics, in which the dynamics caused by climate factors were primarily distributed in the west of the plateau, while those affected by human factors were mainly distributed in the east. The proportion of restored vegetation caused by human and climate factors was approximately the same in the Karst region. Meanwhile, the vegetation degradation in the five ecologically vulnerable regions was mostly caused by drought and degrading human activities (e.g., deforestation, overgrazing, inappropriate restoration measures, etc.).
This study highlighted that human factors are the main causes of vegetation dynamics in the five ecologically vulnerable regions, and that these can have positive or negative impacts. It is essential to continue ecological restoration activities in the ecologically vulnerable areas. However, the influence of climate factors cannot be neglected in the process of ecological restoration, especially in arid regions. Appropriate vegetation restoration activities combined with local climate conditions will effectively improve the result of ecological restoration. We recommend that future policymaking in regional ecosystem management may consider the local characteristics of different ecologically vulnerable regions to select reasonable restoration measures, improve restoration efficiency, and maximize the benefits of ecological restoration programs.

Author Contributions

H.W. analyzed the related data and wrote the manuscript; G.L. and Z.L. designed the framework of the research and revised the manuscript; and P.W. and Z.W. provided the climate and NDVI data.

Acknowledgments

This research was funded by the Science and Technology Service Network Initiative Project of Chinese Academy of Sciences (No. KFJ-STS-ZDTP-036), the National Key R & D Program of China (2017YFC0504701), the National Natural Science Foundation of China (41801180), and the China Postdoctoral Science Foundation (No. 2017M623114).

Conflicts of Interest

The authors declare no conflict of interest.

References

  1. Cao, S.; Chen, L.; Shankman, D.; Wang, C.; Wang, X.; Zhang, H. Excessive reliance on afforestation in China’s arid and semi-arid regions: Lessons in ecological restoration. Earth Sci. Rev. 2011, 104, 240–245. [Google Scholar] [CrossRef]
  2. Lv, Y.; Zhang, L.; Feng, X.; Zeng, Y.; Fu, B.; Yao, X.; Li, J.; Wu, B. Recent ecological transitions in China: Greening, browning, and influential factors. Sci. Rep. 2015, 5, 8732. [Google Scholar]
  3. Fu, B.J.; Liu, G.H.; Ouyang, Z.Y. Degraded Ecosystem Restoration Techniques and Models in Typical Ecologically Vulnerable Regions; Science Press: Beijing, China, 2011. [Google Scholar]
  4. Liu, J.H.; Zhou, C.X.; Gao, J.X.; Ma, S.; Wang, W.J.; Wu, K.; Liu, Y. Location determination of ecologically vulnerable regions in China. Biodivers. Sci. 2015, 23, 725–732. (In Chinese) [Google Scholar] [CrossRef] [Green Version]
  5. Lv, Y.H.; Fu, B.J.; Feng, X.M.; Zeng, Y.; Liu, Y.; Chang, R.Y.; Sun, G.; Wu, B.F. A policy-driven large scale ecological restoration: Quantifying ecosystem services changes in the Loess Plateau of China. PLoS ONE 2012, 7, e31782. [Google Scholar]
  6. Wu, J.; Zhao, L.; Zheng, Y.; Lv, A. Regional differences in the relationship between climatic factors, vegetation, land surface conditions, and dust weather in China’s Beijing-Tianjin Sand Source Region. Nat. Hazards 2011, 62, 31–44. [Google Scholar] [CrossRef]
  7. Feng, X.M.; Fu, B.J.; Lv, N.; Zeng, Y.; Wu, B.F. How ecological restoration alters ecosystem services: An analysis of carbon sequestration in China’s Loess Plateau. Sci. Rep. 2013, 3, 2846. [Google Scholar] [PubMed]
  8. Wang, J.; Wang, K.; Zhang, M.; Zhang, C. Impacts of climate change and human activities on vegetation cover in hilly southern China. Ecol. Eng. 2015, 81, 451–461. [Google Scholar] [CrossRef]
  9. Feng, X.M.; Fu, B.J.; Piao, S.L.; Wang, S.; Ciais, P.; Zeng, Z.Z.; Lv, Y.H.; Zeng, Y.; Li, Y.; Jiang, X.H.; et al. Revegetation in China’s Loess Plateau is approaching sustainable water resource limits. Nat. Clim. Chang. 2016, 6, 1019–1022. [Google Scholar] [CrossRef]
  10. Cao, S. Why Large-Scale Afforestation Efforts in China Have Failed to Solve the Desertification Problem. Environ. Sci. Technol. 2008, 42, 1826–1831. [Google Scholar] [CrossRef]
  11. Gang, C.; Zhou, W.; Chen, Y.; Wang, Z.; Sun, Z.; Li, J.; Qi, J.; Odeh, I. Quantitative assessment of the contributions of climate change and human activities on global grassland degradation. Environ. Earth Sci. 2014, 72, 4273–4282. [Google Scholar] [CrossRef]
  12. Ma, Y.H.; Fan, S.Y.; Zhou, L.H.; Dong, Z.H.; Zhang, K.C.; Feng, J.M. The temporal change of driving factors during the course of land desertification in arid region of North China: The case of Minqin County. Environ. Geol. 2007, 51, 999–1008. [Google Scholar] [CrossRef]
  13. Chang, X.L.; Lu, C.X.; Gao, Y.B. Impacts of human economic activities on wind and sand environment in Kerqin sandy land. Resour. Sci. 2003, 25, 78–83. (In Chinese) [Google Scholar]
  14. Wang, H.; Liu, G.; Li, Z.; Wang, P.; Wang, Z. Assessing the Driving Forces in Vegetation Dynamics Using Net Primary Productivity as the Indicator: A Case Study in Jinghe River Basin in the Loess Plateau. Forests 2018, 9, 374. [Google Scholar] [CrossRef]
  15. Zheng, Y.R.; Xie, Z.X.; Robert, C.; Jiang, L.H.; Shimizu, H. Did climate drive ecosystem change and induce desertification in Otindag sandy land, China over the past 40 years? J. Arid Environ. 2006, 64, 523–541. [Google Scholar] [CrossRef]
  16. Yeganeh, H.; Khajedein, S.J.; Amiri, F.; Shariff, A.R.B.M. Monitoring rangeland ground cover vegetation using multitemporal MODIS data. Arab. J. Geosci. 2014, 7, 287–298. [Google Scholar] [CrossRef]
  17. Wessels, K.J.; Prince, S.D.; Reshef, I. Mapping land degradation by comparisonof vegetation production to spatially derived estimates of potential production. J. Arid Environ. 2008, 72, 1940–1949. [Google Scholar] [CrossRef]
  18. Haberl, H.E.K.; Krausmann, F.; Gaube, V.; Bondeau, A.; Plutzar, C.; Gingrich, S.; Lucht, W.; Fischer-Kowalski, M. Quantifying and Mapping the Human Appropriation of Net Primary Production in Earth’s Terrestrial Ecosystems. Proc. Natl. Acad. Sci. USA 2007, 104, 12942–12947. [Google Scholar] [CrossRef] [PubMed]
  19. Yang, Y.; Wang, Z.; Li, J.; Gang, C.; Zhang, Y.; Zhang, Y.; Odeh, I.; Qi, J. Comparative assessment of grassland degradation dynamics in response to climate variation and human activities in China, Mongolia, Pakistan and Uzbekistan from 2000 to 2013. J. Arid Environ. 2016, 135, 164–172. [Google Scholar] [CrossRef]
  20. Mu, S.J.; Zhou, S.X.; Chen, Y.Z.; Li, J.L.; Ju, W.M.; Odeh, I.O.A. Assessing the impact of restoration-induced land conversion and management alternatives on net primary productivity in Inner Mongolian grassland, China. Glob. Planet. Chang. 2013, 108, 29–41. [Google Scholar] [CrossRef]
  21. Wu, S.H.; Zhou, S.L.; Chen, D.X.; Wei, Z.Q.; Dai, L.; Li, X.G. Determining the contributions of urbanisation and climate change to NPP variations over the last decade in the Yangtze River Delta, China. Sci. Total Environ. 2014, 472, 397–406. [Google Scholar] [CrossRef]
  22. Shan, N.; Shi, Z.; Yang, X.; Gao, J.; Cai, D. Spatiotemporal trends of reference evapotranspiration and its driving factors in the Beijing–Tianjin Sand Source Control Project Region, China. Agric. For. Meteorol. 2015, 200, 322–333. [Google Scholar] [CrossRef]
  23. Wu, Z.W.; Wu, J.; He, B.; Liu, J.; Wang, Q.; Zhang, H.; Liu, Y. Drought offset ecological restoration program-induced increase in vegetation activity in the Beijing-Tianjin Sand Source Region, China. Environ. Sci. Technol. 2014, 48, 12108–12117. [Google Scholar] [CrossRef]
  24. Wang, H.; Liu, G.H.; Li, Z.S.; Ye, X.; Wang, M.; Gong, L. Driving force and changing trends of vegetation phenology in the Loess Plateau of China from 2000 to 2010. J. Mt. Sci. 2016, 13, 844–856. [Google Scholar] [CrossRef] [Green Version]
  25. Li, S.; Liang, W.; Fu, B.; Lv, Y.; Fu, S.; Wang, S.; Su, H. Vegetation changes in recent large-scale ecological restoration projects and subsequent impact on water resources in China’s Loess Plateau. Sci. Total Environ. 2016, 569–570, 1032–1039. [Google Scholar] [CrossRef] [PubMed]
  26. Yang, H.; Mu, S.; Li, J. Effects of ecological restoration projects on land use and land cover change and its influences on territorial NPP in Xinjiang, China. CATENA 2014, 115, 85–95. [Google Scholar] [CrossRef]
  27. Yan, C.Z.; Wang, T.; Han, Z.W.; Qie, Y.F. Surveying sandy deserts and desertified lands in north western China by remote sensing. Int. J. Remote Sens. 2007, 28, 3603–3618. [Google Scholar] [CrossRef]
  28. Li, X.W.; Li, M.D.; Dong, S.K.; Shi, J.B. Temporal-spatial changes in ecosystem services and implications for the conservation of alpine rangelands on the Qinghai-Tibetan Plateau. Rangel. J. 2015, 37, 31–43. [Google Scholar] [CrossRef]
  29. Ren, G.; Shang, Z.; Long, R.; Hou, Y.; Deng, B. The relationship of vegetation and soil differentiation during the formation of black-soil-type degraded meadows in the headwater of the Qinghai-Tibetan Plateau, China. Environ. Earth Sci. 2013, 69, 235–245. [Google Scholar] [CrossRef]
  30. Tong, X.; Wang, K.; Brandt, M.S.; Yue, Y.; Liao, C.; Fensholt, R. Assessing Future Vegetation Trends and Restoration Prospects in the Karst Regions of Southwest China. Remote Sens. 2016, 8, 357. [Google Scholar] [CrossRef]
  31. Tong, X.; Wang, K.; Yue, Y.; Brandt, M.; Liu, B.; Zhang, C.; Liao, C.; Fensholt, R. Quantifying the effectiveness of ecological restoration projects on long-term vegetation dynamics in the karst regions of Southwest China. Int. J. Appl. Earth Obs. Geoinf. 2017, 54, 105–113. [Google Scholar] [CrossRef] [Green Version]
  32. Fu, B.J.; Liu, Y.; Lv, Y.H.; He, C.S.; Zeng, Y.; Wu, B.F. Assessing the soil erosion control service of ecosystems change in the Loess Plateau of China. Ecol. Complex. 2011, 8, 284–293. [Google Scholar] [CrossRef]
  33. Zhang, L.W.; Fu, B.J.; Lv, Y.H.; Zeng, Y. Balancing multiple ecosystem services in conservation priority setting. Landsc. Ecol. 2015, 30, 535–546. [Google Scholar] [CrossRef]
  34. Zhou, W.; Gang, C.; Zhou, F.; Li, J.; Dong, X.; Zhao, C. Quantitative assessment of the individual contribution of climate and human factors to desertification in northwest China using net primary productivity as an indicator. Ecol. Indic. 2015, 48, 560–569. [Google Scholar] [CrossRef]
  35. Adams, B.; White, A.; Lenton, T.M. An analysis of some diverse approaches to modelling terrestrial net primary productivity. Ecol. Model. 2004, 177, 353–391. [Google Scholar] [CrossRef]
  36. Lin, H.; Feng, Q.; Liang, T.; Ren, J. Modelling global-scale potential grassland changes in spatio-temporal patterns to global climate change. Int. J. Sustain. Dev. World Ecol. 2012, 20, 83–96. [Google Scholar] [CrossRef]
  37. Wen, Y.; Liu, X.; Du, G. Nonuniform Time-Lag Effects of Asymmetric Warming on Net Primary Productivity across Global Terrestrial Biomes. Earth Interact. 2018, 22, 1–26. [Google Scholar] [CrossRef]
  38. Su, C.H.; Fu, B.J. Evolution of ecosystem services in the Chinese Loess Plateau under climatic and land use changes. Glob. Planet. Chang. 2013, 101, 119–128. [Google Scholar] [CrossRef] [Green Version]
  39. Shi, Y.; Shen, Y.; Kang, E.; Li, D.; Ding, Y.; Zhang, G.; Hu, R. Recent and Future Climate Change in Northwest China. Clim. Chang. 2006, 80, 379–393. [Google Scholar] [CrossRef]
  40. Slayback, D.A.; Pinzon, J.E.; Los, S.O.; Tucker, C.J. Northern hemisphere photosynthetic trends 1982–1999. Glob. Chang. Biol. 2003, 9, 1–15. [Google Scholar] [CrossRef]
  41. Zhang, C.X.; Wang, X.M.; Li, J.C.; Hua, T. Roles of climate changes and human interventions in land degradation: A case study by net primary productivity analysis in China’s Shiyanghe Basin. Environ. Earth Sci. 2011, 64, 2183–2193. [Google Scholar] [CrossRef]
  42. Zhou, W.; Li, L.J.; Mu, S.J.; Gang, C.C.; Sun, Z.G. Effects of ecological restoration-induced land-use change and improved management on grassland net primary productivity in the Shiyanghe River Basin, north-west China. Grass Forage Sci 2013, 10, 1111. [Google Scholar] [CrossRef]
  43. Wang, H.; Liu, G.; Li, Z.; Ye, X.; Fu, B.; Lv, Y. Analysis of the Driving Forces in Vegetation Variation in the Grain for Green Program Region, China. Sustainability 2017, 9, 1853. [Google Scholar] [CrossRef]
  44. Wu, Z.; Wu, J.; Liu, J.; He, B.; Lei, T.; Wang, Q. Increasing terrestrial vegetation activity of ecological restoration program in the Beijing–Tianjin Sand Source Region of China. Ecol. Eng. 2013, 52, 37–50. [Google Scholar] [CrossRef]
  45. Zhang, L.; Cao, W.; Fan, J. Soil organic carbon dynamics in Xilingol grassland of northern China induced by the Beijing-Tianjin Sand Source Control Program. Front. Earth Sci. 2016, 11, 407–415. [Google Scholar] [CrossRef]
  46. Zhang, Y.; Peng, C.; Li, W.; Tian, L.; Zhu, Q.; Chen, H.; Fang, X.; Zhang, G.; Liu, G.; Mu, X.; et al. Multiple afforestation programs accelerate the greenness in the ‘Three North’ region of China from 1982 to 2013. Ecol. Indic. 2016, 61, 404–412. [Google Scholar] [CrossRef] [Green Version]
  47. Deng, X.P.; Shan, L.; Zhang, H.; Turner, N.C. Improving agricultural water use efficiency in arid and semiarid areas of China. Agric. Water Manag. 2006, 80, 23–40. [Google Scholar] [CrossRef] [Green Version]
  48. Chen, Y.N.; Kuniyoshi, T.; Xu, C.C.; Chen, Y.P.; Xu, Z.X. Regional climate change and its effects on river runoff in the tarim basin, China. Hydrol. Process. 2006, 20, 2207–2216. [Google Scholar] [CrossRef]
  49. Sun, W.; Song, X.; Mu, X.; Gao, P.; Wang, F.; Zhao, G. Spatiotemporal vegetation cover variations associated with climate change and ecological restoration in the Loess Plateau. Agric. For. Meteorol. 2015, 209–210, 87–99. [Google Scholar] [CrossRef]
  50. Xin, Z.B.; Xu, J.X.; Zheng, W. Spatiotemporal variations of vegetation cover on the Chinese Loess Plateau (1981–2006): Impacts of climate changes and human activities. Sci. China Ser. D Earth Sci. 2008, 51, 67–78. [Google Scholar] [CrossRef]
  51. Zhang, Y.; Zhang, C.; Wang, Z.; Chen, Y.; Gang, C.; An, R.; Li, J. Vegetation dynamics and its driving forces from climate change and human activities in the Three-River Source Region, China from 1982 to 2012. Sci. Total Environ. 2016, 563–564, 210–220. [Google Scholar] [CrossRef] [PubMed]
  52. Chen, B.; Zhang, X.; Tao, J.; Wu, J.; Wang, J.; Shi, P.; Zhang, Y.; Yu, C. The impact of climate change and anthropogenic activities on alpine grassland over the Qinghai-Tibet Plateau. Agric. For. Meteorol. 2014, 189–190, 11–18. [Google Scholar] [CrossRef]
  53. Cheng, G.; Wu, T. Responses of permafrost to climate change and their environmental significance, Qinghai-Tibet plateau. J. Geophys. Res. 2007, 112, F02S03. [Google Scholar] [CrossRef]
  54. Wang, G.; Wang, Y.; Li, Y.; Cheng, H. Influences of alpine ecosystem responses to climatic change on soil properties on the Qinghai–Tibet Plateau, China. CATENA 2007, 70, 506–514. [Google Scholar] [CrossRef]
  55. Xu, W.X.; Gu, S.; Zhao, X.Q.; Xiao, J.S.; Tang, Y.H.; Fang, J.Y.; Zhang, J.; Jiang, S. High positive correlation between soil temperature and NDVI from 1982 to 2006 in alpine meadow of the Three-River Source Region on the Qinghai–Tibetan Plateau. Int. J. Appl. Earth Obs. Geoinf. 2011, 13, 528–535. [Google Scholar] [CrossRef]
  56. Fang, Y.P. Managing the Three-Rivers Headwater Region, China: From Ecological Engineering to Social Engineering. Ambio 2013, 42, 566–576. [Google Scholar] [CrossRef] [PubMed] [Green Version]
  57. Fan, J.W.; Shao, Q.Q.; Liu, J.Y.; Wang, J.B.; Harris, W.; Chen, Z.Q.; Zhong, H.P.; Xu, X.L.; Liu, R.G. Assessment of effects of climate change and grazing activity on grassland yield in the Three Rivers Headwaters Region of Qinghai-Tibet Plateau, China. Environ. Monit. Assess. 2010, 170, 571–584. [Google Scholar] [CrossRef]
  58. Wang, J.; Meng, J.J.; Cai, Y.L. Assessing vegetation dynamics impacted by climate change in the southwestern karst region of China with AVHRR NDVI and AVHRR NPP time-series. Environ. Geol. 2008, 54, 1185–1195. [Google Scholar] [CrossRef]
  59. Cai, H.; Yang, X.; Wang, K.; Xiao, L. Is Forest Restoration in the Southwest China Karst Promoted Mainly by Climate Change or Human-Induced Factors? Remote Sens. 2014, 6, 9895–9910. [Google Scholar] [CrossRef] [Green Version]
  60. Cao, S.; Chen, L.; Yu, X. Impact of China’s Grain for Green Project on the landscape of vulnerable arid and semi-arid agricultural regions: A case study in northern Shaanxi Province. J. Appl. Ecol. 2009, 46, 536–543. [Google Scholar] [CrossRef]
  61. Qiu, B.; Chen, G.; Tang, Z.; Lu, D.; Wang, Z.; Chen, C. Assessing the Three-North Shelter Forest Program in China by a novel framework for characterizing vegetation changes. ISPRS J. Photogramm. Remote Sens. 2017, 133, 75–88. [Google Scholar] [CrossRef]
  62. Wang, G.X.; Cheng, G.D. Eco-environmental changes and causative analysis in the source regions of the Yangtze and Yellow Rivers, China. Environmentalist 2000, 20, 221–232. [Google Scholar]
  63. Gao, Y.; Zhou, X.; Wang, Q.; Wang, C.; Zhan, Z.; Chen, L.; Yan, J.; Qu, R. Vegetation net primary productivity and its response to climate change during 2001–2008 in the Tibetan Plateau. Sci. Total Environ. 2013, 444, 356–362. [Google Scholar] [CrossRef]
  64. Jiang, Z.; Lian, Y.; Qin, X. Rocky desertification in southwest China: Impacts, causes, and restoration. Earth Sci. Rev. 2014, 132, 1–12. [Google Scholar] [CrossRef]
  65. Guan, Y.; Zheng, F.; Zhang, P.; Qin, C. Spatial and temporal changes of meteorological disasters in China during 1950–2013. Nat. Hazards 2015, 75, 2607–2623. [Google Scholar] [CrossRef]
  66. Zhai, P.; Zhang, X.; Wan, H.; Pan, X. Trends in total precipitation and frequency of daily precipitation extremes over China. J. Clim. 2005, 18, 1096–1108. [Google Scholar] [CrossRef]
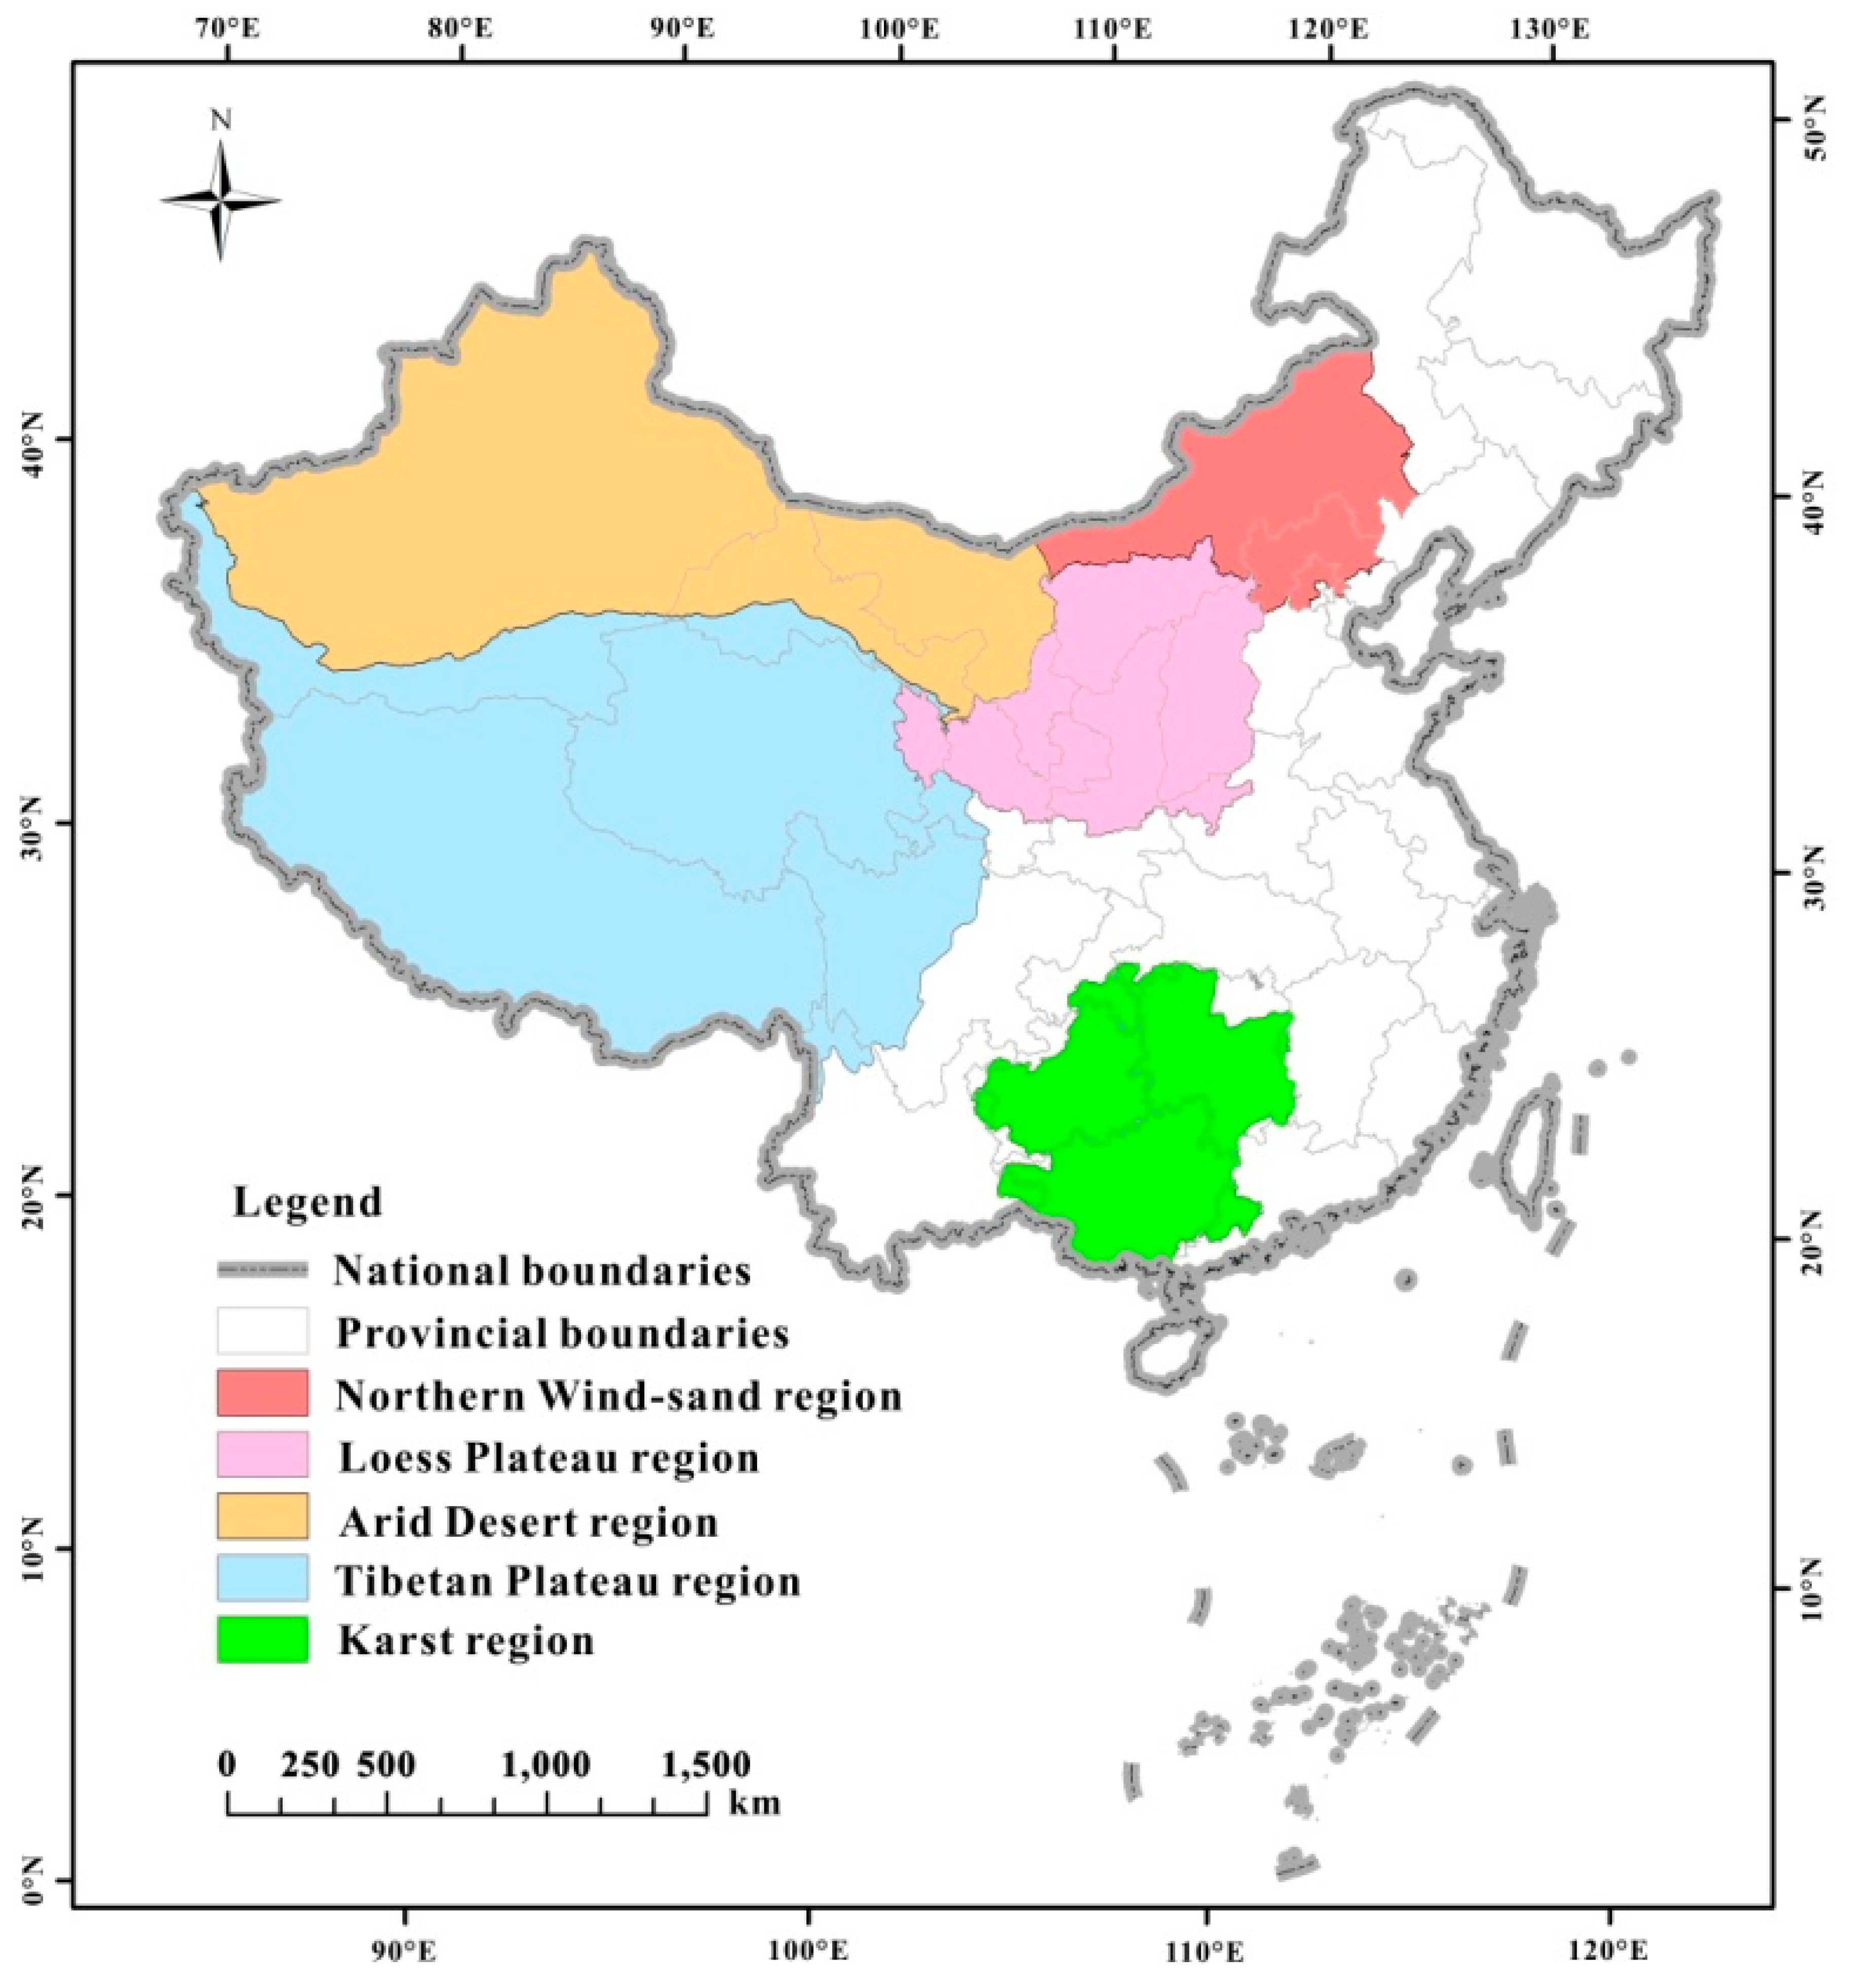
Figure 1. Location of the ecologically vulnerable regions.
Forests 10 00317 g001
Figure 2. Spatial pattern of the actual NPP (NPPa) change trends and significance level (p < 0.05) in the Northern Wind-sand region (a), Loess Plateau region (b), Arid Desert region (c), Tibetan Plateau region (d), and Karst region (e) from 2000 to 2015. The blank area in the figure is an area of no vegetation, such as a desert, urban area, etc.
Forests 10 00317 g002
Figure 3. Spatial distribution of vegetation restoration caused by different factors in the Northern Wind-sand region (a), Loess Plateau region (b), Arid Desert region (c), Tibetan Plateau region (d), and Karst region (e) from 2000 to 2015.
Forests 10 00317 g003
Figure 4. Statistics of vegetation restoration caused by different factors in the whole areas “a” and the NPPa significantly changed areas “b” of five ecologically vulnerable regions from 2000 to 2015.
Forests 10 00317 g004
Figure 5. Spatial distribution of vegetation degradation caused by different factors in the Northern Wind-sand region (a), Loess Plateau region (b), Arid Desert region (c), Tibetan Plateau region (d), and Karst region (e) from 2000 to 2015.
Forests 10 00317 g005
Figure 6. Statistics of vegetation degradation caused by different factors in the whole areas “a” and the NPPa significantly changed areas “b” of five ecologically vulnerable regions from 2000 to 2015.
Forests 10 00317 g006
Figure 7. Major ecological programs in the Northern Wind-sand region (a), Loess Plateau region (b), Arid Desert region (c), Tibetan Plateau region (d), and Karst region (e).
Forests 10 00317 g007
Figure 8. Interannual variations in the annual mean temperature and annual precipitation in the Northern Wind-sand region (a), Loess Plateau region (b), Arid Desert region (c), Tibetan Plateau region (d), and Karst region (e) from 2000 to 2015.
Forests 10 00317 g008
Figure 9. Land-use types in the Northern Wind-sand region (a), Loess Plateau region (b), Arid Desert region (c), Tibetan Plateau region (d), and Karst region (e) (2015).
Forests 10 00317 g009
Table 1. Conditions that indicate the driving forces of vegetation dynamics.
SpShDriving Forces of Vegetation Dynamics
Sa > 0
Condition1<0>0Vegetation restoration primarily caused by human factors
Condition 2>0<0Vegetation restoration primarily caused by climate factors
Condition 3>0>0Vegetation restoration primarily caused by both climate and human factors
Sa < 0
Condition 4>0<0Vegetation degradation primarily caused by human factors
Condition 5<0>0Vegetation degradation primarily caused by climate factors
Condition 6<0<0Vegetation degradation primarily caused by both climate and human factors
Sa is the slope value of NPPa, Sp is the slope value of NPPp, and Sh is the slope value of NPPh. Sa > 0 represents vegetation restoration. By contrast, Sa < 0 represents vegetation degradation. Sp > 0 represents climate factors that benefited vegetation dynamics, while Sp < 0 represents climate factors that harmed vegetation dynamics. Sh > 0 represents human factors that benefited vegetation dynamics. By contrast, Sh < 0 represents human factors that harmed vegetation dynamics.
Table 2. Spatial change statistics of the NPPa in the five ecologically vulnerable regions from 2000 to 2015 (%).
VariablesNorthern Wind-Sand RegionLoess Plateau RegionArid Desert RegionTibetan Plateau RegionKarst Region
Significant increase 164621147
Slight increase5532474024
Slight decrease2615273748
Significant decrease375921
Significant increase/decrease indicates areas (percentages) that changed significantly at the 0.95 confidence intervals.