Abstract
Smoke from forest fires is a growing concern in Korea as forest structures have changed and become more vulnerable to fires associated with climate change. In this study, we developed a Korean forest fire smoke dispersion prediction (KFSDP) system to support smoke management in Korea. The KFSDP system integrates modules from different models, including a Korean forest fire growth prediction model, grid-based geographic information system (GIS) fuel loading and consumption maps generated by national forest fuel inventory data, and the Korean Weather Research and Forecasting Model, into a Gaussian plume model to simulate local- and regional-scale smoke dispersion. The forecast system is operated using grid-based fires and simulates a cumulative smoke dispersion of carbon monoxide (CO) and <2.5 µm and <10 µm particulate matter (PM2.5 and PM10, respectively) ground-level concentration contours at 30-min intervals during the fire in concert with weather forecasts. The simulated smoke dispersions were evaluated and agreed well with observed smoke spreads obtained from real forest fires in Korea, and the performance of the KFSDP system was also analyzed using “what-if” scenarios. This is the first study to develop an integrated model for predicting smoke dispersion from forest fires in Korea.
1. Introduction
Smoke from forest fires presents a rising problem as it contains large amounts of trace gases and aerosol species [1,2,3]. The smoke pollutants released by forest fires include greenhouse gases (carbon dioxide (CO2), methane (CH4), and nitrous oxide (N2O)), photochemically reactive compounds (carbon monoxide (CO) and nitrogen oxides (NOx)), and fine (<2.5 µm) and coarse (<10 µm) particulate matter (PM2.5 and PM10), which degrade air quality and Earth’s climate system due to their feedback with the global climate change [4,5,6,7]. The contribution of emissions from wildland fires worldwide has been estimated to be approximately 40% for CO, 35% for CO2, and 20% for NOx [8], and this contribution is expected to increase due to the number of large fires in the coming decades according to climate change scenarios [9].
Increasing the level of pollutants emitted from fires can also be detrimental to human health. The major health threats related to smoke from forest fires are respiratory problems caused by the inhalation of smoke particulate matter (PM2.5 and PM10), which damages membranes in the lungs [10,11,12]. Such ailments can afflict even healthy people; however, they are especially dangerous for those with asthma or other chronic respiratory problems, as well as small children. Moreover, it has been reported that the reduced visibility due to particulate matter and other elements in smoke plumes occurs up to hundreds of kilometers downwind from emission sources and disturbs human activities [13,14].
In Korea, there is growing awareness about the hazardous effects of fire smoke dispersion. Since 1970, the success of reforestation projects has resulted in dense forests with more than 148 m3/ha on average [15,16]. However, with increasing litterfall and biomass, Korean forests have become more vulnerable to fires under ongoing changes in the global climate, which are driving more frequent and larger fires [17]. In Korea, more than 395 fire episodes per year from 2006 to 2015 generated smoke, even if their scales were not massive, resulting in dozens of community evacuations from smoke exposure as well as contributing to the impairment of air quality, and leading to hazardous and inconvenient conditions [18]. For instance, the dispersion of particulate matter from smoke at fire location areas has been extensively deteriorating regional air quality and negatively affecting human health [19].
To better understand and cope with adverse smoke exposure from fires, real-time smoke dispersion prediction systems have been developed as a decision support system for various smoke management communities across the globe. For example, the USDA Forest Service’s (USFS’s) BlueSky smoke modeling framework had been widely used in the United States (U.S.) and Canada to provide guidance for both prescribed and wildfire smoke management [20,21,22]. The U.S. National Oceanic and Atmospheric Administration (NOAA) smoke prediction system is another smoke dispersion forecasting system designed to address community air quality needs using satellite fire detection [23]. The ClearSky prediction system (http://www.clearsky.wsu.edu) was developed to forecast smoke dispersion, especially from agriculture-related fires in the U.S. Pacific Northwest. In Australia, the Australian Bureau of Meteorology’s smoke prediction system was developed to assist land managers in planning prescribed burnings while reducing the impacts of smoke from these fires [24,25].
Smoke dispersion prediction systems require a set of model components to predict the magnitude and location of smoke effects from fires. A series of modeling steps must be processed sequentially from gathering fire information, to quantifying fuel loading, fuel consumption, and smoke emissions, and finally predicting smoke dispersion based on the meteorological data produced from a weather forecasting model. For instance, the BlueSky smoke modeling system (BlueSky) couples off-the-shelf models for fuel (e.g., the Fuel Characteristic Classification System [26]), consumption (e.g., the Emissions Production Model [27]), emission (e.g., the Fire Emission Production Simulator [28]), weather (e.g., Weather Research and Forecasting (WRF) models [29]), and dispersion (e.g., CALPUFF dispersion model [30]) in a modular framework to produce real-time predictions of smoke transport in the U.S. and Canada [20]. However, the model components in BlueSky are only suitable for forecasting smoke dispersion from fires in the U.S. and Canada since the models were developed based on the properties of fire events, fuel characteristics, fuel consumption, and smoke emissions in the those areas.
In Korea, no integrated smoke dispersion prediction system yet exists to assist in smoke management. Compared to the large-scale forest fires that have occurred across the globe, such as in the U.S. and Canada, 98.5% of the forest fires that have occurred in Korea have been small-scale fires, most of which burned less than 10 ha [18]. Correspondingly, smoke transport from most of these fires appeared to occur over less than 50 km along the downwind distance according to satellite imagery of the smoke dispersion [31]. Therefore, for proper smoke management in Korea, it was necessary to develop the Korean forest fire smoke dispersion prediction system (KFSDP) by considering the characteristics of fire events, fuel properties, and smoke transport in Korea.
The main purpose of this study was to introduce and describe the development of the KFSDP system and to demonstrate its operating components. The KFSDP is an integrated smoke prediction system designed to forecast local and regional smoke dispersion from forest fires across Korea. It includes six major components, including a Korean forest fire growth prediction model, the geographic information system (GIS) raster layers of forest fuel loading and fuel consumption, an emission model, a Korean Weather Research Forecasting (KWRF) model, and a Gaussian smoke dispersion model, to forecast smoke concentrations with regard to the ground-level concentrations of CO, PM2.5, and PM10 in real-time. The capabilities of the KFSDP were demonstrated through the evaluation of its performance (i.e., validation) by comparing case studies based on simulated smoke results with measurements from real forest fires, and by analyzing “what-if” scenarios.
2. Korean Forest Fire Smoke Dispersion Prediction (KFSDP) System
The main components of the KFSDP system are shown in Figure 1. The KFSDP system integrates major modules from a Korean forest fire growth prediction model, an array of GIS raster layers of forest fuel loadings and consumption generated by National forest fuel inventory data, and a set of weather forecast data produced by the KWRF model. These modules are then incorporated into a Gaussian plume dispersion model (GPDM) to simulate local- and regional-scale smoke dispersion. The forecast system is operated using grid-based fires and sequentially links fire activity data obtained from the forest fire spread prediction model to fuel loadings, consumptions, emissions, and a smoke dispersion model. Within the conceptual framework, we delineated five major modules: (1) a Korean forest fire spread prediction module, (2) a fuel loading module, (3) a fuel consumption module, (4) an emission production module, and (5) a smoke dispersion module that simulates the cumulative smoke dispersion of CO, PM2.5, and PM10 concentrations at 30-min intervals together with weather forecasts.
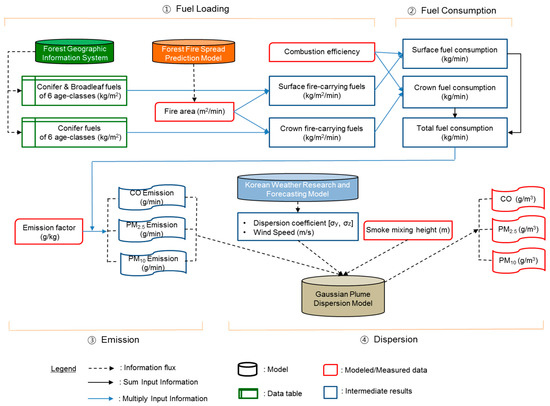
Figure 1.
Integrated framework for predicting the smoke dispersion of CO, PM2.5, and PM10 concentration using the Gaussian plume smoke dispersion model. PM2.5 and PM10 are fine (<2.5 µm) and coarse (<10 µm) particulate matter, respectively.
2.1. Forest Fire Spread Prediction Model
A forest fire spread prediction model developed by the Korea Forest Institute was used to simulate the growth of fire areas, which was then provided into the KFSDP system as the fire input data. The shape of fire in the fire spread model is described as the ellipse with the long axis aligned in the direction of the wind [32]. The growth of fire is implemented by the expansion of an elliptical wave front from a series of vertices defining the edge of a fire applied using Huygens’ wavelet principle [33]. The rate of fire spread and intensity is modeled by the Rothermel fire spread equation [34]. For the purposes of forecasting, the expansion of fire areas was simulated for 30-min intervals based on a GIS fuel map for entire forests across Korea and weather forecasts obtained from the Korea Meteorological Administration. The simulated outputs of fire growth area were then used for fuel loading estimation in the KFSDP system.
2.2. Fuel Loadings
Fuel loadings for each fire area were obtained from a spatial (30-m) fuel property map in the GIS raster layers developed based on the national fuel type classification (FTC) system [35]. The FTC system was designed with two main groups of fuels, surface and crown fire-carrying fuels. The principal fire-carrying surface fuels consist of five categories of conifer fuels (Pinus densiflora forma erecta Uyeki, Pinus densiflora Siebold & Zucc. for central southern lowland and upland ecotypes, Pinus rigida Mill., Pinus koraiensis Siebold & Zucc., and Pinus thunbergii Parl.) and one common broadleaf fuel with respect to 6 classes of tree age groups. The crown fire-carrying fuels are only considered to be conifer species (P. densiflora, P. rigida, P. koraiensis, P. thunbergii, and Larix kaempferi (Lamb.) Carr.) (Figure 2 and Tables S1 and S2). Once the fire area is determined from the fire spread model, fuel loadings are automatically estimated for surface and crown-fire phases, respectively.
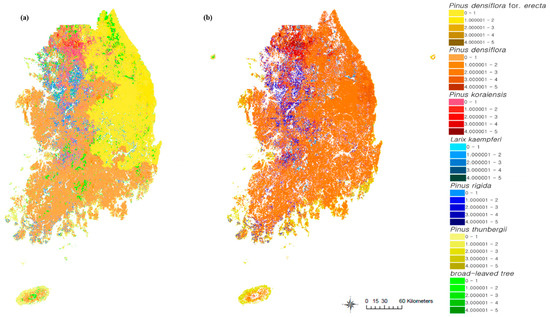
Figure 2.
Distribution of (a) surface- and (b) crown-fire carrying fuels (kg/m2) in Korea.
2.3. Fuel Consumption
Once fire location, size, and fuel loadings are known, the amount and type of fire consumption for every unit area burned can be processed. In the KFSDP system, the total fire consumption was determined by two stages of fire-consumption events: surface and crown-fire consumptions. At each stage, fuel consumption was estimated by multiplying the amount of fuel loadings for each cell passed from the module of fuel loading by a value of combustion efficiency (Figure 1). Within the KFSDP system, the combustion efficiency was provided for surface and crown fires with respect to conifer and broadleaf fuels, respectively (Table 1). These values were estimated based on the residual stump measurements of fuel combustion in forest fires that had occurred across Korea [35]. Here, the broadleaf fuels were considered to only be involved in surface fires. The estimated fuel consumptions for surface and crown fires were then generated as the GIS layers for each cell (Figure 3), which were used as input information to quantify the emission estimates in the next module.

Table 1.
Combustion efficiency for surface- and crown-fire carrying fuels.
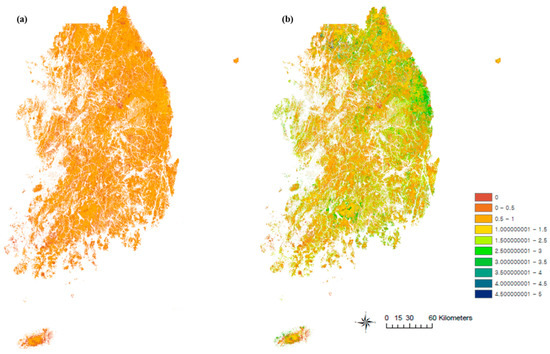
Figure 3.
Distribution of (a) surface and (b) crown fuel consumption (kg/m2) in Korea.
2.4. Emission Production Module (EPM)
Emissions from forest fires were estimated by multiplying total fuel consumption by emission factors of each compound (CO, PM2.5, and PM10) (Figure 1). As forest fires are categorized as surface and crown fires in the KFSDP system, emission factors were also required for each fire type with regard to CO, PM2.5, and PM10. The emission factors were derived for each pollutant compound based on the concentrations measured from combustion products using conifer and broadleaf fuels in the laboratory [36] and a carbon mass balance model [37]. First, combustion experiments were implemented to measure the concentrations of each compound for each type of fire. For surface fires, the dead leaves of P. densiflora and Quercus variabilis Blume, which are considered to be representative species of conifer and broadleaf fuels, were combusted to sample each compound. For crown fires, the dead leaves, live leaves, and branches of P. densiflora were burned to sample smoke compounds since crown fires mainly involved conifer fuels when surface and crown fires occurred at the same time (Table 2). Then, emission factors were estimated for each compound using a carbon mass balance technique (Table 2) wherein PM2.5 and PM10 were assumed to be composed of 60% carbon and the fuel carbon fraction was considered to be 50% [38]. Once the total fuel consumption of GIS grids was determined for forest fire areas at 30-min intervals in the fuel consumption module, the amounts of emission were automatically calculated for each smoke compound (CO, PM2.5, and PM10) based on emission factors supplied in the KFSDP system.
Table 2.
Emission factors for smoke pollutants of CO, PM2.5, and PM10.
2.5. Smoke Dispersion Module
Since 98.5% of forest fires that have been recorded in Korea have been smaller than 10 ha, wherein the smoke appeared to disperse less than 50 km along the downwind distance based on satellite imagery of smoke dispersion [18,31], a GPDM was adopted to forecast smoke dispersion in the KFSDP system [39]. The smoke concentration in a GPDM is represented by a Gaussian distribution in the direction of a constant wind [40] as follows:
where C(x, y, z) is a smoke concentration (g/m3) at downwind (x), horizontal (y), and vertical (z) positions, Q is an emission rate of fire smoke (g/s), u is a wind speed at the fire smoke emission height (m/s), σy and σz are horizontal (y) and vertical (z) dispersion coefficients (m), and H is a height at the fire smoke emission point (m).
In the KFSDP system, the GPDM is designed to assess the ground-level smoke concentrations of CO, PM2.5, and PM10 for downwind distances up to a specified distance, such as 10 km. The dispersion coefficients in the GPDM are determined as the function of the distance from an emission source and a Pasquill atmospheric stability classification (PASC) system [41]. The PASC is divided into six descriptive classes, which are determined based on surface wind speeds and insolation in the day or cloud cover at night. Figure S1 presents a flowchart for an algorithm used to determine a Pasquill atmospheric stability class for the further determination of dispersion coefficients processed in the KFSDP system. Weather information, including wind speeds and directions, is automatically provided within the algorithm via an open application program interface (API) of the Korea Meteorological Administration (http://data.go.kr) wherein hourly, numerical weather predictions are generated by the KWRF model [42]. However, the data of cloud cover and ceiling height were supplied manually via the graphical user interface (GUI) in the GPDM system (Figure 4). Once the atmospheric stability is specified, the values of dispersion coefficients are automatically generated by the Caraway equation, relating the dispersion coefficients with the distance through indices. The mixing height of smoke emissions in the GPDM was defined as a tree height plus 2 m. The wind speed generated from the KWRF model was adjusted to the wind speed at the mixing height through the following equation, and was then used in the GPDM:
where Uz is an adjusted wind speed at a mixing height (m/s), U0 is a wind speed at a physical source height (m/s), Z is a height of smoke in a vertical direction (m), Z0 is a height where an anemometer is located (m), and P is the Pasquill stability class.
Uz = U0 (Z/Z0)P
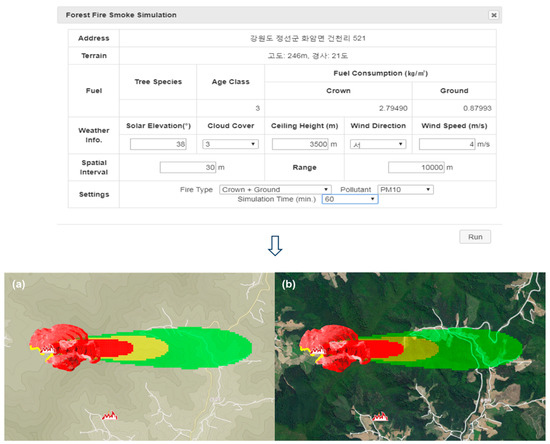
Figure 4.
Graphical user interface (GUI) of Gaussian smoke dispersion model and smoke prediction output enabled by the Korean forest fire smoke dispersion prediction (KFSDP) framework. The forest fire was simulated in Jeongseon, Kwangwon-do, Korea simulated from 7:30 a.m. to 4:30 p.m. on April 11, 2018. Both fires and predicted dispersion of PM10 concentrations are shown. Users can animate the forecasts, zoom, pan, and map data in both (a) Keyhole Markup Language (KML) and (b) satellite layers. PM10 is coarse (<10 µm) particulate matter.
Once emission estimates from EPM were processed and model parameters such as meteorological information and a spatial range for a simulation output were entered by users in the GUI of the GPDM (Figure 4), the GPDM in the KFSDP system was finally implemented to simulate the ground-level emission concentrations of CO, PM2.5, and PM10. The pollutant concentration results were then displayed as a color-coded smoke dispersion contour according to the Comprehensive Air quality Index (CAI) to describe ambient air quality accounting for forest fire smoke (Figure 4).
The CAI is a Korean air quality index used to describe ambient air quality based on the health risks associated with air pollution. The CAI helps the public to easily understand air quality levels, and it protects human health from air pollution [43]. The CAI has values ranging from 0 through 500, which are divided into four categories (Good, Moderate, Unhealthy, and Very unhealthy) denoted by four different colors. The higher the CAI value, the greater the level of air pollution (Table 3). In the KFSDP system, the GPDM results were represented by each color overlay of the expected downwind ground-level CO (1-h mean value) and PM2.5 and PM10 (24-h mean value) concentration contours that reflect the threshold values (i.e., for the categories of Moderate, Unhealthy, and Very unhealthy) of the CAI to indicate possible areas of hazardous smoke impacts.
Table 3.
Description of the comprehensive air quality index (CAI).
3. Results and Discussion
The capabilities of the KFSDP system were examined by comparing the dispersions of simulated smoke plumes with smoke plumes observed from real forest fires. Additionally, the dispersions of smoke plumes in the context of CO, PM2.5, and PM10 concentration contours based on “what-if” model scenarios for defined forest fires were forecasted. For “what-if” model scenarios, simulated fires were assumed to take place from 7:30 a.m. to 4:30 p.m. on April 11, 2018 in Jeongseon, Kwangwon-do, Korea on the basis of a 30-m × 30-m spatial grid (Figure 4).
3.1. Evaluation of Smoke Plume Dispersion
Validation of the KFSDP system was undertaken by comparing modeled smoke plumes with three observed smoke plumes captured from actual forest fires that occurred in Korea. There were no data for smoke plume concentrations, only images of smoke plume dispersions from actual fires. The images were recorded from a firefighting helicopter during fires and processed to extract the shape of smoke plume dispersions onto a Google Earth map (Figure S2). Since we only had the extracted imagery data for the observed plumes, the smoke plumes were simulated as total smoke concentrations in the KFSDP system based on monitored forest fire information, and compared with observed images of smoke plume dispersions projected using Google Earth. Model performance was evaluated with respect to the overall plume shape and range of transport. Three simulated smoke plumes showed outlined areas that overlapped relatively well with the observed smoke plumes, except for the area of smoke plume dispersion that occurred in Daejeon, Korea (Figure 5). Overall, the good performance of simulated results indicates that the KFSDP system is a suitable tool for predicting the dispersion of smoke plumes from forest fires in Korea.
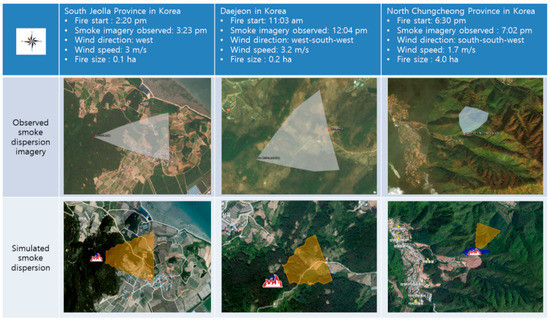
Figure 5.
Comparison of smoke dispersion predictions with observed surface smoke plumes from real forest fires in Korea.
3.2. Characteristics of CO, PM10, and PM2.5 Plume Dispersions
The KFSDP system was employed to verify the characteristics of smoke plume dispersions with respect to CO, PM10, and PM2.5 concentration contours using “what-if” model scenarios. As a real-time model simulation, the dispersions of CO, PM10, and PM2.5 plume contours were simulated for two time intervals (30 min and 60 min). Given the 30-min and 60-min simulated outputs of 2400-m2 and 5000-m2 fire areas, “what-if” weather conditions with a solar elevation of 38°, cloud cover of 3, ceiling height of 3500 m, and a west wind of 4 m/s were assigned.
Figure 6 displays the spatial and temporal distributions of 1-h averaged CO and 24-h averaged PM10 and PM2.5 plume concentration contours with the entire fire area burned. In general, the CO plume appeared more diffused relative to the PM10 and PM2.5 plumes (Figure 6a). The pattern of PM10 and PM2.5 plume dispersions showed a minor difference (Figure 6b,c). As time progressed from 30 min to 60 min, the magnitude and location of each pollutant plume dispersion appeared to be more dispersed regardless of the pollutant type due to the increased size of the burned area. It is worth noting that the KFSDP system performs an automated retrieval of fire areas burned for a respective time interval simulation of smoke plume dispersion, and displays only the simulated result of a smoke plume contour with the entire fire area burned (Figure 6).
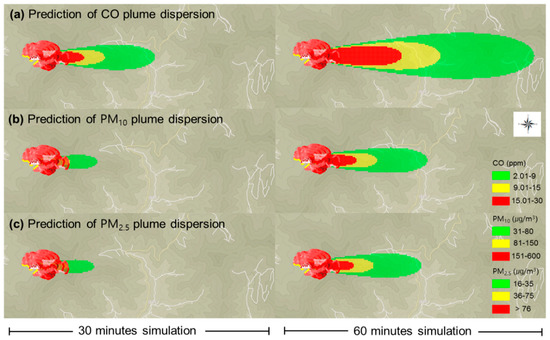
Figure 6.
Predicted dispersions of (a) CO, (b) PM10, and (c) PM2.5 plume concentration contours after 30 min and 60 min of smoke simulations. Both fires and predicted CO, PM10, and PM2.5 surface concentrations are shown. PM2.5 and PM10 are fine (<2.5 µm) and coarse (<10 µm) particulate matter, respectively.
Overall, the results of the simulated scenarios demonstrate the capability of the KFDSP system to produce real-time predictions of smoke transport in terms of CO, PM10, and PM2.5 concentrations given fire activity and weather. This indicates that the KFDSP system could be used as a screening model for a quick evacuation from the hazardous smoke of forest fires [44,45]. Particularly, it also implies that the capability of the real-time forecasting mode of the KFDSP system can effectively improve the accuracy of smoke plume dispersion predictions since a Gaussian plume model can only deal with a static dispersion, such as VSMOKE [46] and the Simple Approach Smoke Estimation Model (SASEM) [47].
3.3. Effects of Wind Speed and Direction on Smoke Plume Dispersion
The effects of wind speed and direction on smoke plume dispersion were examined by simulating “what-if” scenarios under four different wind speeds and directions (Figure 7 and Figure 8). In each simulation, the dispersion of smoke plume concentrations was assessed in terms of a PM10 plume concentration contour for the 60-min simulated output of the fire area burned (5000 m2). To analyze the scenario, the meteorological conditions specified were a solar elevation of 38°, cloud cover of 3, and a ceiling height of 3500 m. The “what-if” analysis for the effect of a wind direction was performed under a wind speed of 4 m/s.
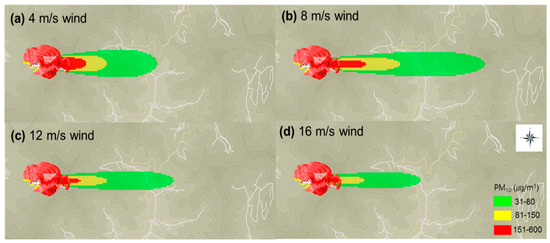
Figure 7.
Comparison of the effects of wind speeds on predicted dispersions of PM10 plume concentration contours: (a) 4 m/s winds, (b) 8 m/s winds, (c) 12 m/s winds, and (d) 16 m/s winds. Both fires and predicted PM10 surface concentrations are shown. PM10 is coarse (<10 µm) particulate matter.
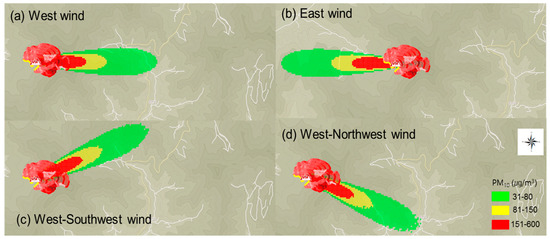
Figure 8.
Comparison of the effects of wind directions on predicted dispersions of PM10 plume concentration contours: (a) west winds, (b) east winds, (c) west-southwest winds, and (d) west-northwest winds. Both fires and predicted PM10 surface concentrations are shown. PM10 is coarse (<10 µm) particulate matter.
The model simulations demonstrate that the dispersion of a PM10 plume concentration varied significantly by wind speed (Figure 7). The spread of the PM10 plume contour appeared to be the largest at 8 m/s wind speed and was relatively narrower and shorter under higher wind speeds. This variation could be attributed to the changing stability of atmospheric conditions along with wind speeds. It also indicates that the dispersion of a PM10 plume concentration is disproportional with wind speed under the same atmospheric conditions where the model scenarios correspond to near neutral conditions above 8 m/s wind speeds given specified “what-if” weather conditions (Figure 7b–d). With regard to the effects of wind direction, simulations showed that the direction of a PM10 plume dispersion was significantly dependent on wind direction (Figure 8).
Overall, the results of model simulations indicate that the 30-min forecasting mode in the KFDSP system can be used to capture the variability of wind speed and direction on smoke plume dispersion for real emission scenarios. This correspondingly implies that a time-varying function of wind speed and direction can reduce the limitations of a steady-state distribution using the Gaussian plume model in the KFDSP system. This is also an important step forward relative to current smoke dispersion systems, such as the BlueSky Playground beta, which can only simulate smoke dispersion under a constant wind speed and direction [48].
3.4. Effects of Multiple Fires on Smoke Plume Dispersion
The effects of smoke plume dispersion from multiple fires were examined by three fire scenario simulations. In each simulation, the dispersion of smoke plume concentrations was assessed in terms of a PM10 plume concentration contour from the 60-min simulated outputs of three fire events, with areas of 5000 m2 (first fire), 6000 m2 (first and second fires), and 7800 m2 (first, second, and third fires). To analyze the scenario, the meteorological conditions was specified as a solar elevation of 38°, cloud cover of 3, and a ceiling height of 3500 m under west and west-northwest wind directions at a speed of 4 m/s.
Figure 9 displays the superimposed dispersion of PM10 plume concentration contours from multiple fires. The three-fire scenario shows substantially larger dispersion of PM10 plume ground-level concentrations than the one-fire scenario. In particular, the multiple fire scenario contributed to an increase in the spreading of moderate levels of PM10 concentrations due to the cumulative effects of plume concentrations from multiple fires (Figure 9b,c). Overall, model simulations demonstrate that the KFDSP system can effectively facilitate forecasting the combined effects of smoke plume dispersions from multiple fire sources. This correspondingly indicates that the KFDSP system shows a substantial improvement over current smoke dispersion systems, such as a BlueSky Playground beta, which can only simulate smoke dispersion for a one-fire event [48].
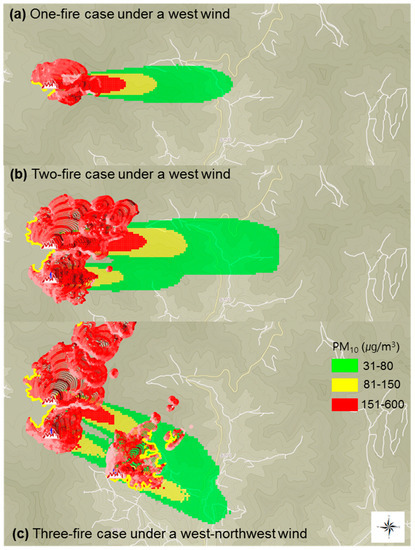
Figure 9.
Effects of multiple fires on predicted dispersions of PM10 plume concentration contours: (a) one-fire scenario under a west wind, (b) two-fire scenario under a west wind, and (c) three-fire case under a west-northwest wind. Both fires and predicted PM10 surface concentrations are shown. PM10 is coarse (<10 µm) particulate matter.
4. Conclusions
The KFSDP system, a real-time smoke dispersion forecast system for forest fires, was developed for the first time to assist with smoke management efforts in Korea. It is designed to be a decision-support tool for an early warning system to evacuate communities quickly from areas of exposure to hazardous smoke from forest fires across Korea. The KFSDP system is operated by an integrated modeling system consisting of a fire growth spread model, grid-based GIS fuel loading and consumption maps, the KWRF model, and a Gaussian plume model sequentially linked to simulate the ground-level plume concentrations of smoke dispersion.
The capability of the KFSDP system was demonstrated through the evaluation of its performance by comparing simulated smoke plumes with measurements from real forest fires and by analyzing “what-if” scenarios. The smoke plumes modeled using the KFSDP system generally compared well with plume observation images captured from a firefighting helicopter with respect to the overall plume shape and range of transport. In “what-if” scenario analyses, the KFSDP system demonstrated the potential to forecast varied smoke plume dispersions in real-time based on automated estimations of fuel consumption and forecasted meteorology for a specified forest fire.
These analyses also showed that the KFSDP system is capable of proper predictions of smoke dispersion under various wind speed and direction conditions and for multiple-fire scenarios. These results demonstrate that the KFSDP system provides an effective means of predicting smoke plume dispersion as an early warning system to inform and reduce human exposure to hazardous smoke from forest fires across Korea.
To further assess the robustness of the KFSDP system, model scenarios may be tested using future sampling data. Future research on the determination of plume rise for a better description of plume structure will also improve the accuracy of smoke dispersion prediction. Moreover, the incorporation of the effects of rough terrains on dispersion coefficients, reflecting the geography of mountainous forests in Korea, will further enhance the accuracy of smoke dispersion prediction.
Supplementary Materials
The following are available online at https://www.mdpi.com/1999-4907/10/3/219/s1, Figure S1: Algorithm for determining the dispersion coefficients using Pasquill atmospheric stability classes and the Caraway dispersion equation, Figure S2: Generation of the shape of observed smoke plume dispersion, Table S1: Surface fire-carrying fuel loadings, Table S2: Crown fire-carrying fuel loadings.
Author Contributions
B.L. prepared and revised the manuscript. B.L. and S.C. collected and analyzed the data. S.L. developed software used in the study. C.W. and J.P. designed the project.
Funding
This study was carried out with the support of R&D Program for Forest Science Technology (Project No. 2015075C10-1718-AA02, 2018112B10-1820-BB01) provided by Korea Forest Service (Korea Forestry Promotion Institute).
Acknowledgments
We wish to thank all of the scientists in the Division of Forest Disaster Management at the National Institute of Forest Science for their support.
Conflicts of Interest
The authors declare no conflict of interest. The funders had no role in the design of the study; in the collection, analyses, or interpretation of data; in the writing of the manuscript, or in the decision to publish the results.
References
- Andreae, M.O.; Merlet, P. Emission of trace gases and aerosols from biomass burning. Glob. Biogeochem. Cycles 2001, 15, 955–966. [Google Scholar] [CrossRef]
- Michel, C.; Liousse, C.; Gregoire, J.M.; Tansey, K.; Carmichael, G.R.; Woo, J.H. Biomass burning emission inventory from burnt area data given by the SPOT-VEGETATION system in the frame of TRACE-P and ACE-Asia campaigns. J. Geophys. Res. 2005, 110, 1–15. [Google Scholar] [CrossRef]
- Wiedinmyer, C.; Quayle, B.; Geron, C.; Belote, A.; McKenzie, D.; Zhang, X.; O’Neill, S.; Wynne, K.K. Estimating emissions from fires in North America for air quality modeling. Atmos. Environ. 2006, 40, 3419–3432. [Google Scholar] [CrossRef]
- Lapina, K.; Honrath, R.E.; Owen, R.C.; Val Martı´n, M.; Pfister, G. Evidence of significant large-scale impacts of boreal fires on ozone levels in the midlatitude Northern Hemisphere free troposphere. Geophys. Res. Lett. 2006, 33. [Google Scholar] [CrossRef]
- Simpson, I.J.; Rowland, F.S.; Meinardi, S.; Blake, D.R. Influence of biomass burning during recent fluctuations in the slow growth of global tropospheric methane. Geophys. Res. Lett. 2006, 33. [Google Scholar] [CrossRef]
- Stohl, A.; Berg, T.; Burkhart, J.F.; Fjæraa, A.M.; Forster, C.; Herber, A.; Hov, O.; Lunder, C.; McMillan, W.W.; Oltmans, S.; et al. Arctic smoke- record high air pollution levels in the European Arctic due to agricultural fires in Eastern Europe in spring 2006. Atmos. Chem. Phys. 2007, 7, 511–534. [Google Scholar] [CrossRef]
- Liu, Y.; Kahn, R.A.; Chaloulakou, A.; Koutrakis, P. Analysis of the impact of the forest fires in August 2007 on air quality of Athens using multi-sensor aerosol remote sensing data, meteorology and surface observations. Atmos. Environ. 2009, 43, 3310–3318. [Google Scholar] [CrossRef]
- Langmann, B.; Duncan, B.; Textor, C.; Trentmann, J.; van der Werf, G.R. Vegetation fire emissions and their impact on air pollution and climate. Atmos. Environ. 2009, 43, 107–116. [Google Scholar] [CrossRef]
- IPCC. Part A: Global and Sectoral Aspects. In Climate Change 2014: Impacts, Adaptation, and Vulnerability. Working Group II Contribution to the Fifth Assessment Report of the Intergovernmental Panel on Climate Change; Field, C.B., Barros, V.R., Dokken, D.J., Mach, K.J., Mastrandrea, M.D., Bilir, T.E., Chatterjee, M., Ebi, K.L., Estrada, Y.O., Genova, R.C., et al., Eds.; Cambridge University Press: Cambridge, UK; New York, NY, USA, 2014; pp. 1–1132. ISBN 9781107415379. [Google Scholar]
- Dockery, D.W.; Pope, C.A.; Xu, X.; Spengler, J.D.; Ware, J.H.; Fay, M.E.; Ferris, B.G.; Speizer, F.E. An association between air pollution and mortality in six U.S. cities. N. Engl. J. Med. 1993, 329, 1753–1759. [Google Scholar] [CrossRef] [PubMed]
- U.S. EPA. Air Quality Criteria for Particulate Matter (Final Report, 2004); EPA 600/P-99/002aF-bF; U.S. Environmental Protection Agency: Washington, DC, USA, 2004.
- Kreyling, W.G.; Manuela, S.; Winfried, M. Dosimetry and toxicology of ultrafine particles. J. Aerosol. Med. 2004, 17, 140–152. [Google Scholar] [CrossRef] [PubMed]
- Malm, W.C. Introduction to Visibility; Colorado State University, Cooperative Institute for Research in the Atmosphere (CIRA): Fort Collins, CO, USA, 1999; pp. 1–70. ISSN 0737-5352-40. [Google Scholar]
- Heriyanto, E.; Syaufina, L.; Sobri, M. Forecasting simulation of smoke dispersion from forest and land fires in Indonesia. Procedia Environ. Sci. 2015, 24, 111–119. [Google Scholar] [CrossRef]
- Kim, K.H.; Zsuffa, L. Reforestation of South Korea: The history and analysis of a unique case in forest tree improvement and forestry. Forest. Chron. 1994, 70, 58–64. [Google Scholar] [CrossRef]
- Bae, J.S.; Lee, K.H.; Lee, Y.G.; Youn, H.J.; Park, C.R.; Choi, H.T.; Kim, T.G. Lessons Learned from the Republic of Korea’s National Reforestation Programme; Research Report; Korea Forest Service: Daejeon, Korea, 2015; ISBN 92-9225-579-7.
- Kwon, C.G.; Lee, S.Y.; Lee, H.P. Analysis of forest fire conditions on forest structure changing annually. In Proceedings of the Korea Inst. of Fire Sci. Eng. Conference, Jeonju, Korea, 21–22 April 2011; pp. 421–425. [Google Scholar]
- Korea Forest Research Institute (KFRI). The Development of Evacuation Area-Estimating Method in Response to Forest Fire Smoke Diffusion; KFRI: Seoul, Korea, 2014; pp. 11–18.
- Clinton, N.; Gong, P.; Scott, K. Quantification of pollutants emitted from very large wildland fires in Southern California, USA. Atmos. Environ. 2006, 40, 3686–3695. [Google Scholar] [CrossRef]
- Larkin, N.K.; O’Neill, S.; Solomon, R.; Raffuse, S.; Strand, T.; Sullivan, D.C.; Krull, C.; Rorig, M.; Peterson, J.L.; Ferguson, S.A. The BlueSky smoke modeling framework. Int. J. Wildland Fire 2009, 18, 906–920. [Google Scholar] [CrossRef]
- Goodrick, S.L.; Achtemeier, G.L.; Larkin, N.K.; Liu, Y.; Strand, T.M. Modelling smoke transport from wildland fires: A review. Int. J. Wildland. Fire 2012, 22, 83–94. [Google Scholar] [CrossRef]
- Anderson, K. Smoke Forecasts from Wildland Fires for Canada; Contractor Report: DRDC-RDDC-2016-C179; Natural Resources Canada: Edmonton, AB, Canada, 2016.
- Rolph, G.D.; Draxler, R.R.; Stein, A.F.; Taylor, A.; Ruminski, M.G.; Kondragunta, S.; Zeng, J.; Huang, H.; Manikin, G.; McQueen, J.T.; et al. Description and verification of the NOAA smoke forecasting system: The 2007 Fire Season. Weather Forecast. 2009, 24, 361–378. [Google Scholar] [CrossRef]
- Wain, A.G.; Mills, G.A. The Australian Smoke Management Forecast System; BMRC Research Report No. 117; Bureau of Meteorology Research Centre: Melbourne, Australia, 2006.
- O’Neill, S.M.; Larkin, N.K.; Hoadley, J.; Mills, G.; Vaughan, J.K.; Draxle, R.; Rolph, G.; Ruminski, M.; Ferguson, S.A. Regional real-time smoke prediction systems. In Developments in Environmental Science, Wildland Fires and Air Pollution; Bytnerowicz, A., Arbaugh, M.J., Riebau, A.R., Andersen, C., Eds.; Elsevier: Oxford, UK, 2009; Volume 8, pp. 499–534. ISBN 978-0-08-055609-3. [Google Scholar]
- McKenzie, D.; Raymond, C.L.; Kellogg, L.K.B.; Norheim, R.A.; Andreu, A.G.; Bayard, A.C.; Kopper, K.E.; Elman, E. Mapping fuels at multiple scales: Landscape application of the Fuel Characteristic Classification System. Can. J. For. Res. 2007, 37, 2421–2437. [Google Scholar] [CrossRef]
- Sandberg, D.V.; Peterson, J.L. A source strength model for prescribed fires in coniferous logging slash. In Proceedings of 21st Annual Meeting of the Air Pollution Control Association; Northwest Section: Pittsburgh, PA, USA, 1984; p. 14. [Google Scholar]
- Anderson, G.K.; Sandberg, D.V.; Norheim, R.A. Fire Emission Production Simulator (FEPS) User’s Guide; US Forest Service Pacific Northwest Research, Fire and Environmental Research Applications Team: Seattle, WA, USA, 2004.
- Skamarock, W.C.; Klemp, J.B.; Dudhia, J.; Gill, D.O.; Barker, D.M.; Wang, W.; Powers, J.G. A Description of the Advanced Research WRF Version 2; NCAR Technical Note: NCAR/TN-468+STR; National Center for Atmospheric Research: Boulder, CO, USA, 2005. [Google Scholar]
- Scire, J.G.; Strimaitis, D.G.; Yamartino, R.J. A User’s Guide for the CALPUFF Dispersion Model (Version 5); Earth Tech Inc.: Concord, MA, USA, 2000. [Google Scholar]
- Park, J.; Youn, H.J.; Lee, B.D.; Woo, C.S.; Kim, Y.; Lee, B. Review of wildland fire smoke dispersion models and suggestion for Korean forest-fire smoke impact forecast system. J. Korean Soc. Hazard. Mitig. 2016, 16, 197–208. [Google Scholar] [CrossRef]
- Anderson, D.; Catchpole, E.; de Mestre, N.; Parkes, T. Modelling the spread of grass fires. J. Aust. Math. Soc. 1982, 23, 451–466. [Google Scholar] [CrossRef]
- Richards, G.D. A general mathematical framework for modeling two-dimensional wildland fire spread. Int. J. Wildl. Fire 1995, 5, 63–72. [Google Scholar] [CrossRef]
- Rothermel, R. A Mathematical Model for Predicting Fire Spread in Wildland Fuels; Research Paper INT-115; USDA Forest Service: Ogden, UT, USA, 1972.
- Lee, B.; Kwon, C.; Won, M.; Kim, S.; Kim, Y.; Lee, Y.; Choi, C. Development of Advanced Fuel Estimation for Korean Coniferous Tree Species; Research Report: 11-1400377-000882-01; Korea Forest Research Institute: Seoul, Korea, 2016.
- Lee, B.D.; Kim, S.Y.; Youn, H.J.; Kang, S.M.; Seo, Y.G.; Kim, W.; Heo, S.M. Evaluation of exposure to hazard substances in forest fire suppression. Korean Rev. Crisis Emerg. Manag. 2015, 11, 111–123. [Google Scholar] [CrossRef]
- Nelson, R.M. An Evaluation of the Carbon Balance Technique for Estimating Emission Factors and Fuel Consumption in Forest Fires; Research Paper SE-231; U.S. Department of Agriculture, Forest Service, Southeastern Forest Experiment Station: Asheville, NC, USA, 1982.
- Ward, D.E.; Susott, R.A.; Kauffman, J.B.; Babbitt, R.E.; Cumming, D.L.; Dias, B.; Holben, B.N.; Kaufman, Y.L.; Rasmussen, R.A.; Setzer, A.W. Smoke and fire characteristics for cerrado and deforestation burns in Brazil: Base-B experiment. J. Geophys. Res. 1992, 97, 14601–14619. [Google Scholar] [CrossRef]
- U.S. Environmental Protection Agency. Revision to the Guideline on Air Quality Models: Adoption of a Preferred General Purpose (Flat and Complex Terrain) Dispersion Model and Other Revisions; Document Number 05-21627; Environmental Protection Agency: Washington, DC, USA, 2005; pp. 68217–68261.
- Zannetti, P. Air Pollution Modeling: Theories, Computational Methods, and Available Software, 1st ed.; Zannetti, P., Ed.; Springer: New York, NY, USA, 1990; pp. 1–106. ISBN 978-1-4757-4465-1. [Google Scholar]
- Pasquill, F. Atmospheric Dispersion Parameters in Gaussian Plume Modeling, Part II. Possible Requirements for Change in the Turner Workbook Values; EPA-600/4-76-030b; Environmental Protection Agency: Washington, DC, USA, 1974.
- Cho, I.H.; Woo, H.D.; Lim, J.O. Development and application of Korean weather research and forecasting (KWRF). In Proceedings of the Spring Meeting Korean Meteorological Society, Gangneung, Korea, 28–29 April 2005; pp. 368–369. [Google Scholar]
- Korea Environment Corporation. Available online: https://www.airkorea.or.kr/eng/cai/cai1 (accessed on 10 April 2018).
- Ronchi, E.; Gwynne, S.M.; Rein, G.; Wadhwani, R.; Intini, P.; Bergstedt, A. E-Sanctuary: Open Multi-Physics Framework for Modelling Wildfire Urban Evacuation; Fire Protection Research Foundation Report; Fire Protection Research Foundation: Quincy, MA, USA, 2017. [Google Scholar]
- Intini, P.; Ronchi, E.; Gwynne, S.; Pel, A. Traffic modeling for wildland–urban interface fire evacuation. J. Transp. Eng. Part. A Syst. 2019, 145, 04019002. [Google Scholar] [CrossRef]
- Lavdas, L.G. Program. VSMOKE—Users Manual; General Technical Report SRS-6; USDA Forest Service, Southeastern Forest Experiment Station: Macon, GA, USA, 1996.
- Sestak, M.L.; Riebau, A.R. SASEM: Simple Approach Smoke Estimation Model; Technical Note 382; U.S. Bureau of Land Management, Wyoming State Office: Cheyenne, WY, USA, 1988.
- U.S. Army Corps of Engineering (USACE). Available online: http://viewer.smoke.airfire.org/vsmoke.php (accessed on 28 April 2018).
© 2019 by the authors. Licensee MDPI, Basel, Switzerland. This article is an open access article distributed under the terms and conditions of the Creative Commons Attribution (CC BY) license (http://creativecommons.org/licenses/by/4.0/).