Abstract
Carpinus turczaninowii L., commonly known as hornbeam, has significant economic and ornamental importance and is largely distributed in the northern hemisphere, including parts of China and Korea, with high adaptation to harsh conditions in very unfertile soils. In this study, the ecophysiological responses of C. turczaninowii seedlings to various salinity stress treatments (NaCl: 0, 17, 34, 51, 68, and 85 mM) were studied for 42 days by determining stress-induced changes in growth parameters and biochemical markers. Salinity stress affected the values of all the examined parameters, both morphological and physiological, and caused the inhibition of plant growth, the degradation of photosynthetic capacity and stomatal behavior, a decrease in the photosynthetic pigments contents and relative water content, an increase in the Malondialdehyde (MDA) content and relative electrolytic conductivity, and the accumulation of Na+ and Cl− content. The presence of relatively high concentrations of organic osmolytes, the activation of antioxidant enzymes, and the ionic transport capacity from the root to shoots may represent a constitutive mechanism of defence against stress in C. turczaninowii seedlings. Our results suggest that C. turczaninowii can tolerate salinity at low and moderate concentrations (17–51 mM) under nursery conditions and can be widely used in roadsides, gardens, parks, and other urban areas.
1. Introduction
During growth, plants are often exposed to a variety of abiotic stresses that will affect their growth and production [1]. Among these stresses, high soil salinity is a widespread problem, and soil salinization has been one of the major reasons for the decrease of crop yield in arid and semi-arid areas [2]. Salinity affects approximately one-third of the irrigated land, restricting the vegetative and reproductive growth of plants by causing severe physiological disorders and direct or indirect damaging effects [3]. In many temperate regions, de-icing salts are commonly used to keep the roads dry and safe in winter, involving large amounts of NaCl. Every year, the releases of de-icing salt are 400–1400 t in France, 2000 t in Germany, 2.2 million t in England, 4–5 million t in Canada, and 13.6–18 million t in the USA, and the use of de-icing salt is increasing in China; this country has recently become the largest producer in the world [4]. Salt can increase soil salinity via runoff, splashing, and aerosols and can modify roadside soil properties and plant communities [5]. Moreover, the airborne deposition and distribution of de-icing salts extend the scope of impact areas [6]. Plants near the road are therefore suppressed due to salinity stress [7]. Their symptoms depend on whether the damage is caused by the salinity of the soil or by deposition directly to the aboveground parts of the plants [8].
Many studies have been conducted on herbaceous halophytes [9,10], sensitive or tolerant crop species [11], and tolerant woody species [12]. However, there have been fewer studies on the physiological responses of woody plants sensitive to salinity stress compared to those on other plants. Salinity levels can be expressed by the electrical conductivity (EC) of the irrigation water or an aqueous extract of the soil. According to Richards (1954) [13], the levels of soils were: 0–2 dS m−1, not saline; 2–4 dS m−1, slightly saline; 4–8 dS m−1, saline; 8–16 dS m−1, strongly saline; >16 dS m−1, extremely saline. Different plants may differ in their sensitivity to salt stress, and the ability of plants to adapt to stress depends on the type, intensity and duration of stress as well as the species of plants and stage of stress [14]. Salinity stress will have multiple adverse effects on plants, including negative effects on morphology, photosynthesis, and physiological and biochemical processes [15]. High concentrations of Na+ and Cl− ions will induce water stress and ion deficiencies, impair membrane function, decrease chlorophyll content and some enzyme activities, and disturb metabolic processes, such as photosynthesis, stomatal behavior, protein synthesis, and carbohydrate and lipid metabolism [16]. It has been confirmed that many salt-stressed plants can participate in the inhibition of stress throughout a plant’s life cycle; endurance can also occur at the cellular level, for example, compatible organic solutes can be synthesized, such as prolines, sugars, and proteins, which will contribute to the protection of cell structure against dehydration [17]. The activation of antioxidant systems can help to prevent or reduce oxidative damage to proteins and membranes, which is also a general reaction to abiotic stresses that cause oxidative stress through the generation of reactive oxygen species (ROS) [18]. Antioxidant enzymes include superoxide dismutase (SOD), peroxidase (POD), ascorbate peroxidase (APX), and glutathione reductase (GR) [19]. Most forest tree species growing alongside roads and highways in temperate regions are described as salt sensitive, and the impact of salt on these species needs to be assessed.
Carpinus turczaninowii L. is a member of the Betulaceae family, a well-known deciduous tree mainly distributed in the Northern Hemisphere as a dominant forest species [20]. This plant can reach a height of 15 m and grows in forests on hills and in valleys between 500 and 2000 m above sea level. C. turczaninowii has strong adaptability, which can be resistant to drought and barren soil, and can tolerate very low temperatures, even below −20 °C [21]. The fallen leaves of this species can display a beautiful orange-red color in the autumn. They are commonly used for bonsai and landscaping in gardens or along roadsides in China, Korea, and Japan. The wood of C. turczaninowii is very hard, dense, and fine textured, and has often been used for making agricultural tools and furniture [22]. Previous chemical investigations have indicated that this plant has anti-inflammatory and antioxidative properties in extracts from its leaves and branches, making it a potential candidate for use in pharmaceuticals and cosmetics [23,24]. Even though C. turczaninowii does not grow naturally in saline environments, as a type of ornamental plant, it is now used in many places. It may be affected by relatively high salinity concentrations in locations close to mountain roads because of the use of de-icing salts in winter, a widespread practice worldwide. In addition, C. turczaninowii is often planted in parks or gardens for landscaping, where these trees may be irrigated with low-quality water containing different concentrations of salts. However, little research has been conducted on the responses of C. turczaninowii to salinity stress, experimental data are very scarce, and its salt tolerance is not fully understood. The aim of this study was to evaluate the resistance to salinity stress in C. turczaninowii seedlings.
We hypothesize that C. turczaninowii seedlings will be affected by salinity stress and that the plants may develop relevant response mechanisms to stress, such as the biosynthesis of osmolytes and the activation of antioxidant mechanisms. To test this hypothesis, we evaluated the growth and ecophysiological responses of C. turczaninowii seedlings to different levels of salinity stress under controlled greenhouse conditions. These results may help to better design, implement conservation and cultivation practices for C. turczaninowii. We also can provide useful reference data for the selection of ornamental plant species for landscaping in urban areas.
2. Materials and Methods
2.1. Plant Material
The C. turczaninowii seeds were obtained from the Ta-pieh Mountains, Henan, China. The seeds were sown in containers to initiate growth in March 2012 at the landscape experimental teaching centre of Nanjing Forestry University in Nanjing, Jiangsu, China. After one year of growth, in March 2013, we selected well-grown seedlings that were approximately 0.8 cm in diameter with 30.0 cm-tall stems and transplanted them into pots with dimensions of 10 cm in diameter and 15 cm in height and filled with well-mixed loamy soil, peat, vermiculite, and pearlite (1:1:1:1, v/v/v/v) with a pH of 6.5. The content of soil nutrients was determined by a TFW-VI soil nutrient and moisture tester (TFW-VI, Wuhan, China). The soil contained 50.18 mg kg−1 available N, 12.15 mg kg−1 available P, 145 mg kg−1 available K. Each pot contained one seedling and 0.5 kg of soil. The seedlings received 0.5 L of full-strength Hoagland’s nutrient solution biweekly before salt stress treatment according to the method of Seth D. Hothem (2003) [25]. The C. turczaninowii seedlings were grown in an artificially controlled greenhouse under natural sunlight conditions at a temperature of 25–27 °C and relative humidity of 65–75%.
2.2. Salt Stress Treatments
The trials were conducted when the C. turczaninowii seedlings had grown in the greenhouse for one month. In April 2013, we chose uniform seedlings that were approximately 30.0 cm tall and had similar leaf numbers. The seedlings were subjected to a 0 (control), 17, 34, 51, 68, and 85 mM NaCl solution. The electrical conductivity of the substrates was 1.6, 3.3, 4.4, 6.2, 8.4, and 10.5 dS m−1, respectively. These concentrations were selected according to our preliminary experiments on C. turczaninowii seedlings. Each treatment had three replicates with 25 random seedlings per replicate, and one seedling per pot. They were grown in the greenhouse with same plant maintenance and management. The control plants were watered with 200 mL of water per plant, whereas for the salt treatment plants, the same volume of 17, 34, 51, 68, or 85 mM NaCl solution was used. To avoid osmotic shock, the NaCl solution was added in three equal parts on alternating days until the target concentration was reached. We also placed a plastic tray at the bottom of the pot to retain any excess solution that had been applied, and this was placed back into the pot to ensure the accuracy of the experimental design. The stress treatments were conducted for 42 days, and after the midpoint (21 days) and the end time (42 days) of growth, measurements were carried out, and samples were collected for different physiological analyses. The whole plants were harvested after 42 days of treatment. Each measured parameter had three replicates.
2.3. Determination of Plant Growth Parameters
The following growth parameters were recorded, with three replicates: stem length increase and diameter increase (measured on the first day and the last day of the salt stress treatments, the location on the seedlings of the stem diameter measurements was 2.0 cm above the soil surface); seedling survival at the end of the trial; biomass of different tissues (dry weight, DW; the plants were separated into roots, stems and leaves, which were dried at 80 °C in an oven for 48 h); taproot length (roots were washed with distilled water, blotted dry on filter paper, measured the taproot length with a ruler); leaf area, measured with a portable leaf area meter (LI-3000C, LI-COR, Lincoln, NE, USA); and root/shoot ratio, which was calculated as the dry mass of the aboveground parts/belowground parts.
2.4. Measurement of Photosynthetic Parameters and Chlorophyll Fluorescence
Photosynthetic parameters were evaluated using a portable photosynthetic system (Ciras-2, Shanghai, China). The net photosynthetic rate (Pn), transpiration rate (Tr), stomatal conductance (Gs), and intercellular CO2 concentration (Ci) were measured in the first fully expanded leaves of each plant on the final day of the salinity treatments from 8:00 a.m. to 11:00 a.m. on a sunny, cloudless day. The water use efficiency (WUEi) was calculated as Pn/Tr. To obtain a stable photosynthetic rate, the air temperature was 25 °C, the intensity of the light was 1000 μmol m−2s−1, the relative humidity was 65%, and the concentration of reference CO2 was 380 μmol mol−1. Chlorophyll fluorescence parameters were determined on the same day that the gas exchange measurements were taken with the fluorescence leaf chamber of the Ciras-2 photosynthetic system, including the photochemical quantum efficiency (ΦPSII), maximum quantum yield efficiency of photosystem II (Fv/Fm), photochemical quenching parameter (qP), electron transfer rate (ETR), and non-photochemical quenching parameter (NPQ) on the dark-adapted leaves. All the parameter measurements were performed on three leaves per plant.
2.5. Scanning Electron Microscopy
The anatomical features (including the leaf surface and cross-section) of the leaves of C. turczaninowii seedlings in the control and salinity treatments were analyzed using scanning electron microscopy (SEM) (Quanta 200, FEI, Hillsborough, OR, USA). On the final day of the salinity treatments, the leaves were collected, properly cleaned with tap water and cut into pieces (5 × 5 mm) with a sharp blade. Formalin acetic acid (FAA) was used for one week for fixation. Then, the samples were dehydrated with a graded ethanol series, placed in isoamyl acetate aldehyde, and subjected to critical-point drying (K850, Emitech, London, UK), mounting, and gold coating using an ion sputtering apparatus (E1010, Hitachi, Tokyo, Japan). Finally, SEM was performed to observe the blade surface and cross-section of the leaves. The stomatal characteristics, including the stomatal density (stomata mm−2) and size (length and width), were evaluated following the method reported by Camposeo et al. [26]. The leaf thickness and palisade tissue thickness of the leaves were measured by the photomicroscope system with a computer attachment.
2.6. Photosynthetic Pigments
The chlorophyll a (Chl a), chlorophyll b (Chl b), and total carotenoids (Caro) contents of the leaves were measured with the spectrophotometric method. Fresh leaves were cleaned with distilled water, and chlorophyll was extracted with a mixture of acetone and 95% ethanol (v:v = 1:1). After mixing overnight in an orbital shaker and following 10 min of centrifugation at 9,000 rpm, the absorbance of the supernatant was measured at wavelengths of 645, 663, and 470 nm by ultraviolet-visible spectrophotometry (Lambda25, PerkinElmer, Waltham, MA, USA). The chl and carotenoid contents were expressed as mg g−1 fresh weight according to the method of H.K. Lichtenthaler [27].
2.7. Relative Water Content (RWC)
The relative water content was calculated on the basis of the fresh and dry weight of the leaves according to the method of Vivekanandan [28] using the equation RWC = [(FW − DW)/(TW − DW)] × 100%, where FW is the fresh leaf weight, DW is the dry weight, and TW is the turgid weight.
2.8. Organic Osmolytes
Three main types of organic osmolytes were analyzed: soluble sugars, soluble proteins, and proline. The soluble sugar content was quantified according to the method of Magné et al. [29]. Samples (0.1 g) were mixed with 10 mL of deionized water and incubated in water for 30 min at 100 °C, and then the extracts were cooled and filtered into a 25-mL volumetric flask filled with distilled water. One-half millilitre of supernatant was mixed with 1.5 mL of distilled water, 0.5 mL of anthrone-ethyl acetate, and 5 mL of 98% sulfuric acid. The tube was thoroughly shaken with an oscillator and immediately placed into boiling water for 1 min. After cooling, the absorbance of the supernatant was measured at 630 nm. The value for the soluble sugars was input into a glucose standard curve to identify the appropriate content.
To determine the soluble protein, samples were homogenized in phosphate buffer solution (pH 7.8) at 4 °C after centrifugation at 9000 rpm for 20 min, and the supernatant was used to determine the soluble protein. Supernatant and a volume of 0.1 mL was mixed with 5 mL of Coomassie brilliant blue G-250 solution. The absorbance of the supernatant was measured at 595 nm after 5 min. The leaf soluble protein was determined according to the method of Bradford [30]. Bovine serum albumin (BSA) was used to generate the standard curve.
Free proline was determined according to the method of Steinert et al. [31]: Extracts were prepared in 3% sulfosalicylic acid solution and then centrifuged at 4000 rpm at 4 °C for 20 min. The supernatant was mixed with acetic acid and acid ninhydrin and incubated in water for 1 h at 100 °C. The absorbance of the organic phase was measured at 520 nm. Proline was used to generate a standard curve. The proline content was calculated in mg g−1.
2.9. Measurements of the Na+, Cl−, K+, Ca2+, and Mg2+ Contents of Different Organs
All plants were harvested at the end of the experiment. The contents of sodium (Na+), chloride (Cl−), potassium (K+), calcium (Ca2+), and magnesium (Mg2+) were determined in the roots, stems, and leaves. The different tissues of the samples were dried at 85 °C for 48 h and weighed. Then, the dried samples were digested with a mixture of HNO3 acid and HClO4 acid (5:1 v:v). The Na+, Cl−, K+, Ca2+, and Mg2+ ion concentrations in the digested samples were measured using a plasma emission spectrometer (OPTIMA PE-4300DV, Waltham, MA, USA).
2.10. Malondialdehyde Concentration (MDA) and Cell Membrane Stability
An enzyme solution was prepared: 0.3 g leaves were ground at 4 °C in a mortar in 6 mL of a pH 7.8 phosphate buffer solution. The supernatants were collected from the homogenate after centrifugation at 9000 rpm at 4 °C for 20 min. The MDA content was quantified according to the method described by Hodges et al. [32]. Two millilitres of the enzyme solution was mixed with 3 mL of 0.5% thiobarbituric acid (TBA) and 8% trichloroacetic acid (TCA), which was then incubated at 100 °C for 20 min. After cooling the extracts on ice and centrifugation at 9000 rpm for 30 min at 4 °C, the absorbance of the supernatant was measured at 532 and 600 nm.
Cell membrane stability was expressed as the relative electrolytic conductivity (REC). Fresh leaves were cleaned with deionized water and cut into segments and incubated in hermetic tubes containing 20 mL of deionized water for 6 h at room temperature. The first electrical conductivity (EC1) of the leaf solution was determined with a conductivity meter (DDS-307, Shanghai, China). Then, the maximum conductivity (EC2) was obtained by placing the tubes containing leaf samples in water at 100 °C for 20 min to release all electrolytes. Leaf electrolyte leakage was calculated as follows: REC = (EC1/EC2) × 100%, according to Dionisio-Sese and Tobita [33].
2.11. Antioxidant Enzyme Activities
The activity of superoxide dismutase (SOD), peroxidase (POD), ascorbate peroxidase (APX), and glutathione reductase (GR) were determined in C. turczaninowii leaf extracts. Frozen leaves (0.3 g) were ground in liquid N2 using a mortar with 6 mL of phosphate buffer solution (pH 7.8). After centrifugation at 9000 rpm at 4 °C for 20 min, the supernatant was collected as the enzyme extract for measurements. Enzyme activities were assayed using a spectrophotometer.
The SOD activity was assayed according to Beyer et al. [34]. The reaction mixture contained 0.1 mL of enzyme solution, 1.5 mL of sodium phosphate buffer, 0.3 mL of 130 mM methionine, 0.3 mL of 20 μM riboflavin, 0.3 mL of 100 μM EDTA, 0.3 mL of 750 μM nitroblue tetrazolium (NBT), and 0.5 mL of distilled water. The reaction was started by exposing the mixture to white fluorescent light for 15 min. The reaction was stopped by turning the light off. Reduced NBT was measured at 560 nm, and one unit of SOD activity was defined as the amount of enzyme causing 50% inhibition of NBT reduction per min under the assay conditions.
The POD activity in the enzyme extracts was assayed by the method of Civello et al. [35]. The reaction mixtures contained 1 mL of enzyme solution, 3.8 mL of 0.3% guaiacol reaction solution, and 0.1 mL of 3% H2O2. The increase in absorbance was recorded at 470 nm three times per min.
APX activity was monitoring at the decrease in absorbance at 290 nm according to Nakano et al. [36]. The reaction system contained 1.8 mL of 50 mM phosphate buffer (pH 7.0), 0.1 mL of 5 mM ascorbate (ASA), 1 mL of 30 mM H2O2, and 0.1 mL enzyme extracts. H2O2 was added to start the reaction.
The method of Fengwang Ma [37] was used for GR assays by monitoring the decrease in absorbance at 340 nm. The reaction system contained 0.1 mL of 1 mM NADPH, 2.7 mL of 0.1 mM phosphate buffer (pH 7.8), 0.1 mL of 5 mM GSSG, and 0.1 mL enzyme extracts. The reaction was initiated by adding NADPH.
2.12. Statistical Analysis
All the results are presented as the means ± standard deviation (S.D., n = 3). One-way analysis of variance (ANOVA) followed by Tukey’s multiple comparison test at the 5% probability level were performed with the SPSS statistical package version 22.0 (IBM Corp., Armonk, NY, USA).
3. Results
3.1. Plant Growth
Salinity stress inhibited the growth of C. turczaninowii seedlings, as shown by the reduction of growth parameters in the stressed plants compared to the control plants (Table 1). ANOVA results showed that salinity treatments had significant effects on growth parameters (p < 0.05). The effect of the salinity treatments on the plant survival rate was significant at high salinities (68–85 mM); more than 55% of the plants died after being subjected to 85 mM salinity stress after 42 days. The reductions in stem, root, and leaf growth compared to the control plants became more pronounced with an increase in the salinity levels. The root/shoot ratio of the treatment group was significantly higher than that of the control group under 51–68 mM NaCl.

Table 1.
Effects of various salinities on the survival rate, stem length increase, diameter increase, stem biomass, taproot length, root biomass, root/shoot ratio, leaf area, leaf biomass and total biomass of Carpinus turczaninowii L. after 42 days.
3.2. Photosynthesis, Chlorophyll Fluorescence, and Stomatal Behavior
ANOVA results indicated that photosynthesis, chlorophyll fluorescence parameters of C. turczaninowii differed among salinity treatments (p < 0.05). The Pn, Gs, and WUEi decreased with increasing salt concentration after 42 days of growth, while the Ci increased with increasing salinity (Table 2). There was a significant difference in the Pn between the 51–85 mM treatments and the control, especially under 85 mM NaCl, with the Pn reduced by 84.00% compared to that of the control. A significant decrease in the Tr occurred in the plants treated with high (68–85 mM) salinity. We found that 51–85 mM NaCl had the most pronounced effect on the Gs, Ci, and WUEi. The Ci increased by 47.17% compared to that in the control treatment under 85 mM salinity. Salinity stress did not negatively influence the chlorophyll fluorescence parameters, including the ΦPSII, Fv/Fm, qP, and ETR, at NaCl concentrations less than 85 mM. These chlorophyll fluorescence parameters were lower than those in the control under high salinity stress, except for the NPQ, which increased with the salt concentration and reached a maximum at 85 mM, 1.75 times that of the control.
Table 2.
Effects of various salinities on photosynthesis and chlorophyll fluorescence parameters in C. turczaninowii after 42 days. Pn, net photosynthetic rate; Tr, transpiration rate; Gs, stomatal conductance; Ci, intercellular CO2 concentration; WUEi, water use efficiency; ΦPSII, photochemical quantum efficiency; Fv/Fm, maximum quantum yield of photosystem II; qP, photochemical quenching parameter; ETR, electron transfer rate; NPQ, non-photochemical quenching parameter.
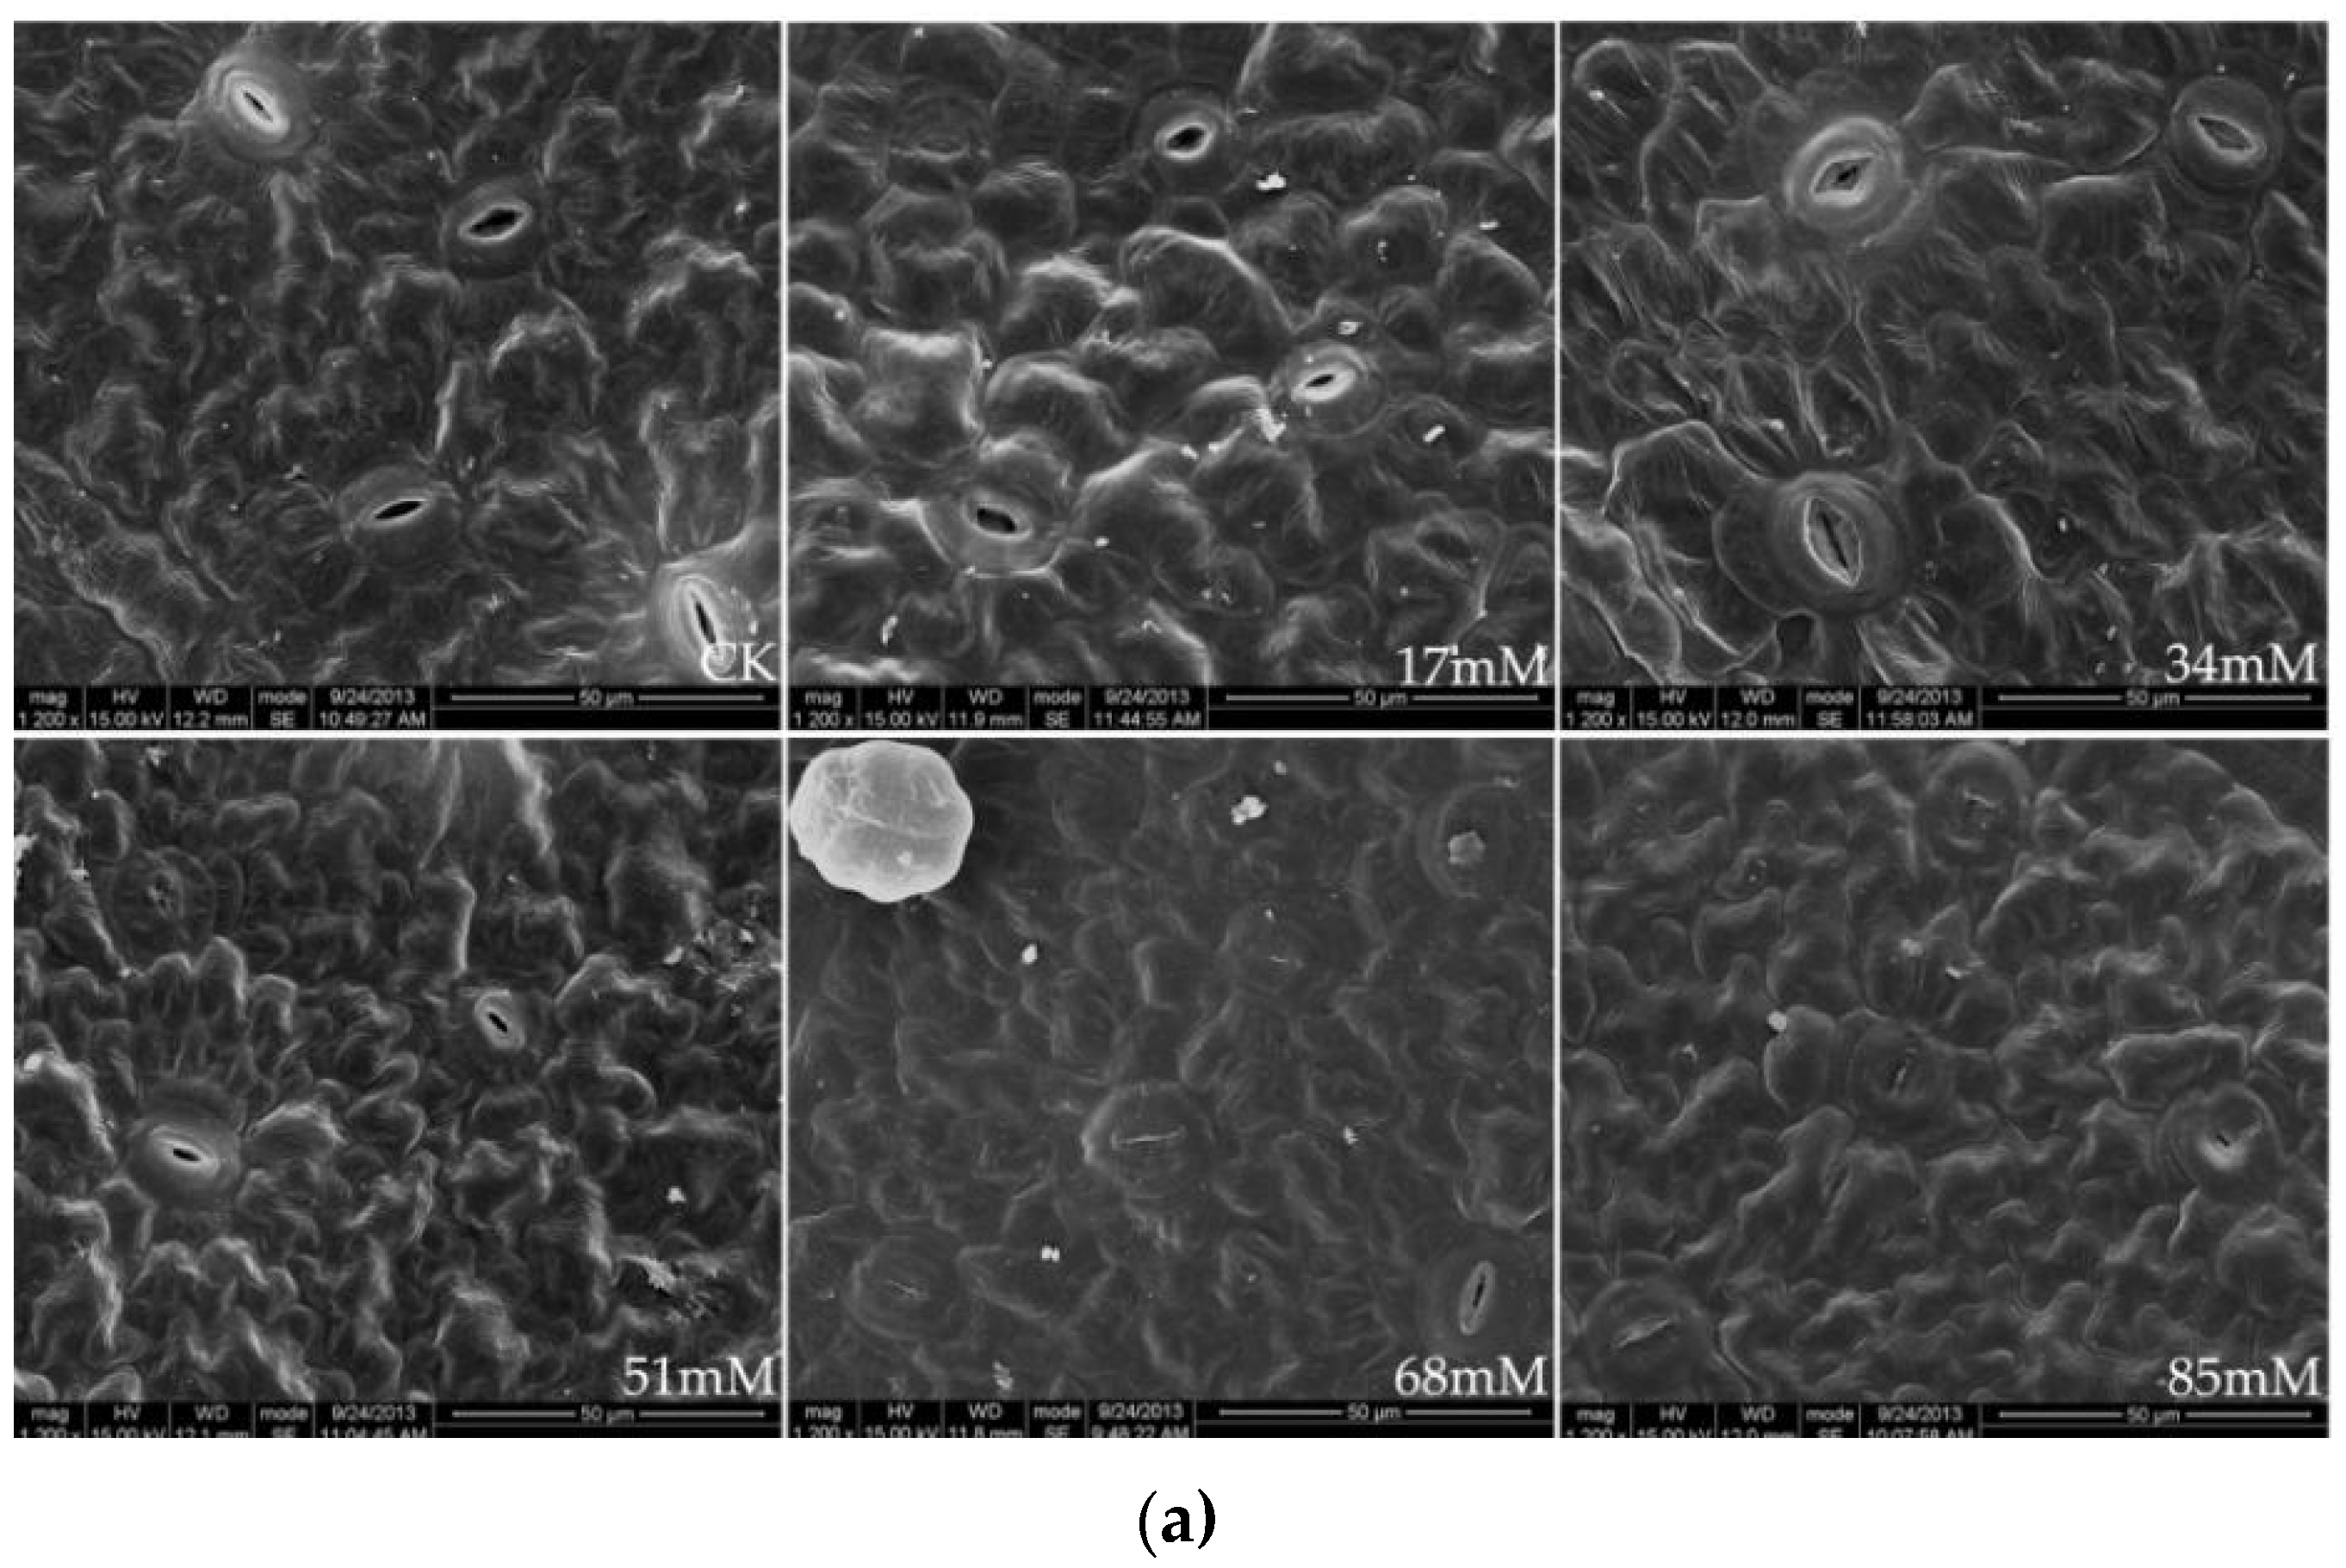
The stomatal density and size as a function of the soil salinity levels are shown in Table 3 and Figure 1a. At 17–51 mM salinity, the stomatal density of the C. turczaninowii leaves was not significantly different from that in the control but was pronounced under high (68–85 mM) salinity stress. Salinity levels of 51–85 mM caused a significant reduction in stomatal length and stomatal width, leading to smaller stomatal sizes. Finally, the stomata was nearly closed under high salinity (68–85 mM) treatments, with the guard cells becoming gradually deformed, and the epidermal tissue shrank.
Table 3.
Effects of various salinities on the leaf stomatal density, stomatal length, stomatal width, leaf thickness, palisade tissue thickness, and palisade tissue thickness/leaf thickness of Carpinus turczaninowii L. after 42 days.
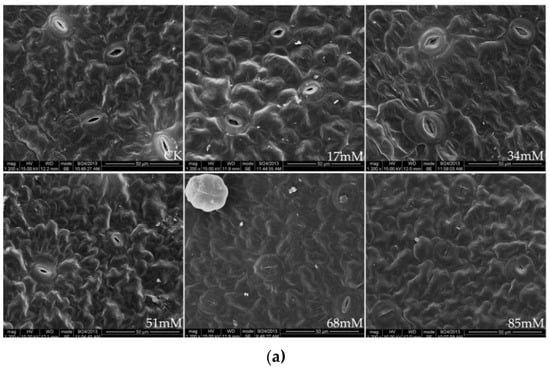

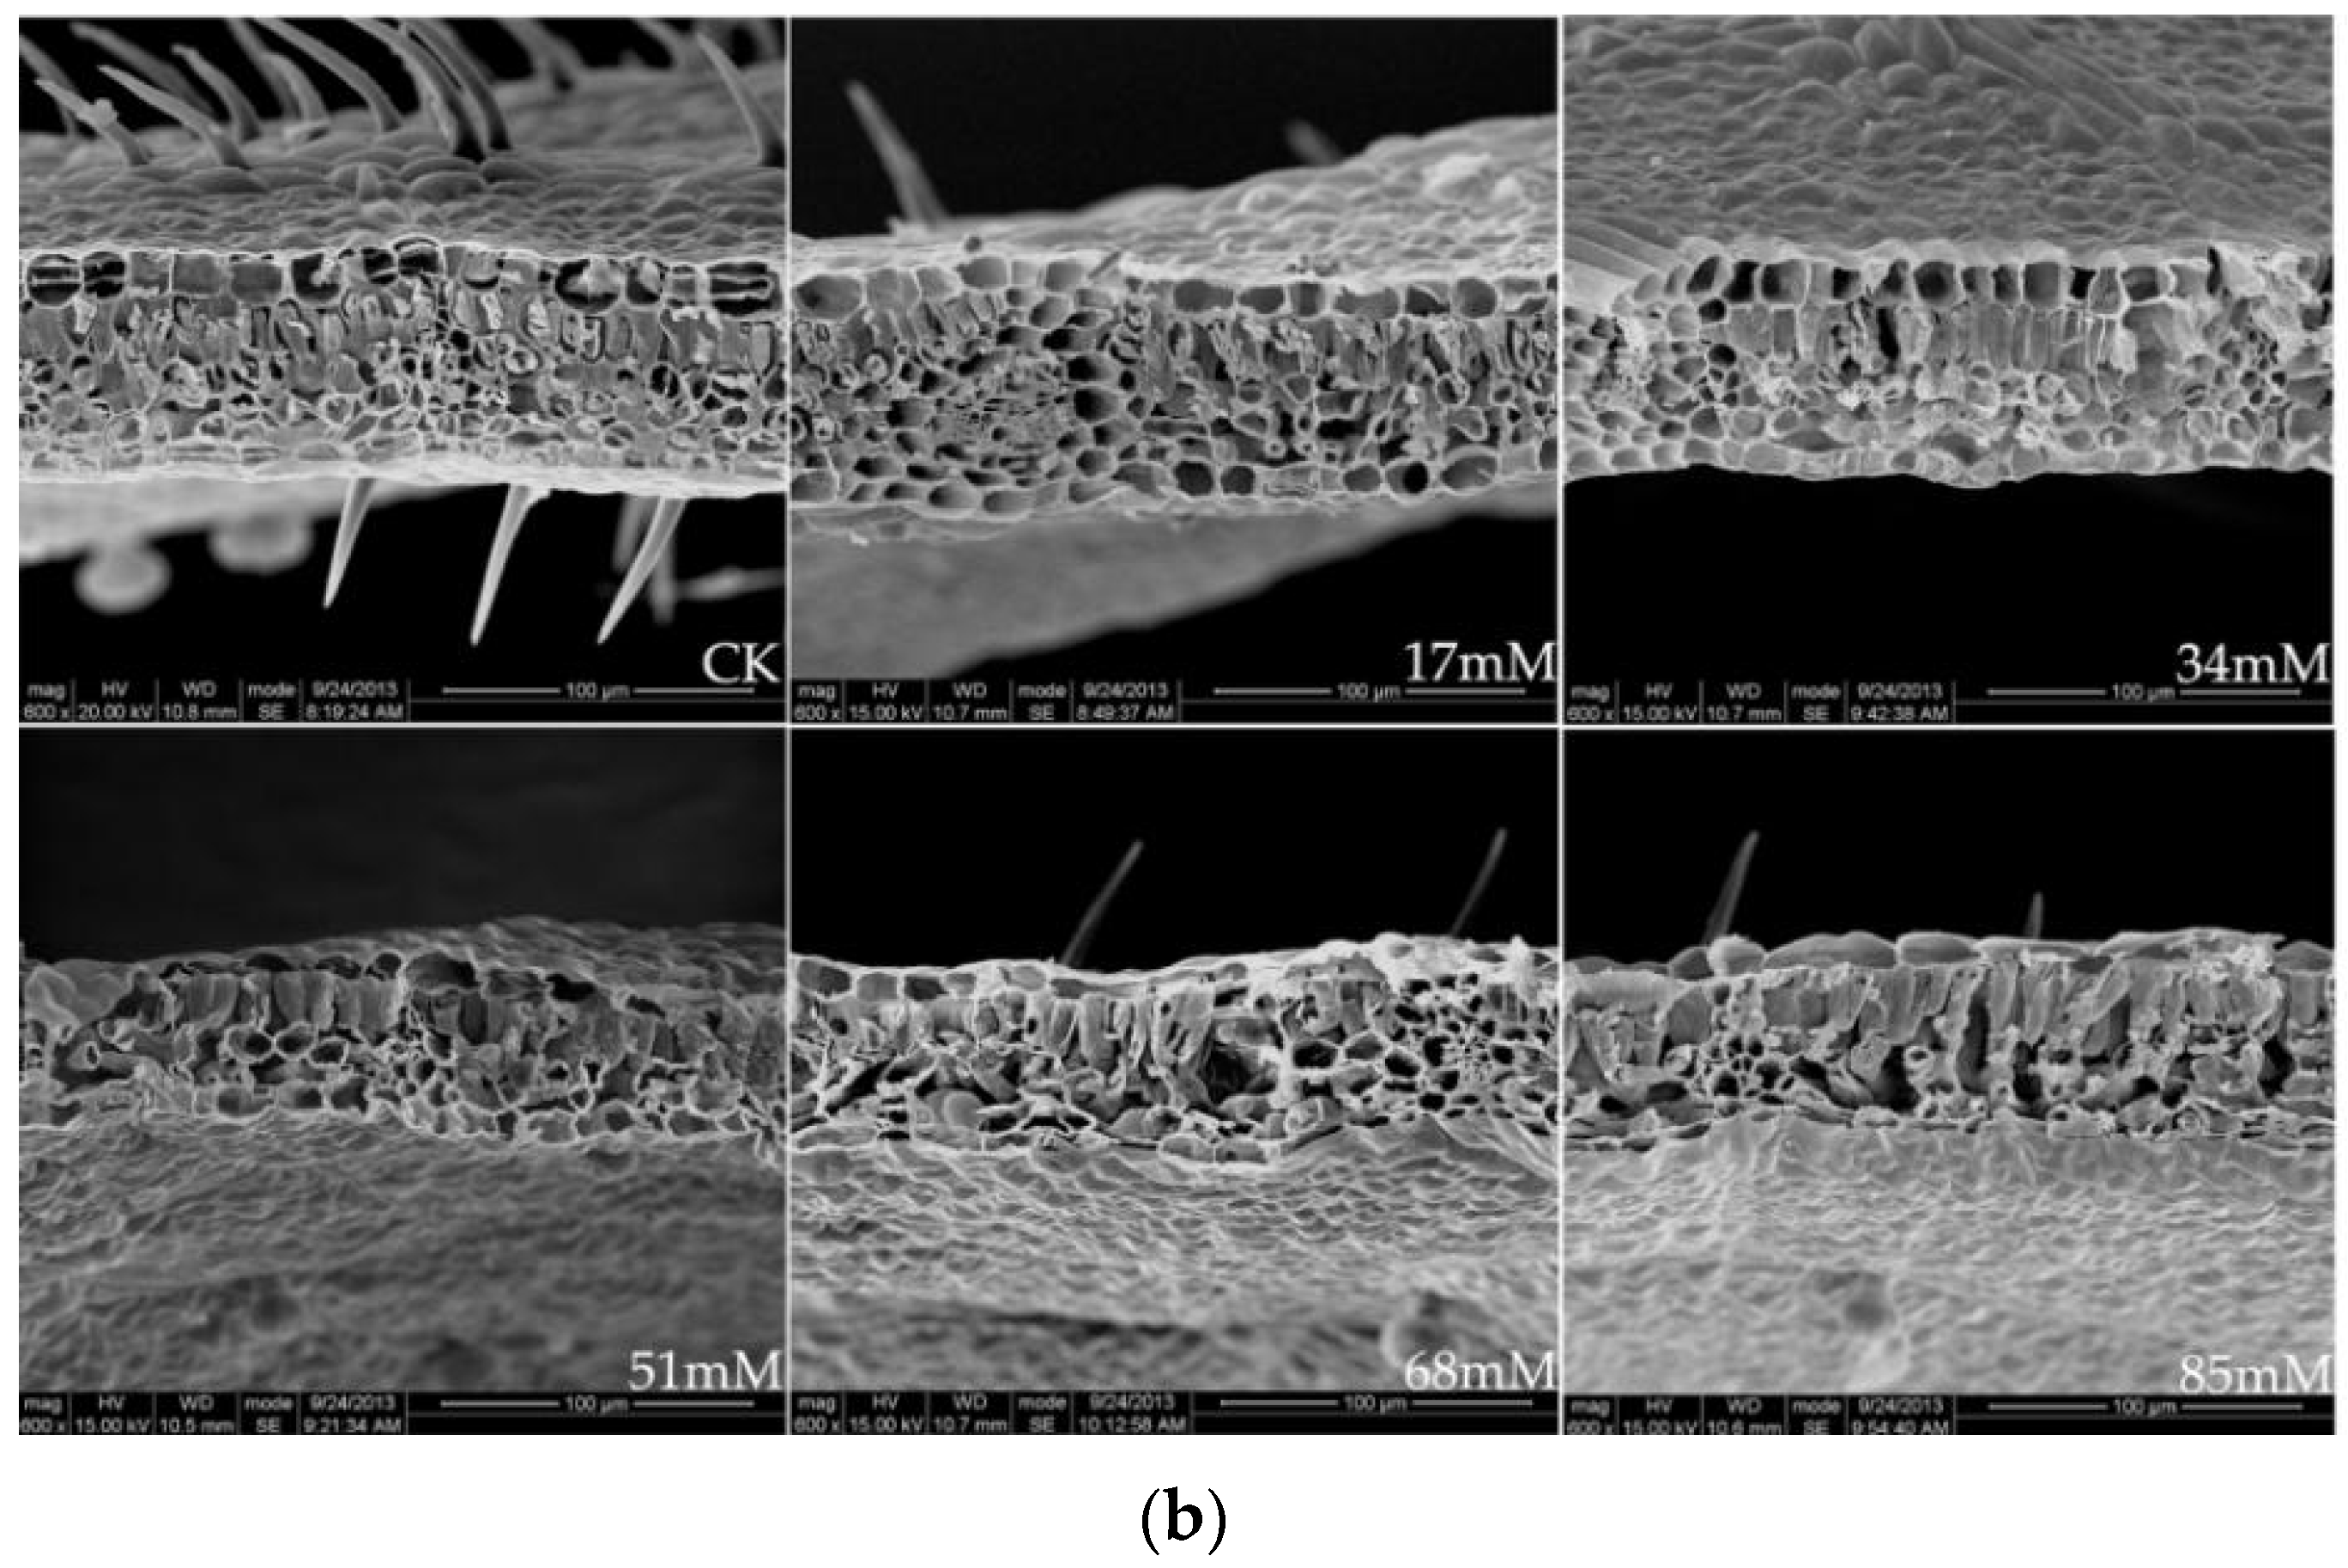
Figure 1.
Stomatal structure on the leaf surface (a), ×1200, and leaf cross-section (b), ×600, of C. turczaninowii under salinity treatments.
The leaf thickness was higher than that in the control at low salinities (17–34 mM) but decreased significantly at 84 mM NaCl (Table 3). The palisade tissue thickness and palisade tissue thickness/leaf thickness of the C. turczaninowii leaves were noticeably higher than those in the control treatment at 51–85 mM salinity. Figure 1b shows a typical scanning electron micrograph of a C. turczaninowii leaf, including the upper and lower epidermis, epidermal hairs, and palisade and spongy tissues, which were densely arranged. However, the leaf cross-section characteristics were significantly different from those in the control under the high salinity treatments (68–85 mM), and the palisade and spongy tissues were loosely arranged. The spaces between the tissues became larger, and some of the tissues degraded.
3.3. Photosynthetic Pigments
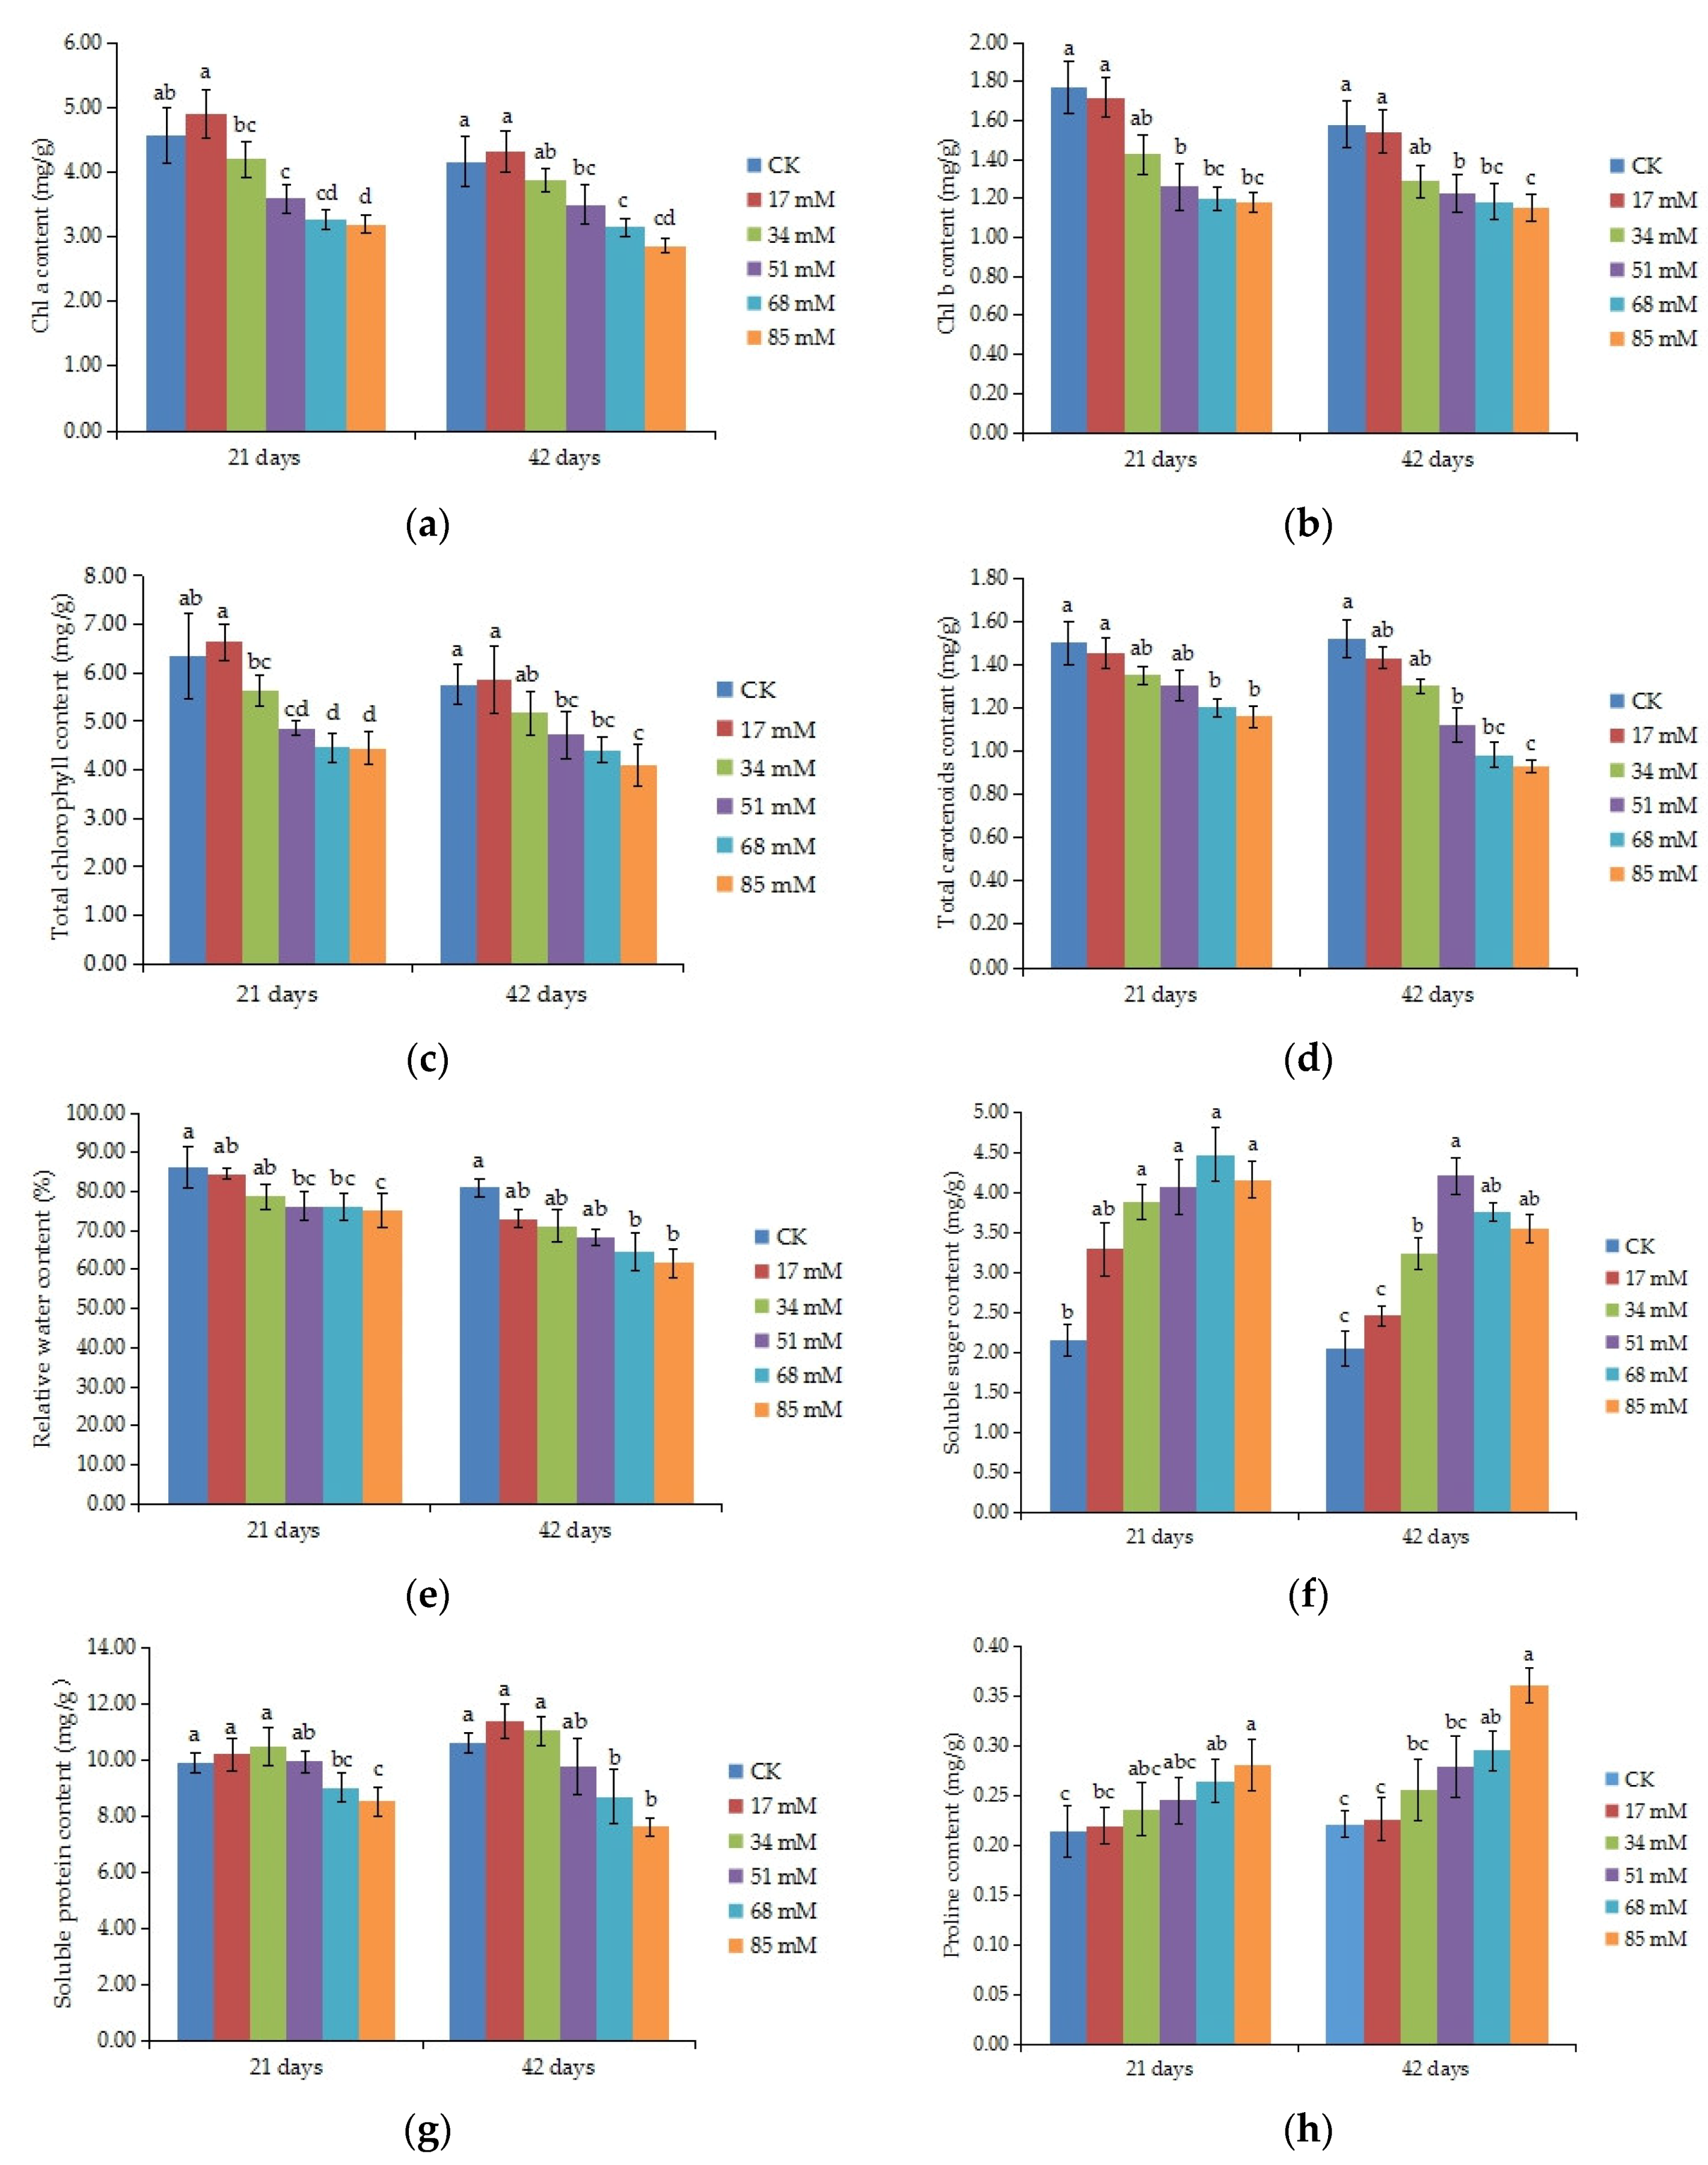
The results showed that the contents of photosynthetic pigments (chl a and b, total chlorophyll, and carotenoids) in C. turczaninowii plants decreased when the plants were subjected to salinity (p < 0.05), and the differences between the control and 51–85 mM salinity treatments were significant after 42 days of growth (Figure 2a–d). At a concentration of 85 mM NaCl, the total chlorophyll content was reduced by 28.92% after 42 days of growth.
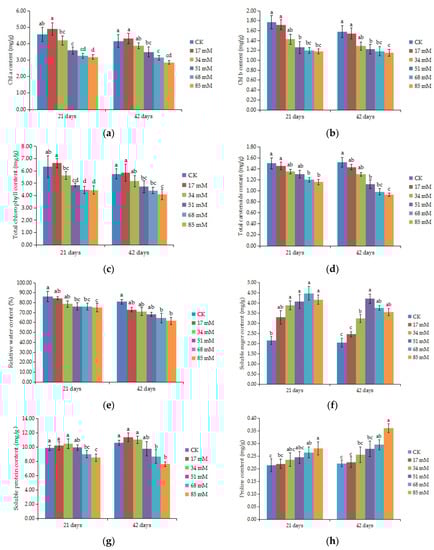
Figure 2.
Effect of increasing levels of soil salinity on the content of chlorophyll a (a), chlorophyll b (b), total chlorophyll (c), and total carotenoids (d), relative water content (e), soluble sugars (f), soluble proteins (g), and proline content (h) in leaves of C. turczaninowii plants grown for 21 and 42 days. Different lowercase letters indicate significant differences among treatments (p < 0.05), n = 3.
3.4. Relative Water Content (RWC)
The relative water content of the C. turczaninowii leaves decreased with increasing salinity concentrations (Figure 2e). There was no difference of the RWC between the low salt stress treatment (17 mM) and the control plants, while a significant decrease was observed in the 68–85 mM salt treatments after 42 days (p < 0.05), with the RWC decreasing by 20.36% and 23.88%, respectively.
3.5. Organic Osmolytes
ANOVA results indicated that salinity treatments had significant effects on the organic solutes of C. turczaninowii seedlings (p < 0.05). With the increase in salinity stress, the soluble sugar content showed a tendency of first increasing and then falling, with a significant change in leaves in the 34~85 mM salinity treatments after 21 and 42 days of growth. After 42 days of growth, the soluble sugar content reached a maximum when the salt concentration was 51 mM, with a value of more than double of that in the control plants (Figure 2f). The soluble protein content did not change significantly under the slight (17–34 mM) and moderate (51 mM) salinity treatments, but a great reduction in soluble protein content was found in the high (68–85 mM) salinity treatments (Figure 2g). Proline is a type of amino acid that is easily accumulated under osmotic stress. The proline content of C. turczaninowii seedlings gradually increased with increasing salt concentration after 21 and 42 days of growth and was significantly higher than that of the control plants in the high (68–85 mM) salinity treatments (Figure 2h).
3.6. Inorganic Ion Content of Various Organs
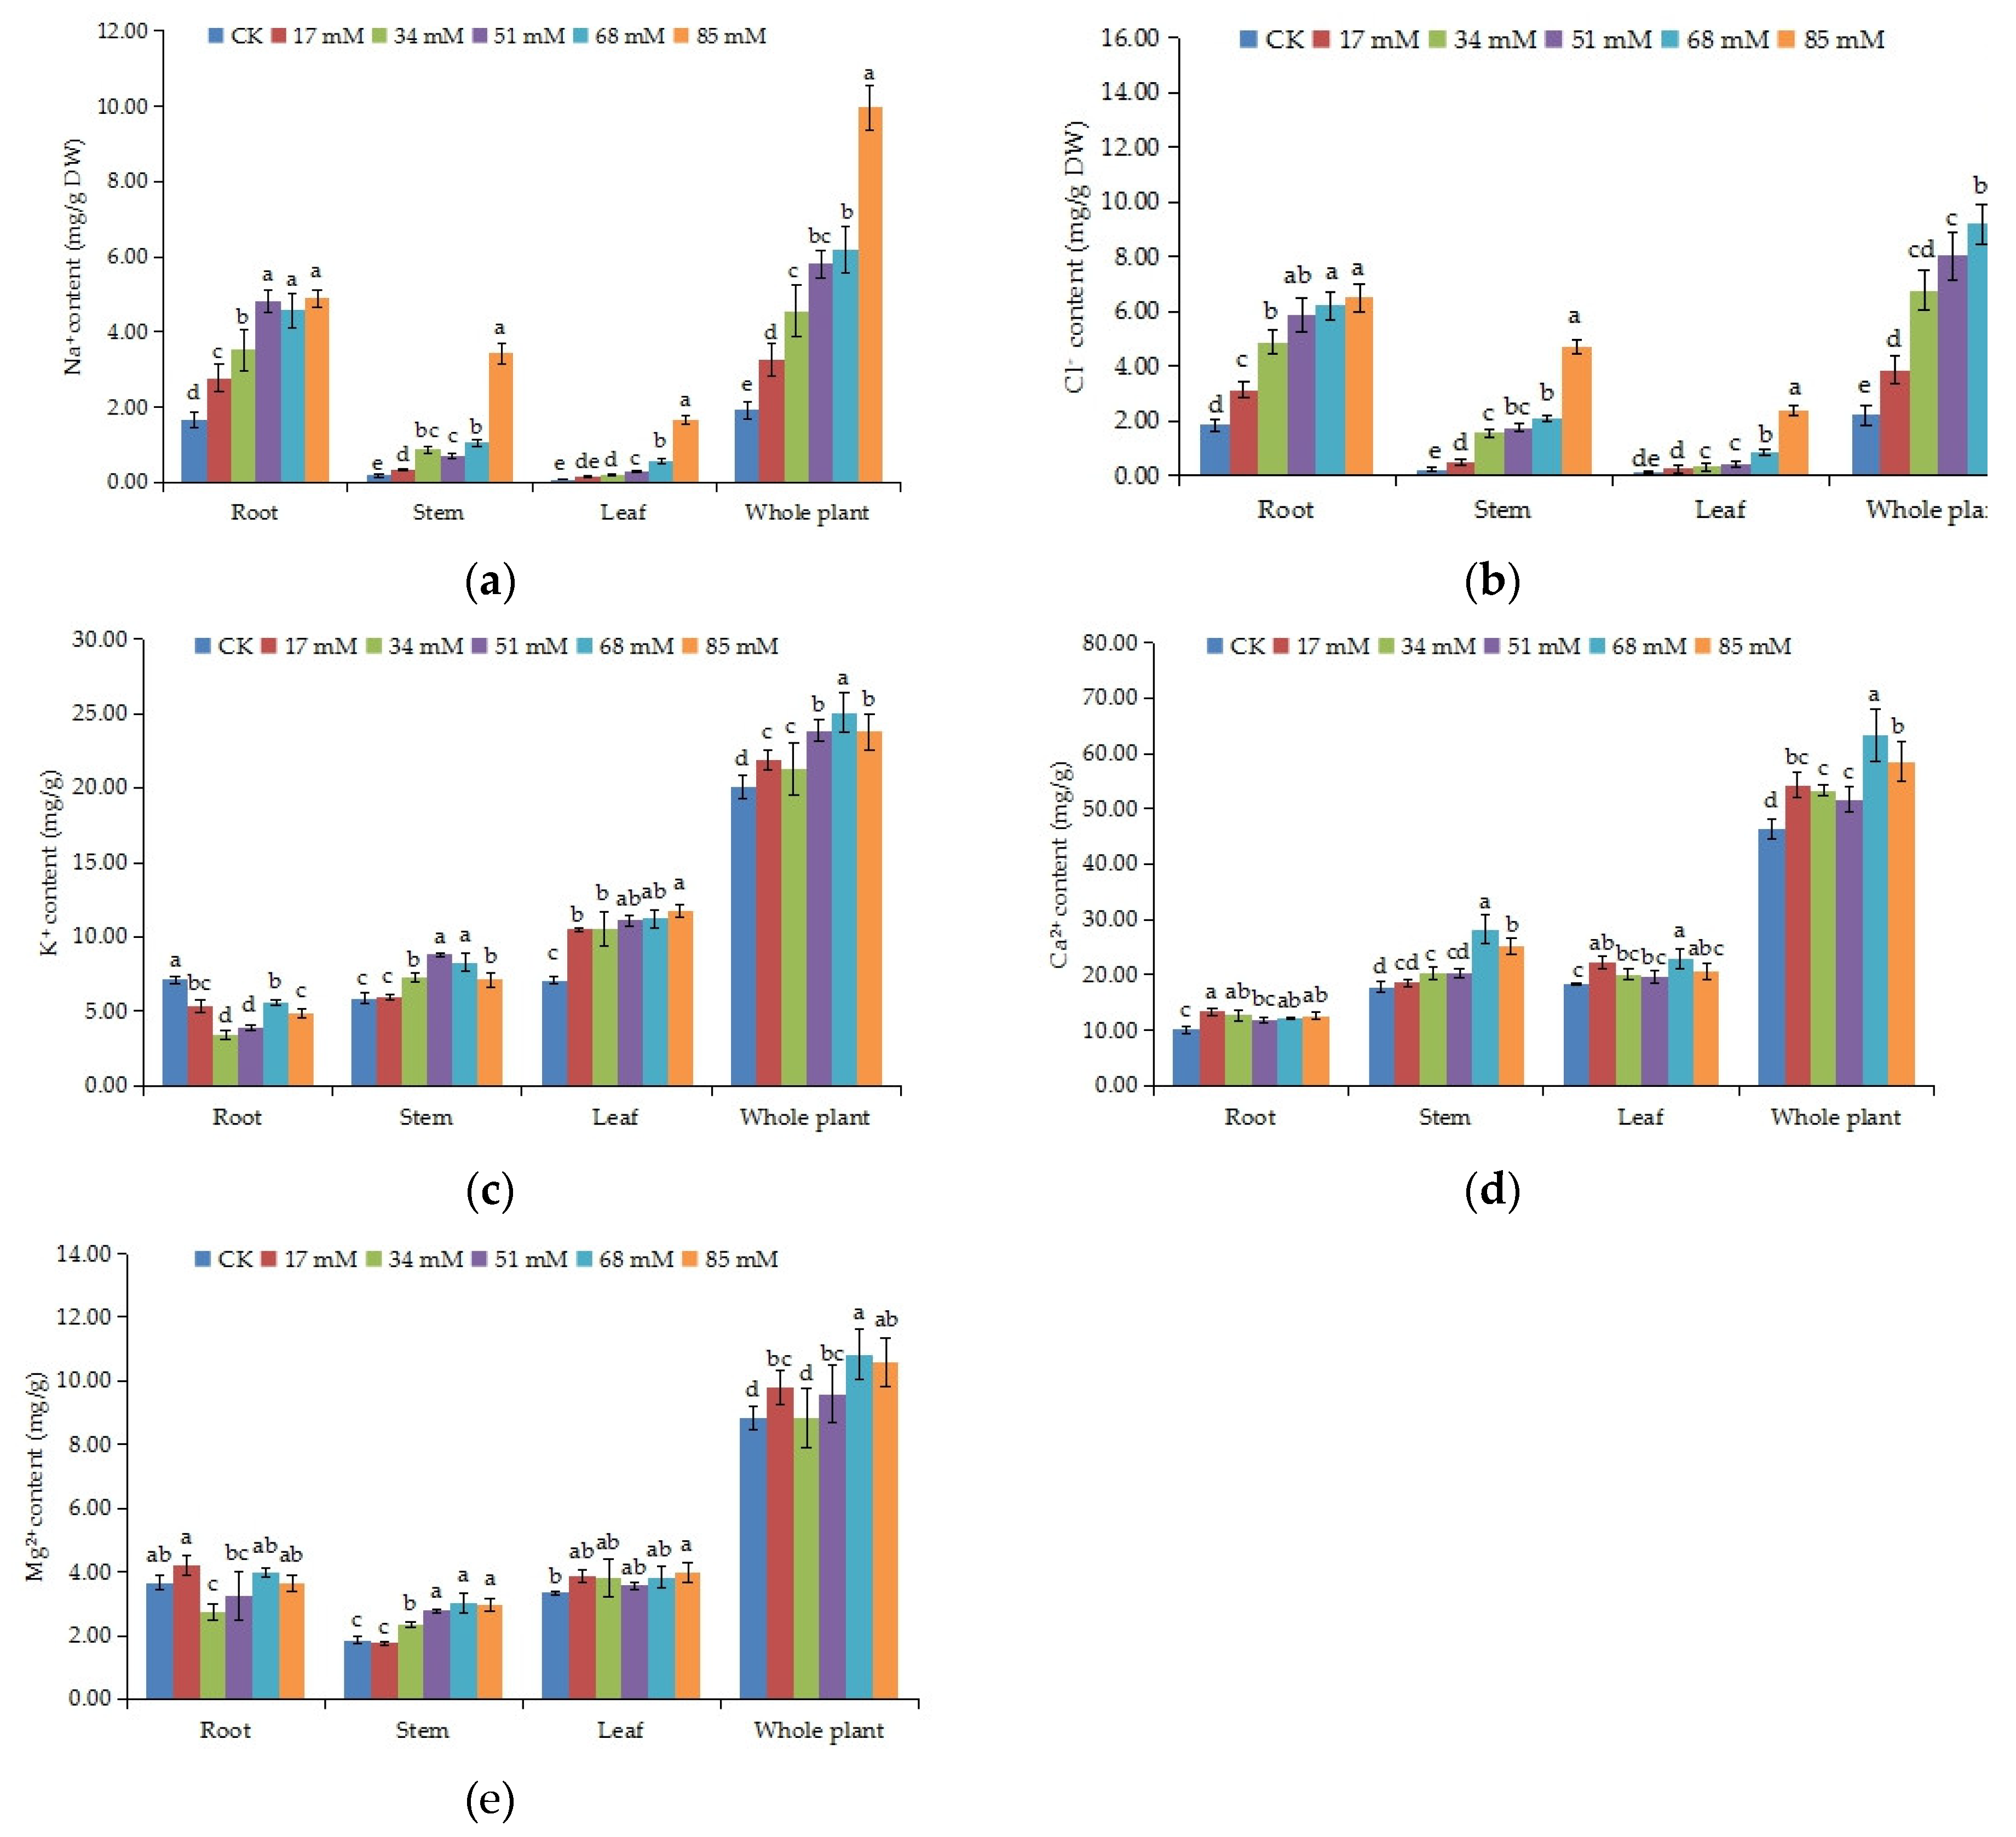
The changes in ionic contents in C. turczaninowii seedlings are shown in Figure 3a–e. The Na+ and Cl− content of the root, stem, leaf, and the whole plant prominently increased with the salinity levels (p < 0.05), and mainly accumulated in the root and then in the stem (Figure 3a,b). In 85 mM NaCl treatment, the Na+ content in the stem and leaf increased remarkably, 19.06 and 20.63 times, respectively, compared to that in the control group, and Cl− content also reached a maximum value in this salt concentration. The K+ content increased in the stem and leaf but decreased in the root and mostly accumulated in the leaf, followed by the stem (Figure 3c). In the whole plant, the K+ ion content in the treatment groups was higher than that in the control (p < 0.05). The Ca2+ content remained high in the stem and leaf (Figure 3d). The differences in the Ca2+ content in the root among the various salinity treatments were not obvious, but the Ca2+ contents were all higher than that in the control. Under high salinity stress (68–85 mM), the Ca2+ content increased by 24.68% and 18.29%, respectively, in the whole plant. Differences in the Mg2+ content in the different tissues of C. turczaninowii seedlings were not obvious (Figure 3e). In the stem, the Mg2+ content in the 34–85 mM treatments was noticeably higher than that in the control group, and in the whole plant, little change was found in the 34 mM salinity stress treatment.

Figure 3.
Effects of increasing levels of soil salinity on the Na+ (a), Cl− (b), K+ (c), Ca2+ (d) and Mg2+ (e) content in root, stem, leaf, and whole plant of C. turczaninowii seedlings after 42 days. Different lowercase letters indicate significant differences among treatments (p < 0.05), n = 3.
The K/Na, Mg/Na, and Ca/Na ratios in the C. turczaninowii seedlings under salinity treatments are shown in Table 4. It was found that all ion ratios significantly decreased under salinity stress in different tissues. In addition, the ion ratios in the aboveground parts (stem and leaf) were higher than the underground part (root), and the Ca/Na ratio was higher than the K/Na and Mg/Na ratios. These results indicate that the ability of C. turczaninowii to absorb Na+ ions increased under salinity stress, and the absorption of K+, Ca2+, and Mg2+ by the leaves was higher than other tissues.
Table 4.
Effects of various salinities on the K/Na, Ca/Na, and Mg/Na ratios in the root, stem, leaf, and whole plant of C. turczaninowii seedlings after 42 days.
3.7. Malondialdehyde Content (MDA) and Cell Membrane Stability
The MDA content can be used to measure the damage to the leaf cell membrane. The MDA content of C. turczaninowii continued to increase with the salinity concentration (Figure 4a). After 21 days, MDA content was not affected under the low salinity (17–34 mM) treatments, but 51–85 mM NaCl had a prominent effect on the MDA content (p < 0.05). After 42 days, the MDA content increased by 35.60% and 45.74% in the 68 mM and 85 mM salinity treatments, respectively, compared to the control. The relative electrolytic conductivity is an index of cell membrane stability. As shown in Figure 4b, the relative electrolytic conductivity increased with salinity levels and was noticeably higher among the treatment and control groups after 42 days of growth (p < 0.05). These results indicated that salt stress caused damage to the membranes of C. turczaninowii seedlings and that the damage was more serious at high concentrations.
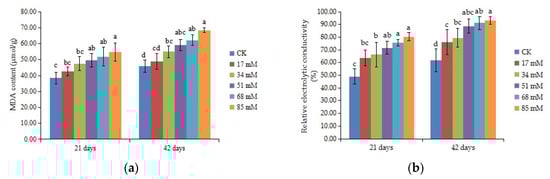
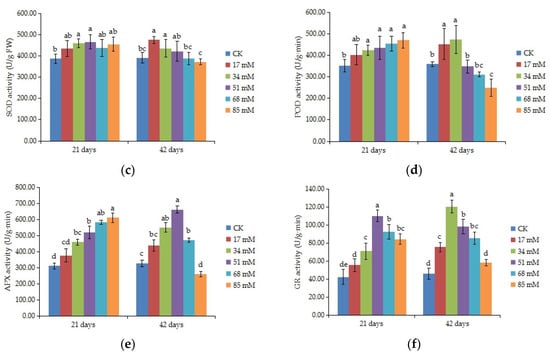
Figure 4.
Effects of increasing levels of soil salinity on the MDA content (a), cell membrane stability (b), SOD activity (c), POD activity (d), APX (e), and GR (f) in leaves of C. turczaninowii grown for 21 and 42 days. Different lowercase letters indicate significant differences among treatments (p < 0.05), n = 3.
3.8. Antioxidant Enzyme Activities
ANOVA results indicated that antioxidant enzyme activities differed among salinity treatments (p < 0.05). The SOD and GR activities of C. turczaninowii leaves first increased then decreased with the level of salt stress (Figure 4c,f). The SOD activity was significantly higher than that in the control at 34–51 mM NaCl after 21 days. After 42 days, the SOD activity reached a maximum value of 475.17 U/g at 17 mM, increasing by 21.81% compared to the control, and little change was found at 51–85 mM NaCl. Salt treatments caused significant increase in the activity of GR after 21 days, and a maximum value was found at 34 mM after 42 days. The POD and APX activities increased as the results of the salinity treatments after 21 days, and the differences were remarkable at 34~85 mM salinity (Figure 4d,e). However, after 42 days, the POD activity was obviously higher than that in the control at low salinity (17–34 mM) and decreased at high salinity (85 mM), being only 69.15% that of the control, and APX actvity was significant higher than the control at 34–68 mM salinity, also decreased at 85 mM NaCl.
4. Discussion
The present study provides valuable information about C. turczaninowii traits that may affect seedling survivorship and growth under salt stress in nursery conditions. Salinity stress induced depressive effects on all the examined parameters, including the changes in survival rate, the production parameters, the morphological and physiological parameters. This research was the first attempt to look for the salt tolerance of C. turczaninowii seedlings, and confirm that salinity is one of the major abiotic stresses limiting the growth and productivity of this species.
4.1. Seedling Growth
Salinity affects plants in many different ways, the most obvious being a decrease in growth, which may be related to a reduction in water uptake, photosynthetic activity, and other affected physiological pathways [38]. Our results show that salinities over 68 mM inhibited the growth of C. turczaninowii seedlings, including the survival rate, stem length and diameter increase, taproot length, biomass, and leaf area. Many studies have also described similar responses of plants to high salinity, a decrease in leaf area or root and stem length, and a change in the root/shoot ratio was also observed in oak (Quercus robur L.) seedlings [39]. Mulberry (Morus alba L.) seedlings suffered great reductions in root, shoot, and leaf growth under various levels of NaCl stress [40]. These results confirm that salinity is one of the major environmental factors that restricts the growth and productivity of plants. As expected, salinity caused a significant reduction in leaf area at 68~85 mM NaCl, which may have been caused by the inhibition of cell expansion after salt stress [41]. The same phenomenon was observed for stomatal behavior; the stomatal density and stomatal size of C. turczaninowii leaves were pronounced decreased under high salinity stress, with nearly closed stomata. Stomata in the epidermis of the leaf provide an important channel that allows plants to exchange materials such as CO2 and H2O with the external environment. Salinity stress can cause the close of stomata, the decrease of stomatal size and leaf thickness, and the atrophy of leaf tissues [42]. In our previous study on Carpinus betulus L. [43], we found the stomata, palisade, and spongy parenchyma tissues were seriously influenced over 51 mM NaCl, worse than C. turczaninowii. These changes in leaf morphology can adversely affect photosynthesis in plants. Under salinity stress, plants often face water deficiencies, which will lose water, wither, and even die. The RWC of the leaves decreased with increasing salinity levels and reached a minimum value at 85 mM NaCl after 42 days. This occurs by a reduction in the external water potential due to high salt concentrations in the solution of the soil and its accumulation in the extracellular region of the plants. Under 0–240 mM NaCl, the RWC in Phoenix dactylifera L. also significantly declined [44]. Alterations to the water content of plants may induce reductions in the photosynthetic rate and the growth of seedlings. According to Tuteja [45], salt sensitive plants cannot grow at 100 mM NaCl or above, and are called glycophytes, we believed that C. turczaninowii was a kind of salt sensitive plants.
4.2. Physiological Parameters
High salinity is associated hyperosmotic stress, inducing secondary effects or pathologies and ion toxicity [46]. The mechanism of photosynthesis response to salt stress is complex, including the influence of photochemistry, CO2 diffusion, and the activities of enzymes involved in photosynthesis. In our study, the leaf gas exchange and chlorophyll fluorescence parameters were restricted with increasing levels of salinity in C. turczaninowii leaves. The Pn, Tr, Gs, and WUEi under 51~85 mM salinity were lower than those in the control, while the Ci increased with the salt concentration. Similar behaviors were reported in Pistacia lentiscus and Salsola inermis, with reductions in stomatal conductance and the net photosynthetic rate [47]. Stomatal behavior was adversely affected under salinity stress, which inhibited the transpiration and photosynthetic rates of the plants. The chlorophyll fluorescence parameters, including the ΦPSII, Fv/Fm, qP, and ETR, were negatively influenced at 85 mM NaCl concentration, and were lower than those in the control. The NPQ increased with salt stress, which may be a mechanism to protect the photosystems from the damage caused by photoinhibition under high salt stress [48]. A reduction of photosynthetic pigments contents in the leaves of plants is also a general response to salinity stress. In this study, the photosynthetic pigments contents of C. turczaninowii were not notably reduced at a salinity of 17~34 mM; however, salinities over 51 mM significantly reduced the content of Chl, and carotenoids after 42 days of treatment. This is consistent with previous reports on European Larch [49], Phragmites australis and Spartina alterniflora [50]. The photosynthetic apparatus of the plants was likely impaired and the chloroplast pigments were likely degraded under high salinity stress, thus inhibiting photosynthesis in the seedlings.
Osmotic adjustment is one of the cellular responses for the maintenance of turgor in saline environments to maintain stomatal opening and growth expansion [51]. A high concentration of organic solutes in the leaves of C. turczaninowii was also detected as the salinity levels increased, including the soluble sugar and proline contents, likely because the seedlings produce some organic molecules in response to salinity stress. The high production of these organic solutes decrease the leaf osmotic potential, increase the leaf turgor pressure, and provide additional evidence of osmotic adjustment [52]. According to other studies, salt stress can increase the content of soluble sugars (sucrose, glucose, and fructose) in plant leaves to act as a factor in maintaining turgor and reducing osmotic pressure, as occurs in apples [53]. A large number of studies have verified a positive correlation between the proline content and environmental stress [54], and our results confirm this viewpoint. C. turczaninowii can maintain its leaf osmotic potential and turgor pressure at a normal level when treated with salinities of less than 51 mM, but a significant difference was found in the high (68–85 mM) salinity treatments, indicating insufficient resistance to salt stress. According to Zidan [55], salt stress can promote protein synthesis through the transformation of free amino acids into protein in plants. However, the content of soluble protein in C. turczaninowii was significantly lower than that in the control at high salinity treatments. The same results were found in pear (Pyrus communis), the protein content also decreased with the salinity levels (40–160 mM), which may be due to a reduction in N synthesis, the degradation of protein structure, damage to biosynthesis pathways, and a reduction in the synthesis of protein [56].
4.3. Mineral Content and Uptake
Na+ and Cl− ions are the most destructive elements when plants are exposed to salinity. With respect to Na+ and Cl− content in the C. turczaninowii seedlings, a trend of higher values was observed with increasing salinity levels, confirming the findings obtained by Giuseppe Cristiano in Pistacia lentiscus [57]. A higher content of Na+ was found in the roots under salt treatments in C. turczaninowii seedlings, as well as Cl− content, while K+ mostly accumulated in leaves, suggesting a defence mechanism for sodium toxicity through the compartmentalization of this ion in the roots. This mechanism has already been observed in other plants, such as Salvadora oleoides [58]. Controlling the uptake and transport of Na+ and Cl− ions to the shoot is a defence mechanism used by plants against excessive salt. A similar result was found in maize, the Na+ and Cl− contents were also higher in the root than in the leaf when growing under 34–102 mM NaCl salinity stress [59]. The ability of C. turczaninowii seedlings to maintain adequate selectivity in the uptake of K+ in saline environment is associated with salt tolerance. The uptake of Ca2+ and Mg2+ did not change obviously based on the different levels of salinity, in agreement with findings in olive trees (Olea europaea) [60]. The ion ratios (K/Na, Ca/Na, and Mg/Na) decreased significantly with salinity levels but were higher in the stem and leaf than in the root, which mainly occurred because of the accumulation of Na+ in accordance with the salinity levels in different tissues, especially in the roots. We can see that the capability of maintaining ion homeostasis in C. turczaninowii was limited under high salt stress (68–85 mM), causing a decline in biomass and even plant death. High salt stress can induce both metabolic changes and ion toxicity in plants resulting from ion imbalance with the accumulation of Na+ and a reduction in K+ content [61]. Because K+ is an important activator of many enzymes, a reduction in K+ may inhibit the growth of C. turczaninowii seedlings.
4.4. Oxidative Stress and Antioxidant Mechanisms
MDA is used as a marker for evaluating lipid peroxidation, which increases under saline stress conditions [62]. The relative electrolytic conductivity is usually used as an index for cell membrane stability, which can reflect the extent of lipid peroxidation caused by ROS [63]. In our results, the MDA content and the relative electrolytic conductivity of C. turczaninowii continued to increase with salinity concentration and were noticeably higher than those in the control group under moderate and high salt stress after 42 days, indicating that more lipid peroxidation products were formed due to cell damage under severe salinity stress. The increase in lipid peroxidation may be due to the incapability of antioxidants to scavenge ROS under salt stress. Antioxidant enzymes activities can be induced as a response to salinity stress, which can help alleviate oxidative stress. In our study, the activities of four important antioxidant enzymes first increased then decreased with the degree of stress in C. turczaninowii seedlings at last. At a NaCl concentration over 51 mM, there was a lower efficiency to eliminate ROS from the seedlings due to the imbalance between ROS and antioxidant formation, thus leading to the aggravation of oxidative stress. In Lavandula angustifolia, the same changes were found in SOD and POD activities at 25–100 mM salt concentrations [62]. While in European Larch seedlings, the SOD, APX, and GR activities were remarkable higher than the control at high salt stress (150 mM) [49], the results differed with ours. The increased antioxidant activity of enzymes under low salinity stress conditions suggests that the activation of an efficient free radical scavenging system can minimize the negative effects of peroxidation, thus contributing to the maintenance of membrane stability. However, under moderate and high salt stress, the activity of protective enzymes was limited, causing a negative effect on the survival and growth of the seedlings. Plant tolerance to salinity is correlated with the stimulation of antioxidant enzymes and their enhanced ability to scavenge ROS [64], our research supports these views.
5. Conclusions
This study presents new information on C. turczaninowii seedlings regarding their ecophysiological responses to salinity stress. C. turczaninowii was affected by salinity stress through the inhibition of growth, photosynthetic capacity, and stomatal behavior, the increase in MDA content and relative electrolytic conductivity, and the accumulation of Na+ and Cl− content, suggesting a limited degree of salt tolerance. Our results show that C. turczaninowii seedlings can activate relevant mechanisms to adapt to salinity stress, such as accumulating relatively high concentrations of organic solutes to maintain cellular osmotic balance and improving the activity of antioxidant enzymes and ionic transport capacity from the root to shoots in defence against salinity stress. A reduction in the growth of C. turczaninowii seedlings was observed under high (68~85 mM) NaCl stress. Our study is relevant for a better understanding of the responses of C. turczaninowii to salinity stress and may help in the administration of conservation and reforestation programs for this species. The cultivation of this species as an ornamental tree has the potential to be expanded in areas with low and moderate salinization conditions.
Author Contributions
Q.Z. and Z.Z. conceived and designed the experiments; Q.Z., M.S., and L.X. performed the experiments and analyzed the data; and Q.Z. wrote the paper. All authors read and approved the final paper.
Funding
This research was financially supported by the National Natural Science Foundation of China (no. 31770752), the Jiangsu Science and Technology Support Program (BY2015006-01), the Jiangsu Province Six Big Talent Peak Project (NY-029), the Fifth Stage Funded Research Projects of 333 in Jiangsu Province and the Excellent Doctoral Dissertation of Nanjing Forestry University.
Acknowledgments
We would like to thank Jing Yang, a laboratory specialist at Advanced Analysis Testing Center (AATC), Nanjing Forestry University, China, for assistance with stomatal measurements. We express our gratitude to Feibing Wang, a research assistant at the College of Landscape Architecture, Nanjing Forestry University, China, for her help in the cultivation of the seedlings.
Conflicts of Interest
The authors declare no conflict of interest.
References
- Dobbertin, M. Tree growth as indicator of tree vitality and of tree reaction to environmental stress: A review. Eur. J. For. Res. 2006, 125, 89. [Google Scholar] [CrossRef]
- Amira, M.S.; Abdul, Q. Effect of salt stress on plant growth and metabolism of bean plant Vicia faba (L.). J. Saudi Soc. Agric. Sci. 2011, 10, 7–15. [Google Scholar] [CrossRef]
- Dashti, A.; Khan, A.A.; Collins, J.C. Effects of salinity on growth, ionic relations and solute content of Sorghum Bicolor (L.) Monench. J. Plant Nutr. 2009, 32, 1219–1236. [Google Scholar] [CrossRef]
- Houska, C. Deicing Salt-Recognizing the Corrosion Threat; TMR Consulting: International Molybdenum Association: Pittsburgh, PA, USA, 2007; pp. 1–11. [Google Scholar]
- Cunningham, M.A.; Snyder, E.; Yonkin, D.; Ross, M.; Elsen, T. Accumulation of deicing salts in soils in an urban environment. Urban Ecosyst. 2008, 11, 17–31. [Google Scholar] [CrossRef]
- Lundmark, A.; Olofsson, B. Chloride Deposition and distribution in soils along a deiced highway- assessment using different methods of measurement. Water Air Soil Pollut. 2007, 182, 173–185. [Google Scholar] [CrossRef]
- Kayama, M.; Quoreshi, A.M.; Kitaoka, S.; Kitahashi, Y.; Sakamoto, Y.; Maruyama, Y. Effects of deicing salt on the vitality and health of two spruce species, Picea abies Karst., and Picea glehnii Masters planted along roadsides in northern Japan. Environ. Pollut. 2003, 124, 127–137. [Google Scholar] [CrossRef]
- Randrup, T.B. Differences in salt sensitivity of four deciduous tree species to soil or airborne salt. Physiol. Plant. 2010, 114, 223–230. [Google Scholar] [CrossRef]
- Rozentsvet, O.A.; Nesterov, V.N.; Bogdanova, E.S. Membrane-forming lipids of wild halophytes growing under the conditions of Prieltonie of South Russia. Phytochemistry 2014, 105, 37–42. [Google Scholar] [CrossRef]
- Jinbiao, X.I.; Zhang, F.; Chen, Y.; Mao, D.; Yin, C.; Tian, C. A preliminary study on salt contents of soil in root-canopy area of halophytes. Chin. J. Appl. Ecol. 2004, 15, 53–58. (In Chinese) [Google Scholar] [CrossRef]
- Ashraf, M.; Orooj, A. Salt stress effects on growth, ion accumulation and seed oil concentration in an arid zone traditional medicinal plant ajwain (Trachyspermum ammi [L.] Sprague). J. Arid Environ. 2006, 64, 209–220. [Google Scholar] [CrossRef]
- Schiop, S.T.; Hassan, M.A.; Sestras, A.F.; Boscaiu, N.; Mónica, T.; Vicente, M.; Óscar. Identification of salt stress biomarkers in Romanian Carpathian populations of Picea abies (L.) Karst. PLoS ONE 2015, 10, 980–981. [Google Scholar] [CrossRef] [PubMed]
- Richards, L.A. Diagnosis and improvement of saline and alkaline soils. Soil Sci. 1954, 78, 154. [Google Scholar] [CrossRef]
- Volkmar, K.M.; Hu, Y.; Steppuhn, H. Physiological responses of plants to salinity: A review. Can. J. Plant Sci. 1998, 78, 19–27. [Google Scholar] [CrossRef]
- Ashraf, M.; Ozturk, M.; Ahmad, M.S.A. Structural and Functional Adaptations in Plants for Salinity Tolerance; Springer: Dordrecht, The Netherlands; Berlin, Germany, 2010; pp. 151–170. [Google Scholar] [CrossRef]
- Negrão, S.; Schmöckel, S.M.; Tester, M. Evaluating physiological responses of plants to salinity stress. Ann. Bot. 2017, 119, 1–11. [Google Scholar] [CrossRef] [PubMed]
- Singh, M.; Kumar, J.; Singh, S.; Singh, V.P.; Prasad, S.M. Roles of osmoprotectants in improving salinity and drought tolerance in plants: A review. Rev. Environ. Sci. Bio/Technol. 2015, 14, 407–426. [Google Scholar] [CrossRef]
- Fardus, J.; Matin, M.A.; Hasanuzzaman, M.; Hossain, M.S.; Nath, S.D.; Hossain, M.A. Exogenous salicylic acid-mediated physiological responses and improvement in yield by modulating antioxidant defense system of wheat under salinity. Not. Sci. Biol. 2017, 9, 219–232. [Google Scholar] [CrossRef]
- Esfandiari, E.; Gohari, G. Response of ROS-scavenging systems to salinity stress in two different wheat (Triticum aestivum L.) cultivars. Not. Bot. Horti Agrobot. 2017, 45, 287–291. [Google Scholar] [CrossRef]
- Chen, Z.D.; Xing, S.P.; Liang, H.X.; Lu, A.M. Morphogenesis of female reproductive organs in Carpinus turczaninowii and Ostryopsis davidiana (Betulaceae). Acta Bot. Sin. 2001, 43, 1110–1114. (In Chinese) [Google Scholar] [CrossRef]
- Cheng, L.X.; Jin, C.Z.; Zhu, Z.L. Growth characteristics of Carpinus turczaninowii and chlorophyll fluorescence annual variation. J. Shanghai Jiaotong Univ. 2014, 32, 21–26. (In Chinese) [Google Scholar] [CrossRef]
- Ko, H.N.; Kim, J.M.; Bu, H.J.; Lee, N.H. Chemical constituents from the branches of Carpinus turczaninowii with antioxidative activities. J. Korean Chem. Soc. 2013, 57, 520–524. [Google Scholar] [CrossRef]
- Kang, J.M.; Kim, J.E.; Lee, N.H. Anti-melanogenesis active constituents from the extracts of Carpinus turczaninowii leaves. J. Soc. Cosmet. Sci. Korea 2017, 43, 35–41. [Google Scholar] [CrossRef]
- Yeo, J.H.; Son, Y.K.; Bang, W.Y.; Kim, O.Y. Carpinus truczaninowii extract showed anti-inflammatory response on human aortic vascular smooth muscle cells. Planta Med. 2016, 82, S1–S381. [Google Scholar] [CrossRef]
- Hothem, S.D.; Marley, K.A.; Larson, R.A. Photochemistry in Hoagland’s Nutrient Solution. J. Plant Nutr. 2003, 26, 845–854. [Google Scholar] [CrossRef]
- Camposeo, S.; Palasciano, M.; Vivaldi, G.A.; Godini, A. Effect of increasing climatic water deficit on some leaf and stomatal parameters of wild and cultivated almonds under Mediterranean conditions. Sci. Hortic. 2011, 127, 234–241. [Google Scholar] [CrossRef]
- Lichenthaler, H.K.; Wellburn, A.R. Determinations of total carotenoids and chlorophylls a and b of leaf extracts in different solvents. Biochem. Soc. Trans. 1983, 11, 591–592. [Google Scholar] [CrossRef]
- Vivekanandan, M. Drought-induced responses of photosynthesis and antioxidant metabolism in higher plants. J. Plant Physiol. 2004, 161, 1189–1202. [Google Scholar] [CrossRef]
- Magné, C.; Saladin, G.; Clément, C. Transient effect of the herbicide flazasulfuron on carbohydrate physiology in Vitis vinifera L. Chemosphere 2006, 62, 650–657. [Google Scholar] [CrossRef]
- Bradford, M.M. A rapid and sensitive method for the quantitation of microgram quantities of protein utilizing the principle of protein-dye binding. Anal. Biochem. 1976, 72, 248–254. [Google Scholar] [CrossRef]
- Steinert, A.; Bielka, S. Determination of free proline in stressed plants. Arch. Züchtungsforsch. 1990, 20, 199–204. [Google Scholar]
- Hodges, D.M.; Delong, J.M.; Forney, C.F.; Prange, P.K. Improving the thiobarbituric acid-reactive-substances assay for estimating lipid peroxidation in plant tissues containing anthocyanin and other interfering compounds. Planta 1999, 207, 604–611. [Google Scholar] [CrossRef]
- Dionisio-Sese, M.L.; Tobita, S. Antioxidant responses of rice seedlings to salinity stress. Plant Sci. 1998, 135, 1–9. [Google Scholar] [CrossRef]
- Beyer, W.F.; Fridovich, I. Assaying for superoxide dismutase activity: Some large consequences of minor changes in conditions. Anal. Biochem. 1987, 161, 559–566. [Google Scholar] [CrossRef]
- Civello, P.M.; Martinez, G.A.; Chaves, A.R.; Anon, M.C. Peroxidase from strawberry fruit (Fragaria ananassa Duch.): Partial purification and determination of some properties. J. Agric. Food Chem. 1995, 43, 2596–2601. [Google Scholar] [CrossRef]
- Nakano, Y.; Asada, K. Hydrogen peroxide is scavenged by ascorbate specific peroxidase in spinach chloroplasts. Plant Cell Physiol. 1981, 22, 867–880. [Google Scholar] [CrossRef]
- Ma, F.; Cheng, L. The sun-exposed peel of apple fruit has higher xanthophyll cycle-dependent thermal dissipation and antioxidants of the ascorbate–glutathione pathway than the shaded peel. Plant Sci. 2003, 165, 819–827. [Google Scholar] [CrossRef]
- Niu, G.H.; Cabrera, R.I. Growth and physiological responses of landscape plants to saline water irrigation: A review. Hortscience 2010, 45, 1605–1609. [Google Scholar] [CrossRef]
- Laffray, X.; Alaoui-Sehmer, L.; Bourioug, M.; Bourgeade, P.; Alaoui-Sossé, B.; Aleya, L. Effects of sodium chloride salinity on ecophysiological and biochemical parameters of oak seedlings (Quercus robur L.) from use of de-icing salts for winter road maintenance. Environ. Monit. Assess. 2018, 190, 266. [Google Scholar] [CrossRef]
- Lu, N.; Luo, Z.; Ke, Y.; Dai, L.; Duan, H.D.; Hou, R.X.; Cui, B.B.; Dou, S.H.; Zhang, Y.D.; Sun, Y.H. Growth, physiological, biochemical, and ionic responses of Morus alba L. seedlings to various salinity levels. Forests 2017, 8, 488. [Google Scholar] [CrossRef]
- Christian, Z.R.; Mühling, K.H.; Ulrich, K.; Christoph-Martin, G. Salinity stiffens the epidermal cell walls of salt-stressed maize leaves: Is the epidermis growth-restricting? PLoS ONE 2015, 10, e118406. [Google Scholar] [CrossRef]
- Wang, B.X.; Zeng, Y.H.; Wang, D.Y.; Zhao, R.; Xu, X. Responses of leaf stomata to environmental stresses in distribution and physiological characteristics. Agric. Res. Arid Areas 2010, 28, 112–122. (In Chinese) [Google Scholar]
- Zhou, Q.; Zhu, Z.L.; Shi, M.; Cheng, L.X. Growth and physicochemical changes of Carpinus betulus L. influenced by salinity treatments. Forests 2018, 9, 354. [Google Scholar] [CrossRef]
- Kharusi, L.A.; Assaha, D.; Al-Yahyai, R.; Yaish, M.W. Screening of Date Palm (Phoenix dactylifera L.) cultivars for salinity tolerance. Forests 2017, 8, 136. [Google Scholar] [CrossRef]
- Tuteja, N. Mechanisms of high salinity tolerance in plants. Methods Enzymol. 2007, 428, 419–438. [Google Scholar] [CrossRef] [PubMed]
- Hasegawa, P.M.; Bressan, R.A.; Zhu, J.K.; Bohnert, H.J. Plant cellular and molecular responses to high salinity. Annu. Rev. Plant Physiol. Plant Mol. Biol. 2000, 51, 463–499. [Google Scholar] [CrossRef] [PubMed]
- Barazani, O.; Golan-Goldhirsh, A. Salt-driven interactions between Pistacia lentiscus and Salsola inermis. Environ. Sci. Pollut. Res. Int. 2009, 16, 855. [Google Scholar] [CrossRef] [PubMed]
- Müller, P.; Li, X.P.; Niyogi, K.K. Non-photochemical quenching. A response to excess light energy. Plant Physiol. 2001, 125, 1558–1566. [Google Scholar] [CrossRef] [PubMed]
- Ioana, M.P.; Sara, G.O.; Mohamad, A.H.; Adriana, F.S.; Oscar, V.; Jaime, P.; Radu, E.S.; Monica, B. Effects of drought and salinity on European Larch (Larix decidua Mill.) Seedlings. Forests 2018, 9, 320. [Google Scholar] [CrossRef]
- Li, S.H.; Ge, Z.M.; Xie, L.N.; Chen, W.; Yuan, L.; Wang, D.Q. Ecophysiological response of native and exotic salt marsh vegetation to waterlogging and salinity: Implications for the effects of sea-level rise. Sci. Rep. 2018, 8, 2441. [Google Scholar] [CrossRef]
- Silveira, J.A.G.; Araujo, S.A.M. Roots and leaves display contrasting osmotic adjustment mechanisms in response to NaCl-salinity in Atriplex nummularia. Environ. Exp. Bot. 2009, 66, 1–8. [Google Scholar] [CrossRef]
- Abdullakasim, S.; Kongpaisan, P.; Thongjang, P.; Saradhuldhat, P. Physiological responses of potted Dendrobium orchid to salinity stress. Hortic. Environ. Biotechnol. 2018, 59, 491–498. [Google Scholar] [CrossRef]
- Sotiropoulos, T.E. Effect of NaCl and CaCl2 on growth and contents of minerals, chlorophyll, proline and sugars in the apple rootstock M 4 cultured in vitro. Biol. Plant. 2007, 51, 177–180. [Google Scholar] [CrossRef]
- Hayat, S.; Hayat, Q.; Alyemeni, M.N.; Wani, A.S.; Pichtel, J.; Ahmad, A. Role of proline under changing environments: A review. Plant Signal Behav. 2012, 7, 1456–1466. [Google Scholar] [CrossRef]
- Zidan, M.A.; Elewa, M.A. Effect of salinity on germination, seedling growth and some metabolic changes in four plant species (Umbelliferae). Indian J. Plant Physiol. 1995, 38, 57–61. [Google Scholar] [CrossRef]
- Fatemeh, Z.; Mohammad, E.A.; Alireza, N.; Parviz, A. Physiological and morphological responses of the ‘Dargazi’ pear (Pyrus communis) to in vitro salinity. Agric. Conspec. Sci. 2018, 2, 169–174. [Google Scholar]
- Cristiano, G.; Camposeo, S.; Fracchiolla, M.; Vivaldi, G.A.; Lucia, B.D.; Cazzato, E. Salinity differentially affects growth and ecophysiology of two Mastic tree (Pistacia lentiscus L.) accessions. Forests 2016, 7, 156. [Google Scholar] [CrossRef]
- Ramoliya, P.J.; Pandey, A.N. Effect of increasing salt concentration on emergence, growth and survival of seedlings of Salvadora oleoides (Salvadoraceae). J. Arid Environ. 2002, 51, 121–132. [Google Scholar] [CrossRef]
- Hajlaoui, H.; Ayeb, N.E.; Garrec, J.P.; Denden, M. Differential effects of salt stress on osmotic adjustment and solutes allocation on the basis of root and leaf tissue senescence of two silage maize (Zea mays L.) varieties. Ind. Crop. Prod. 2010, 31, 122–130. [Google Scholar] [CrossRef]
- Aragüés, R.; Puy, J.; Royo, A.; Espada, J.L. Three-year field response of young olive trees (Olea europaea L. cv. Arbequina) to soil salinity: Trunk growth and leaf ion accumulation. Plant Soil 2005, 271, 265–273. [Google Scholar] [CrossRef]
- Munns, R.; Tester, M. Mechanisms salinity tolerance. Annu. Rev. Plant Biol. 2008, 59, 651–681. [Google Scholar] [CrossRef]
- Chrysargyris, A.; Michailidi, E.; Tzortzakis, N. Physiological and biochemical responses of Lavandula angustifolia to salinity under mineral foliar application. Front. Plant Sci. 2018, 9, 1–23. [Google Scholar] [CrossRef]
- Ashraf, M.; Ali, Q. Relative membrane permeability and activities of some antioxidant enzymes as the key determinants of salt tolerance in canola (Brassica napus L.). Environ. Exp. Bot. 2008, 63, 266–273. [Google Scholar] [CrossRef]
- Tarchoune, I.; Sgherri, C.; Izzo, R.; Lachaal, M.; Navari-Izzo, F.; Ouerghi, Z. Changes in the antioxidative systems of Ocimum basilicum L. (cv. Fine) under different sodium salts. Acta Physiol. Plant. 2012, 34, 1873–1881. [Google Scholar] [CrossRef]


© 2019 by the authors. Licensee MDPI, Basel, Switzerland. This article is an open access article distributed under the terms and conditions of the Creative Commons Attribution (CC BY) license (http://creativecommons.org/licenses/by/4.0/).