Article

Seasonal Variations and Thinning Effects on Soil Phosphorus Fractions in Larix principis-rupprechtii Mayr. Plantations

Beijing key laboratory of forest resources and ecosystem processes, Beijing Forestry University, Beijing 100083, China
*
Author to whom correspondence should be addressed.
Forests 2019, 10(2), 172; https://doi.org/10.3390/f10020172
Submission received: 16 December 2018 / Revised: 5 February 2019 / Accepted: 14 February 2019 / Published: 18 February 2019
(This article belongs to the Special Issue Organic Matter Production and Decomposition in Forest Soils)

Abstract

:
Thinning is a common management practice in forest ecosystems. However, understanding whether thinning treatment will change the availability of phosphorus (P) in soils, and the effect of thinning on the seasonal dynamics of soil P fractions, are still limited. The objective of the present study was to assess seasonal variations in soil P fractions under different forest thinning management strategies in a Larch (Larix spp.) plantation in northern China. To accomplish this, we examined soil P fractions, soil physical–chemical properties, and litter biomass under control (CK), light (LT), moderate (MT) and high thinning (HT) treatments. Data were collected during the growing season of 2017. We found that most P fractions varied seasonally at different soil depths, with the highest values occurring in the summer and autumn. When compared to CK, MT enhanced the inorganic P (Pi) concentration extracted by resin strip (R-Pi). Labile organic P (Labile Po), moderately labile P and total P (TP) also increased in both MT and HT treatments irrespective of season. In contrast, less-labile Pi and Po fractions were lower in LT than in CK, especially when examining deeper soil layers. Our results suggest that LT leads to a strong ability to utilize Po and less-labile Pi. Moreover, the effect of thinning did not tend to increase with thinning intensity, P availability was maximized at the MT. Ultimately, we show that MT can improve soil P bioavailability and is recommended in Larix principis-rupprechtii Mayr. plantations of North China. Our results emphasize that the effect of thinning management on soil microenvironment is an important basis for evaluating soil nutrients such as soil P bioavailability.

1. Introduction

Soil phosphorus (P) occurs in both inorganic (Pi) and organic (Po) forms, and consists of compounds with varying degrees of solubility and bioavailability. Soil P is also one of the most important macronutrients necessary for plant growth [1]. Due to soil P fixation, only a small portion of Pi in soils is actually soluble and readily available to plants [2]. Phosphorous availability for microorganisms and plants largely depends on soil P fractions. As such, understanding different soil P fractions is essential to evaluating P bioavailability in soils [3]. Because of this, there has been increased interest in studying soil P fractions in terms of labile, moderately labile, and non-labile forms in Pi and Po fractions [4,5,6,7].
Soil microorganisms play a key role in Po transformation via P synthesis and release, excretion of phosphatase, and mineralization of P from organic materials [8]. Plants and microorganisms compete for available P [9]. Specifically, they actively produce phosphatase enzymes that facilitate Po hydrolysis, thus, increasing P availability for plants [10]. Likewise, bioavailable Pi can be bounded in soil microbial biomass after mineralization, resulting in a decrease in plant-available P [11].
Thinning is a common forest management practice [12]. Thinning can affect soil microbial structure and function by altering microenvironments (e.g., soil moisture and temperature), as well as the quality and quantity of substrate inputs (e.g., litter and roots), which can further influence soil P bioavailability [13]. Kim, et al. [14] reported that thinning promotes the accumulation of microbial biomass, and is positively correlated with total soil C and N. Furthermore, this effect of thinning was found to increase with thinning intensity. Due to an increase in rainwater and a reduction of transpiration [15], soil moisture content in temperate broad-leaved deciduous forests [16], northern evergreen coniferous forests [17], and subtropical forests [18] was significantly higher in heavily thinned forest stands. Increases in soil moisture usually promotes microbial activity, thus, favoring P mobilization, ion transport, and plant P uptake [19]. Hu, et al. [13] also indicated that soil acidity and alkaline phosphatase activities were enhanced after thinning management. With the increased availability of resources such as light, water, and nutrients, understory vegetation grows better [20] and utilizes some soil P that is not available to trees [13]. Decomposition of litter in the undergrowth can increase soil available P fraction [10]. All of these studies show that the cycling of different P fractions is influenced by complex microbial-soil-plant interactions, which in turn are affected by management strategies and environmental factors [21]. However, little information is available on the relationship between soil P fractions, microbial characteristics, plant litter, and forest thinning management strategy.
Information on seasonal variations in soil P fractions is crucial for understanding P dynamics, which reflect mineralization-immobilization processes of Po and its plants utilization strategy [22]. The fluctuation in P fractions during the growing season is considered to be a valuable factor for controlling P bioavailability [23]. Previous studies have shown considerable seasonal variations in soil P fractions [24]. However, inconsistencies in these seasonal patterns were apparent, especially for labile Pi. For example, high soil labile Pi can occur in summer [25] or winter [26]. Likewise, Fabre, et al. [27] observed no seasonality in R-Pi. Most studies on temperate ecosystems revealed that labile P fractions declined in summer, which was attributed to the highest plant uptake during summer [28,29]. These differences suggest that seasonal variation in soil P fractions might depend on climate, ecosystem, and soil type.
Larix principis-rupprechtii Mayr. is a deciduous tree that is well-adapted to high light levels and freezing temperatures [30]. Due to its rapid growth, high-quality wood, resistance to harsh climate and soil conditions, and its high wind resistance, this species is commonly used for afforestation in the warm temperate subalpine regions of China [30]. The high initial planting density and the lag of management lead to too large canopy density of existing stands, which reduces soil fertility and becomes a typical low yield and poor efficiency forest [31]. Reasonable thinning can promote the light, water, temperature, and soil nutrients in forests, and improve forest productivity [32]. However, understanding whether a decrease in stand density of L. principis-rupprechtii plantations will increase the availability of P in soils, and the effect of thinning on the seasonal dynamics of soil P fractions, are still limited.
The objectives of this study were to determine: How seasonally variable the various P fractions would be in L. principis-rupprechtii plantations; and how thinning treatments would differ in soil P fractions. To do this, we determined the seasonal changes in P fractions, acid phosphomonoesterase, microbial biomass P, as well as other physical–chemical properties and plant litter mass. We hypothesized that: (1) labile Pi in the summer would decline due to an increase in P demand by L. principis-rupprechtii stand growth; and (2) soil labile Pi fractions will be enhanced due to improvement of the microenvironment after thinning, which will lead to changes in P fractions and P availability. Likewise, we expect the P availability will increase as thinning intensity increases.

2. Materials and Methods

2.1. Site Description and Experimental Design

The study was conducted at the Mt. Taiyue in Shanxi, North China (36°31′–36°43′ N, 112°01′–112°15′ E; elevation 2273−2359 m.a.s.l.). The area has a semi-humid temperate monsoon climate, consisting of cold and dry winters and hot and wet summer. Annual average precipitation ranges from 600 mm to 650 mm, with 70% occurring in summer. The average temperature is 8.7 °C. The average frost-free period is 125 days, with an early frost in October and a late frost in April. The growing season occurs from early April to late October. The soil type is Alfisol according to the U.S. soil classification system [33]. The zonal vegetation is a temperate deciduous broad-leaved forest, and the dominate tree species are L. principis-rupprechtii, Pinus tabuliformis Carr., Betula platyphylla Suk., and Quercus wutaishanica Mayr.
In the spring of 1982, three-year-old L. principis-rupprechtii seedlings were planted at a density of 3000 trees ha−1. Seedlings were planted along contour lines in the mountainous areas of the bush vegetation, following forestry guidelines used to meet timber demands. In April 2010, thinning management treatments were carried out on L. principis-rupprechtii plantations for whole stands toward the density of 2160 trees ha−1. After thinning, twelve 25 × 25 m plots were set up at a distance of at least 10 m apart in order to avoid edge effects.
In March 2012, the twelve plots were randomly assigned to four treatments for the second thinning management treatment: light thinning (LT, thinned to 1835 trees ha−1), moderate thinning (MT, thinned to 1413 trees ha−1), and high thinning (HT, thinned to 1086 trees ha−1), and control (CK, unthinned). Thus, the study was conducted in a completely randomized design with three replications per treatment. During the thinning process, all trunks and branches were removed, and the leaves and undergrowth plants were left intact.
In July 2014, within each of the 12 plots, we established twenty-five 5 × 5 m2 sub plots, where plant height, diameter at breast height (DBH), crown width, and canopy density were measured. Within each sub plot, we used 1 × 1 m2 quadrats to sample the understory vegetation, which consisted of herbaceous density, height, and species richness. Detailed information on these four thinning treatments are shown in Table 1.

2.2. Field Sampling

Soil samples were collected at four separate times: April (early spring), June (middle summer), August (late summer) and October (late autumn) during the 2017 growing season. Within each plot, a composite soil sample was collected from nine different locations at depths of 0–10, 10–20 and 20–30 cm using a 5 cm diameter auger after the removal and collection of surface litter. Samples were brought back immediately to the laboratory for soil analysis.
Composite soil samples were first used to determine soil moisture content. Soil moisture was determined gravimetrically by drying a 20 g subsample at 105 °C until a constant weight was reached. The remaining composite soil samples were then sieved to 2-mm in order to remove organic debris and stones. Samples were then divided into two subsamples: one was immediately stored at 4 °C for measuring enzyme activity and microbial biomass, while the other was air-dried and further sieved to 0.25 mm for chemical analyses and P fractionation.
Litter was obtained from the soil surface by using 20 × 20 cm2 squares to separate samples into the L layer (i.e., undecomposed litter) and F/H (i.e., mixture of partly decomposed litter and amorphous humus) horizons. These samples were brought to the laboratory and were oven-dried at 65 °C to constant weight, and then to determinate the total P.

2.3. Soil Analysis

Soil temperature at a depth of 0−10 cm was determined hourly for one year by using a temperature recorder (HOBO Onset U22-001, Bourne, MA, USA) at each one of the 12 plots. The average values for continuous one week before each sampling time was used as soil temperature for each treatment sites. Soil pH value was measured in an aqueous extract (1:2.5 soil-water) with a pH-Meters (pH-10, Sartorius, Germany). Soil organic carbon (SOC) and total N (TN) were determined using an elemental analyzer (FLASH2000 CHNS/O, Thermo, Third Avenue Waltham, MA, America) in the 0–10, 10–20 and 20–30 cm soil layers. Soil microbial biomass P (MBP) was determined by the chloroform fumigation extraction method assuming that KP is 0.40 [34]. Acid phosphomonoesterase (AcPME) activity was assayed by the standard method of Tabatabai and Bremner [35] using p-nitrophenyl phosphate as substrate at a temperature of 37 °C. MBP and AcPME were measured in the 0−10 cm soil layer. Soil physical and chemical properties in studied sites under four thinning treatments are listed in Table 2.

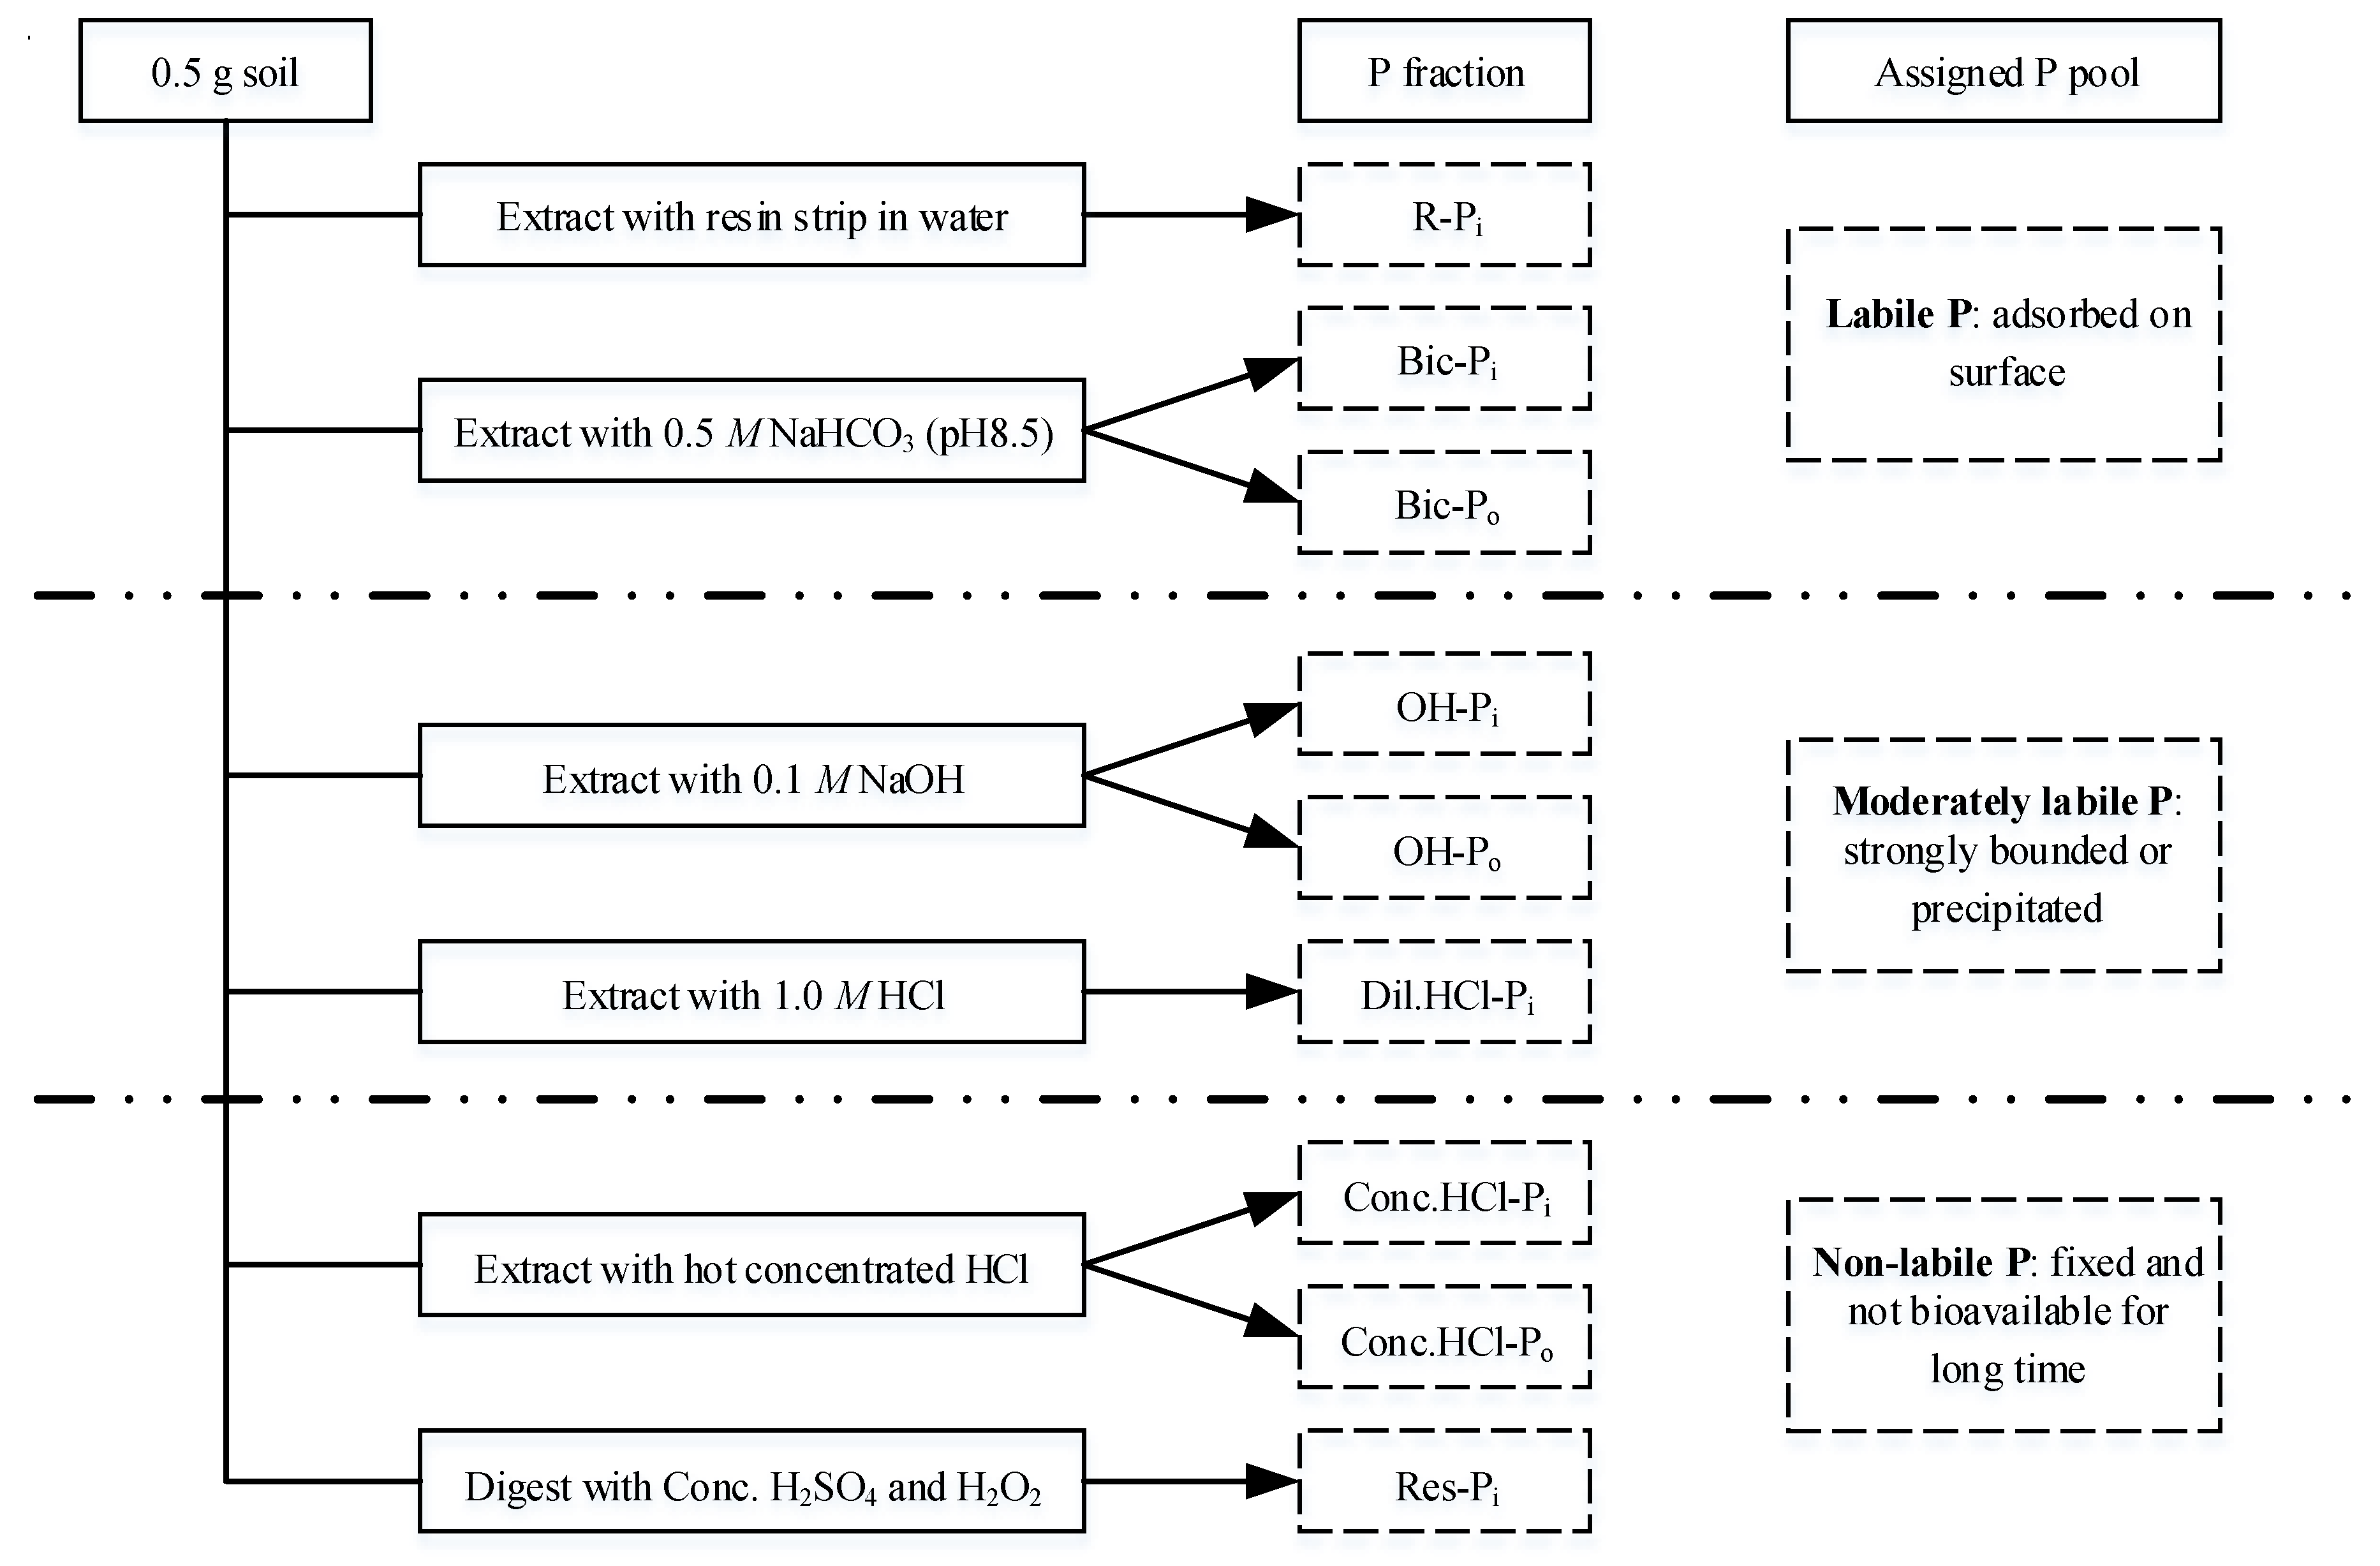
2.4. Phosphorus Fractionation

The fractionation scheme for the different soil P fractions was conducted using the Hedley extraction method (Figure 1) [36]. At each step, 30 mL of extractant was added to a 0.5-g soil sample in a 50-mL centrifuge tube, and shaken for 16 h. The suspended soil solutions were then centrifuged at 25,000× g for 10 min at 0 °C, and were then passed through a 0.45 μm membrane filter to collect clear extractions. All extraction solutions were measured using a modification of the phosphomolybdate blue method [37]. Total P was analyzed after digestion with ammonium persulfate and H2SO4 in an autoclave at 121 °C. Po in the soil was calculated as the difference between total P and Pi.
The P fractions of this sequential extraction are explained as follows: R-Pi (extracted by resin strip) represents freely exchangeable Pi; Bic-Pi fraction (inorganic extracted by NaHCO3), which is readily available to plants, and Bic-Po (organic extracted by NaHCO3) is easily mineralizable and contributes to plant-available P [38]; OH-P (extracted by NaOH) is composed of amorphous and some crystalline Al and Fe phosphates, in which OH-Pi is less utilized by plants and OH-Po is a relatively stable form. The Dil.HCl-P (extracted by 1 M HCl) is thought to Ca-associated Pi, and rarely any Po in this extract. The Conc.HCl-P (extracted by concentrated HCl) is useful for discriminating between Pi and Po in very stable residual pools. The residue left after the hot Conc.HCl extraction is unlikely to contain anything but highly recalcitrant Pi (Res-Pi) [7].
In order to reflect ecological significance, P fractions were grouped into pools according to their plant availability as labile P (R-Pi + Bic-Pi + Bic-Po), moderately labile P (OH-Pi + OH-Po + Dil.HCl-Pi) and non-labile P (Conc.HCl-Pi + Conc.HCl-Po + Res-Pi) [39].

2.5. Statistical Analysis

Both main effects and interactive effects of thinning and season on various P fractions of the soil layer were tested using repeated-measures analysis of variance (ANOVA). Differences in the dependent variables within the same soil layers and within each sampling season were evaluated using one-way ANOVA, followed by Tukey’s multiple comparisons post hoc test at p < 0.05 level. Correlations between soil property and P fraction were assessed using Pearson’s correlation coefficients. Data were checked for normality and homoscedasticity prior to statistical analyses, and were also log-transformed to correct for deviations from these assumptions when needed. Analyses were performed using SPSS, version 21.0 (IBM, Chicago, IL, USA).

3. Results

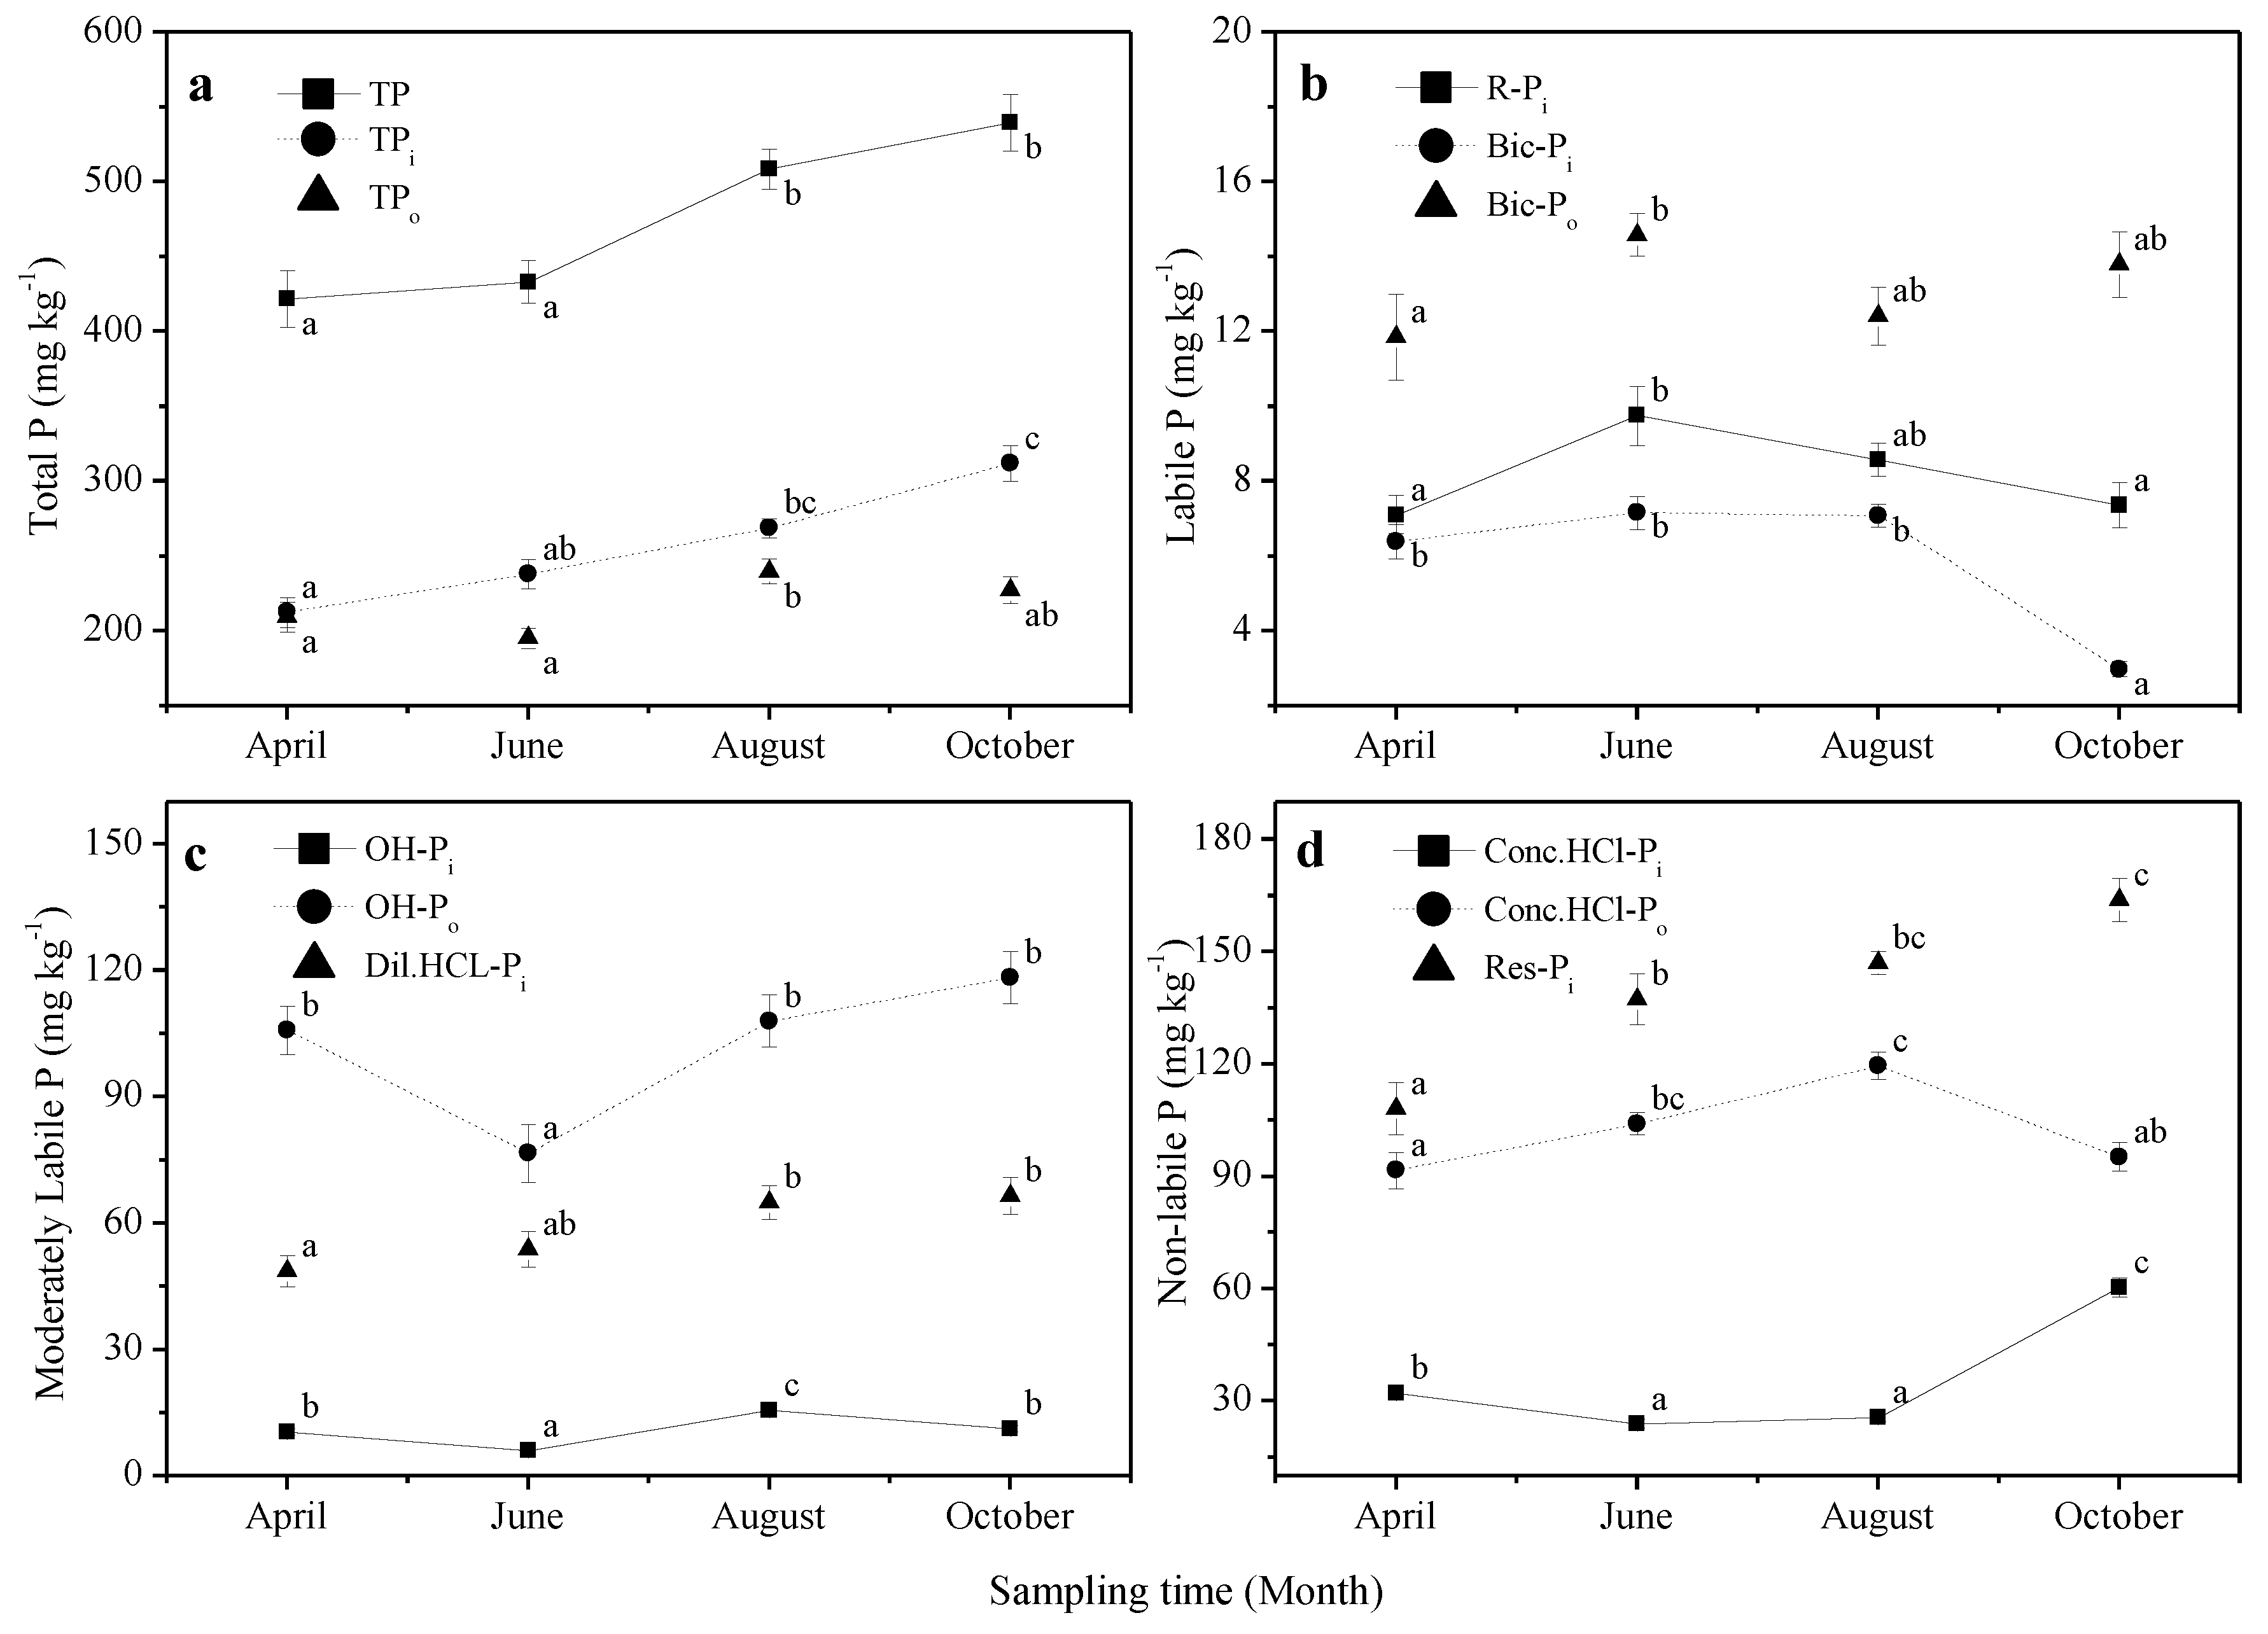
3.1. Soil Total P, Pi and Po Concentrations

Results from the repeated-measures ANOVA revealed that total P (TP) concentration was affected by stand thinning, season and their interactions at all soil depths (p < 0.05, Table 3). Throughout the growing seasons, both soil TP and total Pi (TPi) reached maximum in October and total Po (TPo) in August (Figure 2a). Specifically, TP was higher in October (539.5 ± 19.0 g kg−1) than in August (508.5 ± 13.3 mg kg−1), June (433.2 ± 14.3 mg kg−1), and April (421.8 ± 19.0 mg kg−1) across thinning treatments at the 30-cm depth. Similarly, across the treatments TPi in October was significantly higher than in April and June. TPo was significantly (p < 0.001) higher in August, followed by October at the 0−30 cm (Figure 2a).
Thinning had significant effects on soil TP, TPi and TPo at all depths (p < 0.05, Table 3). Concentrations of TP and TPo increased in MT and HT treatments more than in CK treatment. The only exceptions to this trend were samples collected in deeper soil layers (Figure 3). TPi was higher in MT than in CK treatment in April, June, October (p < 0.001) and August (p = 0.043) (Figure 3).

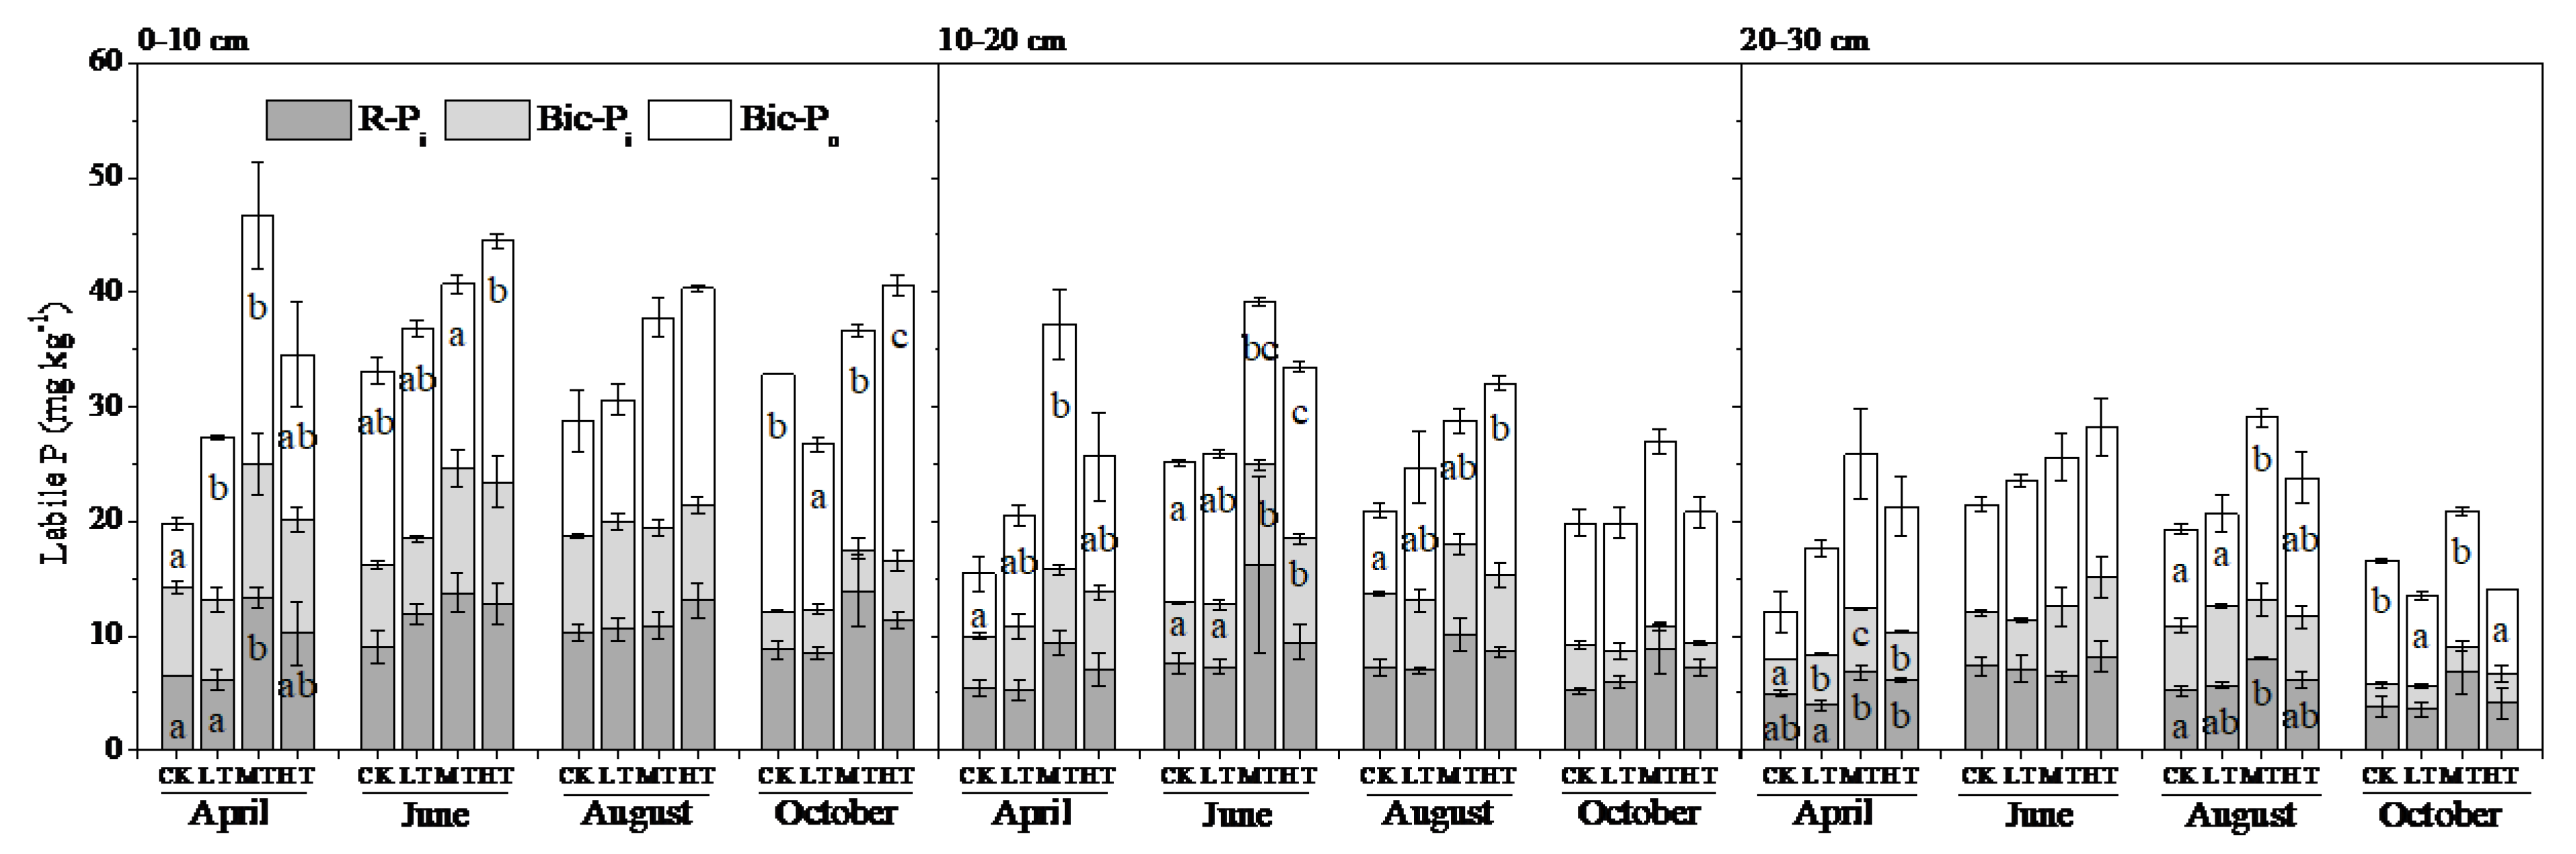
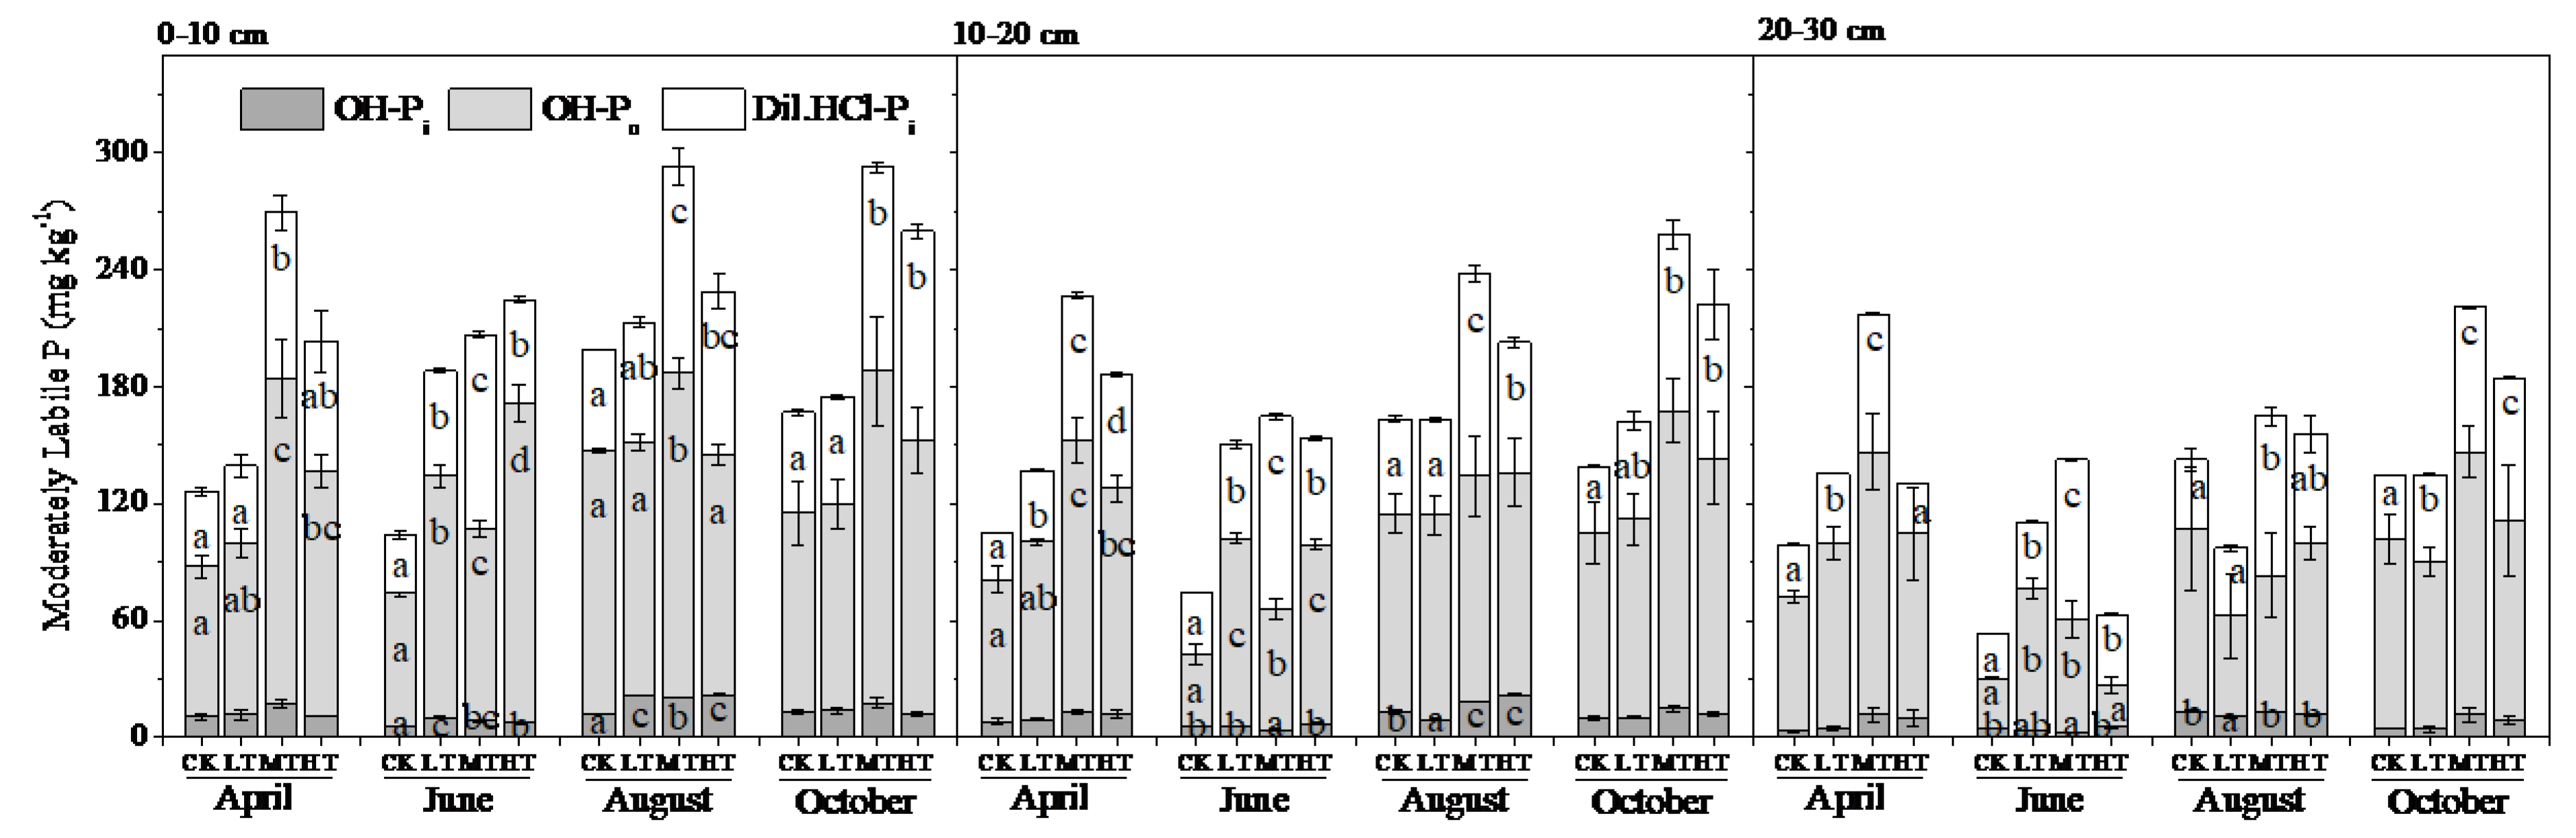
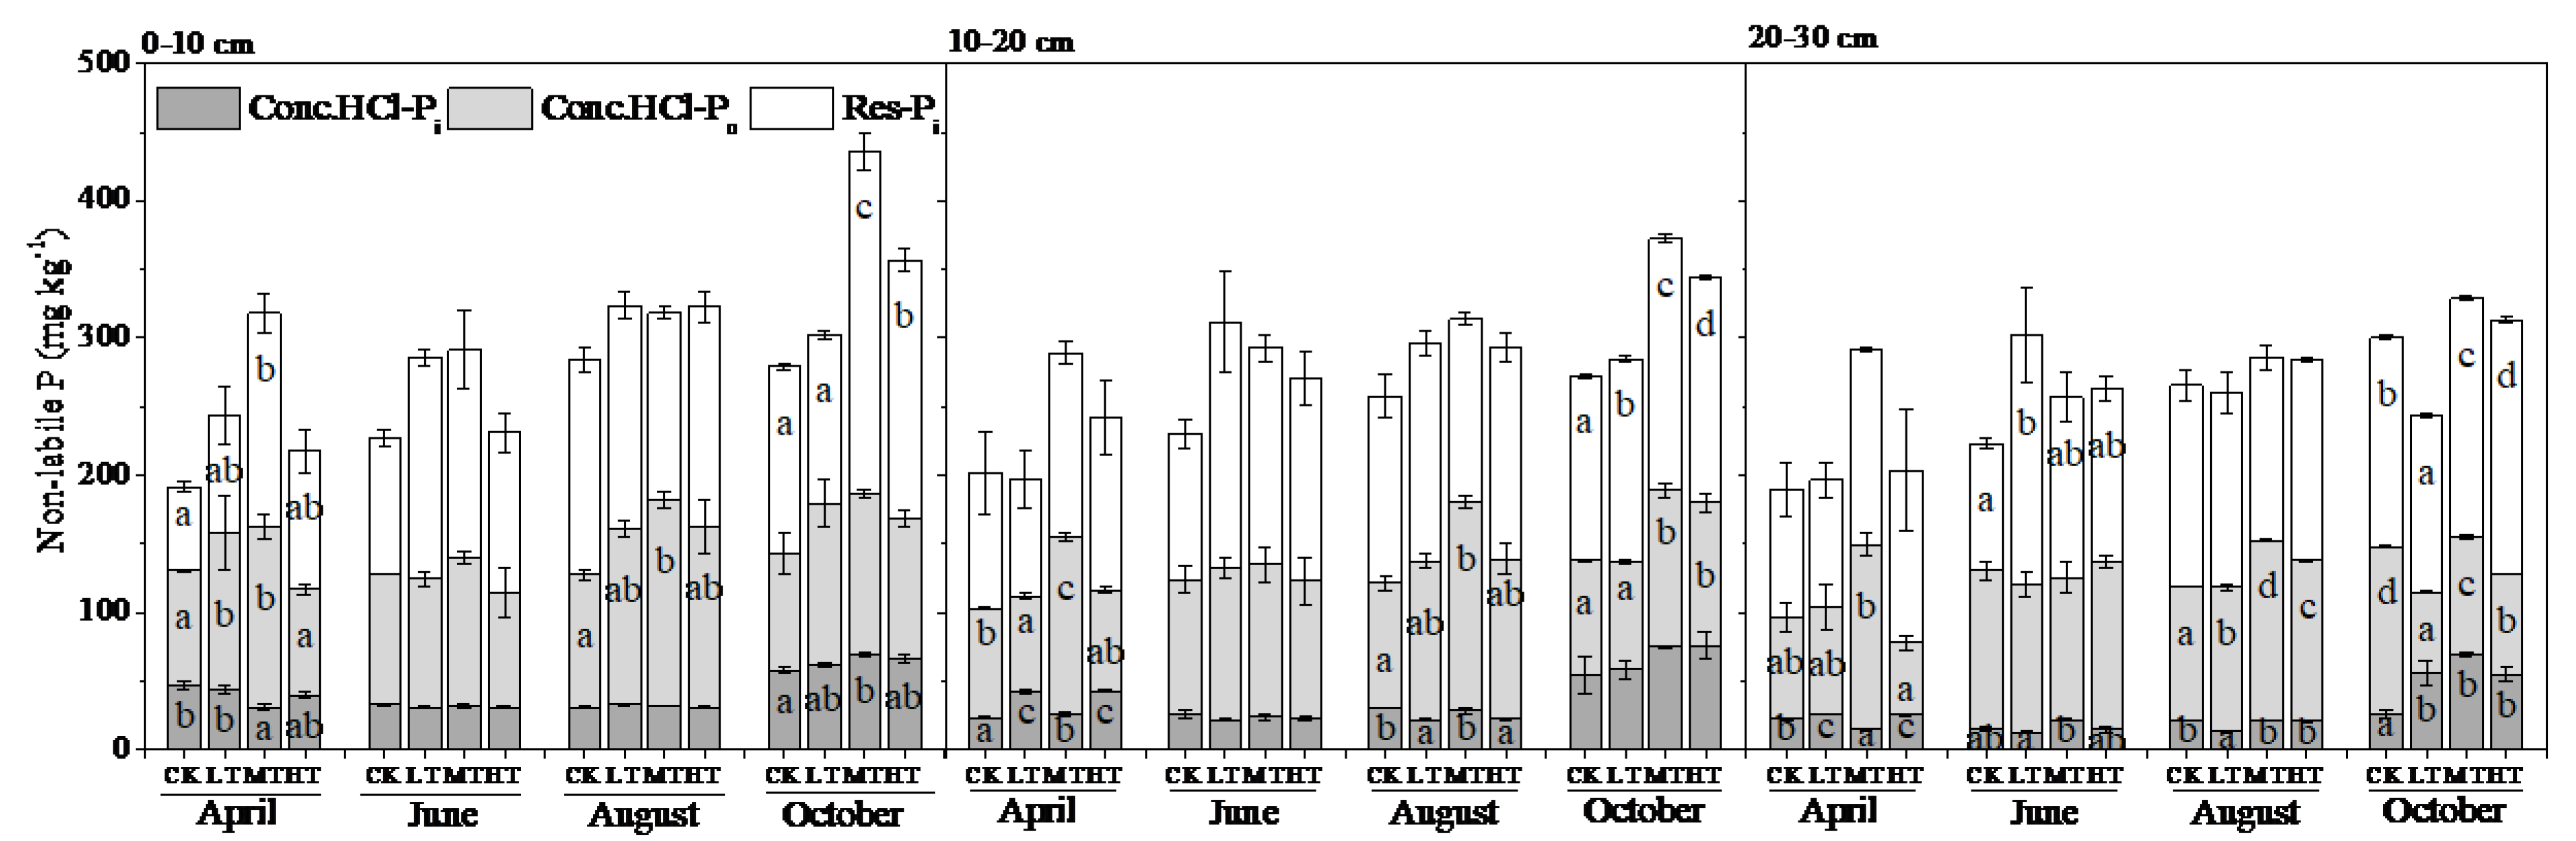
3.2. Soil P Fractions

Labile P concentrations (2–11% of TP) were affected by season (p < 0.05, Table 3). With the exception of MT, soil labile Pi in all soil layers increased in the summer (15.5 ± 0.6 mg kg−1) and was lowest in autumn (9.6 ± 0.7 mg kg−1) (Figure 2b and Figure 3). Seasonal patterns of soil labile Po differed significantly among the treatments and the CK. In CK, labile Po increased from spring to autumn in the 0−10 cm soil layer, resulting almost 3.7 times increase in autumn relative to spring. In LT and MT, labile Po was lowest in summer at the 0−10 cm (10.5 ± 1.3 mg kg−1) and 10−20 cm (18.5 ± 1.7 mg kg−1) soil layers, respectively (Figure 4).
There were significant thinning effects observed in soil labile P at each season (p < 0.001, Table 3). Compared to CK, R-Pi concentration only increased significantly in MT, Bic-Po increased significantly in both MT and HT, and decreased in LT (Figure 4). Specifically, R-Pi concentration significantly increased in MT at the 0−10 cm depth in spring (twice) and at the 20−30 cm depth in summer (53%) compared with that in CK. Bic-Po concentrations accumulation at the 30-cm depth was 58.1% and 31.2% greater for the MT and HT than for CK across seasons. By contrast, in autumn, bic-Po concentration was lower in the LT treatment (11.1 ± 1.7 mg kg−1) than in CK (14.1 ± 1.0 mg kg−1) (Figure 4).
We found significant seasonal variations in moderately labile P (16%−49% of TP) in all treatments and soil depths (p < 0.001, Table 3). Soil OH-Pi increased during the summer, and concentration of OH-Po showed similar seasonal patterns as those found for labile Po (Figure 2c). Moderately labile P concentration was affected by thinning at all three soil depths (p < 0.001, Table 3). Moderately labile P concentration was almost always greater in MT and HT, and lower in LT than in CK. In MT and HT, it was significantly higher in April (p < 0.001), June (p = 0.011), and October (p = 0.001) (Figure 5). In contrast, in LT, OH-Pi concentration decreased by 29.0% and 22.3% at the 10−20 and 20−30 cm depths in August compared with that in CK (Figure 5).
Non-labile P concentration (42–77% of TP) was affected by thinning and season at all soil depths (p < 0.05, Table 3). Across treatments, non-labile Pi and Po were higher in autumn and summer, respectively (Figure 2d). Specifically, non-labile Pi concentration significantly increased throughout the seasons: October (224.1 ± 7.1 mg kg−1) > August (172.4 ± 3.3 mg kg−1) > June (161.2 ± 6.7 mg kg−1) > April (140.2 ± 6.6 mg kg−1), while the order for non-labile Po concentration was August (119.5 ± 3.7 mg kg−1) > June (104.1 ± 3.0 mg kg−1) > October (95.2 ± 3.8 mg kg−1) > April (91.6 ± 4.9 mg kg−1). Non-labile P concentration was always lower in LT than in CK, especially in deeper soil layers (Figure 6).

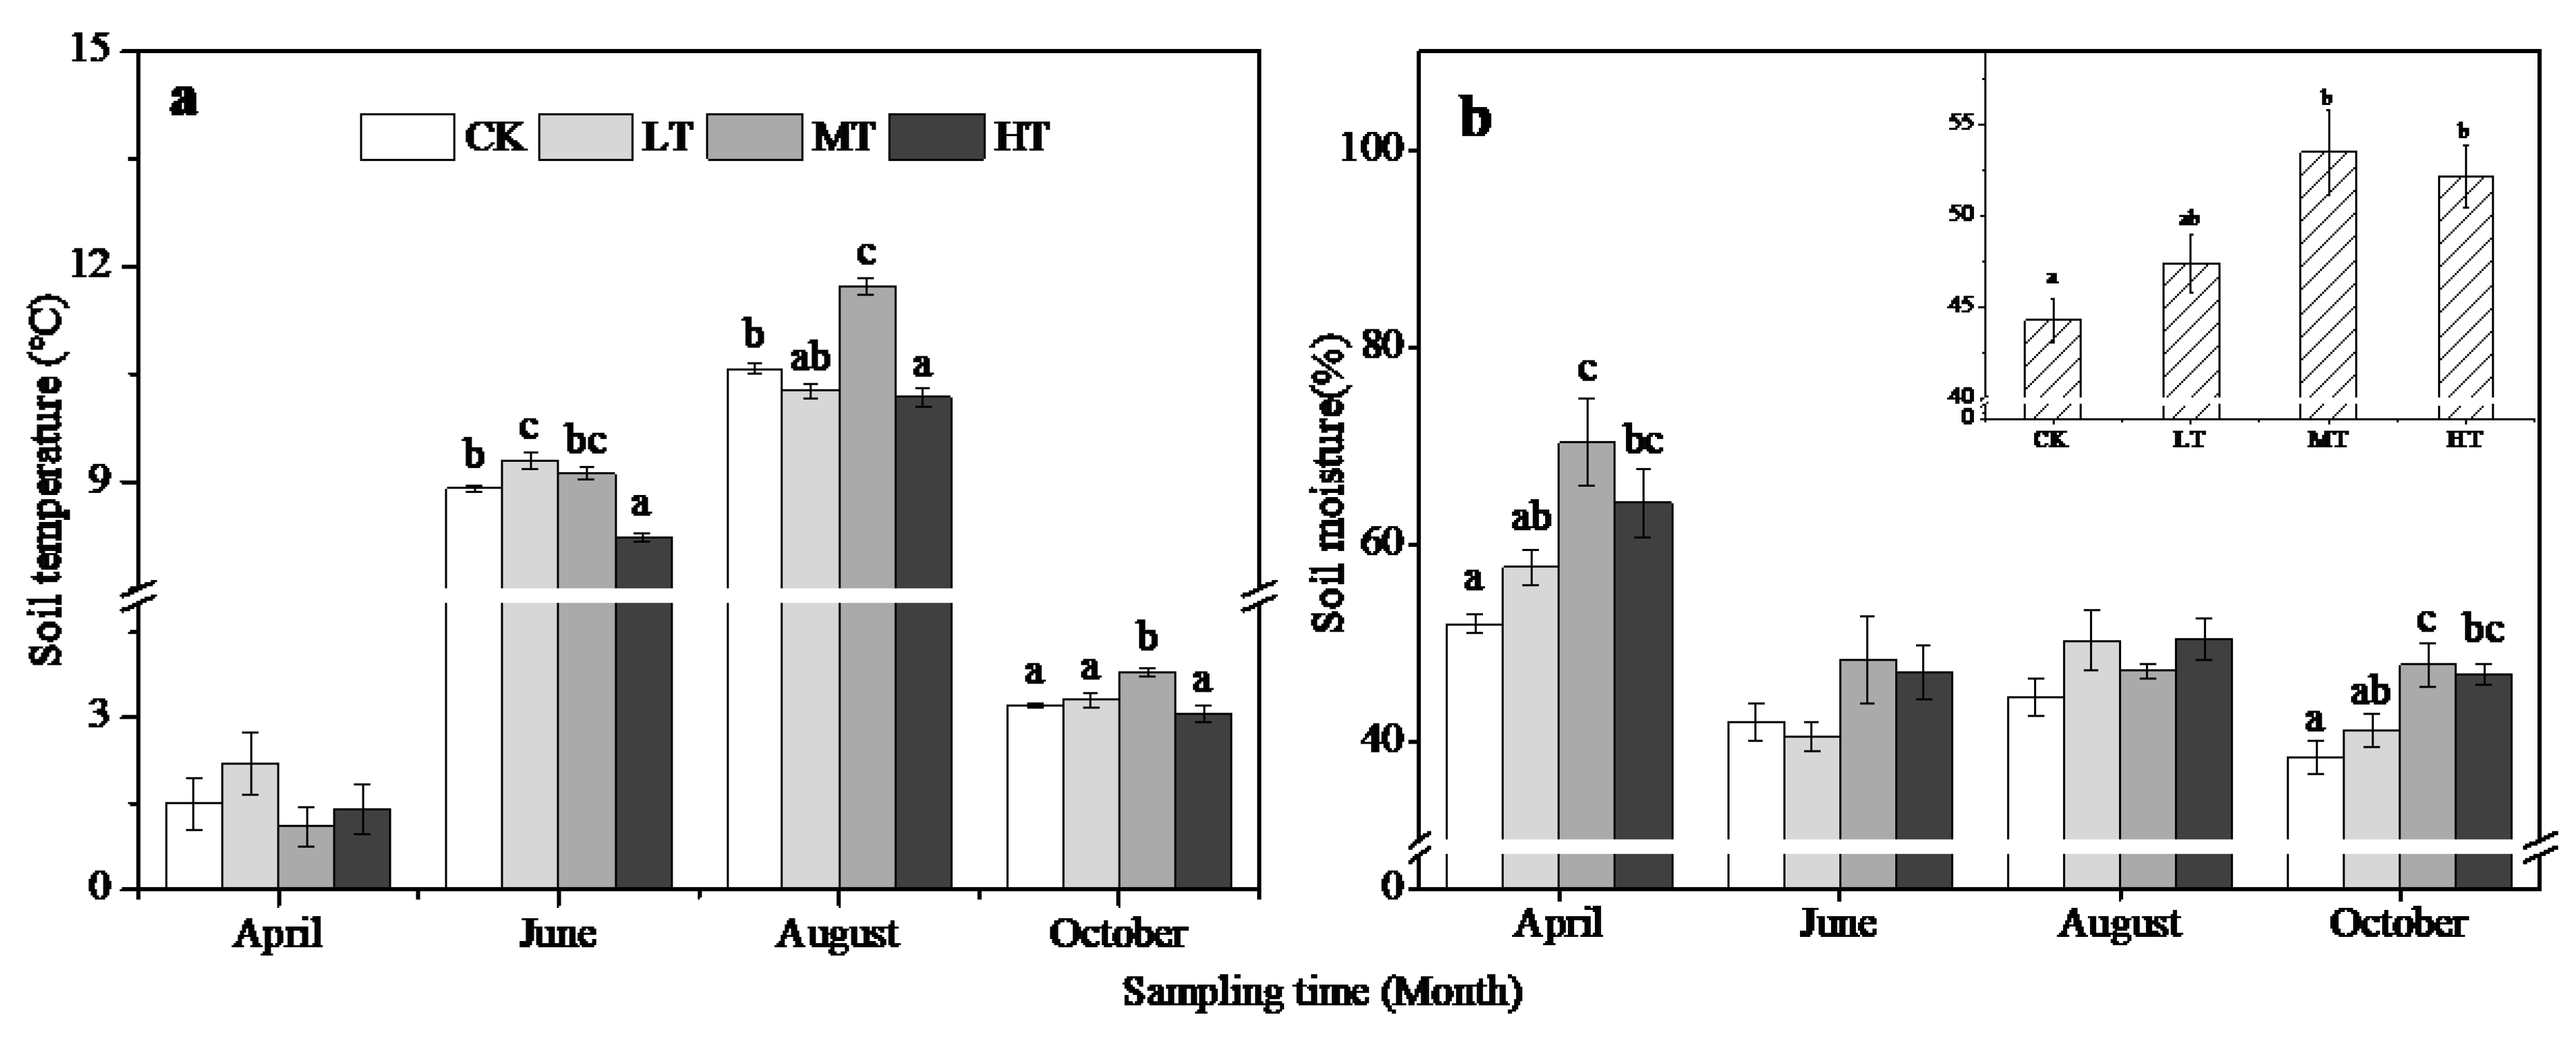
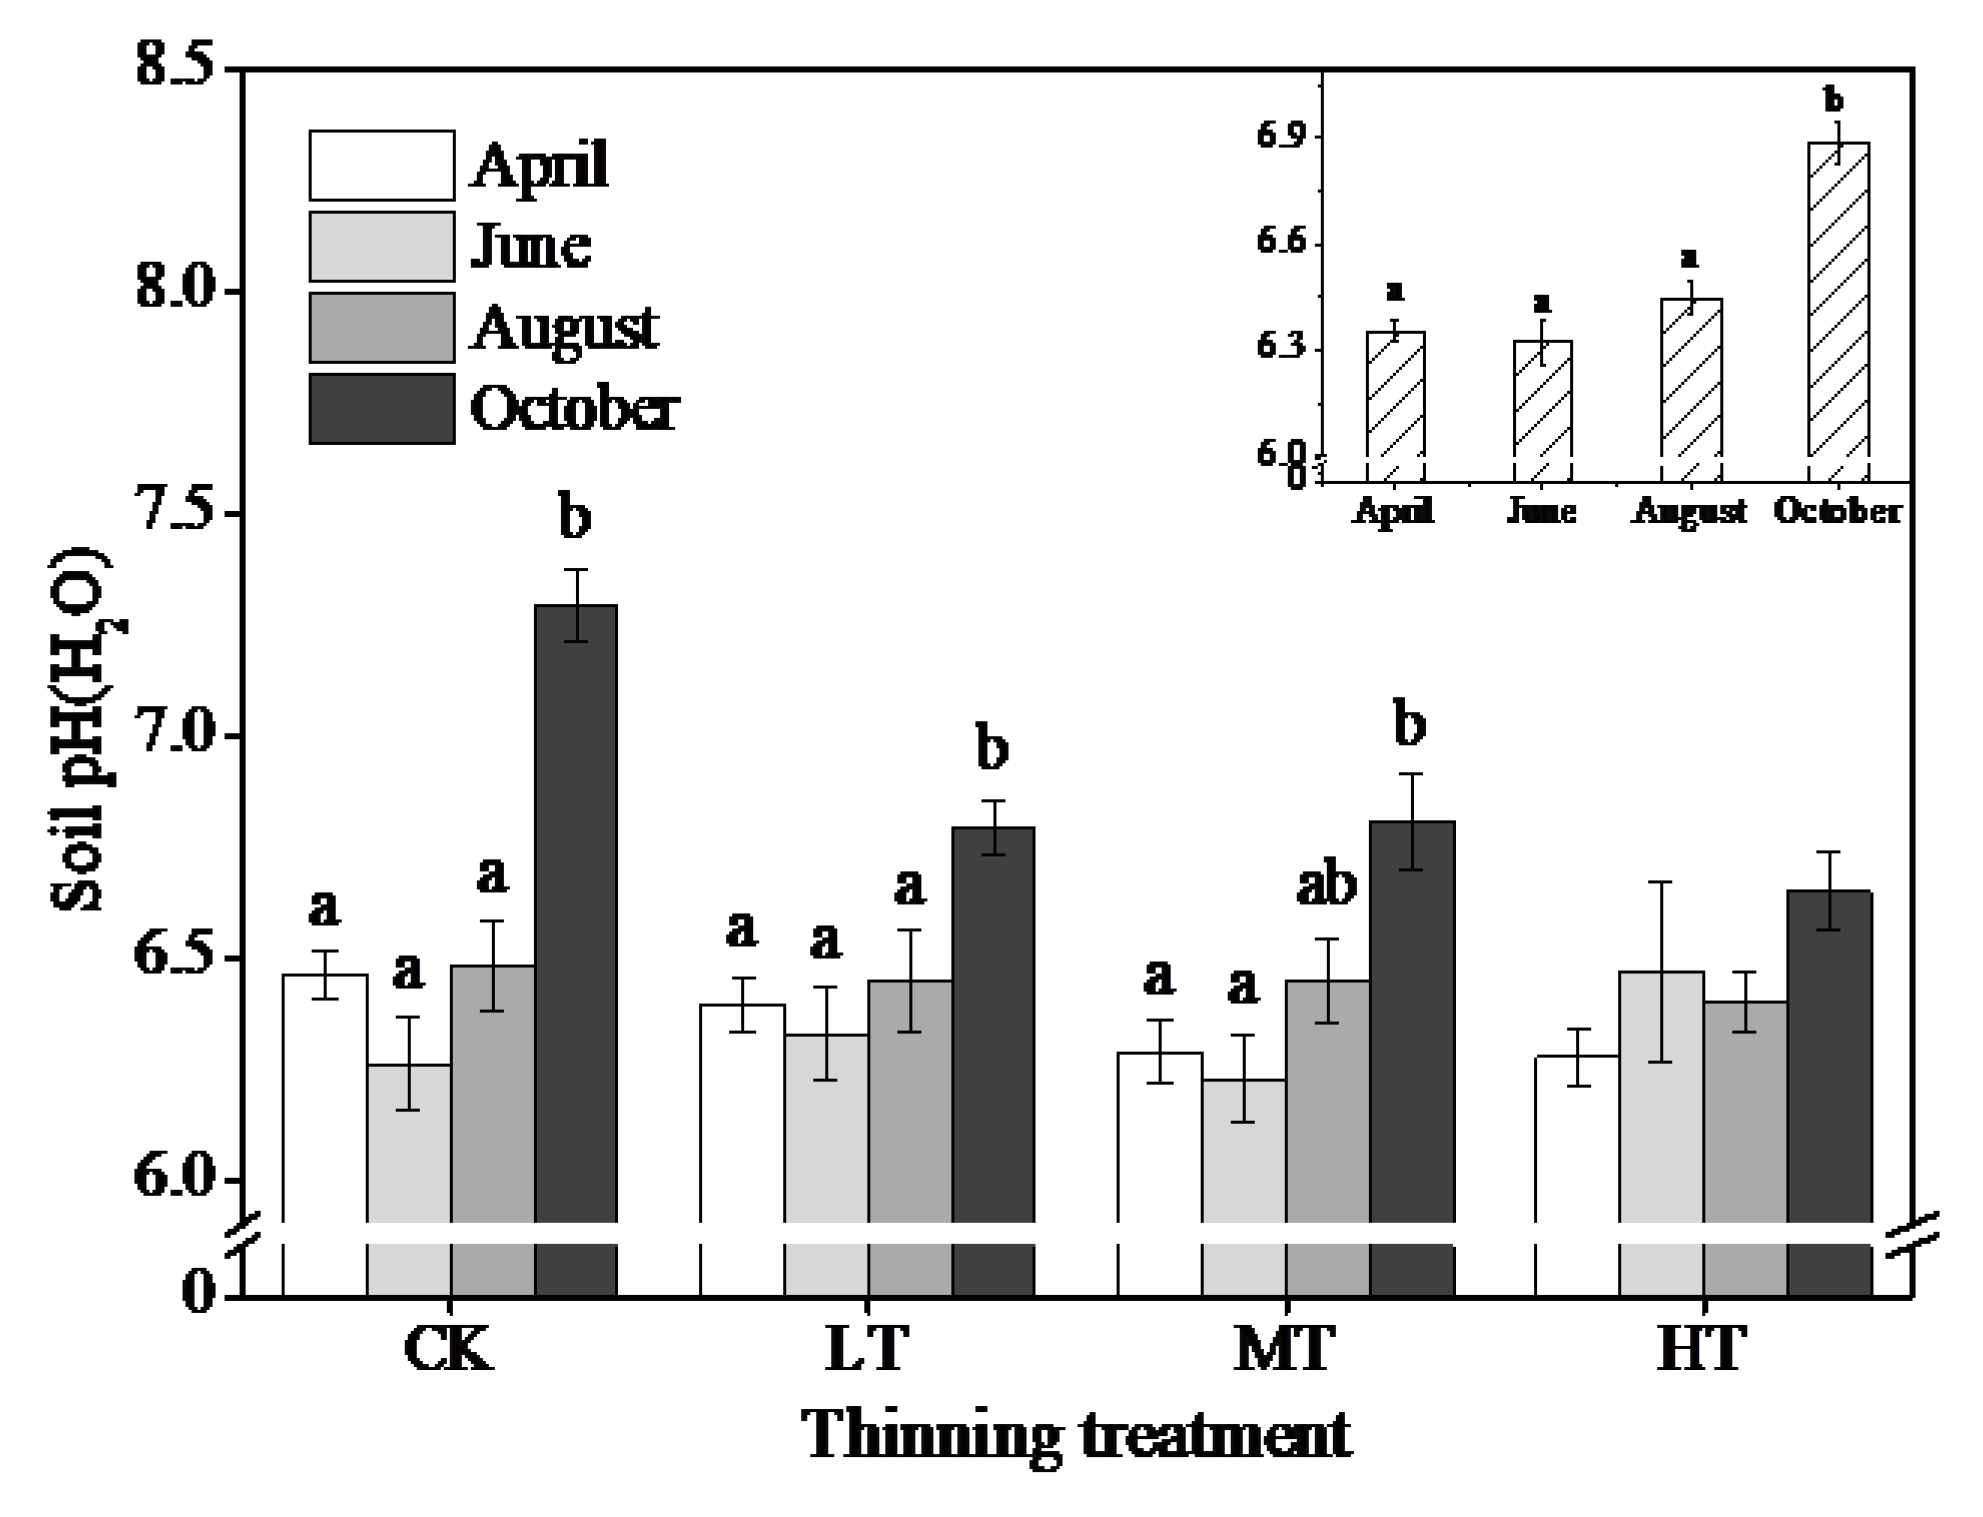
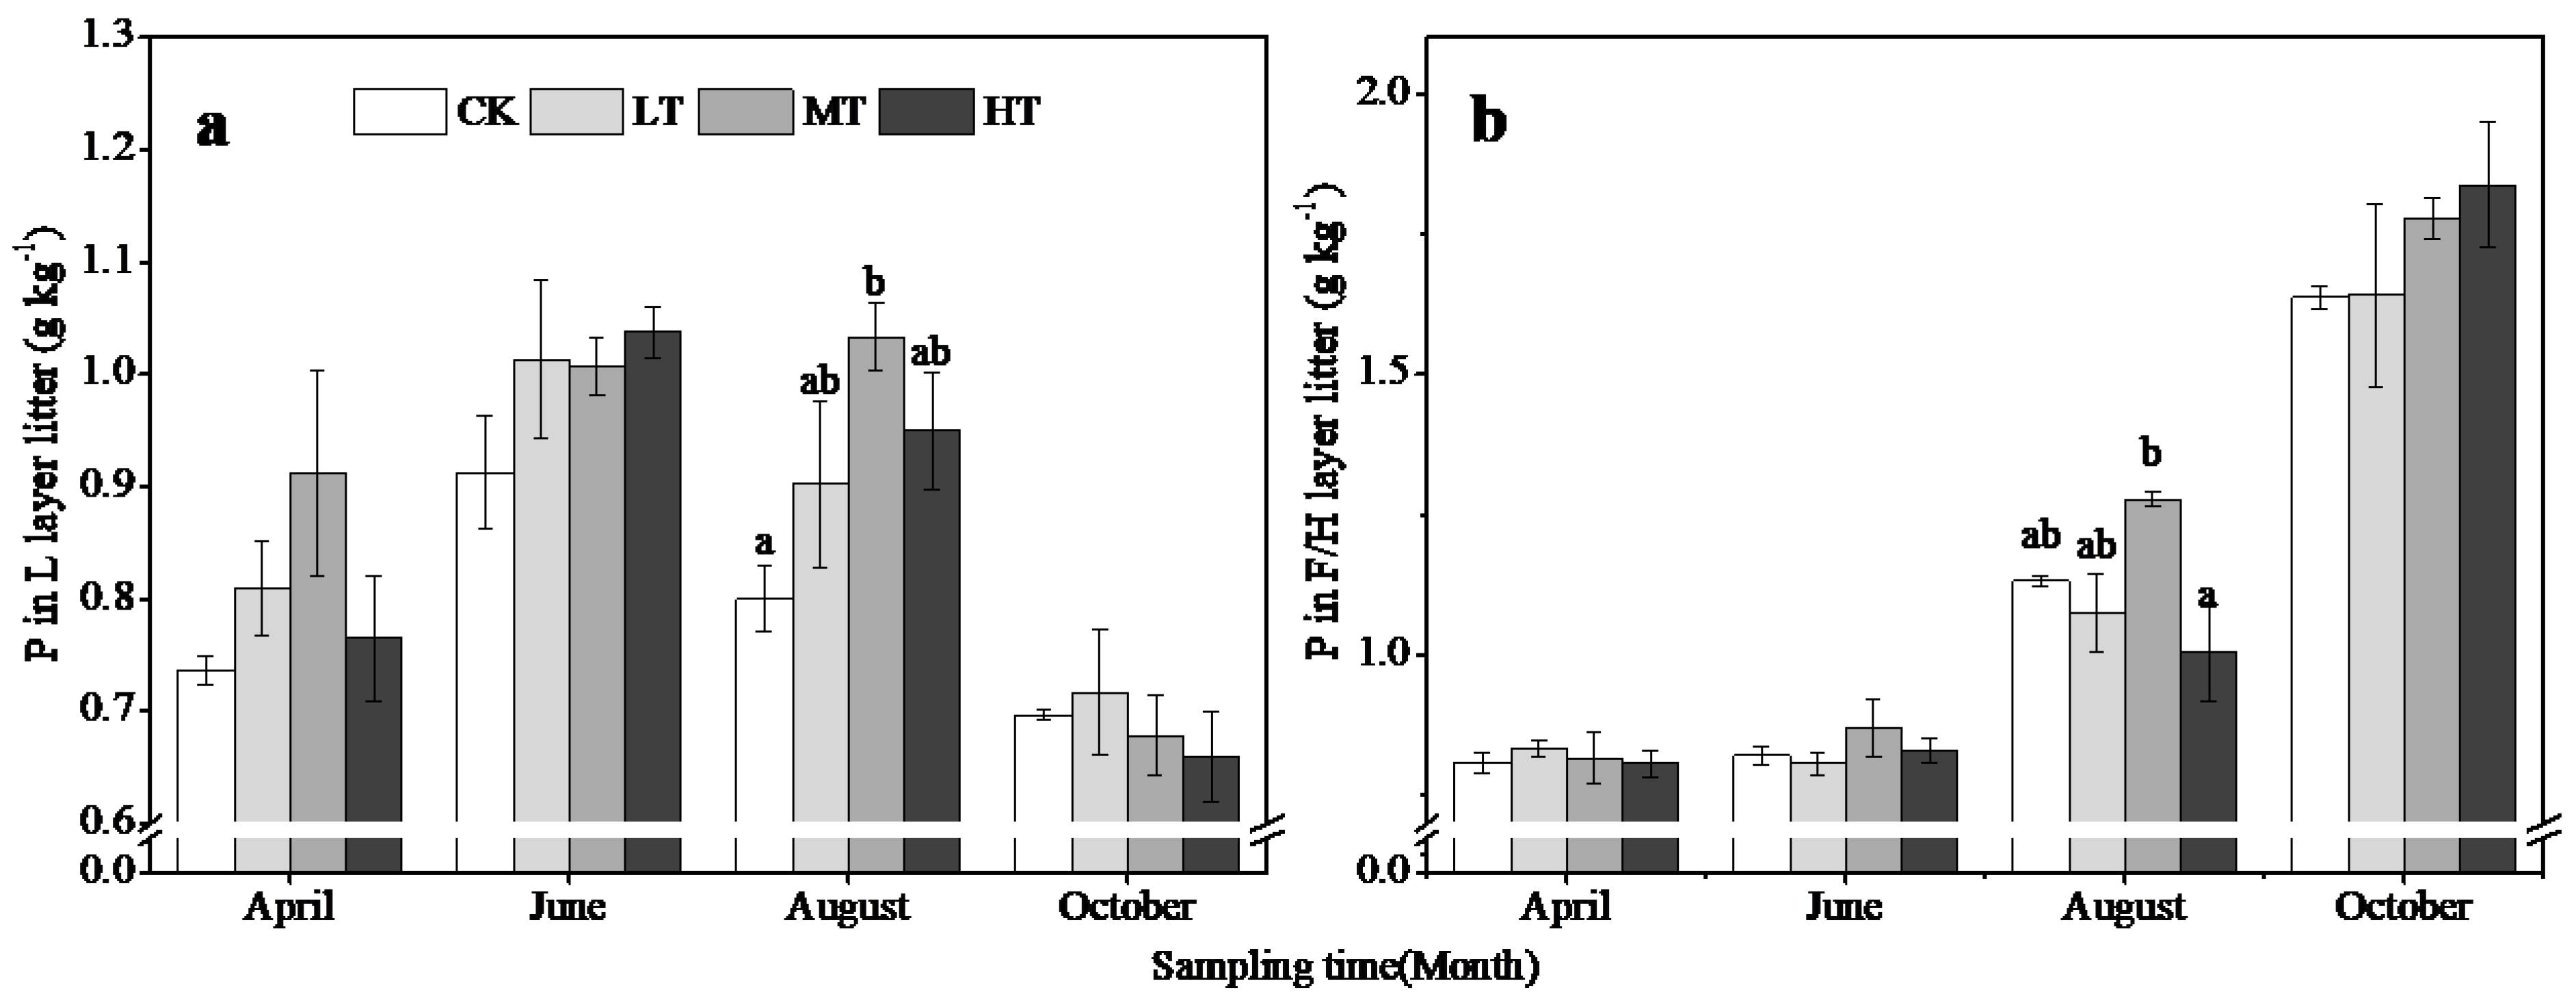
3.3. Changes in Soil and Litter Properties

Soil temperature extremes were measured in August (10.7 ± 0.06 °C) and April (1.5 ± 0.22 °C). Compared to CK, the MT treatment significantly increased soil temperatures in August and October (Figure 7a). Mean across-seasons soil moisture was significantly higher in MT and HT than in CK. The increase in soil moisture in HT (17.9%) was less than in MT (20.8%) at all soil layers (Figure 7b). Soil pH was significantly affected by sampling times, except for HT. Soil pH was significantly higher in October (6.9 ± 0.06) than at any other sampling times (6.3 ± 0.03) across four thinning treatments (Figure 8). Concentration of litter P of two layers (L and F/H layer) peaked in MT in August (Figure 9).

3.4. Correlation between P Fractions and Soil Properties

At the 0–10 cm depth, most P fractions were positively correlated with SOC, soil moisture, MBP and AcPME. The only exceptions were for OH-Pi with SOC (p > 0.10), with AcPME (p > 0.10), and Bic-Po with MBP (p = 0.06) (Table 4). All P fractions were positively correlated with SOC at the 10–30 cm depth. There was a positive correlation between P fractions and soil moisture at the 10−30 cm depth, except for OH-Po (p > 0.10) and TPo (p > 0.10) at the 20−30 cm (Table 4).

4. Discussion

4.1. Seasonal Variation

A literature review concluded that P recycling was driven primarily by plant P demand and was sustained by leaf litter inputs in the forest and root litter inputs in grassland [21]. In our study, the highest values of TP and Pi occur in October (Figure 2a). The increase in organic inputs from leaf litter and smaller mineralization of P in autumn and winter were recognized as a major contribution to the increase in the TP [39]. Concentration of TPi increased in October because under cooler conditions typical of autumn and winter, plant growth slows and nutrients are returned to the soil from decomposing surface litter [40] and roots [41]. These results indicate a seasonal synergy between plants and P nutrient in the whole Larch plantation. Liu, et al. [5] also found that TP increased in the fog-cool season in rubber-based agroforestry systems, although this was only observed in deeper soil layers (30–60 cm). However, TP did not vary seasonally in other forest types [42]. Still, in an elm-savanna and a grassland, TP decreased considerably during the summer [25].
Seasonality seemed to affect labile P fractions through changes in soil moisture and temperature, although it could also indirectly regulate substrate effectiveness of litter and roots via plant phenology [5]. Labile soil P showed a pronounced seasonal variation at all three soil depths, which was reflected in the observed changes of its components (i.e., R-Pi and Bic-extractable P) among different thinning treatments.
Labile Pi is the most mobile soil P fraction and can, thus, be easily translocated or lost by leaching or biological uptake. In our study, labile Pi was highest in summer and lowest in the autumn at all soil layers, except for MT (Figure 2b and Figure 4). In sub-humid warm temperate areas like those studied here, we would expect to see a decline in labile Pi that is easily available in summer due to a greater P demand during the growing season. However, labile Pi at all three soil layers reached its peak in summer, except for MT, coupled with a different degree of decrease in labile and moderately labile Po (Figure 2). Such a trend was obtained by [5] where the author suggests that the increase in labile Pi is due to the release of Po accumulated over the previous year. Similarly, labile Pi greatly increased in the summer and decreased in spring and autumn in five vegetation types in the southeastern Keerqin Sandy Lands of China [25]. This was attributed to a combination of increases in temperature, moisture, and plant root activity during the summer, which was promoted by the biological transformation of soil P and the increased availability of labile Pi [22]. Labile Pi was lowest in the autumn when pH was higher (i.e., >6.5; Figure 8). This is due to the solubility isotherms of bound P cross at pH 6.0–6.5. Thus, in such milieu, P anions are potentially most mobile and bioavailable [43]. And also could be attributed to soil temperature controlling the spatial P ion mobility during colder months. For example, Godlinski, et al. [44] documented higher P loss in winter when vegetation was inactive. Conversely, the most labile forms of P were highly dependent on season with stabilization (R-Pi) or important accumulation during winter (Bic-Pi) in the soil of a riparian forest [27]. Stabilization or accumulation were ascribed to cold winter temperatures, to the decay of leaves, and to the leaching of labile forms of P from the litter. These changes can be explained by seasonal fluctuations in soil moisture and temperature, and to their associated microbial activity throughout the year, and to differences in stand and soil type.
Easily mineralizable labile Po (Bic-Po) is considered to be controlled by biological processes in soils. Seasonal variations of soil labile Po differed among the treatments and the CK. Lower Bic-Po was observed in the summer in the first 20 cm of soil layer of LT and MT (Figure 4), which can be ascribed to intensive Po mineralization stimulated by enhanced microbial activity under favorable soil conditions. However, the significant increase in labile Po observed in October of CK at the 0−10 cm was positively correlated with AcPME (Table 4) [42]. Chen et al. [29] also reported a substantial increase in this fraction in the winter, which was attributed to microbial inactivation under low temperature conditions. Furthermore, Bic-Po was positively correlated with litter and soil C (Table 4), highlighting the potential importance of organic inputs in the contribution to P fertility [45].
Relatively few studies have focused on seasonal variations in moderately labile and non-labile soil P [7]. Concentration of OH-Pi was greater in August than in other sampling times across all treatments (Figure 2c and Table S2). Higher temperatures may foster the formation of crystalline mineral phases that sorb P more strongly than amorphous phases. On the other hand, soil moisture content also affects its concentration. Higher temperatures influence evapotranspiration and then soil water content, thus, solute transport in soil solutions [43].
Concentrations of Non-labile Pi (Conc.HCl-Pi and Res-Pi) was greatest in October at all depths among the four treatments. This is in line with that of Özgül, et al. [46], who believed that cold conditions as well as drying influence the soil solution volume and thus, raise ion concentrations. This can foster the precipitation of P-containing minerals and can decrease P availability [46]. The increase of non-labile Po (Conc.HCl-Po) concentrations in summer suggests a progressive incorporation of sediments deposited by summer storms, or through the soil fauna’s ingestion/dejection processes [27]. Hence, climate change and the expected modifications in temperature and precipitation patterns will probably affect P solubility and the P fractions found in soils [47]. It can be used as a breakthrough point for future soil phosphorus research.

4.2. Treatment Effects

Significant differences in soil P fractions and TPi, TPo and TP were observed across seasons in L. principis-rupprechtii plantations after thinning (Figure 3 and Table S1), indicating that thinning treatment greatly influences P composition and quantity. Concentrations of TPi, TPo and TP were consistently higher in MT and HT relative to CK, regardless of sampling time. This finding suggests that there is an advantage in MT and HT treatments when conservation of soil P stocks are important. This may be explained by the more abundant understory in MT and HT [17], and by the greater organic matter input as a result of decomposing roots and leaves when L. principis-rupprechtii plantations are thinned [48]. In line with this notion is the finding by Gang, et al. [49], who demonstrated that understory vegetation has the potential to make substantial contributions to the maintenance of soil fertility.
Phosphorous availability is determined primarily by fluctuations of individual P fractions, rather than by TP [39]. In our study, MT led to a substantial increase in R-Pi. And, Bic-Po and moderately labile P were greater in the MT and HT (Figure 4 and Figure 5). These changes could be due to several factors associated with different thinning strategies. Firstly, higher SOC in the MT and HT (Table 2) contributing to the increase in the labile P fraction. This is in line with that of Johnson, et al. [50], who found that soil organic matter content is an important determinant of the labile P pool. Furthermore, after four decades of post-agricultural forest development, soils with high organic matter were found to have high concentrations of labile Pi [51].
The second associated factor that may explain the observed thinning effect is microbial biomass and activity. Microorganisms are known to play an important role in the mobilization of poorly available P, and can subsequently increase plant available P. Our results showed an increase in MBP after MT (Table 2), and a significantly positive correlation with most P fractions (Table 4). Kim, et al. [14] also found that microbial biomass increased after thinning. Likewise, young intercropping rubber-based agroforestry systems saw a steady increment in R-Pi at all three depths across seasons, which was attributed to the high microbial activity enhanced by the sufficient C source [5].
Third, elevated soil moisture in the MT and HT treatments (Figure 7b) may also led to increase in labile and moderately labile P. At all three soil depths, most P forms had a high positive correlation with soil moisture (Table 4). This was maybe due to the fact that greater soil moisture lends an advantage to microbial and phosphatase activities, which will favor P mobilization and ion transport, and can, thus, enhance total ecosystem nutrition [52]. To some extent, this trend is in line with another study conducted in a reforested spruce forest, where the authors found an increase in labile P with more precipitation and balanced monthly distribution of precipitation [13]. This suggests that soil P availability could be related to soil moisture, as the latter could accelerate the mineralization of resistant Po and release orthophosphate ions [53].
Finally, we expect that the abundant of litter P in MT (Figure 9) was also an important factor in increase labile P and moderately labile P. A similar result was obtained by Huang and Spohn [54] in a litter manipulation experiment. Overall, thinning increased labile and moderately labile P of MT and HT by improving the soil microenvironment, including soil moisture, soil temperature, solar radiation, etc., and by increasing the input of substrate. The increase of plant-available P and potential-labile P also supports our hypothesis that soil P availability will be enhanced after thinning, which was beneficial to the restoration of the soil fertility in the L. principis-rupprechtii plantation.
The R-Pi represents freely exchangeable Pi. Only dissolved Pi in the soil solution can be taken up directly by plants and microorganisms and enter the food chain [43]. In this L. principis-rupprechtii plantations, the average concentrations of R-Pi was 8.20 mg kg−1, which accounted for only about 2% of the TP in soil. In our study, only MT increased the R-Pi concentration (Figure 4). Moreover the effect of thinning did not tend to increase with thinning intensity. This can be explained by more favorable conditions for microbes (high soil moisture and temperature), and more abundant litter-P in MT. therefore, we think that the MT was most effective for the bioavailability of the P pool.
Contrary to our hypothesis, our study found that labile Pi did not change, but less-labile Pi and Po fractions declined in LT compared with that in CK, especially in the soil below the top 10-cm (Figure 5 and Figure 6). We attribute this to the ability of L. principis-rupprechtii to utilize less-labile P fractions used for biomass accumulation, while also having minimal impacts on P availability [55]. These findings also suggest that non-labile P acts as both a source and a sink for available P [7].

5. Conclusions

In summary, most P fractions were significantly affected by season and thinning. Due to the plant demand and seasonal dynamics of soil conditions, the highest values of P fractions occur in the summer and autumn. Under different thinning treatments, less-labile Pi and Po fractions were lower in LT compared with that in CK, suggesting that LT has a strong ability to utilize less-labile Pi and Po. In contrast, labile Po, moderately labile P and TP were enhanced by both MT and HT treatments than in CK, which attribute to increasing SOC, microbial activity, soil moisture, and quantity of substrate after MT and HT. Interestingly, since only MT increase the R-Pi concentration, we found MT was most effective for the bioavailability of the P pool. Therefore, management strategies similar to our MT treatment can be considered as density adjustment measures for L. principis-rupprechtii plantations in North China. Our results emphasize that the effect of forest management on soil microenvironment is an important basis for evaluating soil nutrients such as soil P bioavailability.

Supplementary Materials

The following are available online at https://www.mdpi.com/1999-4907/10/2/172/s1, Table S1: The average of soil P fractions (mg kg−1) in four thinning treatments across seasons. Table S2: The average of soil P fractions (mg kg−1) in four sampling times irrespective of the treatments.

Author Contributions

H.T. Analyzed the Data and Wrote the Manuscript. H.T., H.J., X.L. and Z.L. Collected the Data. X.C. Revised the Manuscript. H.H. Designed the Study.

Funding

This Study was Supported by the National Key Research and Development Program of China (2016YFD0600205); the National Natural Science Foundation of China (31700372).

Acknowledgments

We Gratefully Acknowledge the Support from The Taiyue Forestry Bureau and The Haodifang Forestry Centre for Fieldworks. We Would Also Like to Thank Murphy Stephen at The Yale University for His Assistance with English Language and Grammatical Editing of The Manuscript.

Conflicts of Interest

The Authors Declare no Conflict of Interest.

References

  1. Vincent, A.G.; Schleucher, J.; Gröbner, G.; Vestergren, J.; Persson, P.; Jansson, M.; Giesler, R. Changes in organic phosphorus composition in boreal forest humus soils: The role of iron and aluminium. Biogeochemistry 2012, 108, 485–499. [Google Scholar] [CrossRef]
  2. Hinsinger, P. Bioavailability of soil inorganic P in the rhizosphere as affected by root-induced chemical changes: A review. Plant Soil 2001, 237, 173–195. [Google Scholar] [CrossRef]
  3. Mcdowell, R.W.; Stewart, I. The phosphorus composition of contrasting soils in pastoral, native and forest management in Otago, New Zealand: Sequential extraction and 31P NMR. Geoderma 2006, 130, 176–189. [Google Scholar] [CrossRef]
  4. Cherubin, M.R.; Franco, A.L.C.; Cerri, C.E.P.; Karlen, D.L.; Pavinato, P.S.; Rodrigues, M.; Davies, C.A.; Cerri, C.C. Phosphorus pools responses to land-use change for sugarcane expansion in weathered Brazilian soils. Geoderma 2016, 265, 27–38. [Google Scholar] [CrossRef]
  5. Liu, C.; Jin, Y.; Liu, C.; Tang, J.; Wang, Q.; Xu, M. Phosphorous fractions in soils of rubber-based agroforestry systems: Influence of season, management and stand age. Sci. Total Environ. 2018, 616–617, 1576–1588. [Google Scholar] [CrossRef] [PubMed]
  6. Stutter, M.I.; Shand, C.A.; George, T.S.; Blackwell, M.S.A.; Dixon, L.; Bol, R.; MacKay, R.L.; Richardson, A.E.; Condron, L.M.; Haygarth, P.M. Land use and soil factors affecting accumulation of phosphorus species in temperate soils. Geoderma 2015, 257–258, 29–39. [Google Scholar] [CrossRef]
  7. von Sperber, C.; Stallforth, R.; Preez, C.D.; Amelung, W. Changes in soil phosphorus pools during prolonged arable cropping in semiarid grasslands. Eur. J. Soil Sci. 2017, 68, 462–471. [Google Scholar] [CrossRef]
  8. Oberson, A.; Friesen, D.K.; Rao, I.M.; Bühler, S.; Frossard, E. Phosphorus Transformations in an Oxisol under contrasting land-use systems: The role of the soil microbial biomass. Plant Soil 2001, 237, 197–210. [Google Scholar] [CrossRef]
  9. Khan, K.S.; Joergensen, R.G. Response of white mustard (Sinapis alba) and the soil microbial biomass to P and Zn addition in a greenhouse pot experiment. J. Plant Nutr. Soil Sci. 2015, 178, 834–840. [Google Scholar] [CrossRef]
  10. Hou, E.; Chen, C.; Wen, D.; Liu, X. Phosphatase activity in relation to key litter and soil properties in mature subtropical forests in China. Sci. Total Environ. 2015, 515, 83–91. [Google Scholar] [CrossRef]
  11. Slazak, A.; Freese, D.; Matos, E.D.S.; Hüttl, R.F. Soil organic phosphorus fraction in pine-oak forest stands in Northeastern Germany. Geoderma 2010, 158, 156–162. [Google Scholar] [CrossRef]
  12. Kuehne, C.; Weiskittel, A.; Pommerening, A.; Wagner, R.G. Evaluation of 10-year temporal and spatial variability in structure and growth across contrasting commercial thinning treatments in spruce-fir forests of northern Maine, USA. Ann. For. Sci. 2018, 75, 20. [Google Scholar] [CrossRef]
  13. Hu, B.; Yang, B.; Pang, X.; Bao, W.; Tian, G. Responses of soil phosphorus fractions to gap size in a reforested spruce forest. Geoderma 2016, 279, 61–69. [Google Scholar] [CrossRef] [Green Version]
  14. Kim, S.; Li, G.; Han, S.H.; Kim, H.J.; Kim, C.; Lee, S.T.; Son, Y. Thinning affects microbial biomass without changing enzyme activity in the soil of Pinus densiflora Sieb. et Zucc. forests after 7 years. Ann. For. Sci. 2018, 75, 13. [Google Scholar] [CrossRef]
  15. Zhu, J.; Matsuzaki, T.; Lee, F.; Gonda, Y. Effect of gap size created by thinning on seedling emergency, survival and establishment in a coastal pine forest. For. Ecol. Manag. 2003, 182, 339–354. [Google Scholar] [CrossRef]
  16. Latif, Z.A.; Blackburn, G.A. The effects of gap size on some microclimate variables during late summer and autumn in a temperate broadleaved deciduous forest. Int. J. Biometeorol. 2010, 54, 119–129. [Google Scholar] [CrossRef] [PubMed]
  17. Ma, J.; Kang, F.; Cheng, X.; Han, H. Moderate thinning increases soil organic carbon in Larix principis-rupprechtii (Pinaceae) plantations. Geoderma 2018, 329, 118–128. [Google Scholar] [CrossRef]
  18. Lei, L.; Xiao, W.; Zeng, L.; Zhu, J.; Huang, Z.; Cheng, R.; Gao, S.; Li, M.H. Thinning but not understory removal increased heterotrophic respiration and total soil respiration in Pinus massoniana stands. Sci. Total Environ. 2017, 621, 1360–1369. [Google Scholar] [CrossRef]
  19. Netzer, F.; Thöm, C.; Celepirovic, N.; Ivankovic, M.; Alfarraj, S.; Dounavi, A.; Simon, J.; Herschbach, C.; Rennenberg, H. Drought effects on C, N, and P nutrition and the antioxidative system of beech seedlings depend on geographic origin. J. Plant Nutr. Soil Sci. 2016, 179, 136–150. [Google Scholar] [CrossRef]
  20. Richards, J.D.; Hart, J.L. Canopy gap dynamics and development patterns in secondary Quercus stands on the Cumberland Plateau, Alabama, USA. For. Ecol. Manag. 2011, 262, 2229–2239. [Google Scholar] [CrossRef]
  21. Chen, C.R.; Condron, L.M.; Xu, Z.H. Impacts of grassland afforestation with coniferous trees on soil phosphorus dynamics and associated microbial processes: A review. For. Ecol. Manag. 2008, 255, 396–409. [Google Scholar] [CrossRef]
  22. Magid, J.; Nielsen, N.E. Seasonal variation in organic and inorganic phosphorus fractions of temperate-climate sandy soils. Plant Soil 1992, 144, 155–165. [Google Scholar] [CrossRef]
  23. Frossard, E.; Condron, L.M.; Oberson, A.; Sinaj, S.; Fardeau, J.C. Processes governing phosphorus availability in temperate soils. J. Environ. Qual. 2000, 29, 15–23. [Google Scholar] [CrossRef]
  24. Wu, C.; Mo, Q.; Wang, H.; Zhang, Z.; Huang, G.; Ye, Q.; Zou, Q.; Kong, F.; Liu, Y.; Wang, G.G. Moso bamboo (Phyllostachys edulis (Carriere) J. Houzeau) invasion affects soil phosphorus dynamics in adjacent coniferous forests in subtropical China. Ann. For. Sci. 2018, 75, 24. [Google Scholar] [CrossRef]
  25. Zhao, Q.; Zeng, D.H.; Fan, Z.P.; Yu, Z.Y.; Hu, Y.L.; Zhang, J. Seasonal variations in phosphorus fractions in semiarid sandy soils under different vegetation types. For. Ecol. Manag. 2009, 258, 1376–1382. [Google Scholar] [CrossRef]
  26. Styles, D.; Coxon, C. Meteorological and management influences on seasonal variation in phosphorus fractions extracted from soils in western Ireland. Geoderma 2007, 142, 152–164. [Google Scholar] [CrossRef]
  27. Fabre, A.; Pinay, G.; Ruffinoni, C. Seasonal Changes in Inorganic and Organic Phosphorus in the Soil of a Riparian Forest. Biogeochemistry 1996, 35, 419–432. [Google Scholar] [CrossRef]
  28. Hooper, D.U.; Vitousek, P.M. Effects of plant composition and diversity on nutrient cycling. Ecol. Monogr. 1998, 68, 121–149. [Google Scholar] [CrossRef]
  29. Chen, C.R.; Condron, L.M.; Davis, M.R.; Sherlock, R.R. Seasonal changes in soil phosphorus and associated microbial properties under adjacent grassland and forest in New Zealand. For. Ecol. Manag. 2003, 177, 539–557. [Google Scholar] [CrossRef]
  30. Yuan, J.; Jose, S.; Hu, Z.; Pang, J.; Hou, L.; Zhang, S. Biometric and Eddy Covariance Methods for Examining the Carbon Balance of a Larix principis-rupprechtii Forest in the Qinling Mountains, China. Forests 2018, 9, 67. [Google Scholar] [CrossRef]
  31. Lun, F.; Liu, Y.; He, L.; Yang, L.; Liu, M.; Li, W. Life cycle research on the carbon budget of the Larix principis-rupprechtii plantation forest ecosystem in North China. J. Clean. Prod. 2018, 177, 178–186. [Google Scholar] [CrossRef]
  32. Cheng, X.; Kang, F.; Han, H.; Liu, H.; Zhang, Y. Effect of thinning on partitioned soil respiration in a young Pinus tabulaeformis plantation during growing season. Agr. For. Meteorol. 2015, 214–215, 473–482. [Google Scholar] [CrossRef]
  33. Shi, X.Z.; Yu, D.S.; Xu, S.X.; Warner, E.D.; Wang, H.J.; Sun, W.X.; Zhao, Y.C.; Gong, Z.T. Cross-reference for relating Genetic Soil Classification of China with WRB at different scales. Geoderma 2010, 155, 344–350. [Google Scholar] [CrossRef]
  34. Brookes, P.C.; Powlson, D.S.; Jenkinson, D.S. Measurement of microbial biomass phosphorus in soil. Soil Biol. Biochem. 1982, 14, 319–329. [Google Scholar] [CrossRef]
  35. Tabatabai, M.A.; Bremner, J.M. Use of p-nitrophenyl phosphate for assay of soil phosphatase activity. Soil Biol. Biochem. 1969, 1, 301–307. [Google Scholar] [CrossRef]
  36. Tiessen, H.; Moir, J. Characterization of available P by sequential extraction. In Soil Sampling and Methods of Analysis; Carter, M.R., Ed.; Lewis Publishers: Boca Raton, FL, USA, 1993. [Google Scholar]
  37. Murphy, J.; Riley, J.P. A modified single solution method for the determination of phosphate in natural waters. Anal. Chim. Acta 1962, 27, 31–36. [Google Scholar] [CrossRef]
  38. Bowman, R.A.; Cole, C.V. Transformations of organic phosphorus substrates in soils as evaluated by NaHCO3 extraction. Soil Sci. 1978, 125, 49–54. [Google Scholar] [CrossRef]
  39. Rodrigues, M.; Pavinato, P.S.; Withers, P.J.A.; Teles, A.P.B.; Herrera, W.F.B. Legacy phosphorus and no tillage agriculture in tropical oxisols of the Brazilian savanna. Sci. Total Environ. 2016, 542, 1050–1061. [Google Scholar] [CrossRef]
  40. Chaneton, E.J.; Lemcoff, J.H.; Lavado, R.S. Nitrogen and Phosphorus Cycling in Grazed and Ungrazed Plots in a Temperate Subhumid Grassland in Argentina. J. Appl. Ecol. 1996, 33, 291–302. [Google Scholar] [CrossRef]
  41. Saggar, S.; Hedley, C.B. Estimating seasonal and annual carbon inputs, and root decomposition rates in a temperate pasture following field 14C pulse-labelling. Plant Soil 2001, 236, 91–103. [Google Scholar] [CrossRef]
  42. Yang, K.; Zhu, J.; Yan, Q.; Sun, O.J. Changes in soil P chemistry as affected by conversion of natural secondary forests to larch plantations. For. Ecol. Manag. 2010, 260, 422–428. [Google Scholar] [CrossRef]
  43. Weihrauch, C.; Opp, C. Ecologically relevant phosphorus pools in soils and their dynamics: The story so far. Geoderma 2018, 325, 183–194. [Google Scholar] [CrossRef]
  44. Godlinski, F.; Reiche, E.W.; Lennartz, B.; Meissner, R. Simulation of phosphorus losses from lysimeters. J. Plant Nutr. Soil Sci. 2008, 171, 621–633. [Google Scholar] [CrossRef]
  45. Zhang, H.; Shi, L.; Wen, D.; Yu, K. Soil potential labile but not occluded phosphorus forms increase with forest succession. Biol. Fertility Soils 2016, 52, 41–51. [Google Scholar] [CrossRef]
  46. Özgül, M.; Günes, A.; Esringü, A.; Turan, M. The effects of freeze-and-thaw cycles on phosphorus availability in highland soils in Turkey. J. Plant Nutr. Soil Sci. 2012, 175, 827–839. [Google Scholar] [CrossRef]
  47. Whitehead, P.G.; Crossman, J. Macronutrient cycles and climate change: Key science areas and an international perspective. Sci. Total Environ. 2012, 434, 13–17. [Google Scholar] [CrossRef]
  48. Weintraub, S.R.; Wieder, W.R.; Cleveland, C.C.; Townsend, A.R. Organic matter inputs shift soil enzyme activity and allocation patterns in a wet tropical forest. Biogeochemistry 2013, 114, 313–326. [Google Scholar] [CrossRef]
  49. Gang, Q.; Yan, Q.; Zhu, J. Effects of thinning on early seed regeneration of two broadleaved tree species in larch plantations: Implication for converting pure larch plantations into larch-broadleaved mixed forests. Forestry 2015, 88, 573–585. [Google Scholar] [CrossRef]
  50. Johnson, A.H.; Frizano, J.; Vann, D.R. Biogeochemical implications of labile phosphorus in forest soils determined by the Hedley fractionation procedure. Oecologia 2003, 135, 487–499. [Google Scholar] [CrossRef]
  51. De Schrijver, A.; Vesterdal, L.; Hansen, K.; De Frenne, P.; Augusto, L.; Achat, D.L.; Staelens, J.; Baeten, L.; De Keersmaeker, L.; De Neve, S. Four decades of post-agricultural forest development have caused major redistributions of soil phosphorus fractions. Oecologia 2012, 169, 221–234. [Google Scholar] [CrossRef]
  52. Lang, F.; Bauhus, J.; Frossard, E.; George, E.; Kaiser, K.; Kaupenjohann, M.; Krüger, J.; Matzner, E.; Polle, A.; Prietzel, J.; et al. Phosphorus in forest ecosystems: New insights from an ecosystem nutrition perspective. J. Plant Nutr. Soil Sci. 2016, 179, 129–135. [Google Scholar] [CrossRef] [Green Version]
  53. He, Y.Q.; Zhu, Y.G.; Smith, S.E.; Smith, F.A. Interactions between soil moisture content and phosphorus supply in spring wheat plants grown in pot culture. J. Plant Nutr. 2002, 25, 913–925. [Google Scholar] [CrossRef]
  54. Huang, W.; Spohn, M. Effects of long-term litter manipulation on soil carbon, nitrogen, and phosphorus in a temperate deciduous forest. Soil Biol. Biochem. 2015, 83, 12–18. [Google Scholar] [CrossRef]
  55. Teles, A.P.B.; Rodrigues, M.; Herrera, W.F.B.; Soltangheisi, A.; Sartor, L.R.; Withers, P.J.A.; Pavinato, P.S. Do cover crops change the lability of phosphorus in a clayey subtropical soil under different phosphate fertilizers? Soil Use Manag. 2017, 33, 34–44. [Google Scholar] [CrossRef] [Green Version]
Figure 1. Flow chart of sequential P fractions.
Forests 10 00172 g001
Figure 2. Seasonal changes in total (a), labile (b), moderately labile (c) and non-labile P (d) in L. principis-rupprechtii plantations. Each bar represents an average value across thinning treatments and soil depths (n = 36), i.e., twelve plots × three soil depths. Error bars indicate standard error. Values within each sampling time followed by different letters differ significantly according to Tukey’s test (p < 0.05).
Forests 10 00172 g002
Figure 3. Response of total inorganic and organic P to thinning treatments at the three depths (0−10, 10−20 and 20−30 cm) at various sampling times in L. principis-rupprechtii plantations. CK, control site; LT, light thinning; MT, moderate thinning; HT, high thinning. Error bars indicate standard error (n = 3). Values within each sampling time followed by different letters differ significantly according to Tukey’s test (p < 0.05). When the difference was not statistically significant, no letter notation was noted.
Forests 10 00172 g003
Figure 4. Response of labile P fractions to thinning treatments at the three depths (0−10, 10−20 and 20−30 cm) at various sampling times in L. principis-rupprechtii plantations. CK, control site; LT, light thinning; MT, moderate thinning; HT, high thinning. Error bars indicate standard error (n = 3). Values within each sampling time followed by different letters differ significantly according to Tukey’s test (p < 0.05). When the difference was not statistically significant, no letter notation was noted.
Forests 10 00172 g004
Figure 5. Response of moderately labile P fractions to thinning treatments at the three depths (0−10, 10−20 and 20−30 cm) at various sampling times in L. principis-rupprechtii plantations. CK, control site; LT, light thinning; MT, moderate thinning; HT, high thinning. Error bars indicate standard error (n = 3). Values within each sampling time followed by different letters differ significantly according to Tukey’s test (p < 0.05). When the difference was not statistically significant, no letter notation was noted.
Forests 10 00172 g005
Figure 6. Response of non-labile P fractions to thinning treatments at the three depths (0−10, 10−20 and 20−30 cm) at various sampling times in L. principis-rupprechtii plantations. CK, control site; LT, light thinning; MT, moderate thinning; HT, high thinning. Error bars indicate standard error (n = 3). Values within each sampling time followed by different letters differ significantly according to Tukey’s test (p < 0.05). When the difference was not statistically significant, no letter notation was noted.
Forests 10 00172 g006
Figure 7. Effects of thinning treatments on soil temperature (a) and moisture (b) at various sampling times in L. principis-rupprechtii plantations. CK, control site; LT, light thinning; MT, moderate thinning; HT, high thinning. Values within each sampling time followed by different letters differ significantly according to Tukey’s test (p < 0.05). When the difference was not statistically significant, no letter notation was noted.
Forests 10 00172 g007
Figure 8. Effects of sampling times on soil pH in four thinning treatments in L. principis-rupprechtii plantations. CK, control site; LT, light thinning; MT, moderate thinning; HT, high thinning. Error bars indicate standard error (n = 9), i.e., three plots repeats × three soil depths. Values within each treatment followed by different letters differ significantly according to Tukey’s test (p < 0.05). When the difference was not statistically significant, no letter notation was noted.
Forests 10 00172 g008
Figure 9. Effects of thinning treatments on P in litter of L layer (a) and F/H layer (b) at various sampling times in L. principis-rupprechtii plantations. CK, control site; LT, light thinning; MT, moderate thinning; HT, high thinning; L layer, undecomposed litter; F/H layer, mixture of partly decomposed litter and amorphous humus. Error bars indicate standard error (n = 3). Values within each sampling time followed by different letters differ significantly according to Tukey’s test (p < 0.05). When the difference was not statistically significant, no letter notation was noted.
Forests 10 00172 g009
Table 1. Information on studied sites under four thinning treatments in 2014.
ThinningDensity (Trees hm−2)Stand Age (a)Slope Gradient (°)AspectElevation (m)Mean Height (m)Mean DBH (cm)
CK2096 ± 373525 ± 2.7N2327 ± 1614.2 ± 1.315.0 ± 0.3
LT1829 ± 83525 ± 0.3N2335 ± 314.1 ± 1.214.9 ± 0.4
MT1413 ± 73523 ± 0.3N2346 ± 615.9 ± 0.616.0 ± 0.2
HT1087 ± 53522 ± 1.5N2340 ± 1015.4 ± 1.316.8 ± 0.7
CK, control site; LT, light thinning; MT, moderate thinning; HT, high thinning; DBH, mean of diameter at breast height. Date (mean ± standard error, n = 3).
Table 2. Soil physical and chemical properties in studied sites under four thinning treatments in 2017.
ThinningSOC (g kg−1)TN (g kg−1)C/NMBP (mg kg−1)AcPME (μg g−1 h−1)
CK 39.2 ± 1.4 ab2.6 ± 0.1 a15.7 ± 0.822.6 ± 0.8 a435.9 ± 42.4
LT36.6 ± 0.8 a2.8 ± 0.1 ab13.0 ± 0.332.1 ± 3.2 ab416.2 ± 39.3
MT46.1 ± 1.5 c3.3 ± 0.2 b15.3 ± 0.937.0 ± 2.3 b510.0 ± 50.7
HT42.8 ± 1.5 bc3.2 ±0.2 b14.6 ± 0.829.6 ± 3.7 ab546.6 ± 47.4
Abbreviations see Table 1. SOC, soil organic carbon; TN, total nitrogen; MBP, microbial biomass P; AcPME, Acid phosphomonoesterase. Date followed by different letters differ significantly according to Tukey’s test (p < 0.05).
Table 3. Repeated-measures ANOVA for soil P fractions in four thinning treatments from April to October 2017 in L. principis-rupprechtii plantations.
DepthFactorsdfCorrelation IndexLabile PMod.Labile PNon-Labile PTotal PiTotal PoTotal Pt
0−10 cmThinning3F19.2 61.3 19.2 32.0 26.1 49.9
P<0.001<0.001<0.001<0.001<0.001<0.001
Season3F5.4 18.6 28.5 31.5 10.3 30.8
P0.004<0.001<0.001<0.001<0.001<0.001
T × S9F3.2 4.9 3.1 4.1 2.9 3.7
P0.008<0.0010.0090.0010.0120.003
10−20 cmThinning3F18.1 46.7 10.6 20.6 25.2 36.1
P<0.001<0.001<0.001<0.001<0.001<0.001
Season3F8.9 19.1 14.5 14.9 10.6 16.4
P<0.001<0.001<0.001<0.001<0.001<0.001
T × S9F1.9 2.9 1.5 1.2 3.9 2.4
P0.090.0120.190.3590.0020.036
20−30 cmThinning3F12.2 17.5 3.8 13.2 5.8 13.9
P<0.001<0.0010.019<0.0010.003<0.001
Season3F16.8 20.7 10.6 14.5 2.0 10.9
P<0.001<0.001<0.001<0.0010.131<0.001
T × S9F2.7 4.0 2.3 1.9 3.2 3.3
P0.020.0020.0420.090.0070.006
Note: df, degree of freedom; F, the F value of the corresponding factor; p, significant effects. Bold font indicates p < 0.05.
Table 4. Coefficient (r) for the pearson’s correlations between soil P fractions and soil property in L. principis-rupprechtii plantations.
Depth/cmSoil PropertiesR-PiBic-PoOH-PiOH-PoDil.HCl-PiTotal PiTotal PoTotal Pt
0−10SOC0.68 *0.69 *0.020.66 *0.66 *0.59 *0.60 *0.60 *
Moisture0.83 **0.94 **0.60 *0.85 **0.88 **0.86 **0.77 **0.83 **
pH−0.13−0.40−0.23−0.19−0.36−0.36−0.27−0.33
Temperature−0.22−0.160.36−0.130.090.150.070.12
MBP0.76 **0.550.84 **0.79 **0.74 **0.80 **0.91 **0.86 **
AcPME0.72 **0.82 **0.000.72 **0.69 *0.61 *0.60 *0.61 *
10−20SOC0.80 **0.91 **0.70 *0.76 **0.87 **0.88 **0.90 **0.91 **
Moisture0.59 *0.70 *0.69 *0.64 *0.79 **0.73 **0.74 **0.75 **
pH−0.15 −0.48−0.20−0.45−0.33−0.45−0.37−0.42
20−30SOC0.83 **0.78 **0.84 **0.80 **0.84 **0.88 **0.88 **0.95 **
Moisture0.58 *0.70 *0.85 **0.430.64 *0.79 **0.450.69 *
pH−0.04−0.61 *−0.08−0.56−0.28−0.34−0.44−0.41
* p < 0.05; ** p < 0.01.

