Article

Do High-Voltage Power Transmission Lines Affect Forest Landscape and Vegetation Growth: Evidence from a Case for Southeastern of China

1
College of Transportation and Civil Engineering, Fujian Agriculture and Forestry University, Fuzhou 350108, China
2
Maintenance Branch Company of State Grid Fujian Electric Power Co. Ltd., Fuzhou 350013, China
*
Author to whom correspondence should be addressed.
Forests 2019, 10(2), 162; https://doi.org/10.3390/f10020162
Submission received: 22 January 2019 / Revised: 11 February 2019 / Accepted: 12 February 2019 / Published: 14 February 2019

Abstract

:
The rapid growth of the network of high-voltage power transmission lines (HVPTLs) is inevitably covering more forest domains. However, no direct quantitative measurements have been reported of the effects of HVPTLs on vegetation growth. Thus, the impacts of HVPTLs on vegetation growth are uncertain. Taking one of the areas with the highest forest coverage in China as an example, the upper reaches of the Minjiang River in Fujian Province, we quantitatively analyzed the effect of HVPTLs on forest landscape fragmentation and vegetation growth using Landsat imageries and forest inventory datasets. The results revealed that 0.9% of the forests became edge habitats assuming a 150 m depth-of-edge-influence by HVPTLs, and the forest plantations were the most exposed to HVPTLs among all the forest landscape types. Habitat fragmentation was the main consequence of HVPTL installation, which can be reduced by an increase in the patch density and a decrease in the mean patch area (MA), largest patch index (LPI), and effective mesh size (MESH). In all the landscape types, the forest plantation and the non-forest land were most affected by HVPTLs, with the LPI values decreasing by 44.1 and 20.8%, respectively. The values of MESH decreased by 44.2 and 32.2%, respectively. We found an obvious increasing trend in the values of the normalized difference vegetation index (NDVI) in 2016 and NDVI growth during the period of 2007 to 2016 with an increase in the distance from HVPTL. The turning points of stability were 60 to 90 meters for HVPTL corridors and 90 to 150 meters for HVPTL pylons, which indicates that the pylons have a much greater impact on NDVI and its growth than the lines. Our research provides valuable suggestions for vegetation protection, restoration, and wildfire management after the construction of HVPTLs.

1. Introduction

To meet the constantly growing electricity demands and to reduce electricity transmission losses, countries in Europe, North America, and Asia are attempting to develop high-voltage power transmission lines (HVPTLs) including pylons [1,2]. HVPTLs have become globally necessary components of power transmission infrastructure, covering 5.5 million km in 2014, with predictions that this will increase to 6.8 million km in 2020 [3]. Likewise, the development of HVPTL in China is expected to increase, to reduce electricity transmission energy losses, since long distances exist between power stations and end-users [4]. With the rapid growth of the electricity grid, HVPTLs will inevitably cover more complex environments, such as mountains and forests, compared to plains and cultivated lands [5]. The large-scale increase of this infrastructure necessitates the assessment of its degree of impact on vegetation. One of the typical environmental management strategies in the State Grid of China is to clear vegetation (e.g., grass and shrubs) along HVPTLs within a certain buffer zone (e.g., 50–100 m) every two to three years [6]. Forest fragmentation caused by the construction of HVPTLs has been reported in a previous study [7]. However, no direct quantitative measurements of the effects of HVPTL on vegetation growth have been reported. In order to minimize potentially negative effects on vegetation, as well as its associated impacts on wildfires and wildlife, further knowledge on the impact of HVPTL on vegetation is crucial.
Electricity systems are commonly composed of three sections: power generation plants, power transmission facilities, and consumers. Among the three sections, transmission facilities act as a bridge connecting the power produced in the plants and the end users. The elements of the transmission facilities include power lines and power pylons or towers [8]. The transmission of electricity covers large areas and can produce many negative impacts [9]. Consequently, the possible impacts of HVPTL have attracted considerable public attention [2,10], including risks to health and safety due to electric and magnetic fields [4,11], environmental risks from electromagnetic fields [10], biological effects of electromagnetic fields [4], visual and perception impacts [5,8], and property values [2]. For example, Tong et al. [11] studied the effects of the electric field of a 500 kV overhead transmission line on a building and found that high-voltage cables can generate intense electric fields and the fields vary across locations of buildings relative to their overhead cable. This provides a good reference for building design. Porsius et al. [10] investigated the nocebo responses to HVPTLs, suggesting an increasing tendency in the number of health occurrences after exposure to HVPTLs. Previous studies have reported that HVPTLs increase the risk of thunderstorm asthma and childhood leukemia [12] and has limited impacts on male reproductive capacity [4]. A monetary quantification evaluation for eliminating the decline in the aesthetic quality caused by overhead HVPTLs was conducted, revealing a regional variation in the willingness to pay across different landscape contexts in Italy [8]. Remote sensing technology has been applied to monitor electric transmission infrastructures. For example, Qin et al. [3] and Schmidt et al. [13] used Light Detection and Ranging (LiDAR) data and high-resolution aerial imagery to produce geospatial maps of electric power infrastructure, which are valuable for analysis, planning, and risk evaluation.
Many of the aforementioned studies focused on the impact of HVPTLs on humans; however, many other studies have examined the environmental and biological effects of HVPTLs [4]. For example, environmental effects indicate that corona ions generated by HVPTLs can change the surrounding electrical environment, thus increasing aerosol charge levels [14]. The concentration of charged particles was found to be more than two times greater than the mean background value [15]. In another study, calving site locations and area uses were compared during the calving period before, during, and after the construction of a power line in Norway. The findings indicated that power line disturbances do not cause avoidance effects for wild ungulates, whereas construction activities can induce a temporary reduction in area use [16]. Inspections of vegetation encroachment in the power line corridor have been conducted based on high spatial resolution hyperspectral imagery, satellite imagery, and LiDAR data [17,18] because vegetation growth plays a critical role in fire risk in power line corridors [19]. However, few studies have examined the vegetation effects of HVPTLs; hence, more research is needed to provide valuable recommendations for wildfire management and forest protection.
As airborne and aerospace remote sensors can quickly obtain a wide range of data from different altitudes, large scales, and multiple spectra, they have been extensively and successfully applied to meteorological observations, resource surveys, mapping, and military reconnaissance [20,21]. Satellite imagery has been successfully applied in HVPTL-related studies, such as high-resolution aerial imagery to classify electric power transmission lines [13] and LiDAR data to detect power line corridors [3]. The combination of high-resolution hyperspectral satellite images and LiDAR data was employed for vegetation management in HVPTL corridors [17], and satellite images have been combined with multimedia wireless sensor networks to improve the monitoring accuracy of vegetation. To the best of our knowledge, few studies have been published on the application of multi-spectral remote sensing in detecting the vegetation change response to HVPTLs. In multi-spectral remote sensing images, vegetation has the following characteristics due to the cellular structure of leaves: (1) High reflectance in the near-infrared (NIR) band and strong absorption in the red band due to chlorophyll; (2) by using an algorithm to divide the NIR by the red band (R), the vegetation area on the image has a relative height value and reaches a saturation value when the green biomass is high. Based on the characteristics of vegetation, the normalized difference vegetation index (NDVI) was introduced by Rouse et al. [22]. This is the current optimal indicator for identifying vegetation coverage and its growth status [23]. Due to the convenience and feasibility of detecting vegetation using remote sensing, we extracted the NDVI to quantify the vegetation change dynamics in HVPTL corridors.
In this study, the effects of HVPTL on the changes of vegetation and forest landscape fragmentation in the upper reaches of the Minjiang River of Fujian Province, China were observed based on a comprehensive analysis of multi-source data using remote sensing (RS) and geographic information systems (GIS). The objectives of this study were (1) to identify whether and to what extent the construction of HVPTLs, both line corridors and pylons, impacts vegetation growth in its edge areas, and (2) to quantify the impact of the construction of HVPTL on the forest landscape structure. Thus, our research provides valuable information for wildfire management in HVPTL corridors, and vegetation protection and restoration along the edge habitats beyond the HVPTL corridor.

2. Materials and Methods

2.1. Study Area

Sanming City was selected as the study site to assess changes in vegetation and forest landscape fragmentation before and after HVPTL construction. This study area (116°22′–118°39′ E, 25°30′–27°07′ N) is located in the western part of the Fujian Province in Southeastern China (Figure 1), in the upper reaches of the Minjiang River, which has the seventh highest annual runoff in China [24,25]. Sanming City was suitable for this study for two reasons: (1) It is located in the middle subtropical area and is unique for its climatic and terrain features, with high biological diversity and lush vegetation. The proportion of forest is higher than 80% in the region. (2) Due to HVPTL construction and development in recent years, the forest in this zone has experienced increasing disturbances (e.g., affected vegetation growth, forest fires, and reduced forest area). Maintaining a harmonious relationship between HVPTL extension and the changes in vegetation and forest landscape fragmentation is one of the key scientific issues for this region and other parts of the world.

2.2. Data Sources and Pre-Processing

The Forest Resources Inventory Database (FRID), NDVI, and HVPTL distribution map were used in this study. The FRID records forest characteristics and some growing factors at the forest patch level, such as tree species, tree age, tree height, slope, and altitude. The 2016 FRID, obtained from the local Forestry Bureau, was used to extract the spatial distribution of different forest vegetation types [24,26]. The NDVI data of the study area from 2007 and 2016 were extracted from Landsat remote sensing images. Landsat TM images from 2007 and Landsat OLI images from 2016 were acquired from the U.S. Geological Survey (USGS) (https://glovis.usgs.gov/) over a period of nine years. Data pre-processing included radiometric calibration, atmospheric calibration, and registration [27,28,29]. The HVPTL dataset of the study site was obtained from the Maintenance Branch Company of the State Grid Fujian Electric Power Co., Ltd. (Fuzhou, China).

2.3. Calculation of the NDVI

NDVI is currently the optimal indicator for identifying and assessing vegetation cover and growth status on different scales [30,31,32]. The effect of sensor degradation may be reduced by normalizing the spectral bands of the calculation of NDVI [32] as follows:
NDVI = (ρNIRρRed)/(ρNIR + ρRed)
where the ρNIR and ρRed are the planetary reflectance of infrared and near-infrared band in the TM and OLI sensors, respectively.
To evaluate the effects of HVPTLs on edge vegetation, 10 buffer zones, each with a width of 30 m, were created from the HVPTL outwards towards their edge vegetation. These buffers were then superimposed on the NDVI maps, and the average value of the vegetation index for each buffer was calculated using the spatial analysis tool of the GIS.

2.4. Landscape Classification

For a comprehensive description of the forest landscape structure and fragmentation of the study region, the FRID image was classified into five categories (Table 1, Figure 2): (1) semi-natural forest, (2) forest plantation, (3) bamboo forest, (4) other forest, and (5) non-forest land. A uniform spatial resolution (5 × 5 m) of the forest landscape map was used in this study.

2.5. Calculation of Landscape Metrics

To investigate the effects of the HVPTLs on forest landscape change, both landscape- and class-level indices were used to quantify the area, shape, and diversity of the patches and landscape (Table 2). For landscape-level measurements, the selected indices included patch density (PD), largest patch index (LPI), mean patch area (MA), area-weighted mean shape index (AWMSI), Shannon’s diversity index (SHDI), Simpson’s diversity index (SIDI), Shannon’s evenness index (SHEI), and Simpson’s evenness index (SIEI). For class-level measurements, the applied indices included PD, LPI, MA, and effective mesh size (MESH). These indices were calculated using the Fragstats 3.4 program to compare the landscape structure and fragmentation with and without HVPTL scenarios [33]. The calculation formula and corresponding descriptions of the above indices can be found in the Fragstats manual [33,34].

3. Results and Discussion

3.1. Edge Habitat Impacts of the High-Voltage Power Transmission Lines

Previous studies suggested that the edge effect distances along roads vary considerably from several meters to several hundred meters [35,36]. For comparison, we analyzed the effect of HVPTLs on edge habitat using 10 buffers with 30 m intervals (Figure 3). The introduction of the HVPTLs to the forest landscape resulted in 0.9% (1052 ha) of the vegetation as a whole becoming HVPTL edge habitat, assuming a 150 m depth-of-edge-influence, and 1.8% (2119 ha) assuming a 300 m depth-of-edge-influence. Then, we calculated the proportion of each forest type in each buffer along the edge habitat areas. This showed that the proportion of forests gradually increased with increasing distance from HVPTLs for semi-natural forest (from 23.1 to 26.1%) and the non-forest land (from 3.7 to 6.5%). The proportion of the other forest types declined from 5.0 to 2.4% as the distance increased from HVPTLs. The proportion of the forest plantation type decreased notably at first, then increased slightly with increasing distance from the HVPTL. Bamboo forest showed an opposite trend to the plantation, with an initial slight increase and then decreasing obviously with increased distance. As shown in Figure 3, among all the landscapes, the proportions of the forest plantation were the highest, accounting for more than 50% of all the 10 HVPTL depths-of-edge. The proportions of the semi-natural forest ranked second among all the landscapes, accounting for 20 to 30% of all the 10 depths-of-edge of the HVPTLs. The proportions of non-forest and other forest types were relatively low, accounting for 2 to 7% of all 10 depths-of-edge of the HVPTLs. This effect showed that the forest plantations and semi-natural forests were the habitat types that were most affected by HVPTLs in the study area. The reason for this is that the study area is dominated by forests, accounting for more than 80% of the total land area, and the plantations (i.e., forest plantations) are the main components of the forest landscape (Figure 2).
Using GIS to calculate the area of various forest landscapes (Figure 2), the proportions of forest plantations, semi-natural forests, bamboo forests, other forests, and non-forest lands were 36.6, 19.6, 23.5, 2.83, and 17.5%, respectively. The proportion of forest plantation in the HVPTL corridor was significantly higher than in the entire study area. This indicates that the forest plantation was the most affected landscape type during and after the construction of HVPTL, whereas bamboo forests and non-forest lands were less affected by the construction of HVPTL. This is in line with a previous finding, which indicated that power lines inevitably cross more forests with the rapid development of the network grid [3]. This, in turn, increases forest fragmentation to a certain degree [7]. This is discussed in the next section.

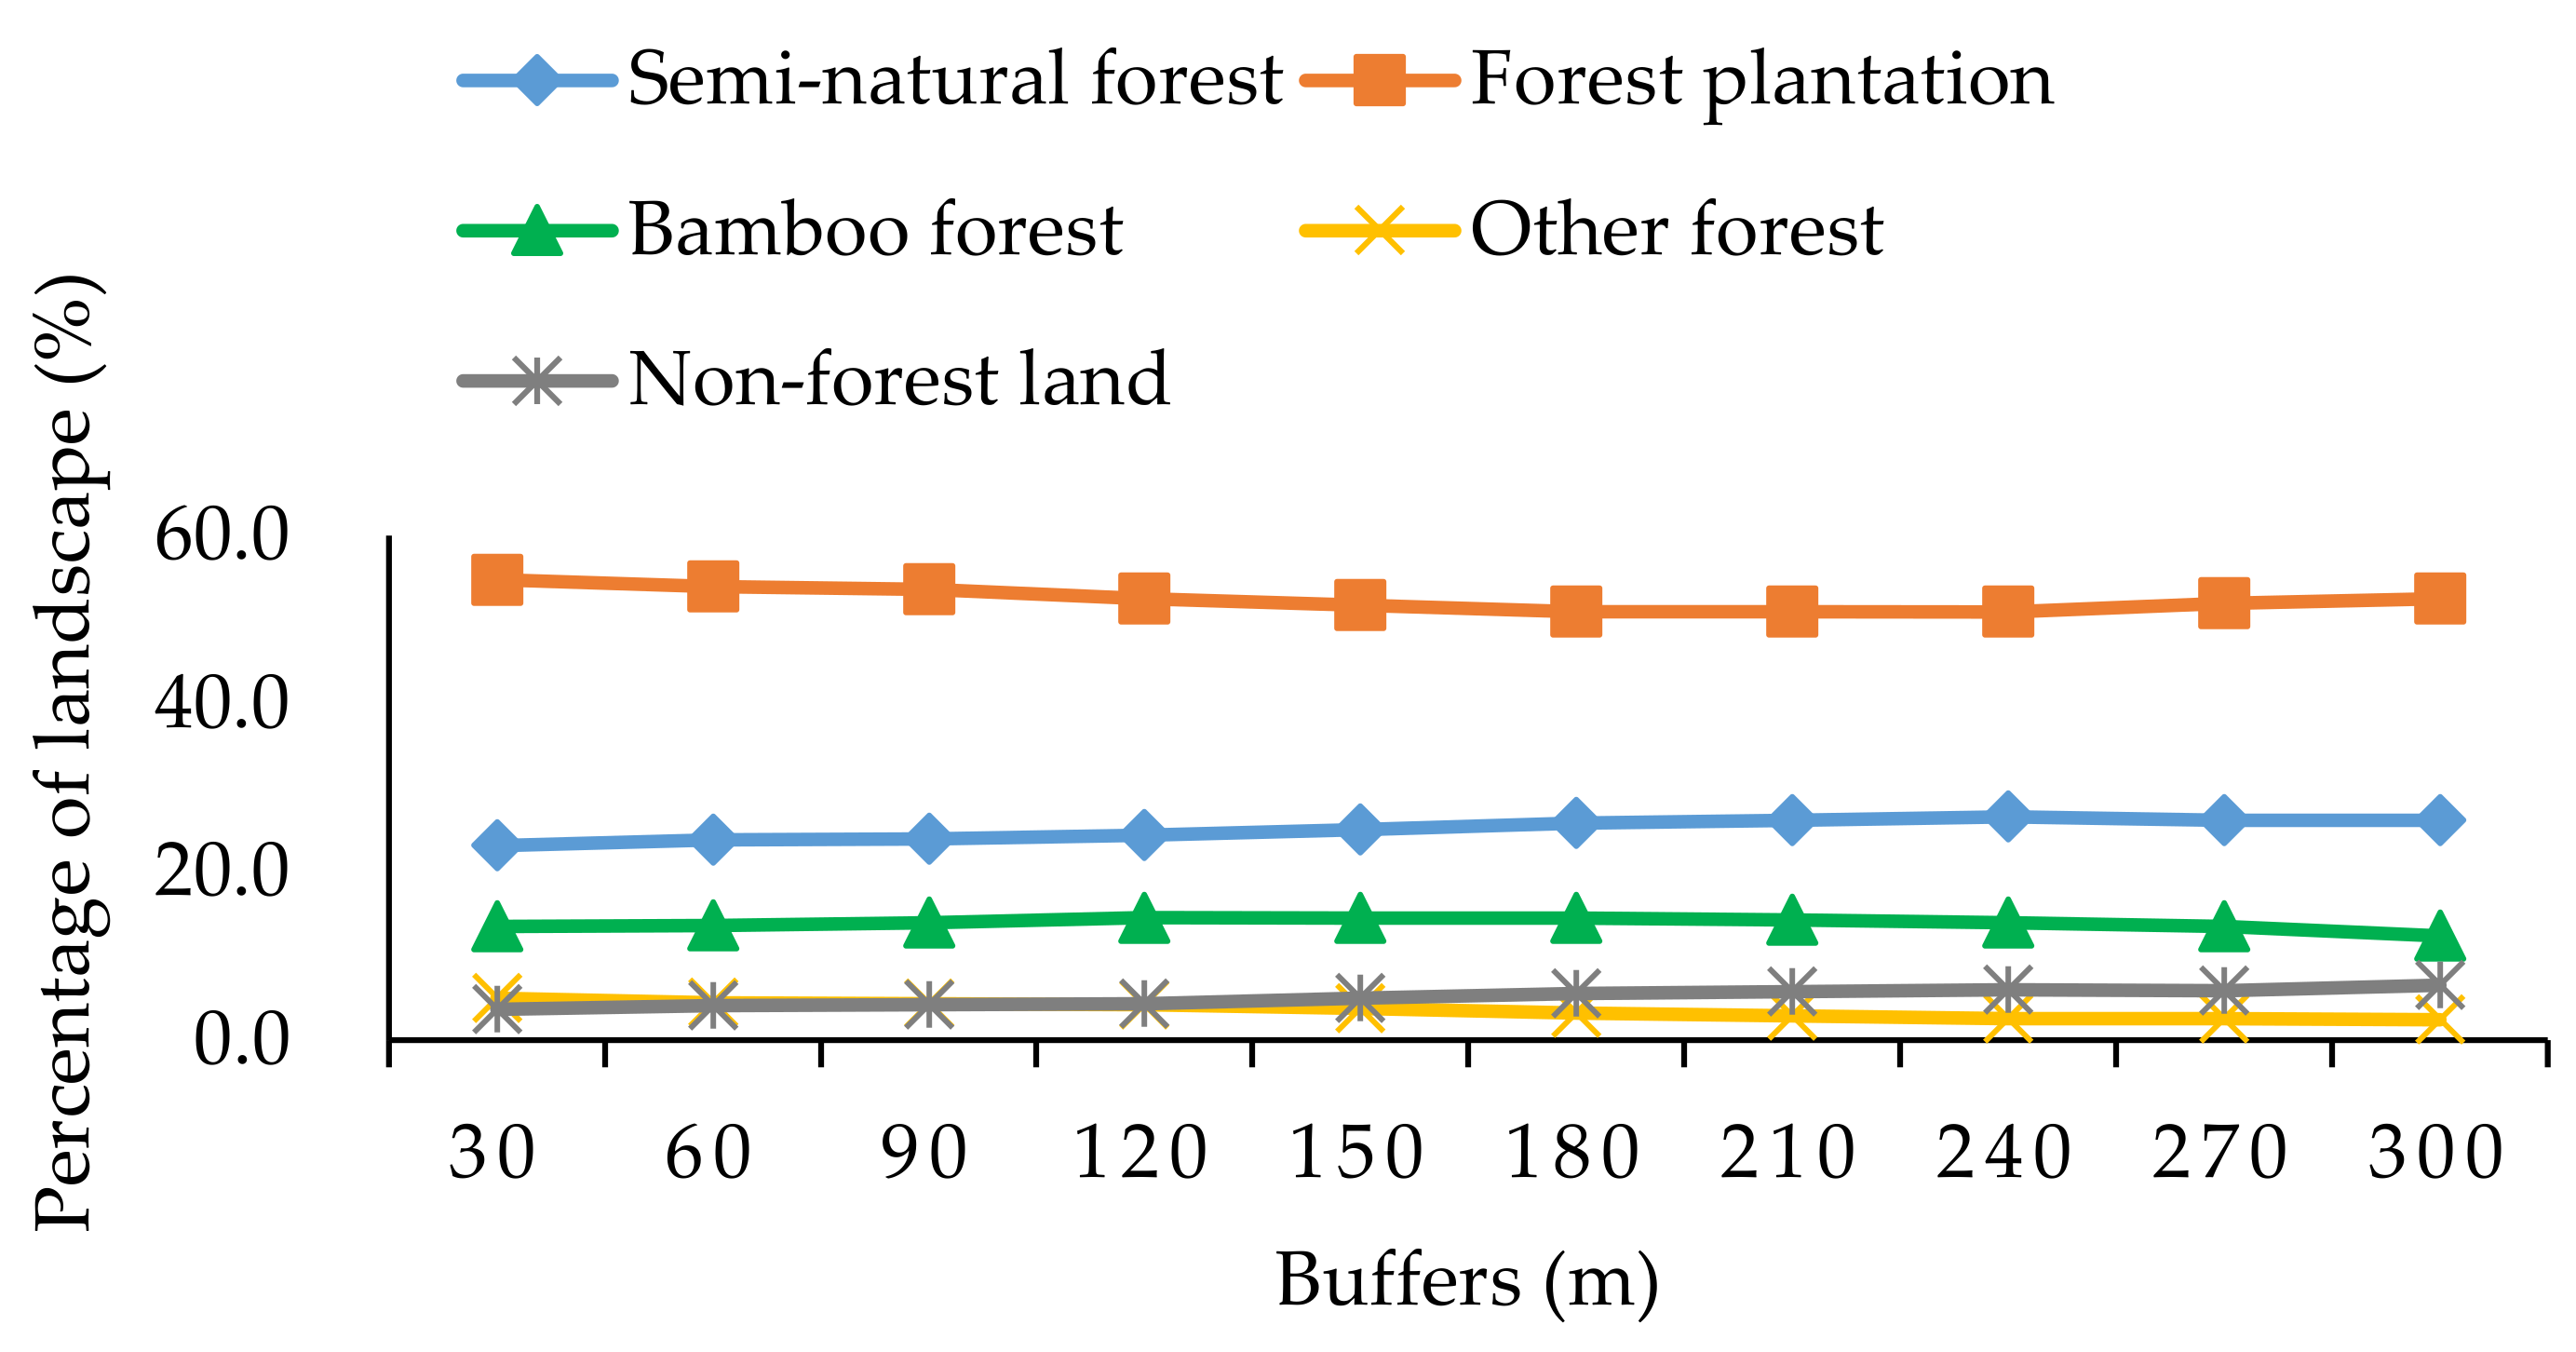
3.2. Effects of HVPTL on Forest Landscape Fragmentation

Combining the HVPTLs with the forest landscape map of 2016 showed the effects of HVPTLs on the structure of the forest landscape by introducing landscape metrics at both the landscape and class levels (Figure 4 and Figure 5). The introduction of HVPTLs to the 2016 landscape increased the number and proportion of patches by 1.610 and 1.9%, respectively, and decreased the largest patch index by 2.297 and 20.8%, respectively (Figure 4). Mean patch area decreased by 0.271 and 2.0%, and the area-weighted mean shape index decreased from 12.135 to 9.896, with a decreasing ratio of 18.5% (Figure 4). These measures indicate that HVPTL causes an overall degree of fragmentation in the forest landscape. However, little effect of HVPTLs was observed on the diversity (i.e., SHDI and SIDI) and dominance (i.e., SHEI and SIEI) of the landscape, which means there is no significant difference in the overall heterogeneity of the landscapes with and without HVPTL.
Concerning the HVPTL effects of fragmentation on each landscape type, Figure 5 shows that the class-level measurements indicated a clear pattern of fragmentation caused by HVPTLs in each landscape. This is illustrated by the increase in the PD and decrease in the MA, LPI, and MESH. In all landscape types, forest plantation and non-forest land were most affected by HVPTL construction, with the values of LPI decreasing by 44.1 and 20.8%, respectively, and the values of MESH decreasing by 44.2 and 32.2%, respectively.
Even though the overall landscape diversity has not been strongly affected by HVPTL construction, subtler habitat fragmentations may have a significant impact on the conservation of sensitive interior forest species [37]. For example, the implications of decreasing MA and MESH, combined with the aforementioned area-of-edge-influence, manifest largely in the reduction of the amount of interior habitat in forest plantations available for sensitive interior species. The corridors created by the HVPTLs can increase human disturbances of the sensitive interior species. Notably, the most affected habitat type—forest plantation—has a relatively low species richness in the study area.

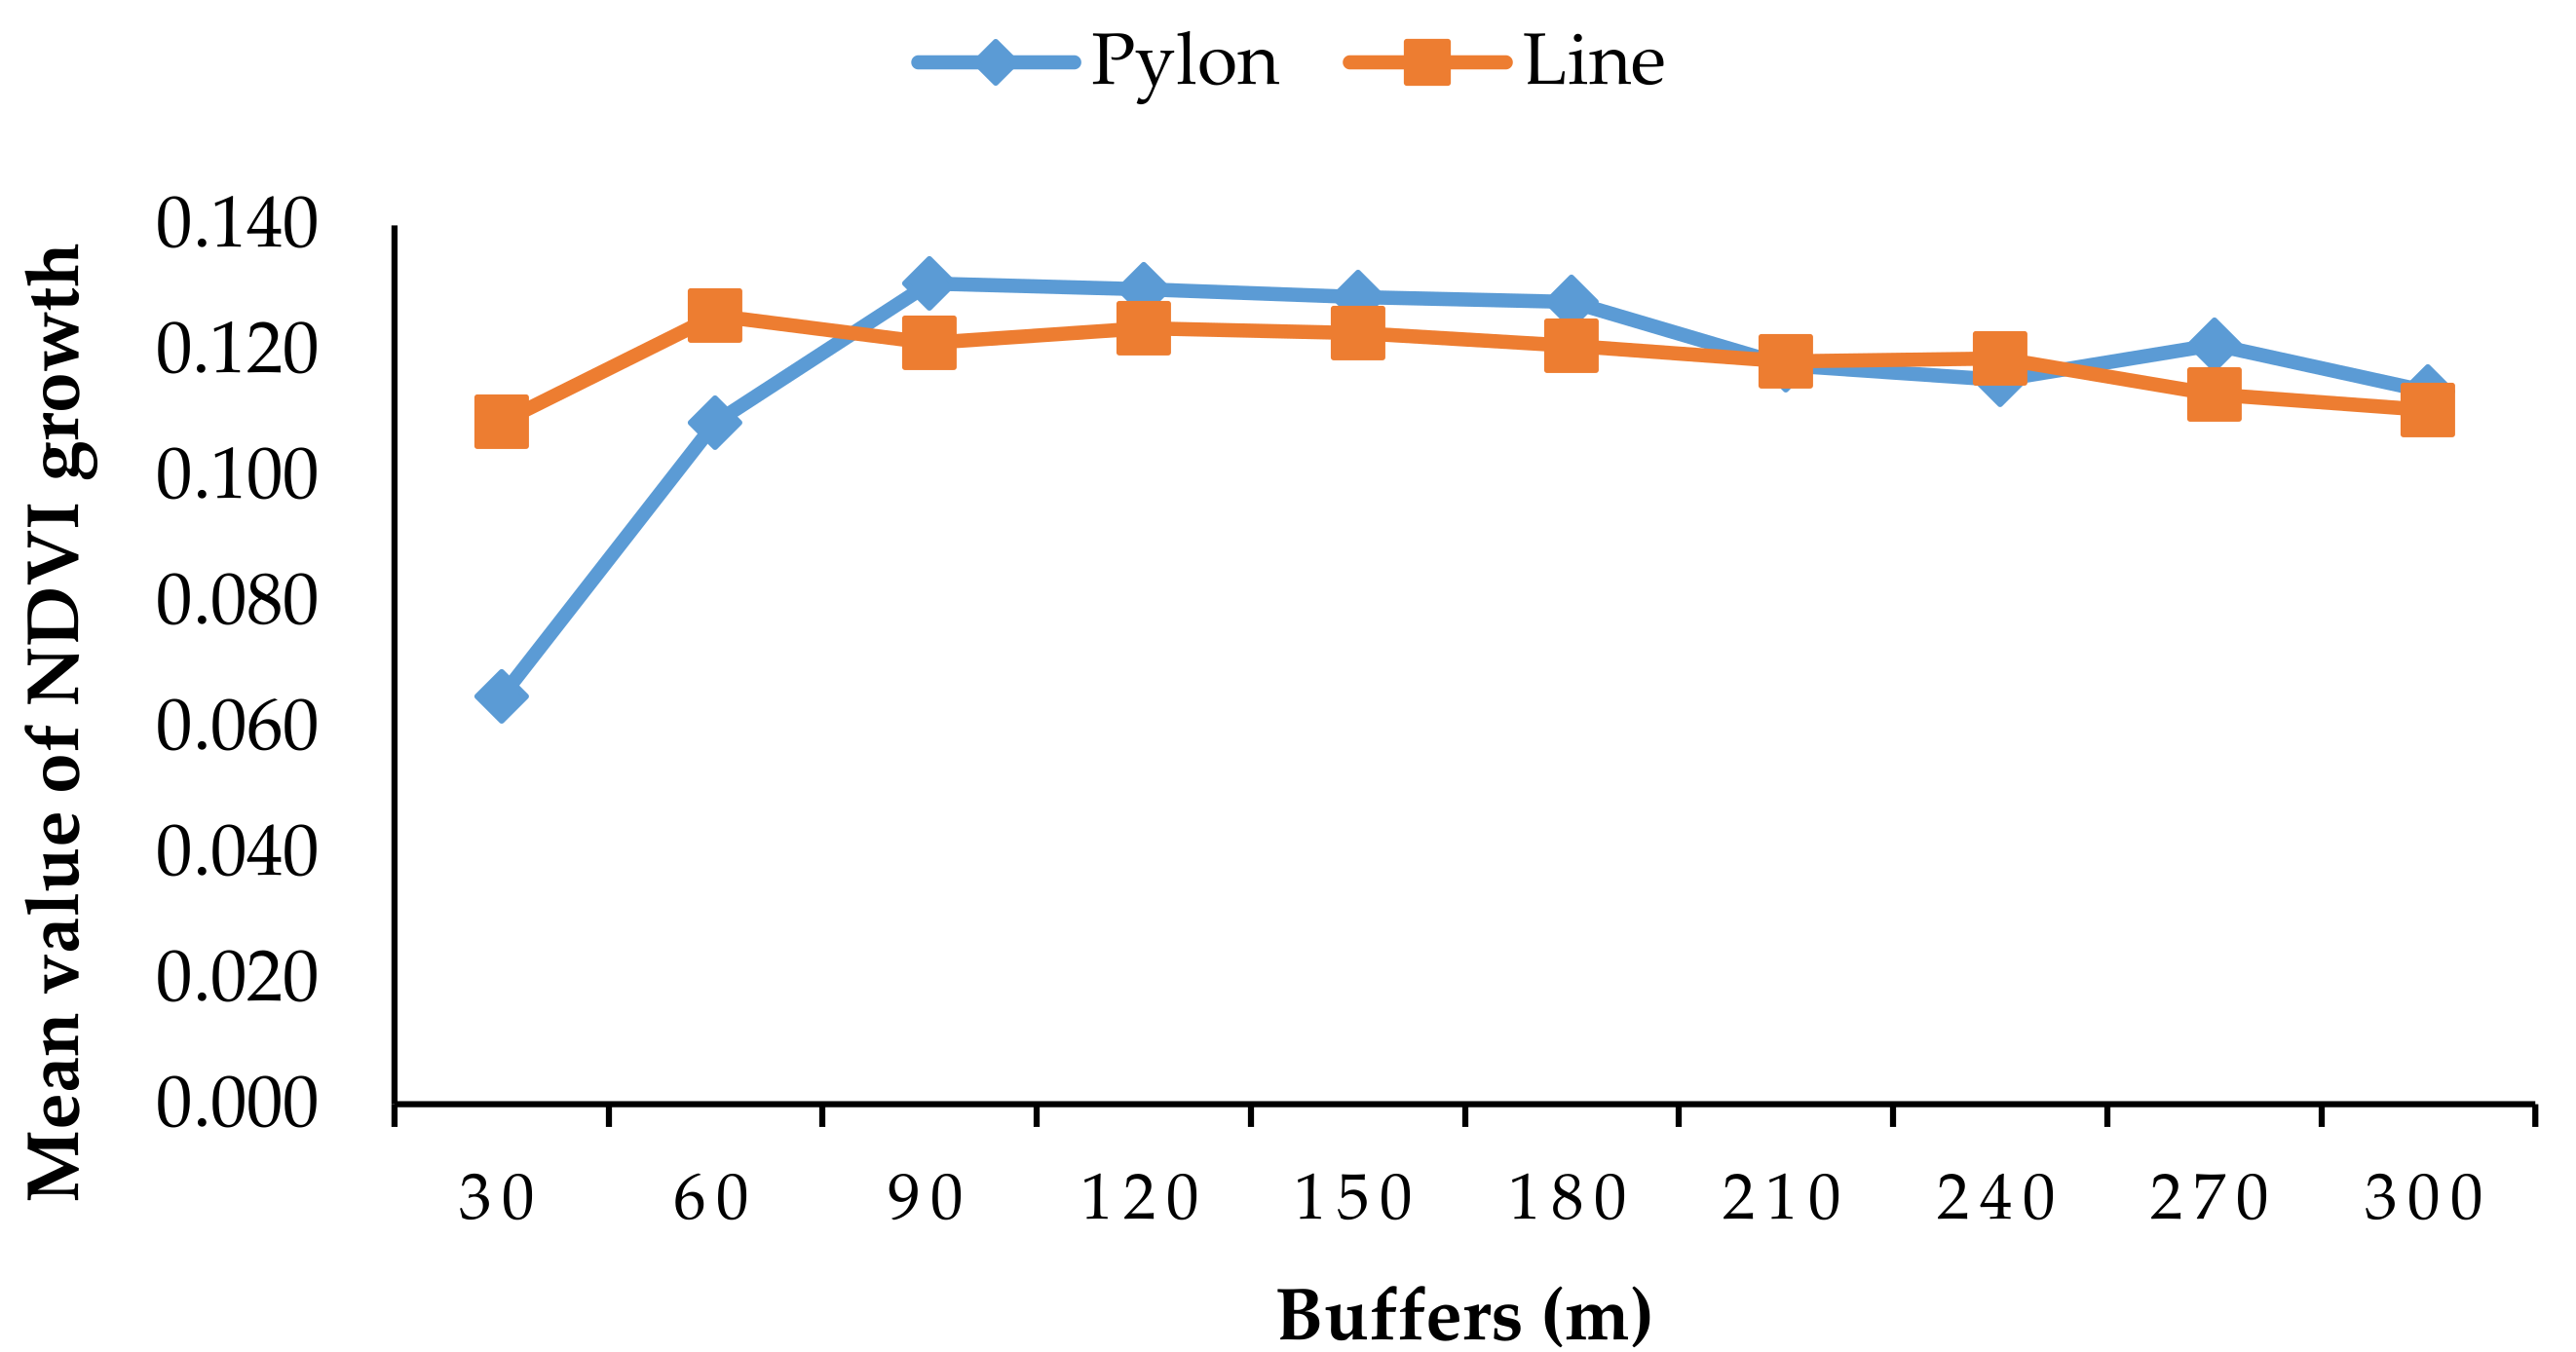
3.3 Effects of HVPTL on Vegetation Growth Dynamics

To observe the effects of HVPTLs (both lines and pylons) on NDVI, we delimited 10 buffer zones from high voltage lines and pylons to 30 m away (Figure 6, Figure 7, Figure 8 and Figure 9).
Figure 6, Figure 7 and Figure 8 show a similar trend between the pylons’ and the lines’ effects, with an obviously increasing trend in the NDVI value with increasing distance from the HVPTLs. The difference between the two curves is that the NDVI value in the line reached a smooth level 90 m away, whereas the NDVI value for the pylons reached a smooth level 150 m away. The NDVI values for the lines were significantly higher than those for the pylons before reaching a plateau. Then, their values were similar after reaching the peak. Simultaneously, we analyzed the NDVI growth in the corridors (i.e., buffer zones) of HVPTLs, which revealed that NDVI showed different degrees of increasing trends in different buffer zones (Figure 9). However, the trend in NDVI growth varied in different buffers, with the NDVI growing slower near HVPTLs. NDVI growth tended to be stable 60 m from the HVPTL lines, whereas they became stable at 90 m from HVPTL pylons. These results reveal that pylons have a much greater impact on NDVI and its value than the high-voltage lines, regardless of the magnitude or range of the influence.
The reasons for the above effects of HVPTLs on NDVI are as follows: (1) The construction of HVPTLs is the primary driving factor that induces a temporary reduction in NDVI and its growth in the corridors. According to the regulations of the State Grid of China on environmental management [6], the vegetation along the HVPTL corridors (within 50 to 100 m) is usually cleared every two or three years. This was verified using the results of this study, which show that the NDVI within the 50–90 m buffer zone is significantly lower than in the farther regions, and the NDVI growth within the 60–90 m buffer zone is significantly lower than in the farther buffers. (2) In contrast with the irregular edges created by natural disturbances (e.g., fire and windthrow)—where there is progressive vegetation recovery, especially in the subtropical region (i.e., this study area) with sufficient hydrothermal conditions—HVPTL corridors tend to exist long-term and suffer from frequent disturbances, e.g., vegetation clearance every two to three years. (3) The forest edge experiences microclimatic changes, including increased evaporation, increased temperature, solar radiation enhancement, and soil moisture reduction [38]. (4) Some previous findings indicated that the strong electric fields generated from power lines impact human health [11], whereas others have revealed that the electric field may not be a disturbance for wild ungulates [16]. Though there are many applications of satellite imagery for vegetation growth near power lines [18], whether high-voltage magnetic fields and their electric fields affect NDVI is still unclear and requires further research.

4. Conclusions

To minimize the potentially negative effects on vegetation and closely associated wildfire, further knowledge on the impact of HVPTLs on vegetation and forests is required. To this end, taking one of the areas with the highest forest coverage in China as a case (the upper reaches of the Minjiang River in Fujian Province), we quantitatively analyzed the effect of HVPTLs on forest landscape patterns and vegetation growth using Landsat images and forest inventory datasets.
The results revealed that 1.8% of the vegetation as a whole becomes edge habitat, assuming a 300 m depth-of-edge-influence by HVPTLs. Forest plantations were substantially more exposed to HVPTLs compared with semi-natural forests, bamboo forests, and other forests.
Habitat fragmentation was the main HVPTL effect; this was highlighted by the increase in patch density and decrease in MA, LPI, and MESH. In all the landscape types, forest plantations and non-forest land were most affected by HVPTLs, with the values of LPI decreasing by 44.1 and 20.8%, respectively, and the values of MESH decreasing by 44.2 and 32.2%, respectively.
Finally, we found that NDVI values increased with increasing distance from HVPTLs in 2016 and that NDVI growth increased from 2007 to 2016 with increasing distance from HVPTLs. Concerning the NDVI in 2016, the NDVI value for HVPTL plateaued at 90 m from the HVPTLs, whereas the NDVI value for the pylons plateaued at 150 m from HVPTLs. From 2007 to 2016, NDVI growth tended to stabilize 60 m from the HVPTL and 90 m from the pylons. This indicates that the pylons have a much greater impact on NDVI and its growth than the lines.
We provide strong evidence that HVPTLs occupy a considerable proportion of forest land, which can have a potentially detrimental impact not only on wildlife habitats but also on wildfire management. Quantitative remote sensing methods combined with ordinary GIS software enables analyses to be easily and quickly replicated. These analyses could provide decision support for vegetation protection, restoration, and wildfire management after the construction of HVPTLs.

Author Contributions

Conceptualization, Y.-Y.L.; Methodology, X.L.; Software, X.L.; Validation, X.L. and Y.-Y.L.; Formal Analysis, X.L. and Y.-Y.L.; Investigation, X.L.; Resources, X.L. and Y.-Y.L.; Data Curation, X.L. and Y.-Y.L.; Writing-Original Draft Preparation, X.L.; Writing-Review & Editing, Y.-Y.L.; Visualization, X.L. and Y.-Y.L.; Supervision, Y.-Y.L.

Funding

This research was funded by the National Natural Science Foundation of China under grant number 41201100 and the Natural Science Foundation of Fujian under grant number 2015J01606.

Acknowledgments

We are very grateful to all those who provided the raw data used for our research, especially to the Maintenance Branch Company of State Grid Fujian Electric Power Co.,Ltd for providing us with the HVPTL dataset, and the Forestry Bureau of Sanming City in Fujian Province providing us with the forest inventory datasets. This study was funded by the Natural Science Foundation of Fujian (No. 2015J01606), to which we are also very grateful. And many thanks for the support provided by the National Natural Science Foundation of China (No.41201100).

Conflicts of Interest

The authors declare no conflict of interest.

References

  1. Bamigbola, O.; Ali, M.; Oke, M. Mathematical modeling of electric power flow and the minimization of power losses on transmission lines. Appl. Math. Comput. 2014, 241, 214–221. [Google Scholar] [CrossRef]
  2. Cain, N.L.; Nelson, H.T. What drives opposition to high-voltage transmission lines? Land Use Policy 2013, 33, 204–213. [Google Scholar] [CrossRef]
  3. Qin, X.; Wu, G.; Ye, X.; Huang, L.; Lei, J. A Novel Method to Reconstruct Overhead High-Voltage Power Lines Using Cable Inspection Robot LiDAR Data. Remote Sens. 2017, 9. [Google Scholar] [CrossRef]
  4. Wu, S.; Di, G.; Li, Z. Does static electric field from ultra-high voltage direct-current transmission lines affect male reproductive capacity? Evidence from a laboratory study on male mice. Environ. Sci. Pollut. Res. 2017, 24, 18025–18034. [Google Scholar] [CrossRef] [PubMed]
  5. Soini, K.; Pouta, E.; Salmiovirta, M.; Uusitalo, M.; Kivinen, T. Local residents’ perceptions of energy landscape: the case of transmission lines. Land Use Policy 2011, 28, 294–305. [Google Scholar] [CrossRef]
  6. Xu, K.; Zhang, X.; Chen, Z.; Wu, W.; Li, T. Risk assessment for wildfire occurrence in high-voltage power line corridors by using remote-sensing techniques: A case study in Hubei Province, China. Int. J. Remote Sens. 2016, 37, 4818–4837. [Google Scholar] [CrossRef]
  7. Luken, J.O.; Hinton, A.C.; Baker, D.G. Forest edges associated with power-line corridors and implications for corridor siting. Landsc. Urban Plan. 1991, 20, 315–324. [Google Scholar] [CrossRef]
  8. Tempesta, T.; Vecchiato, D.; Girardi, P. The landscape benefits of the burial of high voltage power lines: A study in rural areas of Italy. Landsc. Urban Plan. 2014, 126, 53–64. [Google Scholar] [CrossRef]
  9. Doukas, H.; Karakosta, C.; Flamos, A.; Psarras, J. Electric power transmission: An overview of associated burdens. Int. J. Energy Res. 2010, 35, 979–988. [Google Scholar] [CrossRef]
  10. Porsius, J.T.; Claassen, L.; Woudenberg, F.; Smid, T.; Timmermans, D.R. Nocebo responses to high-voltage power lines: Evidence from a prospective field study. Sci. Total Environ. 2016, 543, 432–438. [Google Scholar] [CrossRef] [PubMed]
  11. Tong, Z.; Dong, Z.; Ashton, T. Analysis of electric field influence on buildings under high-voltage transmission lines. IET Sci. Meas. Technol. 2016, 10, 253–258. [Google Scholar] [CrossRef]
  12. Redmayne, M. A proposed explanation for thunderstorm asthma and leukemia risk near high-voltage power lines: A supported hypothesis. Electromagn. Biol. Med. 2018, 37, 57–65. [Google Scholar] [CrossRef] [PubMed]
  13. Schmidt, E.H.; Bhaduri, B.L.; Nagle, N.; Ralston, B.A. Supervised Classification of Electric Power Transmission Line Nominal Voltage from High-Resolution Aerial Imagery. GISci. Remote Sens. 2018, 55, 1–20. [Google Scholar] [CrossRef]
  14. Wright, M.D.; Buckley, A.J.; Matthews, J.C.; Shallcross, D.E.; Henshaw, D.L. Air ion mobility spectra and concentrations upwind and downwind of overhead AC high voltage power lines. Atmos. Environ. 2014, 95, 296–304. [Google Scholar] [CrossRef]
  15. Jayaratne, E.; Ling, X.; Morawska, L. Comparison of charged nanoparticle concentrations near busy roads and overhead high-voltage power lines. Sci. Total Environ. 2015, 526, 14–18. [Google Scholar] [CrossRef] [PubMed] [Green Version]
  16. Colman, J.E.; Tsegaye, D.; Flydal, K.; Rivrud, I.M.; Reimers, E.; Eftestøl, S. High-voltage power lines near wild reindeer calving areas. Eur. J. Wildl. Res. 2015, 61, 881–893. [Google Scholar] [CrossRef]
  17. Frank, M.; Pan, Z.; Raber, B.; Lenart, C. Vegetation management of utility corridors using high-resolution hyperspectral imaging and LiDAR. Proceedings of 2010 2nd Workshop on Hyperspectral Image and Signal Processing: Evolution in Remote Sensing, Reykjavik, Iceland, 14–16 June 2010; IEEE: Piscataway, NJ, USA, 2010. [Google Scholar]
  18. Ahmad, J.; Malik, A.S.; Xia, L. Effective techniques for vegetation monitoring of transmission lines right-of-ways. Proceedings of 2011 IEEE International Conference on Imaging Systems and Techniques, Penang, Malaysia, 17–18 May 2011; IEEE: Piscataway, NJ, USA, 2011. [Google Scholar]
  19. Zhang, H.; Han, X.; Dai, S. Fire Occurrence Probability Mapping of Northeast China With Binary Logistic Regression Model. IEEE J-STARS 2013, 6, 121–127. [Google Scholar] [CrossRef]
  20. Hakkenberg, C.; Zhu, K.; Peet, R.; Song, C. Mapping multi-scale vascular plant richness in a forest landscape with integrated LiDAR and hyperspectral remote-sensing. Ecology 2018, 99, 474–487. [Google Scholar] [CrossRef] [PubMed]
  21. Lees, K.; Quaife, T.; Artz, R.; Khomik, M.; Clark, J. Potential for using remote sensing to estimate carbon fluxes across northern peatlands—A review. Sci. Total Environ. 2018, 615, 857–874. [Google Scholar] [CrossRef] [PubMed]
  22. Rouse, J.W.; Haas, R.H.; Scheel, J.A.; Deering, D.W. Monitoring Vegetation Systems in the Great Plains with ERTS. In Proceedings of the 3rd Earth Resource Technology Satellite (ERTS) Symposium, Washington, DC, USA, 10–14 December 1973. [Google Scholar]
  23. Carlson, T.N.; Ripley, D.A. On the relation between NDVI, fractional vegetation cover, and leaf area index. Remote Sens. Environ. 1997, 62, 241–252. [Google Scholar] [CrossRef]
  24. Lin, Y.; Hu, X.; Zheng, X.; Hou, X.; Zhang, Z.; Zhou, X.; Qiu, R.; Lin, J. Spatial variations in the relationships between road network and landscape ecological risks in the highest forest coverage region of China. Ecol. Indic. 2019, 96, 392–403. [Google Scholar] [CrossRef]
  25. Hu, X.; Wu, C.; Hong, W.; Qiu, R.; Li, J.; Hong, T. Forest cover change and its drivers in the upstream area of the Minjiang River, China. Ecol. Indic. 2014, 46, 121–128. [Google Scholar] [CrossRef]
  26. Guan, J.; Zhou, H.; Deng, L.; Zhang, J.; Du, S. Forest biomass carbon storage from multiple inventories over the past 30 years in Gansu Province, China: implications from the age structure of major forest types. J. For. Res. 2015, 26, 887–896. [Google Scholar] [CrossRef]
  27. Chander, G.; Markham, B.L.; Helder, D.L. Summary of current radiometric calibration coefficients for Landsat MSS, TM, ETM+, and EO-1 ALI sensors. Remote Sens. Environ. 2009, 113, 893–903. [Google Scholar] [CrossRef] [Green Version]
  28. Charvz, P.S., Jr. Image-based atmospheric corrections—Revisited and revised. Photogramm. Eng. Rem. S. 1996, 62, 1025–1036. [Google Scholar]
  29. Xu, H.; Zhang, T. Assessment of consistency in forest-dominated vegetation observations between ASTER and Landsat ETM plus images in subtropical coastal areas of southeastern China. Agric. For. Meteorol. 2013, 168, 1. [Google Scholar] [CrossRef]
  30. Chu, H.; Venevsky, S.; Wu, C.; Wang, M. NDVI-based vegetation dynamics and its response to climate changes at Amur-Heilongjiang River Basin from 1982 to 2015. Sci. Total Environ. 2019, 650, 2051–2062. [Google Scholar] [CrossRef]
  31. Joiner, J.; Yoshida, Y.; Anderson, M.; Holmes, T.; Hain, C.; Reichle, R.; Koster, R.; Middleton, E.; Zeng, F.-W. Global relationships among traditional reflectance vegetation indices (NDVI and NDII), evapotranspiration (ET), and soil moisture variability on weekly timescales. Remote Sens. Environ. 2018, 219, 339–352. [Google Scholar] [CrossRef]
  32. Hu, X.; Xu, H. A new remote sensing index for assessing the spatial heterogeneity in urban ecological quality: A case from Fuzhou City, China. Ecol. Indic. 2018, 89, 11–21. [Google Scholar] [CrossRef]
  33. Liu, S.; Dong, Y.; Deng, L.; Liu, Q.; Zhao, H.; Dong, S. Forest fragmentation and landscape connectivity change associated with road network extension and city expansion: A case study in the Lancang River Valley. Ecol. Indic. 2014, 36, 160–168. [Google Scholar] [CrossRef]
  34. Liu, S.; Deng, L.; Chen, L.; Li, J.; Dong, S.; Zhao, H. Landscape network approach to assess ecological impacts of road projects on biological conservation. Chin. Geogr. Sci. 2014, 24, 5–14. [Google Scholar] [CrossRef] [Green Version]
  35. McGarigal, K.; Romme, W.H.; Crist, M.; Roworth, E. Cumulative effects of roads and logging on landscape structure in the San Juan Mountains, Colorado (USA). Landsc. Ecol. 2001, 16, 327–349. [Google Scholar] [CrossRef]
  36. Forman, R.T.T. Estimate of the Area Affected Ecologically by the Road System in the United States. Conserv. Biol. 2000, 14, 31–35. [Google Scholar] [CrossRef]
  37. Hejl, S.J. The importance of landscape patterns to bird diversity: a perspective from the northern Rocky Mountains. Northwest Environ. J. 1992, 8, 119–137. [Google Scholar]
  38. Reed, R.A.; Johnson-Barnard, J.; Baker, W.L. Contribution of Roads to Forest Fragmentation in the Rocky Mountains. Conserv. Biol. 1996, 10, 1098–1106. [Google Scholar] [CrossRef]
Figure 1. Location of the study area: (a) Fujian province in China and (b) study area in Fujian province.
Forests 10 00162 g001
Figure 2. Spatial distribution of landscapes in study area.
Forests 10 00162 g002
Figure 3. Percentage of each landscape type at the edge of high-voltage power transmission lines (HVPTLs) in 2016.
Forests 10 00162 g003
Figure 4. Landscape-level measurements with and without HVPTLs.
Forests 10 00162 g004
Figure 5. Landscape patch-class level measurements with and without HVPTLs. NF: semi-natural forest; FP: forest plantation; BF: bamboo forest; OF: other forest; NOF: non-forest.
Forests 10 00162 g005
Figure 6. Normalized difference vegetation index (NDVI) value varies with buffer gradient based on data from 2016.
Forests 10 00162 g006
Figure 7. Spatial distribution of NDVI at the edge of HVPTL pylons in 2016: (a) The distribution of the original value of NDVI; (b) overall distribution of the average value of NDVI in each buffer zone; and (c) the average value of NDVI in each buffer zone of the extracted location.
Forests 10 00162 g007
Figure 8. Spatial distribution of NDVI at the edge of HVPTL lines in 2016: (a) The distribution of the original value of NDVI; (b) the overall distribution of the average value of NDVI in each buffer zone; and (c) the average value of NDVI in each buffer zone of the extracted location.
Forests 10 00162 g008
Figure 9. NDVI growth during 2007–2016 varies with the buffer width.
Forests 10 00162 g009
Table 1. Classification of the landscape in the study area.
Landscape ClassesDescription
Semi-natural forestForests that have re-grown after a timber harvest for a long enough period without human interference.
Forest plantationArtificial mixed-species forest and artificial pure-species forest with artificially planted.
Bamboo forestPhyllostachys heterocycla, Dendrocalamopsis oldhami and D. latiflorus, etc.
Other forestIncluding shrubwood land, and sparse forest land, etc.
Non-forest landIncluding construction land, cultivated land, water land, burned area, and barren land, etc.
Table 2. The calculation formulas and descriptions for landscape metrics.
Landscape Metrics FormulaDescriptions
Patches density (PD) P D = n i A × 10000 × 100 Level: C/L;
To describe the degree of fragmentation for a certain landscape type or a total landscape.
Largest patch index (LPI) L P I = m a x j = 1 n ( a i j ) A × 100 Level: C/L;
To provide a simple measure of dominance. It quantifies the percentage of total landscape area comprised by the largest patch.
Mean patch area (MA) M A = m a x j = 1 n ( a i j ) n i × 1 10000 Level: C/L;
To describe the degree of fragmentation for a certain landscape type or a total landscape.
Effective mesh size (MESH) M E S H = i = 1 m j = 1 n a i j 2 A Level: C;
To indicate the probability of two points chosen randomly in a region will be connected.
Area-weighted mean shape index (AWMSI) A W M S I = j = 1 m ( 0.25 p i j / a i j ) · ( a i j / j = 1 m a i j ) Level: L
To evaluate the shape complexity for the total landscape.
Shannon’s diversity index (SHDI) S H D I = i = 1 m P i l o g 2 P i Level: L
To estimate the level of landscape diversity. SHDI is somewhat more sensitive to rare patch types than SIDI.
Simpson’s diversity index (SIDI) S I D I = 1 i = 1 m P i 2 Level: L
It is another popular diversity measure. Compared with SHDI, the value of Simpson’s index represents the probability that any two pixels would be different patch types.
Shannon’s evenness index (SHEI) S H E I = i = 1 m P i l o g 2 P i l o g 2 m Level: L
To describe the even distribution among patches. Evenness is the complement of dominance of certain patch.
Simpson’s evenness index (SIEI) S I E I = 1 i = 1 m P i 2 1 ( 1 m ) Level: L
Similar as SHEI.
Note: L: Landscape-level; C: Class-level; ni: patch number of landscape type i;A: total landscape area; aij: area of patch ij; pij: perimeter of patch ij; m: number of patch types (classes); Pi: area proportion of patch type (class) i to total landscape.

