Emergy and Economic Evaluation of Seven Typical Agroforestry Planting Patterns in the Karst Region of Southwest China

 ,
,
Abstract
1. Introduction
2. Materials and Methods
2.1. Research Area
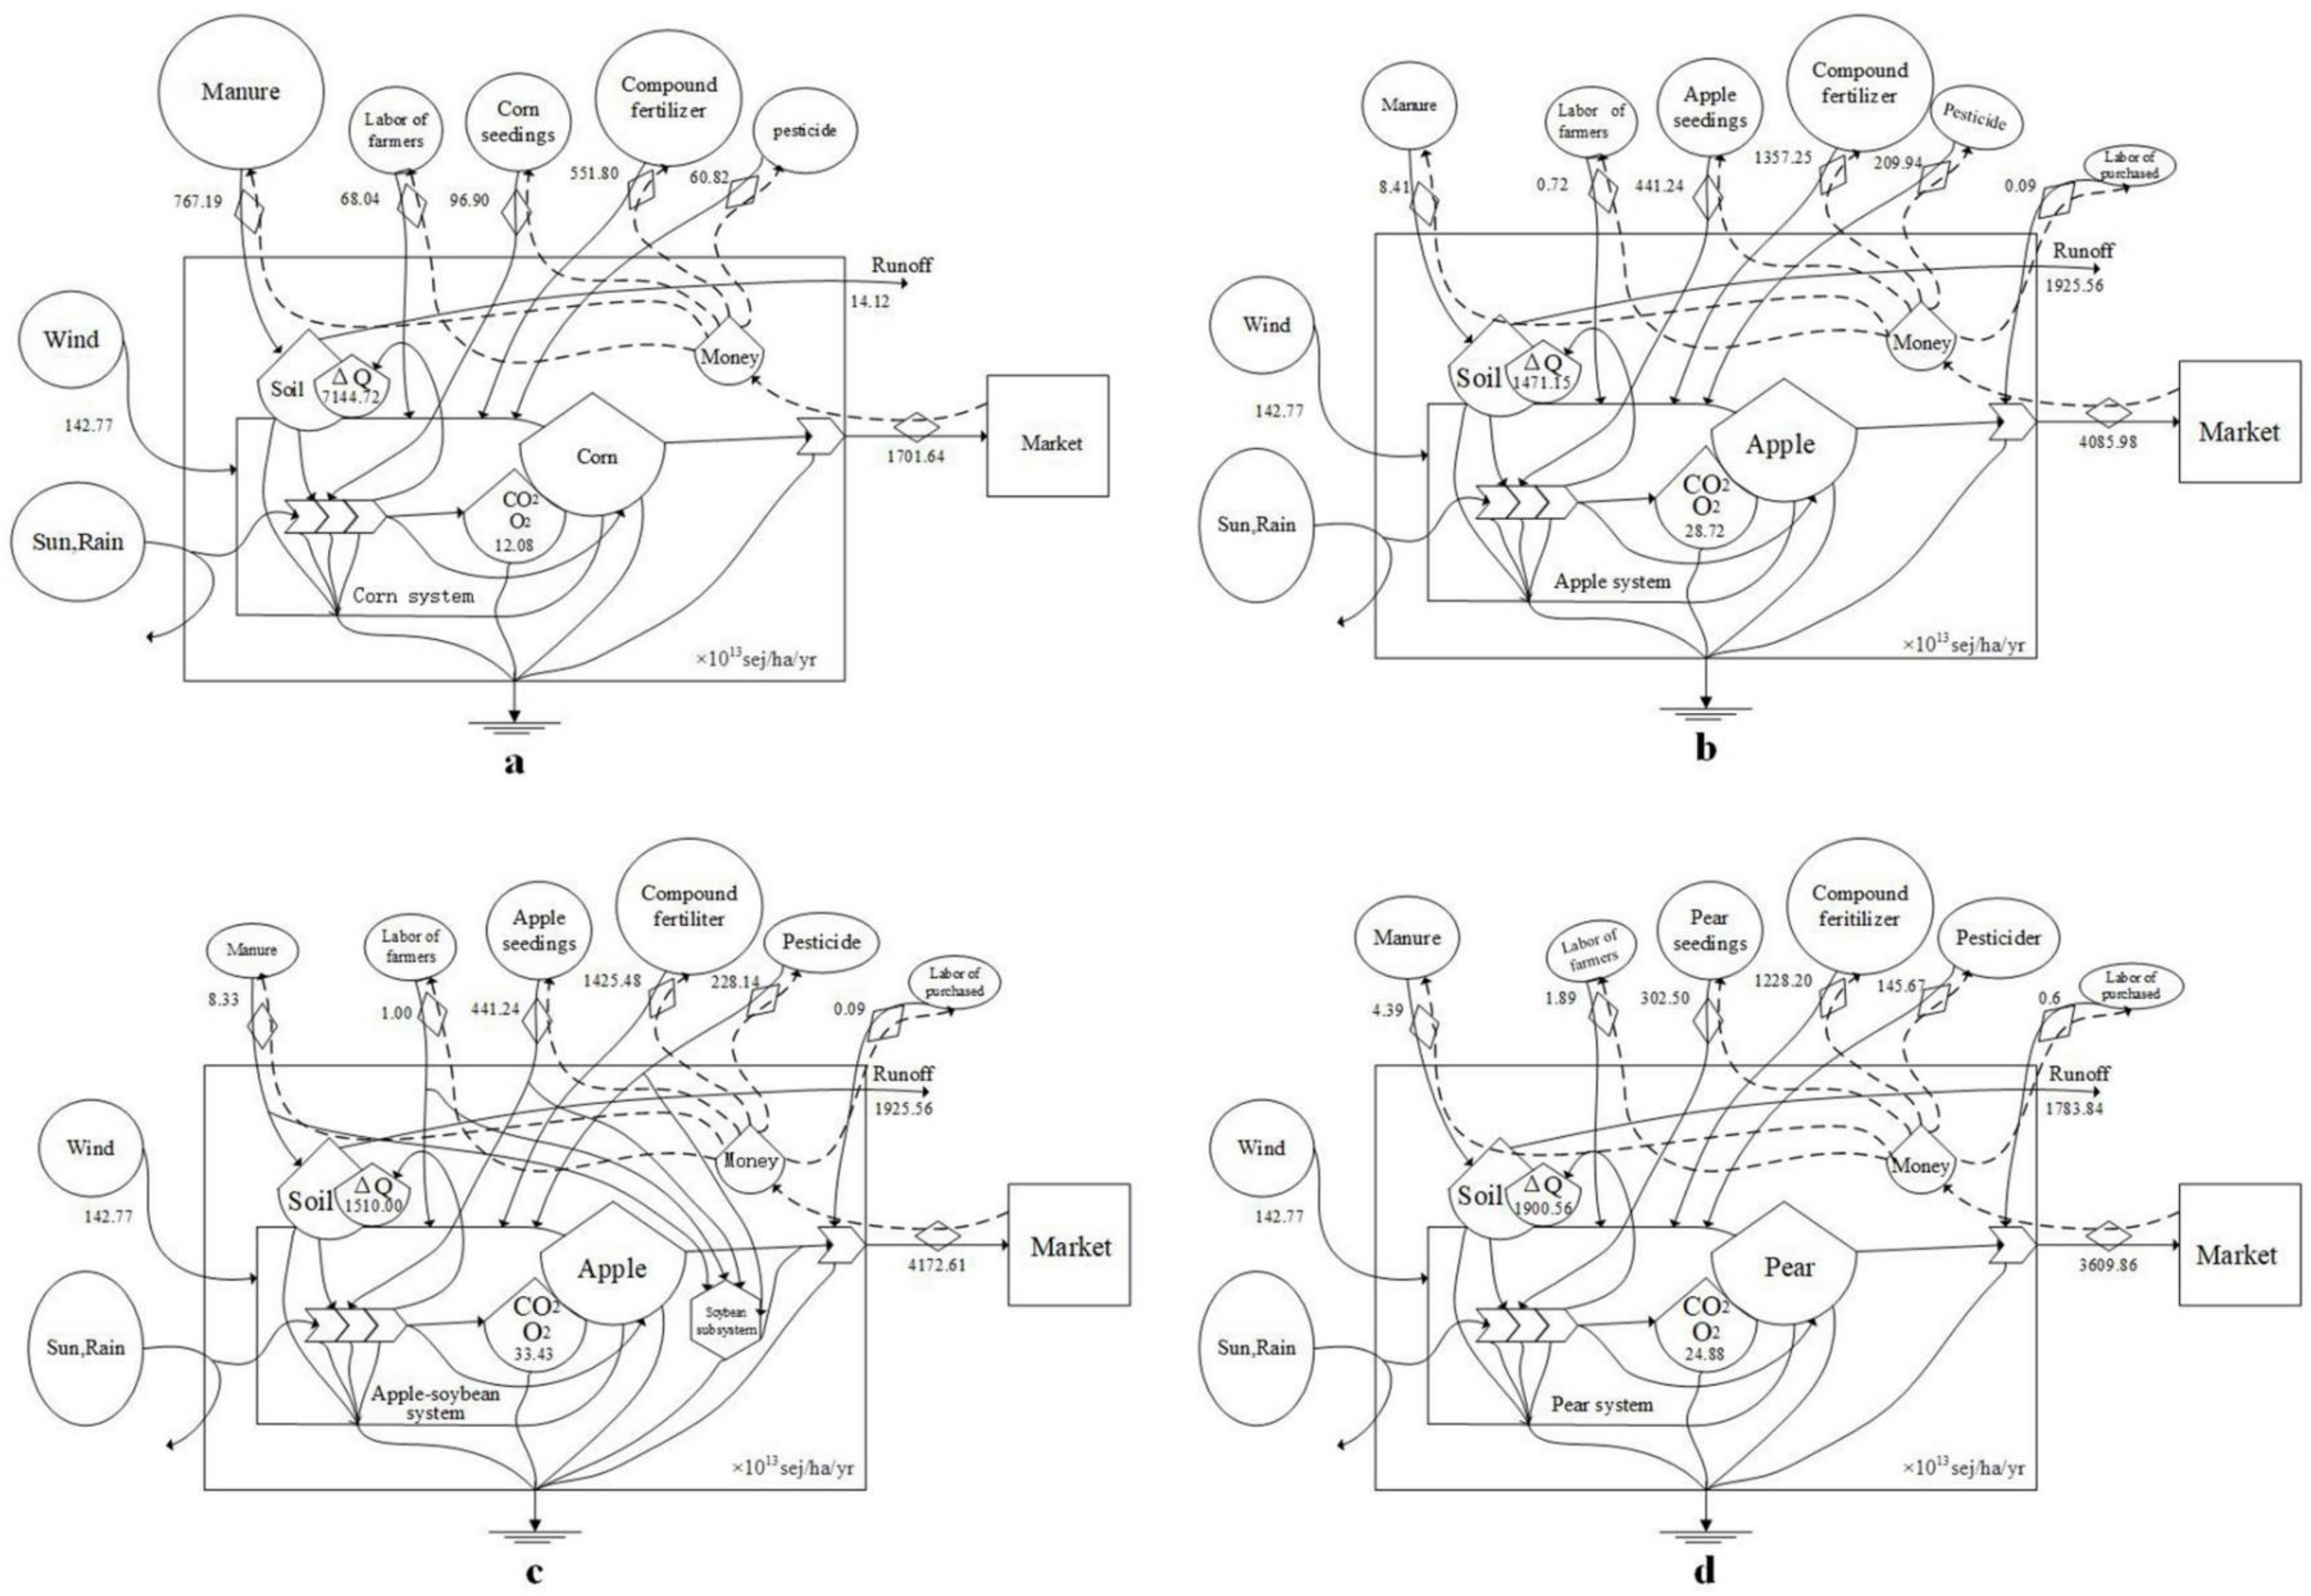
2.2. Description of the Seven Agroforestry Planting Patterns
2.2.1. Corn Planting (CP) Pattern
2.2.2. Apple Planting (AP) Pattern
2.2.3. Apple-Soybean Inter-Planting (ASP) Pattern
2.2.4. Pear Planting (PP) Pattern
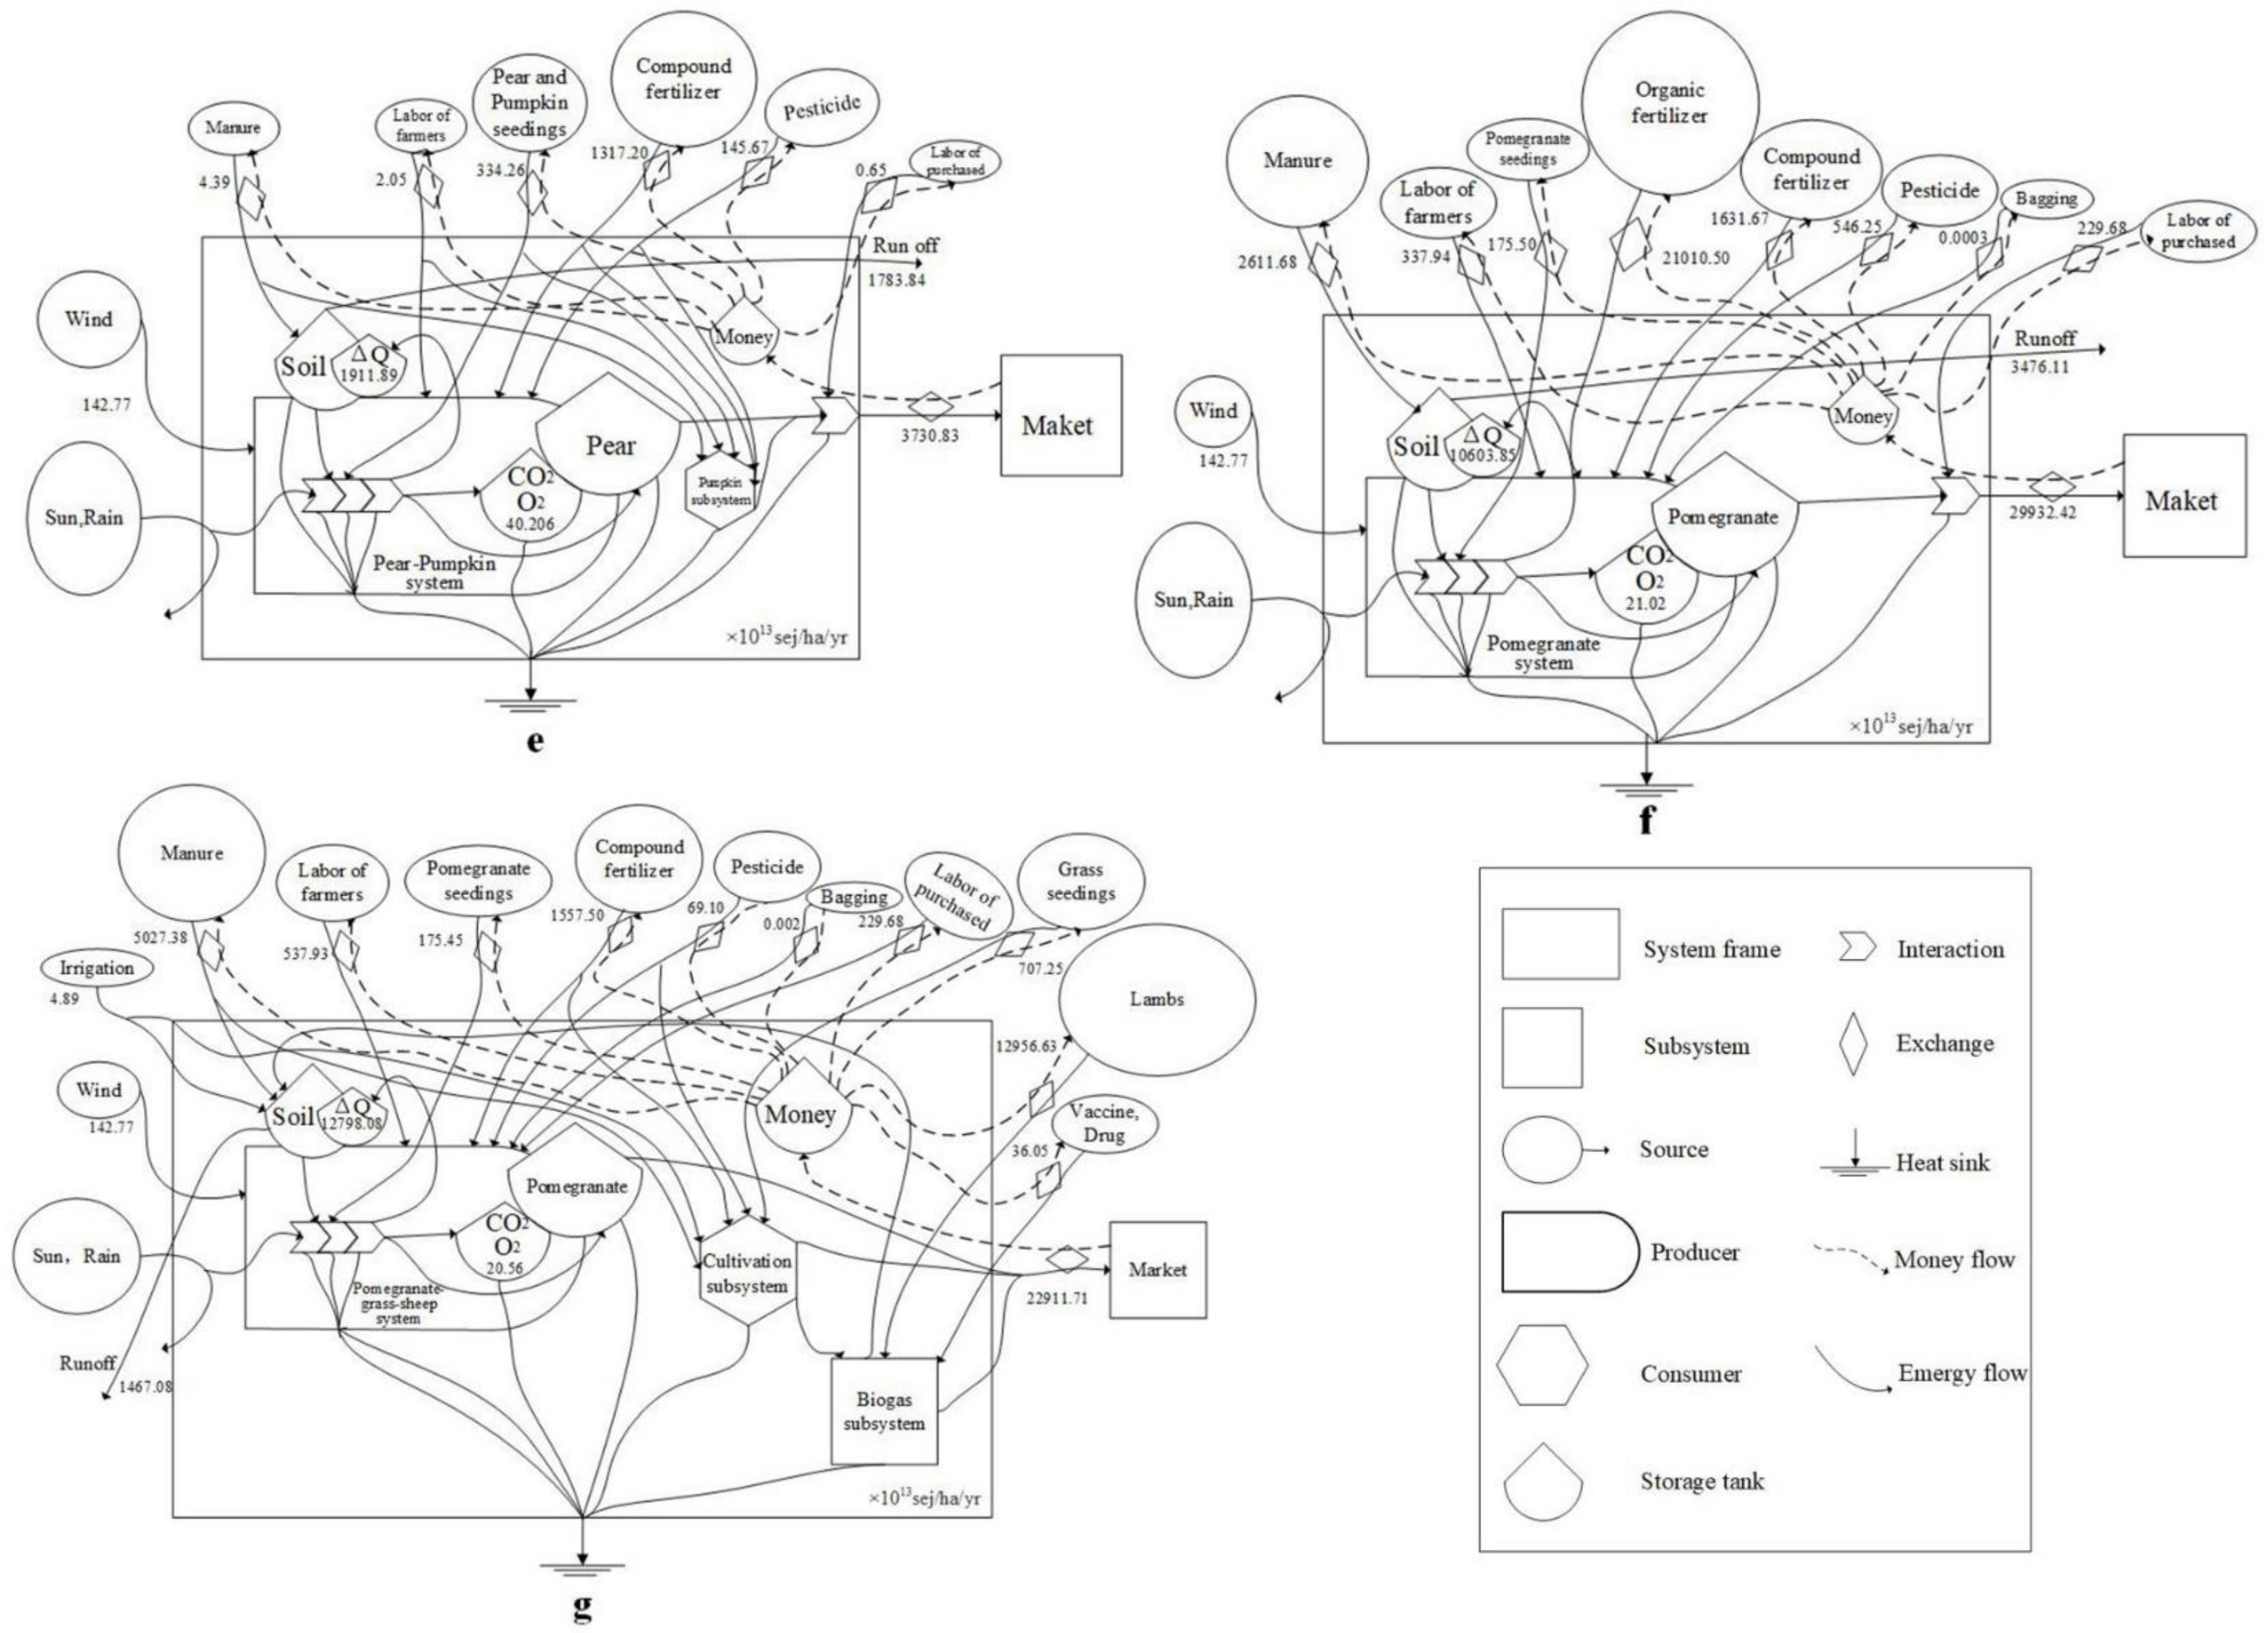
2.2.5. Pear-Pumpkin Inter-Planting (PPP) Pattern
2.2.6. Pomegranate Cultivation (PRP) Pattern
2.2.7. Pomegranate-Grass-Sheep Pattern (PGSP)
2.3. Data Collection and Sample Analysis
2.4. Data Analysis
2.4.1. Emergy Analysis
2.4.2. Economic Analysis
2.4.3. Scenario Analysis
3. Results
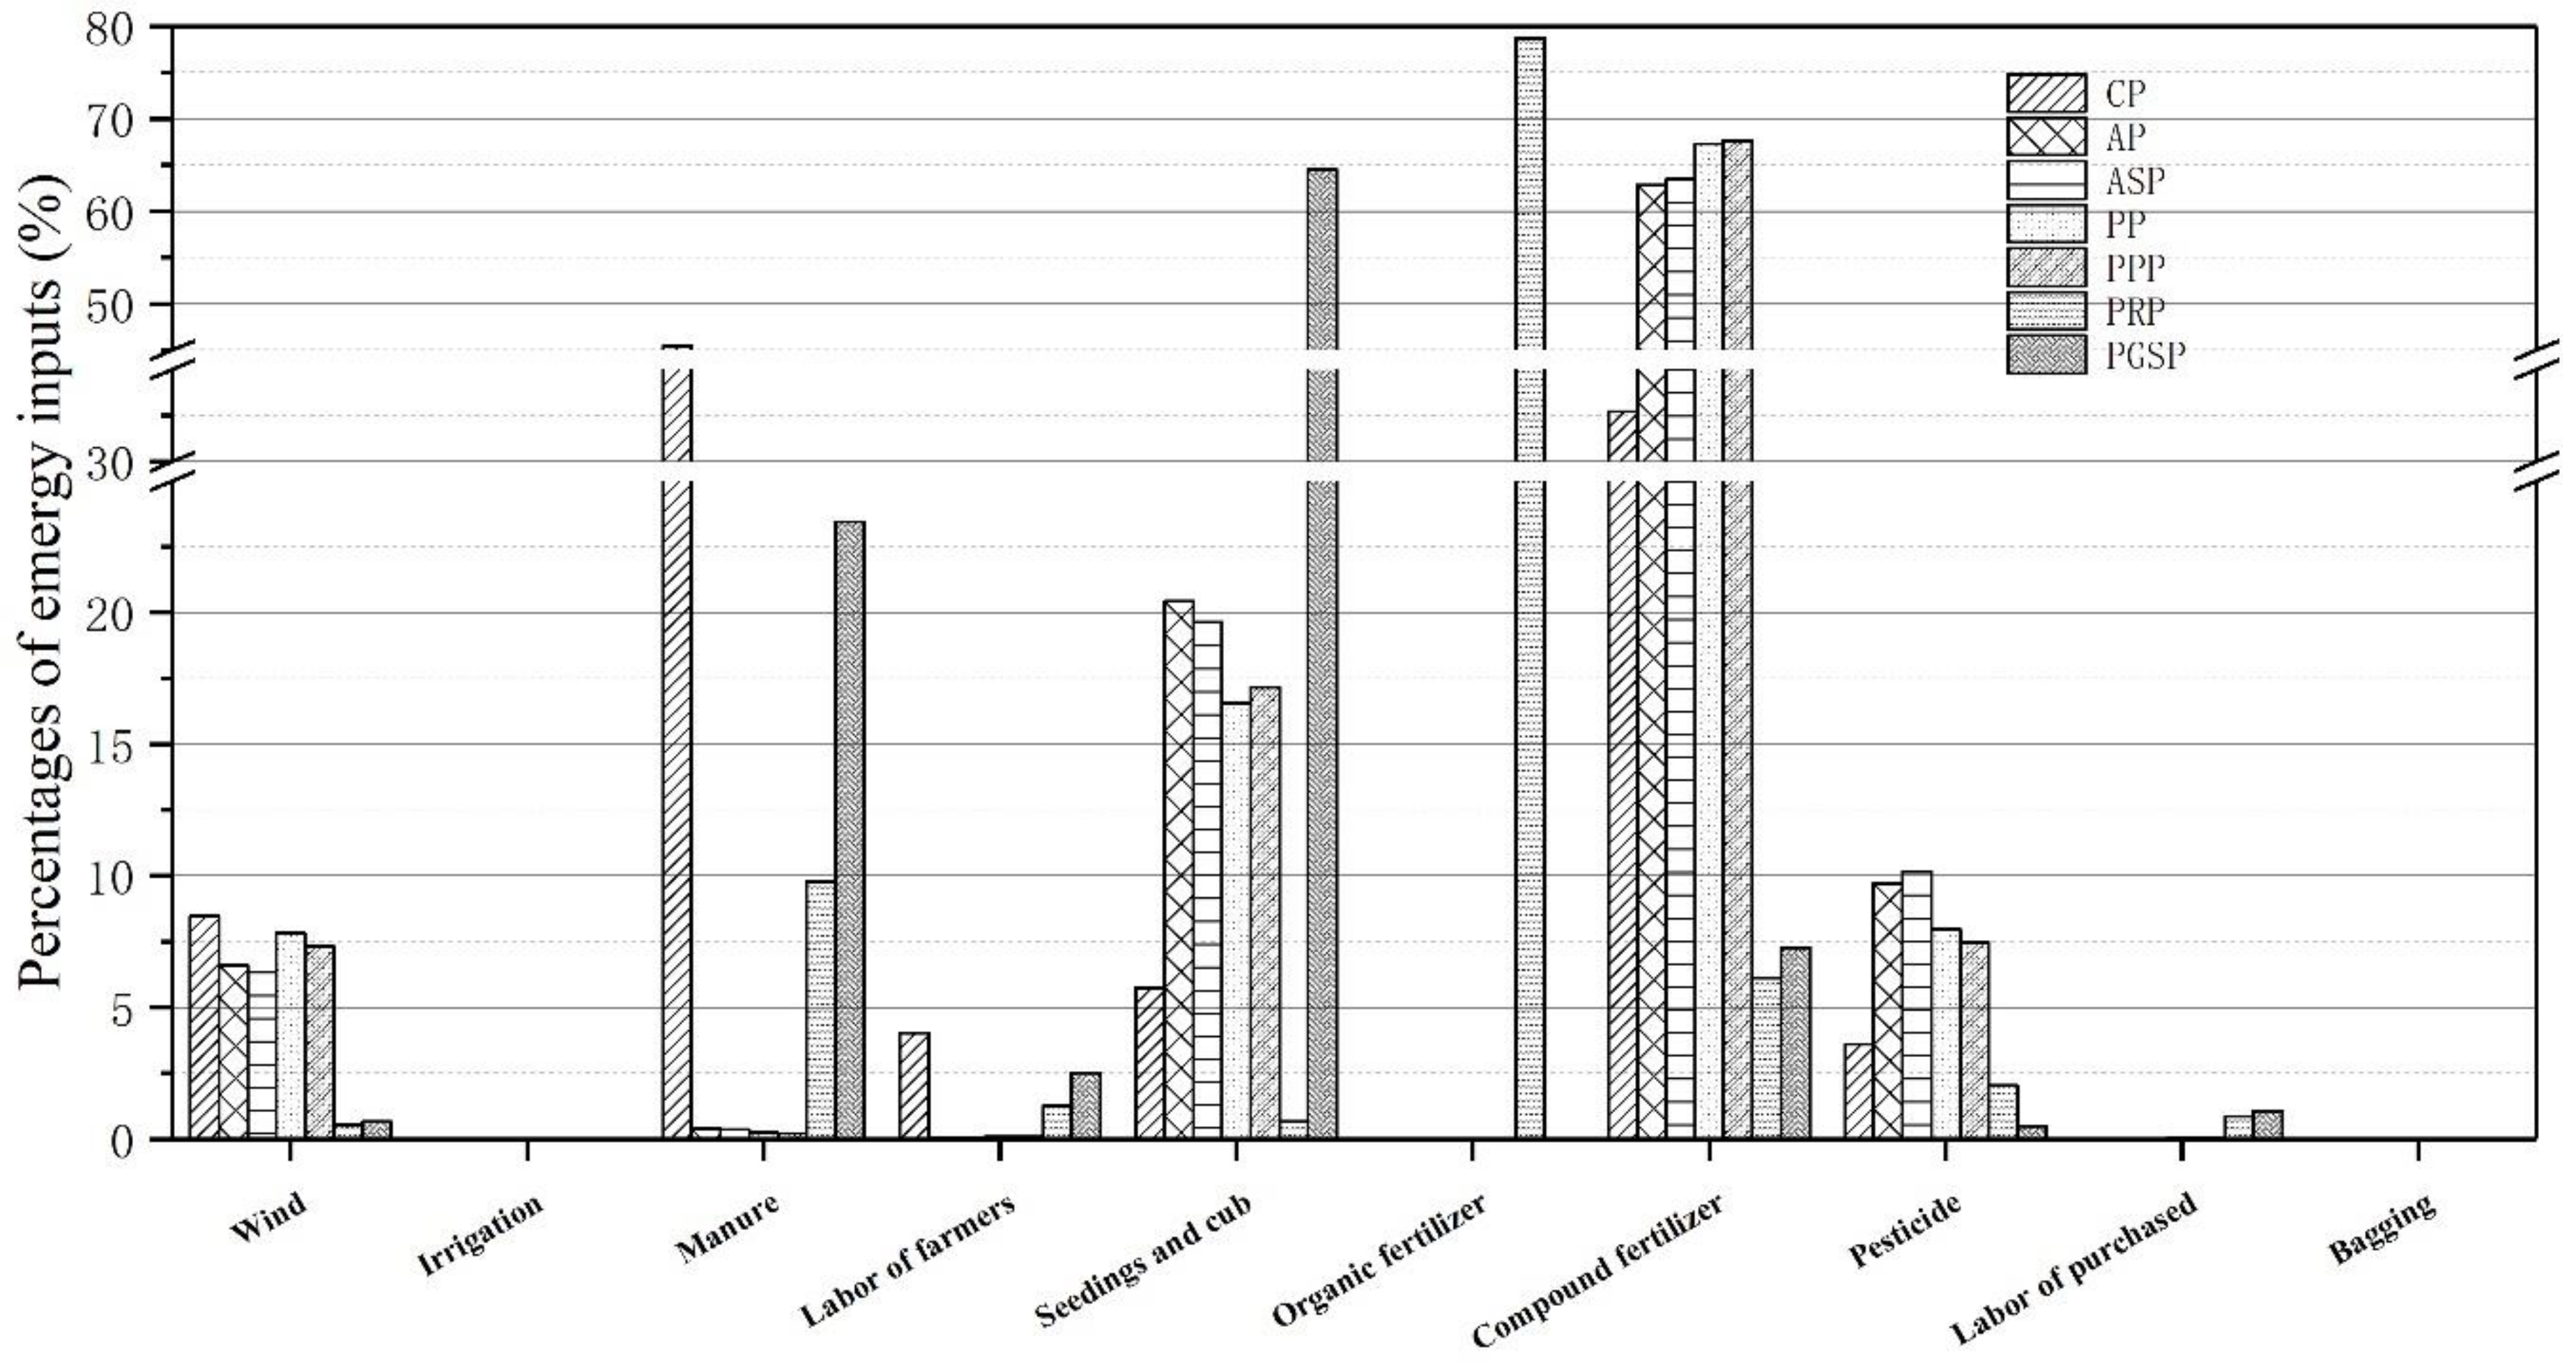
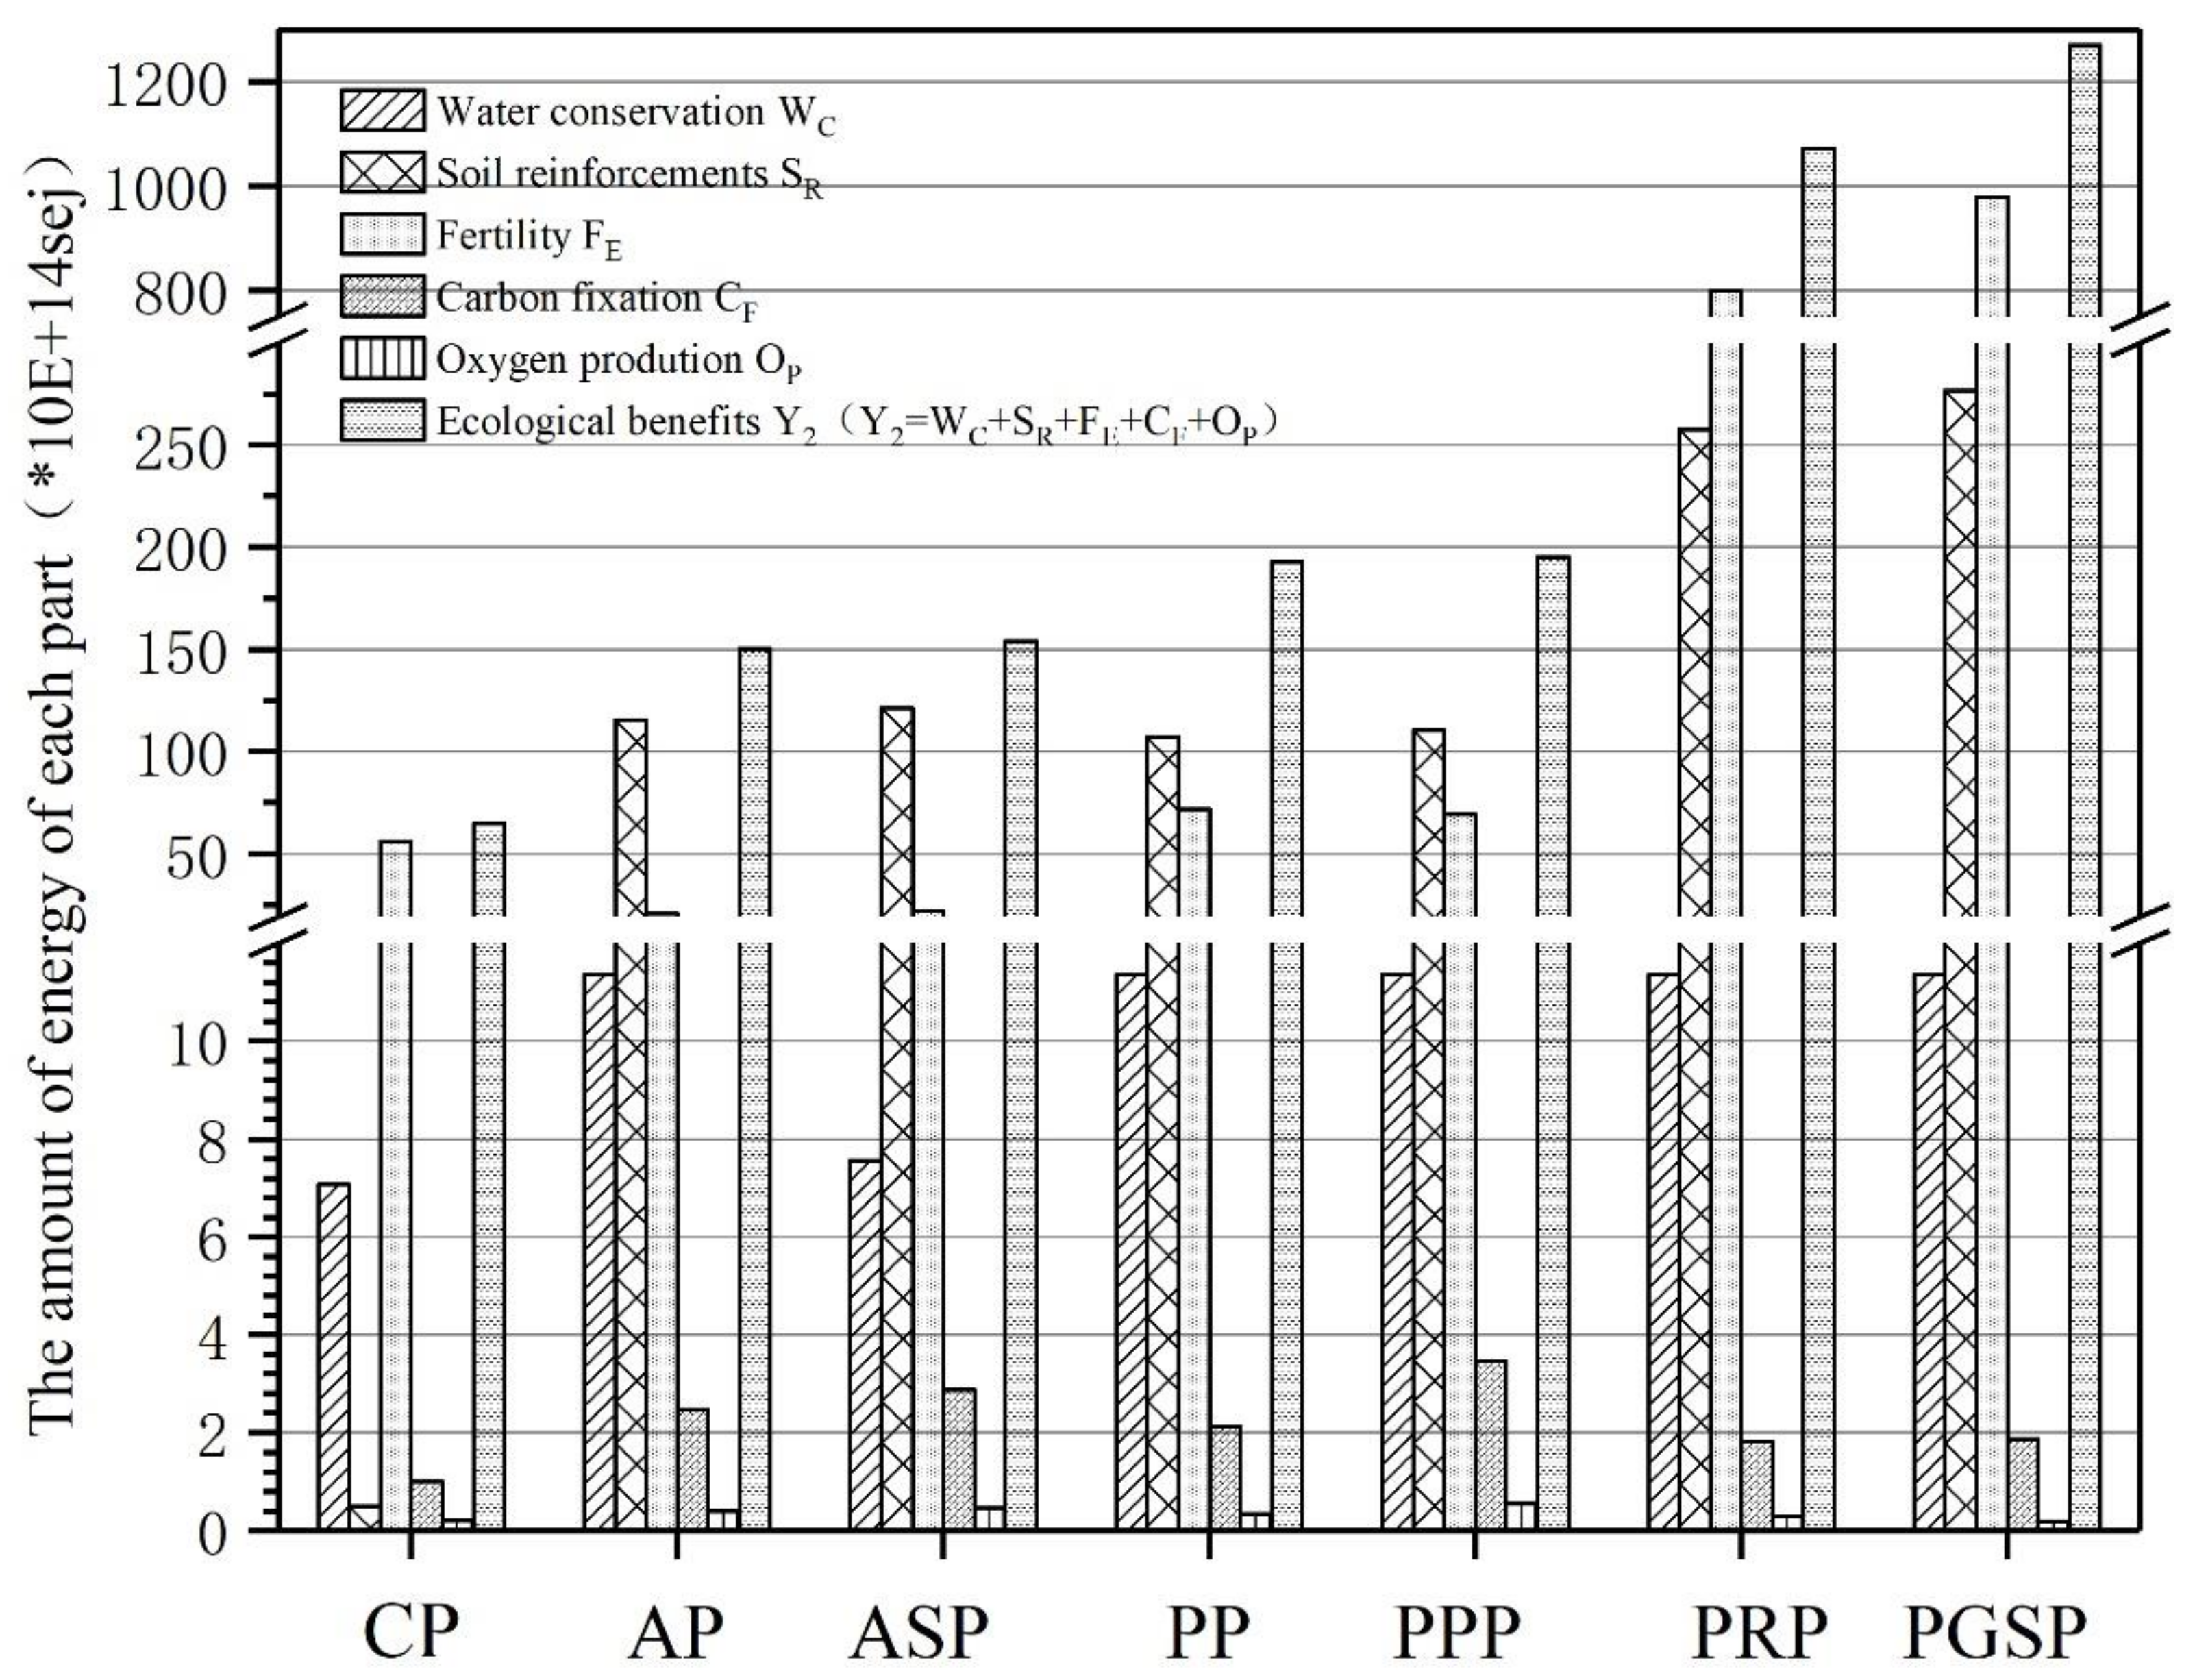
3.1. Emergy Analysis of Seven Typical Agroforestry Planting Patterns
3.2. Economic Benefit from the Seven Typical Agroforestry Planting Patterns
3.3. Scenario Analysis of Seven Typical Agroforestry Planting Patterns
4. Discussion
5. Conclusions
Author Contributions
Funding
Acknowledgments
Conflicts of Interest
Appendix A

| Item | Raw Amounts | EUVs (sej unit-1) | Solar Emergy (sej) | Average (sej) | ||||
|---|---|---|---|---|---|---|---|---|
| 1 | 2 | 3 | 1 | 2 | 3 | |||
| Input | ||||||||
| Renewable resource (R) | ||||||||
| Solar radiation (J) | 5.09 × 10¹³ | 5.09 × 10¹³ | 5.09 × 10¹³ | 1 | 5.09 × 10¹³ | 5.09 × 10¹³ | 5.09 × 10¹³ | 5.09 × 10¹³ |
| Wind (J) | 7.51 × 10¹¹ | 7.51 × 10¹¹ | 7.51 × 10¹¹ | 1900 | 1.43 × 10¹⁵ | 1.43 × 10¹⁵ | 1.43 × 10¹⁵ | 1.43 × 10¹⁵ |
| Rain (chemical) (J) | 4.83 × 10¹⁰ | 4.83 × 10¹⁰ | 4.83 × 10¹⁰ | 23,500 | 1.13 × 10¹⁵ | 1.13 × 10¹⁵ | 1.13 × 10¹⁵ | 1.13 × 10¹⁵ |
| Water (for irrigation) (J) | ||||||||
| Subtotal, R = Rain + Water | 2.61 × 10¹⁵ | 2.61 × 10¹⁵ | 2.61 × 10¹⁵ | 2.61 × 10¹⁵ | ||||
| Nonrenewable resource (N) | ||||||||
| Loss of topsoil | ||||||||
| Total N (g) | 2580 | 2580 | 2580 | 464,000,000 [18] | 1.20 × 10¹² | 1.20 × 10¹² | 1.20 × 10¹² | 1.20 × 10¹² |
| Total P (g) | 2280 | 2280 | 2280 | 5.07 × 10⁹ [18] | 1.16 × 10¹³ | 1.16 × 10¹³ | 1.16 × 10¹³ | 1.16 × 10¹³ |
| Total K (g) | 58,000 | 58,000 | 58,000 | 1.31 × 10⁹ | 7.60 × 10¹³ | 7.60 × 10¹³ | 7.60 × 10¹³ | 7.60 × 10¹³ |
| Organic (J) | 557,000,000 | 557,000,000 | 557,000,000 | 94,100 [66] | 5.24 × 10¹³ | 5.24 × 10¹³ | 5.24 × 10¹³ | 5.24 × 10¹³ |
| Subtotal (Total N + Total P + Total K + Organic) | 1.41 × 10¹⁴ | 1.41 × 10¹⁴ | 1.41 × 10¹⁴ | 1.41 × 10¹⁴ | ||||
| Local resource (I), I = R + N | 2.75 × 10¹⁵ | 2.75 × 10¹⁵ | 2.75 × 10¹⁵ | 2.75 × 10¹⁵ | ||||
| Purchased renewable resource (FR) | ||||||||
| Labor (10%)# (J) | 21,800,000 | 58,000,000 | 13,100,000 | 2,200,000 [67] | 4.79 × 10¹³ | 1.28 × 10¹⁴ | 2.87 × 10¹³ | 6.81 × 10¹³ |
| Manure (68%)## (J) | 1.79 × 10¹¹ | 7.67 × 10¹⁰ | 1.92 × 10¹¹ | 35,000 | 6.26 × 10¹⁵ | 2.68 × 10¹⁵ | 6.71 × 10¹⁵ | 5.22 × 10¹⁵ |
| Subtotal | 6.31 × 10¹⁵ | 2.81 × 10¹⁵ | 6.74 × 10¹⁵ | 5.28 × 10¹⁵ | ||||
| Purchased nonrenewable resource (FN) | ||||||||
| Seeds of corn (yuan) | 825 | 750 | 825 | 1.21 × 10¹² | 9.98 × 10¹⁴ | 9.08 × 10¹⁴ | 9.98 × 10¹⁴ | 9.68 × 10¹⁴ |
| Labor (90%) # (J) | 1.96 × 10⁸ | 5.22 × 10⁸ | 1.17 × 10⁸ | 2,200,000 [67] | 4.31 × 10¹⁴ | 1.15 × 10¹⁵ | 2.58 × 10¹⁴ | 6.12 × 10¹⁴ |
| Compound fertilizer (kg) | 1650 | 1000 | 2000 | 3.56 × 10¹² [17] | 5.87 × 10¹⁵ | 3.56 × 10¹⁵ | 7.12 × 10¹⁵ | 5.52 × 10¹⁵ |
| Manure (32%) ## (J) | 8.42 × 10¹⁰ | 3.61 × 10¹⁰ | 9.02 × 10¹⁰ | 35,000 [17] | 2.95 × 10¹⁵ | 1.26 × 10¹⁵ | 3.16 × 10¹⁵ | 2.46 × 10¹⁵ |
| Pesticide (yuan) | 1800 | 375 | 2000 | 4.37 × 10¹¹ * | 7.87 × 10¹⁴ | 1.64 × 10¹⁴ | 8.74 × 10¹⁴ | 6.08 × 10¹⁴ |
| Subtotal | 1.10 × 10¹⁶ | 7.04 × 10¹⁵ | 1.24 × 10¹⁶ | 1.02 × 10¹⁶ | ||||
| Purchased resource (F),F = FR + FN | 1.73 × 10¹⁶ | 9.85 × 10¹⁵ | 1.91 × 10¹⁶ | 1.54 × 10¹⁶ | ||||
| Total input (U), U = I + F | 2.01 × 10¹⁶ | 1.26 × 10¹⁶ | 2.19 × 10¹⁶ | 1.82 × 10¹⁶ | ||||
| Yield(Y1) | 13,200 | 8250 | 16,500 | 1.21 × 10¹² | 1.60 × 10¹⁶ | 9.98 × 10¹⁵ | 2.00 × 10¹⁶ | 1.53 × 10¹⁶ |
| Ecological benefits (Y2) | ||||||||
| Water conservation (WC) | 3.01 × 10¹⁰ | 3.01 × 10¹⁰ | 3.01 × 10¹⁰ | 23,500 | 7.07 × 10¹⁴ | 7.07 × 10¹⁴ | 7.07 × 10¹⁴ | 7.07 × 10¹⁴ |
| Soil reinforcement (SR) | ||||||||
| Total N (g) | 902 | 902 | 902 | 4.64 × 10⁸ [18] | 4.18 × 10¹¹ | 4.18 × 10¹¹ | 4.18 × 10¹¹ | 4.18 × 10¹¹ |
| Total P (g) | 799 | 799 | 799 | 5.07 × 10⁹ [18] | 4.05 × 10¹² | 4.05 × 10¹² | 4.05 × 10¹² | 4.05 × 10¹² |
| Total K (g) | 20,300 | 20,300 | 20,300 | 1.31 × 10⁹ | 2.66 × 10¹³ | 2.66 × 10¹³ | 2.66 × 10¹³ | 2.66 × 10¹³ |
| Organic (J) | 1.95 × 10⁸ | 1.95 × 10⁸ | 1.95 × 10⁸ | 94,100 [66] | 1.83 × 10¹³ | 1.83 × 10¹³ | 1.83 × 10¹³ | 1.83 × 10¹³ |
| subtotal | 4.94 × 10¹³ | 4.94 × 10¹³ | 4.94 × 10¹³ | 4.94 × 10¹³ | ||||
| Fertility (FE) | ||||||||
| Total N (g) | 600,000 | 493,000 | 606,000 | 4.64 × 10⁸ [18] | 2.78 × 10¹⁴ | 2.29 × 10¹⁴ | 2.81 × 10¹⁴ | 2.63 × 10¹⁴ |
| Total P (g) | 920,000 | 385,000 | 971,000 | 5.07 × 10⁹ [18] | 4.66 × 10¹⁵ | 1.95 × 10¹⁵ | 4.92 × 10¹⁵ | 3.85 × 10¹⁵ |
| Total K (g) | 169,000 | 25,600 | 119,000 | 1.31 × 10⁹ | 2.22 × 10¹⁴ | 3.35 × 10¹³ | 1.55 × 10¹⁴ | 1.37 × 10¹⁴ |
| Organic (J) | 1.43 × 10¹⁰ | 1.43 × 10¹⁰ | 1.43 × 10¹⁰ | 94,100 [66] | 1.35 × 10¹⁵ | 1.35 × 10¹⁵ | 1.35 × 10¹⁵ | 1.35 × 10¹⁵ |
| subtotal | 6.51 × 10¹⁵ | 3.56 × 10¹⁵ | 6.71 × 10¹⁵ | 5.59 × 10¹⁵ | ||||
| Carbon fixation (CF) (g) | 17,500,000 | 13,800,000 | 17,000,000 | 6,190,000 [18] | 1.09 × 10¹⁴ | 8.53 × 10¹³ | 1.05 × 10¹⁴ | 9.97 × 10¹³ |
| Oxygen production (OP) (g) | 14,300,000 | 16,900,000 | 20,800,000 | 1,220,000 [18] | 1.75 × 10¹³ | 2.06 × 10¹³ | 2.54 × 10¹³ | 2.12 × 10¹³ |
| Total Y2 = WC + SR + FE + CF + OP | 7.39 × 10¹⁵ | 4.43 × 10¹⁵ | 7.59 × 10¹⁵ | 6.47 × 10¹⁵ | ||||
| Indices | ||||||||
| Em-Power Density (EPD) | 2.01 × 10¹² | 1.26 × 10¹² | 2.19 × 10¹² | 1.82 × 10¹² | ||||
| Emergy Self-sufficiency Ratio (ESR) | 0.14 | 0.22 | 0.13 | 0.15 | ||||
| Emergy Exchange Ratio (EER) | 0.86 | 0.88 | 0.79 | 0.84 | ||||
| Emergy Yield Ratio (EYR) | 0.92 | 1.01 | 1.04 | 0.99 | ||||
| Environmental Loading Ratio (ELR) | 1.25 | 1.32 | 1.34 | 1.30 | ||||
| Emergy Restoration Ratio (ERR) | 0.43 | 0.45 | 0.40 | 0.42 | ||||
| Emergy Benefit Ratio (EBR) | 1.35 | 1.46 | 1.44 | 1.41 | ||||
| Emergy Sustainability Index (ESI) | 0.74 | 0.77 | 0.78 | 0.76 | ||||
| Emergy Index for Sustainable Development (EISD) | 0.63 | 0.67 | 0.62 | 0.63 | ||||
| Iterm | Money (yuan) | Average (yuan) | ||
|---|---|---|---|---|
| 1 | 2 | 3 | ||
| Input(I) | ||||
| Input for actual (Ia) | ||||
| Labor of purchased | 0.00 | 0.00 | 0.00 | 0.00 |
| Seeds of corn | 825.00 | 750.00 | 825.00 | 800.00 |
| Compound fertilizer | 3300.00 | 0.00 | 4000.00 | 2433.33 |
| Nitrogenous fertilizer | 0.00 | 1012.50 | 0.00 | 337.50 |
| Pesticide | 1800.00 | 375.00 | 2000.00 | 1391.67 |
| Subtotal Ia | 5925.00 | 2137.50 | 6825.00 | 4962.50 |
| Input for free (If) | ||||
| Labor of farmers | 3000.00 | 8000.00 | 1800.00 | 4266.67 |
| Manure | 21,000.00 | 9000.00 | 22,500.00 | 17,500.00 |
| Subtotal If | 24,000.00 | 17,000.00 | 24,300.00 | 21,766.67 |
| Total input I = Ia + If | 29,925.00 | 19,137.50 | 31,125.00 | 26,729.17 |
| Output (O) | ||||
| Corn | 13,200.00 | 8250.00 | 16,500.00 | 12,650.00 |
| Total output | 13,200.00 | 8250.00 | 16,500.00 | 12,650.00 |
| Indices | ||||
| Input with If | 29,925.00 | 19,137.50 | 31,125.00 | 26,729.17 |
| Input without If | 5925.00 | 2137.50 | 6825.00 | 4962.50 |
| Output | 13,200.00 | 8250.00 | 16,500.00 | 12,650.00 |
| Economic Output/Input with If (O/I) | 0.44 | 0.43 | 0.53 | 0.47 |
| Economic Output/Input without If (O/Ia) | 2.23 | 3.86 | 2.42 | 2.84 |
| Economic benefit per unit (EBU, O-I) | −16,725.00 | −10,887.50 | −14,625.00 | −14,079.17 |
| Economic pure benefit per unit (EPBU, Ia) | 7275.00 | 6112.50 | 9675.00 | 7687.50 |
References
- Ying, B.; Xiao, S.Z.; Xiong, K.N.; Cheng, Q.W.; Luo, J.S. Comparative studies of the distribution characteristics of rocky desertification and land use/land cover classes in typical areas of Guizhou province, China. Environ. Earth Sci. 2014, 71, 631–645. [Google Scholar] [CrossRef]
- Cao, J.H.; Yuan, D.X.; Tong, L.Q.; Mallik, A.; Yang, H.; Huang, F. An overview of karst ecosystem in southwest China: Current state and future Management. J. Resour. Ecol. 2015, 6, 247–256. [Google Scholar]
- Chen, S.Z.; Zhou, Z.F.; Yan, L.H.; Li, B. Quantitative evaluation of ecosystem health in a karst area of south China. Sustainability 2016, 8, 975. [Google Scholar] [CrossRef]
- Liu, H.Y.; Zhang, M.Y.; Lin, Z.S.; Xu, X.J. Spatial heterogeneity of the relationship between vegetation dynamics and climate change and their driving forces at multiple time scales in Southwest China. Agric. For. Meteorol. 2018, 256, 10–21. [Google Scholar] [CrossRef]
- Peng, W.X.; Wang, K.L.; Song, T.Q.; Zeng, F.P.; Wang, J.R. Controlling and restoration models of complex degradation of vulnerable Karst ecosystem. Acta Ecol. Sina. 2008, 28, 811–820. [Google Scholar]
- Zhang, M.Y.; Wang, K.L.; Liu, H.Y.; Wang, J.; Zhang, C.H.; Yue, Y.M.; Qi, X.K. Spatio-temporal variation and impact factors for vegetation carbon sequestration and oxygen production based on rocky desertification control in the karst region of Southwest China. Remote Sens. 2016, 8, 102. [Google Scholar] [CrossRef]
- Tong, X.W.; Wang, K.L.; Brandt, M.; Yue, Y.M.; Liao, C.J.; Fensholt, R. Assessing future vegetation trends and restoration prospects in the karst regions of southwest China. Remote Sens. 2016, 8, 357. [Google Scholar] [CrossRef]
- Zeng, F.P.; Wang, K.L. Effects of "Grain-for-Green" models in karst regions in Northwest Guangxi. Rural Eco-Environ. 2005, 21, 18–22. [Google Scholar]
- Qin, Z.Q.; Lou, X.W.; Lei, H.Y. Controlling Karst Rocky Desertification by Developing Ecological Grassland Animal Husbandry in Anshun City, Guizhou. Guizhou. Agric. Sci. 2008, 36, 129–131. [Google Scholar]
- Cui, L.; Xiong, K.L.; Guan, Z.H.; Chen, Y.H.; Liu, Z.Q. The model of karst land management based on plant diversity restoration and protection: Examples from Salaxi and Huajiang areas of Guizhou. Cars. Sin. 2016, 35, 513–524. [Google Scholar]
- Zhang, H.; Xiong, K.N.; Su, M.M.; Su, X.L.; Bai, X.M. Strategy Analysis of Control Project of Grassland and Animal Husbandry of Rocky Desertification Area in Karst Mountains Take Dingtan Drainage of Huajiang as an Example. Chin. J. Grassl. 2013, 35, 4–8. [Google Scholar]
- Jia, X.; Fu, B.; Feng, X.; Hou, G.; Liu, Y.; Wang, X. The tradeoff and synergy between ecosystem services in the Grain-for-Green areas in Northern Shaanxi, China. Ecol. Indi. 2014, 43, 103–113. [Google Scholar] [CrossRef]
- Vaast, P.; Somarriba, E. Trade-offs between crop intensification and ecosystem services: the role of agroforestry in cocoa cultivation. Agrofor. Syst. 2014, 88, 947–956. [Google Scholar] [CrossRef]
- Zhang, J.; Wang, L.; Su, J. The Soil Water Condition of a Typical Agroforestry System under the Policy of Northwest China. Forests 2018, 9, 730. [Google Scholar] [CrossRef]
- Liu, M.C.; Liu, X.C.; Yang, Z.S. An integrated indicator on regional ecological civilization construction in China. Int. J. Sustain. Dev. World Ecol. 2016, 23, 53–60. [Google Scholar] [CrossRef]
- Lu, H.F.; Tan, Y.W.; Zhang, W.S.; Qiao, Y.C.; Campbell, D.E.; Zhou, L.; Ren, H. Integrated emergy and economic evaluation of lotus-root production systems on reclaimed wetlands surrounding the Pearl River Estuary, China. J. Clean Prod. 2017, 158, 367–379. [Google Scholar] [CrossRef] [PubMed]
- Odum, H.T. Environmental accounting: EMERGY and environmental decision making; John Wiley: New York, NY, USA, 1996; pp. 76–152. [Google Scholar]
- Campbell, D.E.; Lu, H.F.; Lin, B.L. Emergy evaluations of the global biogeochemical cycles of six biologically active elements and two compounds. Ecol. Model. 2014, 271, 32–51. [Google Scholar] [CrossRef]
- Diemont, S.A.W.; Martin, J.F.; Levy-Tacher, S.I. Emergy evaluation of lacandon Maya indigenous swidden agroforestry in Chiapas, Mexico. Agrofor. Syst. 2005, 66, 23–42. [Google Scholar] [CrossRef]
- Fonseca, A.M.P.; Marques, C.A.F.; Pinto-Correia, T.; Campbell, D.E. Emergy analysis of a silvo-pastoral system, a case study in southern Portugal. Agrofor. Syst. 2015, 90, 137–157. [Google Scholar] [CrossRef]
- Tilley, D.R.; Comar, V. Emergy-based simulation to assess Brazil’s long-term carrying capacity: environment, electricity and population. Popul. Env. 2006, 27, 307–326. [Google Scholar] [CrossRef]
- Patrizi, N.; Niccolucci, V.; Castellini, C.; Pulselli, F.M.; Bastianoni, S. Sustainability of agro-livestock integration: Implications and results of Emergy evaluation. Sci Total Environ. 2018, 622-623, 1543–1552. [Google Scholar] [CrossRef] [PubMed]
- Zou, Z.G.; Zhang, J.; Zeng, S.X.; Zhang, J.Y.; Zhao, J.J.; Bao, S.; Zeng, F.P. Emergy analysis of four typical planting modes in Karst faulted basins of Yunnan Province, China. Chin. J. Applied. Ecol. 2018, 29, 2641–2650. [Google Scholar] [CrossRef]
- Houshyar, E.; Wu, X.F.; Chen, G.Q. Sustainability of wheat and maize production in the warm climate of southwestern Iran: An emergy analysis. J. Clean Prod. 2018, 172, 2246–2255. [Google Scholar] [CrossRef]
- Tilley, D.R. Exploration of Odum’s dynamic emergy accounting rules for suggested refinements. Ecol. Model. 2014, 279, 36–44. [Google Scholar] [CrossRef]
- Vassallo, P.; Beiso, I.; Bastianoni, S.; Fabiano, M. Dynamic emergy evaluation of a fish farm rearing process. J. Environ Manage. 2009, 90, 2699–2708. [Google Scholar] [CrossRef] [PubMed]
- Ren, J.M.; Zhang, L.; Wang, R.S. Measuring the sustainability of policy scenarios: Emergy-based strategic environmental assessment of the Chinese paper industry. Ecol. Complex. 2010, 7, 156–161. [Google Scholar] [CrossRef]
- Li, S. Analysis on the sustainable development of typical Karst rocky desertification area based on emergy method. J. Arid. Land. Res. Environ. 2014, 28, 33–38. [Google Scholar]
- Lu, Y.; Wei, Y.F.; Deng, X.L.; Wang, J. Dynamic analysis of emergy for agroecosystem in karst mountain area. J. Soil. Water. Cons. 2006, 20, 166–169. [Google Scholar]
- Lin, D.; Yu, H.; Lian, F.; Wang, J.A.; Zhu, A.X.; Yue, Y.J. Quantifying the hazardous impacts of human-induced land degradation on terrestrial ecosystems: A case study of karst areas of south China. Environ. Earth Sci. 2016, 75, 18. [Google Scholar] [CrossRef]
- Wu, J.H.; Mou, Q.; Tang, C.B.; Zhao, X.Y.; Zhang, D.Q.; Xie, G.W. Techniques for sheep raising through grass growing in rocky desertification mountain area. Prat. Sci. 2009, 26, 126–128. [Google Scholar]
- Zhang, H.; Xiong, K.N.; Su, X.L. Practaculture current situation and its development response of Guizhou rocky desertification area. Adv. Environ Sci. Eng. 2012, 518–523, 4626–4632. [Google Scholar]
- Bao, S.D. Soil agrochemical analysis, 3rd ed.; China agriculture press: Beijing, China, 2000; pp. 145–196. [Google Scholar]
- Lu, H.F.; Yuan, Y.G.; Campbell, D.E.; Qin, P.; Cui, L.J. Integrated water quality, emergy and economic evaluation of three bioremediation treatment systems for eutrophic water. Ecol. Eng. 2014, 69, 244–254. [Google Scholar] [CrossRef]
- Li, H.; Brown, M. Emergy-based environmental accounting toward a sustainable Mongolia. J. Geogr. Sci. 2017, 27, 1227–1248. [Google Scholar] [CrossRef]
- Wang, L.; Li, L.; Cheng, K.; Ji, C.Y.; Yue, Q.; Bian, R.J.; Pan, G.X. An assessment of emergy, energy, cost-benefits of grain production over 6 years following a biochar amendment in a rice paddy from China. Environ. Sci. Pollut. Res. 2018, 25, 9683–9696. [Google Scholar] [CrossRef] [PubMed]
- Zhai, X.J.; Huang, D.; Tang, S.M.; Li, S.Y.; Guo, J.X.; Yang, Y.J.; Liu, H.F.; Li, J.S.; Wang, K. The emergy of metabolism in different ecosystems under the sameenvironmental conditions in the agro-pastoral ecotone of northern China. Ecol. Indic. 2017, 74, 198–204. [Google Scholar] [CrossRef]
- Zgurovsky, M. The scenario analysis approach as a tool for decision-makers. In International Conference on Politics and Information Systems: Technologies and Applications; Vol 1: INFORMATICS AND SOCIETY, 2004; pp. 339–344. [Google Scholar]
- Bray, S.G.; Golden, R. Scenario analysis of alternative vegetation management options on the greenhouse gas budget of two grazing businesses in north-eastern Australia. Rangeland J. 2009, 31, 137–142. [Google Scholar] [CrossRef]
- Zhang, X.H.; Zhang, R.; Wu, J.; Zhang, Y.Z.; Lin, L.L.; Deng, S.H.; Li, L.; Yang, G.; Yu, X.Y.; Qi, H.; et al. An emergy evaluation of the sustainability of Chinese crop production system during 2000–2010. Ecol. Indic. 2016, 60, 622–633. [Google Scholar] [CrossRef]
- Zhai, X.J.; Zhao, H.; Guo, L.Z.; Finch, D.M.; Huang, D.; Liu, K.; Tang, S.M.; Yang, Y.J.; Guo, J.X.; Li, J.H.; et al. The emergy of metabolism in the same ecosystem (maize) under different environmental conditions. J. Clean Prod. 2018, 191, 233–239. [Google Scholar] [CrossRef]
- Ghaley, B.B.; Kehli, N.; Mentler, A. Emergy synthesis of conventional fodder maize (Zea mays L.) production in Denmark. Ecol. Indic. 2018, 87, 144–151. [Google Scholar] [CrossRef]
- Han, Q.Y.; Hu, B.Q.; Chen, Q. Energy Evaluation of Agricultural Eco-Economic System in Du’ an County of Karst Region. J. Guangxi Aca. Sci. 2010, 26, 188–192. [Google Scholar] [CrossRef]
- Li, S.; Deng, B.K.; Shao, J.X. Study on Sustainability of Eco-Economic System in Karst Region Using Emergy Methodology: A Case Study of Guizhou Province. Ecol. Econ. 2015, 31, 90–93. [Google Scholar]
- Zhang, C.G.; Han, J.C.; Qiu, L.; Zhu, M.Q.; Cheng, J. Energy method-based evaluation of the sustainability of the "Five-in-One" ecological orchard system. J. Agro-Environment. Sci. 2018, 37, 276–285. [Google Scholar]
- Sun, L.; Han, J.; Wu, F.Q. Emergy and benefit evaluation of pig-methane-pomegranate recycling agriculture in Guanzhong Plain. Agric Res Arid Areas. 2015, 35, 199. [Google Scholar]
- Anna, K.; Janusz, P.; Stefan, W.; Wzorek, M.; Królczyk, G.; Król, A. Energy and emergy analysis of mixed crop-livestock farming. E3S Web of Conferences 2017, 19, 02033. [Google Scholar] [CrossRef]
- Wu, X.H.; Wu, F.Q.; Wu, J.; Sun, L. Emergy-based sustainability assessment for a five-in-one integrated production system of apple, grass, pig, biogas, rainwater on the loess plateau, northwest china. J. Sustain. Agric. 2015, 39, 666–690. [Google Scholar] [CrossRef]
- Jianyuan, W. Emergy analysis of agroecosystems in shandong province of china. Chin. J. Ecol. 2007, 26, 718–722. [Google Scholar]
- Chen, W.; Zhong, S.Z.; Geng, Y.; Chen, Y.H.; Cui, X.W.; Wu, Q.; Pan, H.Y.; Wu, R.; Tian, X. Emergy based sustainability evaluation for Yunnan Province, China. J. Clean Prod. 2017, 162, 1388–1397. [Google Scholar] [CrossRef]
- Wang, X.L.; Tan, K.M.; Chen, Y.C.; Chen, Y.; Shen, X.F.; Zhang, L.; Dong, C.X. Emergy-based analysis of grain production and trade in China during 2000–2015. J. Clean Prod. 2018, 193, 59–71. [Google Scholar] [CrossRef]
- Duan, N.; Lin, C.; Liu, X.D.; Wen, S.; Zhang, X. Energy analysis of biogas-linked eco-village circulating system. Trans Chin Soc Agric Eng. 2015, 31, 261–268. [Google Scholar]
- Zhang, C.G.; Qiu, L. Comprehensive sustainability assessment of a biogas-linked agro-ecosystem: A case study in China. Clean Technol. Environ. Policy. 2018, 20, 1847–1860. [Google Scholar] [CrossRef]
- Shrestha, B.; Chang, S.; Bork, E.; Carlyle, C. Enrichment Planting and Soil Amendments Enhance Carbon Sequestration and Reduce Greenhouse Gas Emissions in Agroforestry Systems: A Review. Forests 2018, 9, 369. [Google Scholar] [CrossRef]
- Castellini, C.; Bastianoni, S.; Granai, C.; Bosco, A.D.; Brunetti, M. Sustainability of poultry production using the emergy approach: comparison of conventional and organic rearing systems. Agric. Ecosyst. Environ, 2006, 114, 343–350. [Google Scholar] [CrossRef]
- Ciotola, R.J.; Lansing, S.; Martin, J.F. Emergy analysis of biogas production and electricity generation from small-scale agricultural digesters. Ecol. Eng. 2011, 37, 1681–1691. [Google Scholar] [CrossRef]
- Yang, J.; Chen, B. Emergy analysis of a biogas-linked agricultural system in rural China—A case study in Gongcheng Yao Autonomous County. Appl. Energy. 2014, 118, 173–182. [Google Scholar] [CrossRef]
- Yu, X.; Geng, Y.; Dong, H.; Fujita, T.; Liu, Z. Emergy-based sustainability assessment on natural resource utilization in 30 chinese provinces. J. Clean Prod. 2016, 133, 18–27. [Google Scholar] [CrossRef]
- Agostinho, F.; Diniz, G.; Raúl, S.; Ortega, E. The use of emergy assessment and the geographical information system in the diagnosis of small family farms in brazil. Ecol. Model. 2008, 210, 37–57. [Google Scholar] [CrossRef]
- Chen, G.Q.; Jiang, M.M.; Chen, B.; Yang, Z.F.; Lin, C. Emergy analysis of chinese agriculture. Agric. Ecosyst. Environ. 2006, 115, 161–173. [Google Scholar] [CrossRef]
- Campbell, E.T.; Tilley, D.R. Relationships between renewable emergy storage or flow and biodiversity: A modeling investigation. Ecol. Model. 2016, 340, 134–148. [Google Scholar] [CrossRef]
- Zhang, Y.; Yang, Z.; Yu, X. Ecological network and emergy analysis of urban metabolic systems: Model development, a case study of four chinese cities. Ecol. Model., 2009, 220, 1431–1442. [Google Scholar] [CrossRef]
- Martin, J.F.; Diemont, S.A.W.; Powell, E.; Stanton, M.; Levy-Tacher, S. Emergy evaluation of the performance and sustainability of three agricultural systems with different scales and management. Agric. Ecosyst. Environ. 2006, 115, 128–140. [Google Scholar] [CrossRef]
- Cho, C.J. An exploration of reliable methods of estimating emergy requirements at the regional scale: Traditional emergy analysis, regional thermodynamic input-output analysis the conservation rule-implicit method. Ecol. Model. 2013, 251, 288–296. [Google Scholar] [CrossRef]
- Patterson, M.G. Are all processes equally efficient from an emergy perspective? Analysis of ecological and economic networks using matrix algebra methods. Ecol. Model. 2012, 226, 77–91. [Google Scholar] [CrossRef]
- Lu, H.F.; Campbell, D.E.; Li, Z.A.; Ren, H. Emergy synthesis of an agro-forest restoration system in lower subtropical China. Ecol. Eng. 2006, 27, 175–192. [Google Scholar] [CrossRef]
- Lan, S.F.; Odum, H.T.; Liu, X.M. Energy flow and emergy analysis of the agroecosystems of China. Ecol. Sci. 1998, 1, 17. [Google Scholar]


| Pattern | Product | Location | Pre-investment | Harvest Period | Planting Area |
|---|---|---|---|---|---|
| Corn planting (CP) | Corn | Slope | Almost none | July and August | 1.33 × 10⁴ ha |
| Apple planting (AP) | Apple | Slope | The first four years after planting require daily management and fertilizer input | July, August, September | 4.67 × 10³ ha |
| Apple-soybean inter-planting (ASP) | Apple, soybean seedings | Slope | The first four years after planting require daily management and fertilizer input | July, August, September | 3.27 × 10² ha |
| Pear planting (PP) | Pear | Slope and plain | The first four years after planting require daily management and fertilizer input | July, August, September | 6.67 × 10³ ha |
| Pear-pumpkin inter-planting (PPP) | Pear, pumpkin seedings | Slope | The first four years after planting require daily management and fertilizer input | July, August, September | 3.34 × 10² ha |
| Pomegranate cultivation (PRP) | Pomegranate | Bazi (middle plain of the basin) | The first five years after planting require daily management and fertilizer input | July and August | 8.33 × 10³ ha |
| Pomegranate-grass-sheep pattern (PGSP) | Pomegranate, sheep | Bazi (middle plain of the basin) | The first five years after planting require daily management and fertilizer input | July and August | 8.33 × 10² ha |
| Index | Function | Definition |
|---|---|---|
| Emergy-power density (EPD) | U/area | Intensity and level of economic development |
| Emergy self-sufficiency ratio (ESR) | I/U | Degree of self-sufficiency and dependence on the outside world. The autarkic ability of the system is direct proportion to the ESR. |
| Emergy yield ratio (EYR) | Y1/F | Net contribution to the economy beyond its own operation |
| Environmental loading ratio (ELR) | (N+FN)/(R+FR) | Reflects system environmental stress and sustainability |
| Emergy restoration ratio (ERR) | Y2/F | Ecological benefits of rocky-desertification control |
| Emergy benefit ratio (EBR) | (Y1+Y2)/F | Ecological and economic benefits of rocky-desertification control |
| Emergy sustainability index (ESI) | EYR/ELR | Sustainability of the system. ESI value ranged from 1 to 10, is direct proportion to the sustainability of the production system. |
| Scenarios | Definition | Status after 5 years |
|---|---|---|
| Baseline scenario | Government and business have not adjusted the existing promotion and subsidy policies; the regional planting structure has not changed significantly. There is no major technological change in farming methods. | Pomegranate planting area is 10,000 ha, 10% of which is PGSP. Apple planting area is 6330 ha, 7% of which is ASP. Pear planting area is 3000 ha, 5% of which is PPP. Corn planting area is 13,670 ha. |
| Improvement scenario | Government and business have promoted the transformation of the planting structure, especially the transition from original planting patterns to ecological planting patterns. | Pomegranate planting area is 10,600 ha, 15% of which is PGSP. Apple planting area is 7000 ha, 10% of which is ASP. Pear planting area is 3000 ha, 7% of which is PPP. Corn planting area is 12,400 ha. |
| Optimization scenario | Based on the improvement scenario, the government has promoted the transformation of corn cultivation to pomegranate and apple, actively promoted the transformation of the traditional patterns to the ecological patterns. | Pomegranate planting area is 11,330 ha, 30% of which is PGSP. Apple planting area is 8670 ha, 15% of which is ASP. Pear planting area is 3000 ha, 10% of which is PPP. Corn planting area is 10,000 ha. |
| Indices | CP | AP | ASP | PP | PPP | PRP | PGSP |
|---|---|---|---|---|---|---|---|
| Emergy-power Density (EPD) (×E+11) | 18.20 ± 4.92 | 42.04 ± 18.26 | 42.91 ± 17.51 | 37.38 ± 4.66 | 38.59 ± 3.98 | 296.54 ± 11.53 | 220.74 ± 50.88 |
| Emergy Self-sufficiency Ratio (ESR) | 0.15 ± 0.05 | 0.58 ± 0.20 | 0.56 ± 0.19 | 0.55 ± 0.06 | 0.53±0.05 | 0.12 ± 0.01 | 0.08 ± 0.02 |
| Emergy Yield Ratio (EYR) | 0.99 ± 0.06 | 2.70 ± 1.03 | 2.51 ± 0.87 | 2.22 ± 0.34 | 2.14±0.25 | 2.41 ± 0.58 | 3.52 ± 0.82 |
| Environmental loading Ratio (ELR) | 1.30 ± 0.0.05 | 14.63 ± 6.34 | 14.96 ± 6.06 | 12.69 ± 1.09 | 13.13±0.92 | 13.80 ± 2.26 | 4.95 ± 0.93 |
| Emergy Restoration Ratio (ERR) | 4.64 ± 1.78 | 1.10 ± 0.60 | 1.04 ± 0.55 | 1.14 ± 1.03 | 1.08±0.89 | 0.41 ± 0.01 | 0.62 ± 0.15 |
| Emergy Benefit Ratio (EBR) | 5.63 ± 1.80 | 3.80 ± 1.64 | 3.55 ± 1.42 | 3.36 ± 1.36 | 3.22±1.14 | 2.82 ± 0.58 | 4.17 ± 0.89 |
| Emergy Sustainability Index (ESI) | 0.76 ± 0.02 | 0.22 ± 0.13 | 0.20 ± 0.11 | 0.18 ± 0.04 | 0.16±0.03 | 0.18 ± 0.06 | 0.74 ± 0.28 |
| Indices | CP | AP | ASP | PP | PPP | PRP | PGSP |
|---|---|---|---|---|---|---|---|
| Input with If (I) (yuan year−1 ha−1) | 27,145.83 | 28,034.67 | 30,521.33 | 32,374.33 | 34,386.83 | 164,662.50 | 212,679.33 |
| Input without If (Ia) (yuan year−1 ha−1) | 5379.17 | 24,140.67 | 25,324 | 23,183.33 | 24,445.83 | 83,908.33 | 64,276.83 |
| Output (O) (yuan year−1 ha−1) | 12,650.00 | 111,890.00 | 117,033.33 | 107,083.33 | 13,7402.08 | 520,000.00 | 583,250.00 |
| Economic Output /Input with If (O/I) | 0.46 ± 0.06 | 4.72 ± 1.22 | 4.25 ± 0.80 | 3.33 ± 0.71 | 4.03 ± 0.80 | 3.15 ± 0.78 | 2.72 ± 0.52 |
| Economic Output/Input without If (O/I) | 2.36 ± 0.12 | 5.5 ± 1.43 | 5.23 ± 1.08 | 4.73 ± 1.22 | 5.77 ± 1.43 | 6.17 ± 1.53 | 9.04 ± 1.98 |
| Unit economic benefit (EBU, O-I) (yuan year−1 ha−1) | 7270.8 ± 2406.25 | 83,855.33 ± 46,050.60 | 86,512 ± 46,761.43 | 74,709 ± 24,596.39 | 103,015.25 ± 26,618.89 | 355,337.5 ± 131,544.00 | 370,570.67 ± 130,768.10 |
| Unit net economic benefit (EPBU, O-Ia) (yuan year−1 ha−1) | 14,495.83 ± 2296.48 | 87,749.33 ± 49,540.65 | 91,709.33 ± 50,109.60 | 83,900 ± 25,640.93 | 112,956.25 ± 27,539.48 | 436,091.67 ± 136,716.63 | 518,973.17 ± 141,696.23 |
| Scenario | Total planting area (ha) | Total net economic benefit (yuan year−1 ha−1) | EACI (%) | Total economic benefit (yuan year−1 ha−1) | EACI (%) | Total ecological benefit (sej year−1 ha−1) | EACI (%) |
|---|---|---|---|---|---|---|---|
| Current situation | 30,799 | 3,527,170,867 | 4,600,534,572 | 1.37953 × 10²¹ | |||
| Baseline scenario | 33,000 | 4,136,793,863 | 9.4 | 5,362,392,475 | 8.8 | 1.5866 × 10²¹ | 0.2 |
| Improvement scenario | 33,000 | 4,435,287,213 | 17.4 | 5,725,326,213 | 16.1 | 1.68236 × 10²¹ | 6.2 |
| Optimization scenario | 33,000 | 4,900,887,703 | 29.7 | 6,326,987,305 | 28.4 | 1.85222 × 10²¹ | 17.0 |
© 2019 by the authors. Licensee MDPI, Basel, Switzerland. This article is an open access article distributed under the terms and conditions of the Creative Commons Attribution (CC BY) license (http://creativecommons.org/licenses/by/4.0/).
Share and Cite
Zou, Z.; Zeng, F.; Wang, K.; Zeng, Z.; Zhao, L.; Du, H.; Zhang, F.; Zhang, H. Emergy and Economic Evaluation of Seven Typical Agroforestry Planting Patterns in the Karst Region of Southwest China. Forests 2019, 10, 138. https://doi.org/10.3390/f10020138
Zou Z, Zeng F, Wang K, Zeng Z, Zhao L, Du H, Zhang F, Zhang H. Emergy and Economic Evaluation of Seven Typical Agroforestry Planting Patterns in the Karst Region of Southwest China. Forests. 2019; 10(2):138. https://doi.org/10.3390/f10020138
Chicago/Turabian StyleZou, Zhigang, Fuping Zeng, Kelin Wang, Zhaoxia Zeng, Leilei Zhao, Hu Du, Fang Zhang, and Hao Zhang. 2019. "Emergy and Economic Evaluation of Seven Typical Agroforestry Planting Patterns in the Karst Region of Southwest China" Forests 10, no. 2: 138. https://doi.org/10.3390/f10020138
APA StyleZou, Z., Zeng, F., Wang, K., Zeng, Z., Zhao, L., Du, H., Zhang, F., & Zhang, H. (2019). Emergy and Economic Evaluation of Seven Typical Agroforestry Planting Patterns in the Karst Region of Southwest China. Forests, 10(2), 138. https://doi.org/10.3390/f10020138