1. Introduction
While trees planted for sawn-timber products need to grow until they have reached large dimensions, trees grown for pulpwood or biomass should only be harvested when the land expectation value (LEV) is maximized, or when sufficient mature wood has been produced as per the specification of the pulp-making process [
1]. Unfortunately, the productivity of conventional harvesting techniques is directly proportional to stem size, and is especially low in pulpwood-size plantations [
2]—hence, the development of multi-tree technology that can compensate for small tree size by handling more trees at one time [
3]. Many studies confirm that mass handling is the best solution when harvesting pulpwood plantations [
4,
5,
6]. That is normally obtained by deploying feller-bunchers, grapple skidders, and chain flail delimber–debarkers (CFDDs) [
7].
CFDDs are multi-stem processing machines that knock off branches and bark from whole trees by using hardened chain links mounted on fast-rotating drums [
8]. These machines may achieve a productivity in excess of 40 t per productive machine hour, and easily remove all limbs and most of the bark off the stem [
9,
10,
11,
12]. While somewhat rough, flailing can be fine-tuned to minimize fiber losses, which are generally lower than 5% [
13,
14].
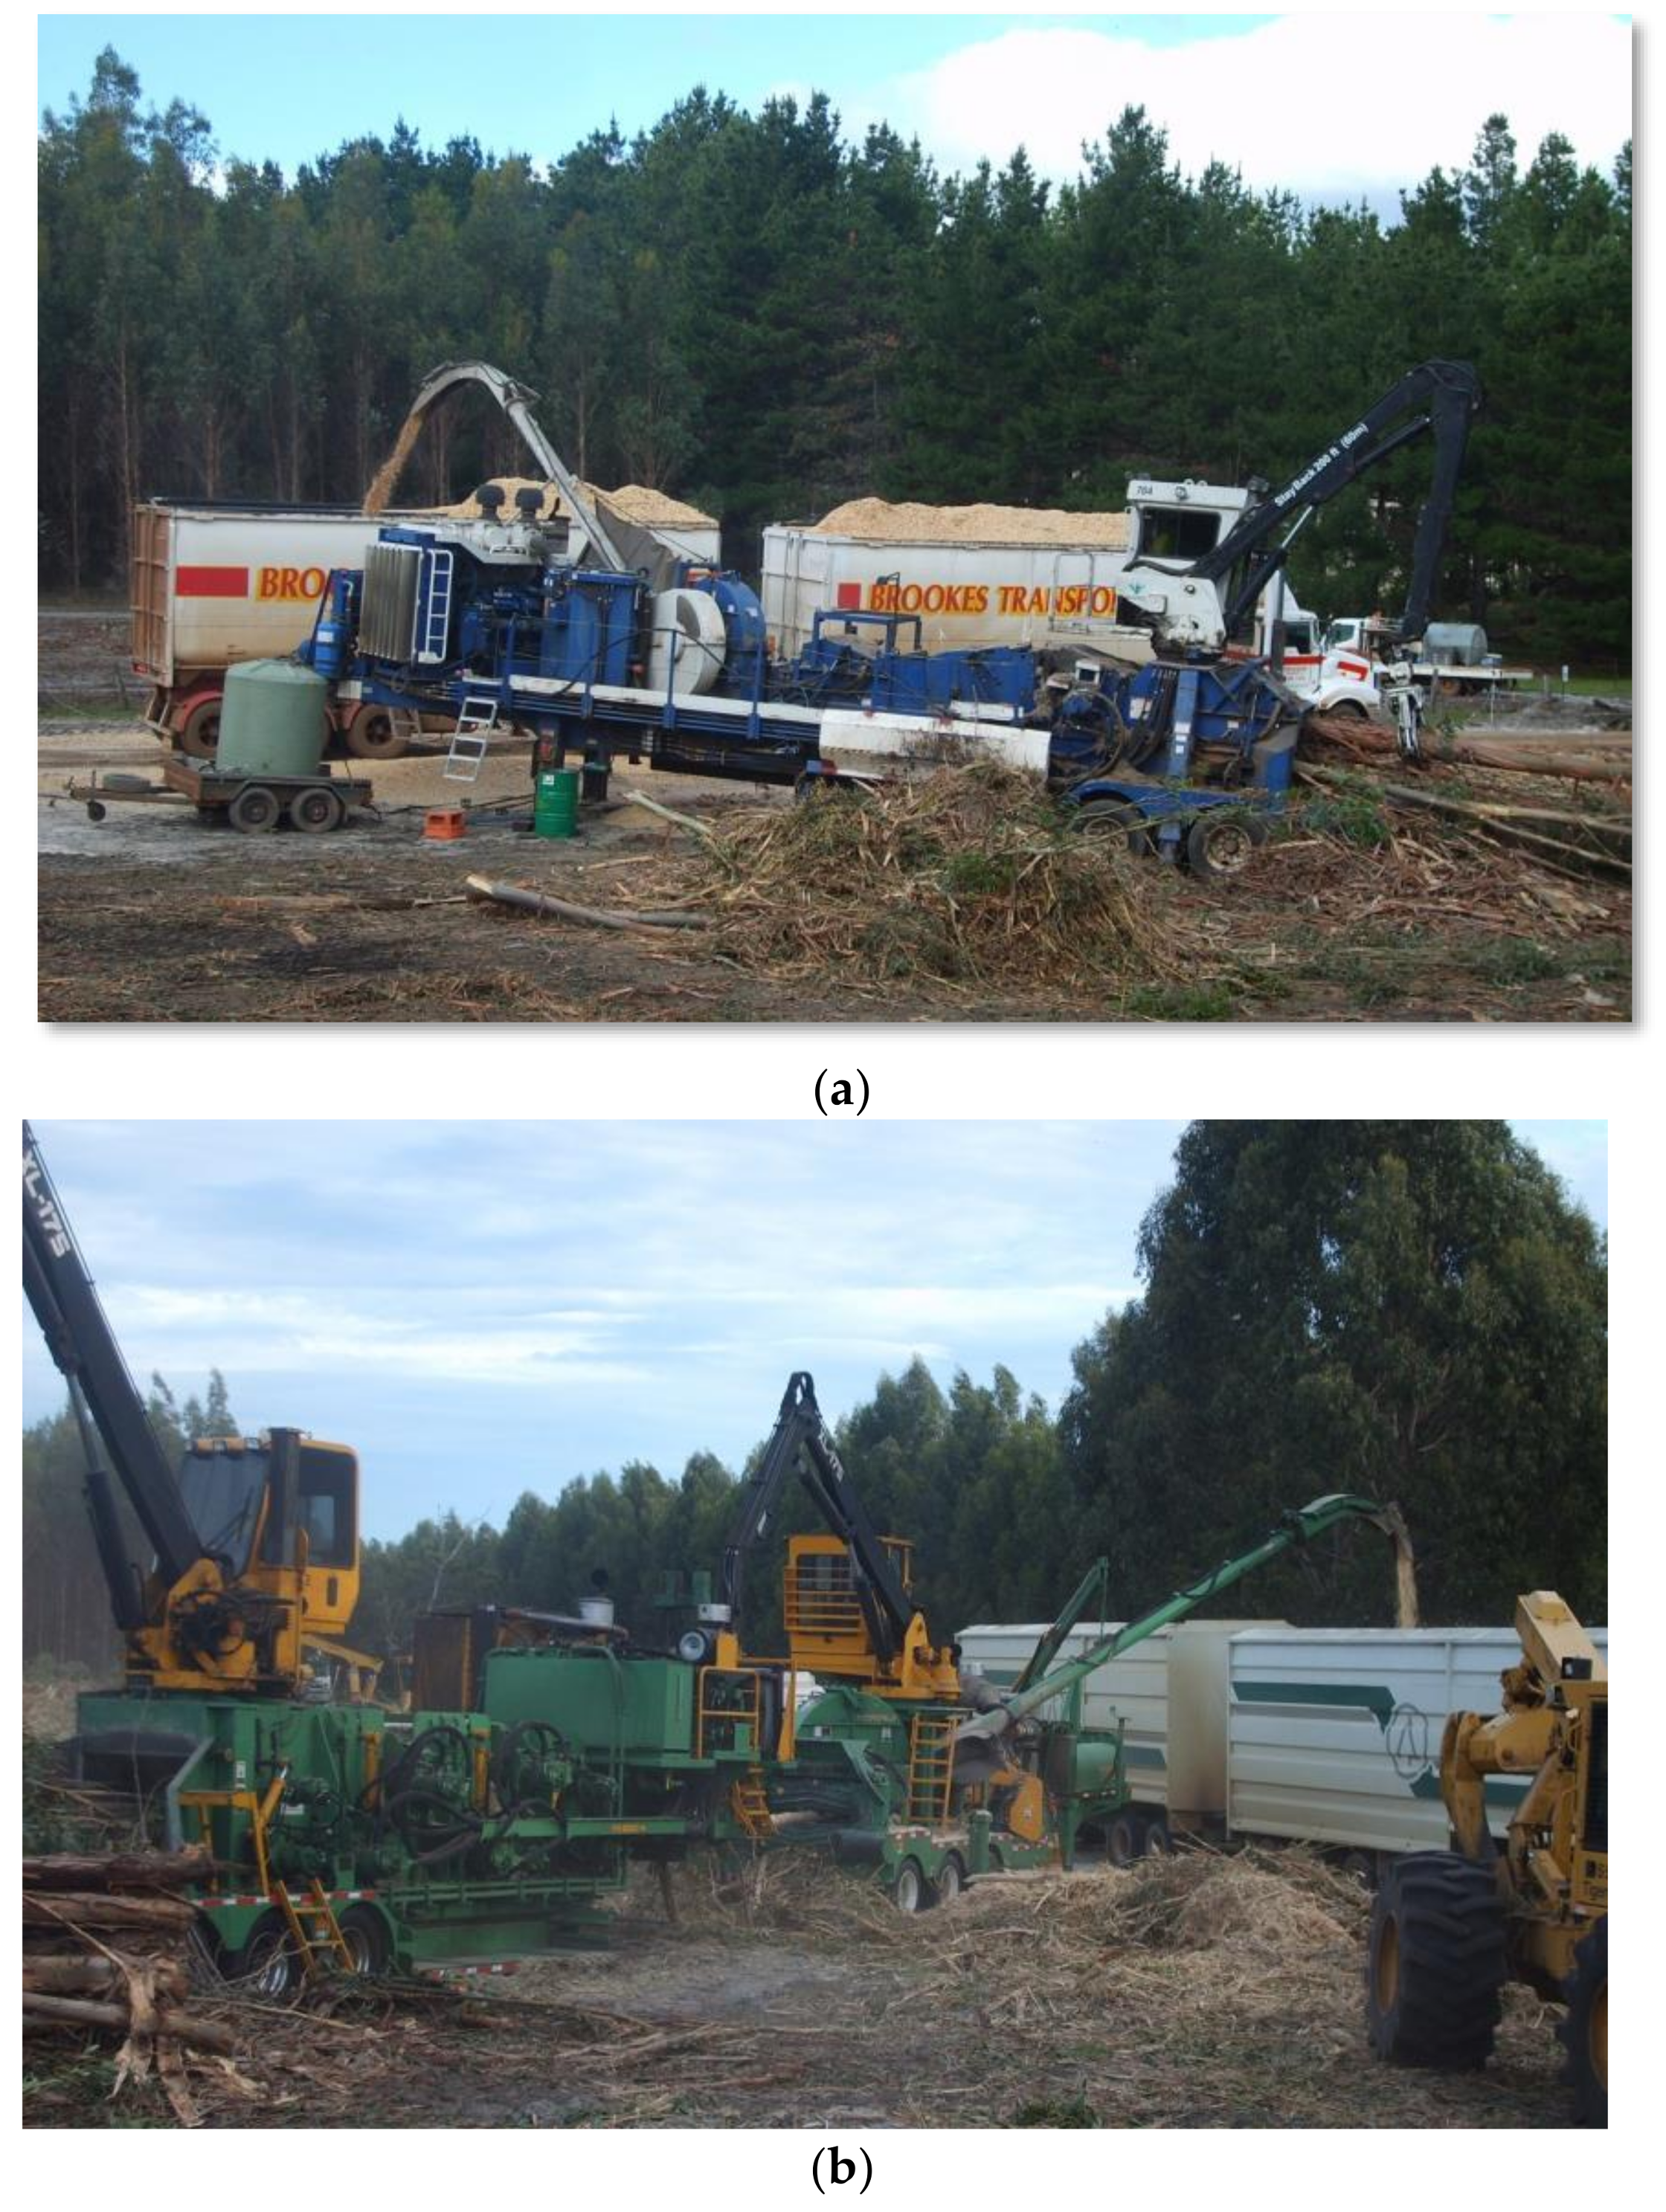
Most operators couple their CFDD with a chipper to produce clean chips from whole trees in one pass. Chips are blown directly into chip vans, thus saving on loading cost. The coupling of chippers and CFDDs can be obtained in two different ways: (1) simply parking a chipper with its infeed table against the outfeed to the CFDD, or (2) joining the CFDD and the chipper into one integrated machine specifically designed to perform the three tasks (i.e., delimbing, debarking, and chipping) in a sequence, conventionally called CFDDC. Each option has its own advantages and disadvantages.
CFDDs’ feeding into stand-alone chippers (termed here as “combination machines”) offer the flexibility of producing debarked and debranched tree lengths if desired, as opposed to chips only. The CFDD operator can concentrate fully on optimal tree intake, relieved of having to watch material exiting the waste chute, which may support higher productivity. Use of a combination machine may also result in cleaner chips as monitoring of debarking quality is easier [
15], and the operator can eventually extend the distance between the CFDD and the chipper to create additional space for the bark to drop down [
16]. On the other hand, switching to an integrated machine removes the need for two loaders, two operators, and two engines, and that inevitably drives cost down [
17]. Furthermore, an integrated machine takes less landing space and is easier to relocate compared with a combination machine.
However, any comparisons between integrated and combination machines are difficult without reliable information on the productivity and work quality characterizing each option. Most available data are anecdotal and no one can demonstrate whether one option is more productive than the other, or if it offers better debarking quality. In fact, achieving top debarking quality is a pre-requisite for any successful CFDDC operation: properly adjusted machines are capable of producing chips with a bark content of less than one percent [
14,
18], equaling or exceeding the quality performance of fixed mill yard installations [
19,
20]. Top quality performance is obtained by skillful manipulation of load size, feed speed, flail speed, chain type, and chain condition, among others [
21]. This is true for both machine types, and one may assume debarking quality to be within specifications for any commercial operation, regardless of machine type. On the other hand, machine design and specific machine setting are likely to impact productivity, which may vary between equipment configurations.
This study aims to determine if any significant productivity differences exist between combination and integrated equipment types. The null hypothesis is that of no significant difference in productivity between equipment types.
2. Materials and Methods
2.1. Sites and Operations
The study examined seven operations across various sites in Western Australia (
Table 1), which was chosen for its large concentration of CFDDC systems. Each equipment type (i.e., combination or integrated) was researched at various sites, in order to explore a wide range of tree sizes, tree characteristics, and crews, as required for drawing general conclusions. All machines worked with 11-year-old blue gum (
Eucalyptus globulus Labill.), and all chips were trucked to the nearest harbor for shipping to Japan. Chip loading and transport operations were integrated to the operation of the CFDDCs. All chip trucks consisted of truck tractors with semi-trailers pulling drawbar trailers (i.e., road trains). These vehicles were approximately 27 m long, with a maximum loaded mass of 75 tonnes and a tare weight of 25 tonnes, resulting in a payload of approximately 50 tonnes. Exact mass figures differed according to road train configuration and design.
All integrated machines were Peterson Pacific 5000 models, version H (Site 1) or G (Sites 2 to 4). All integrated machines featured an 840 kW engine that powered three flail drums, a 3-pocket chipper disc with a diameter of 1.67 m, and the single hydraulic loader used for feeding. All combination machines (sites 5 to 7) consisted of a Precision Husky FD 4300 flail debarker (4 flail drums and a loader, powered by a 430 kW engine) coupled with a Precision Husky WTC 2366 whole-tree chipper (3-pocket chipper disc with a diameter of 1.67 and hydraulic loader, powered by a 875 kW engine). Except for the fourth flail drum on the combination machine, the design of the two machine types was equivalent, but the power invested in the combination machine was over 50% higher than in the integrated machine (
Figure 1).
In all cases, whole trees were dragged to the CFDDC with heavy grapple skidders, either Caterpillar 545J (Site 1) or Tigercat 630C (all other sites). Depending on the extraction distance, CFDDCs were served by one or two skidders, in order to maintain system balance.
All the operators had been working with their machines for at least six months prior to the study, and were sufficiently skilled and efficient. The researchers used their experience to determine whether operators could be classified as ‘average workers’, as defined by the International Labour Office [
22]. Operators were instructed to work at their normal pace. The chains were inspected at least once per shift, and more often if there were any delays. Chains were rotated after 18 h of work, and replaced after 27 h (total work time).
2.2. Data Collection
Machine productivity was estimated with a typical time study [
23]. The processing (i.e., delimbing, debarking, and chipping) of one grapple load (one to four trees) represented one observation. For each observation, valid records contained information about: number of trees in the load; volume, form, and bark–wood bond strength (BWBS) of each tree in the load; processing time required for turning the full load into bark-free chips.
Stem volume was determined with volume tables, which returned volume under bark in cubic meters (m
3) as a function of diameter at breast height and total tree height [
24]. A height–diameter curve for each test site was developed using 30 sample trees, evenly distributed across all diameter classes. The diameter of all trees fed to the CFDDC was measured beforehand with a diameter tape, in order to determine volume under bark. Based on that, each tree was assigned one of the five volume classes shown in
Table 2, which was identified with a color code painted on the tree in highly visible paint. In order to validate table estimates, researchers obtained the mill scale weights of all trucks filled with study trees. Table volumes were known for each truck load, and these were converted into weights using 1.1 t m
−3 as the reference figure for wood density [
25]. Then, the resulting estimated weight of each truck was compared with its mill scale weight.
Bark–wood bond strength was assessed by removing a strip of bark from sample trees with a hatchet [
26]. Trees were assigned to one of the five BWBS classes, as described in
Table 2.
The form of each tree in a load was visually assessed using two main categories: good and poor. Good form described trees that were straight, with no visible defects. Conversely, poor form described trees that were bent, forked, or flawed with a marked basal sweep (i.e., pistol butts).
The time taken to process each individual load was recorded using an electronic stopwatch and entered into pre-printed data sheets. Productive time was separated from delay time [
27] and split into functional elements [
28]. Delay time was also split into the three conventional groups known as mechanical, personnel, and operational delays [
29].
2.3. Data Analysis
The dataset was analyzed with SAS StatView 5.1 advanced statistics software, in order to extract descriptive statistics and to check the statistical significance of any differences between the mean and median values of the main parameters characterizing the two treatments on trial (e.g., time per cycle, trees per load, volume, etc.). Before analysis, the data were tested for normality using Ryan-Joyner test, and for homoscedasticity using Bartlett’s test. The distribution of most of the original dataset violated the normality assumption and, therefore, centrality was described through median values rather than mean values. For the same reason, the significance of any eventual differences was tested with non-parametric tests, such as Mann–Whitney and Kruskal–Wallis. Use of non-parametric tests also suited the analysis of ordinal data, such as BWBS and form class attributions. Furthermore, chi-square (χ2) analysis allowed for checking if the distribution of data among the various BWBS and form classes was the same for the two machine type treatments.
The original dataset was obtained from an observational study and showed a certain lack of balance. In particular, the combination machine treatment was associated with a larger proportion of small tree and high BWBS observations, compared with the integrated machine treatment. Therefore, this dataset was resampled by randomly extracting equal numbers of observations with the same tree size and BWBS values for both machine type treatments. Productivity figures in the new dataset were normalized through square-root transformation, and were tested through the analysis of co-variance (ANCOVA). In fact, resampling did not allow for building a perfectly balanced dataset, because data for the integrated machines still contained a slightly larger number of trees with poor form. In any case, this difference was small—although significant—and it would dampen rather than enhance the eventual productivity difference between the two treatments, so it would not invalidate an eventual significance verdict.
Regression analysis was used to test the significance of any relationships between productivity (dependent variable) and such factors (independent variables) as: mean tree volume; machine type (integrated or combination); tree form; BWBS. The last three factors were introduced as indicator variables, after generating as many variables as the number of levels minus one, or, one indicator variable for poor form; two indicator variables for good and poor BWBS, since the dataset did not contain any observations for very good and very poor BWBS. Even though the characteristics of each tree were known, operational constraints made it impossible to group trees with the same characteristics together in the same load. Therefore, loads contained a mix of trees with different characteristics. For this reason, the form and BWBS information associated with each load represented the average value for a relatively diversified mix, which weakened the impact of the respective indicator variables. Different models were tested, and the final choice fell on the model that offered high significance, good correlation, and a logical interpretation. Compliance with the statistical assumptions was further checked through the analysis of residuals. In all analyses, the elected significance level was α < 0.05.
The study covered 45 h, of which over 40% were represented by delay time (
Table 3). The study included 3395 cycles, leading to the production of 1112 m
3 solid volume under bark. Production volume was evenly distributed between the two treatments (i.e., integrated and combination), with approximately 500 m
3 each.
3. Results
Combination machines were 20% less productive than integrated machines, with a median value of 37 m
3 solid volume under bark per productive machine hour (PMH, excluding delays) vs. 47 m
3 PMH
−1, respectively (
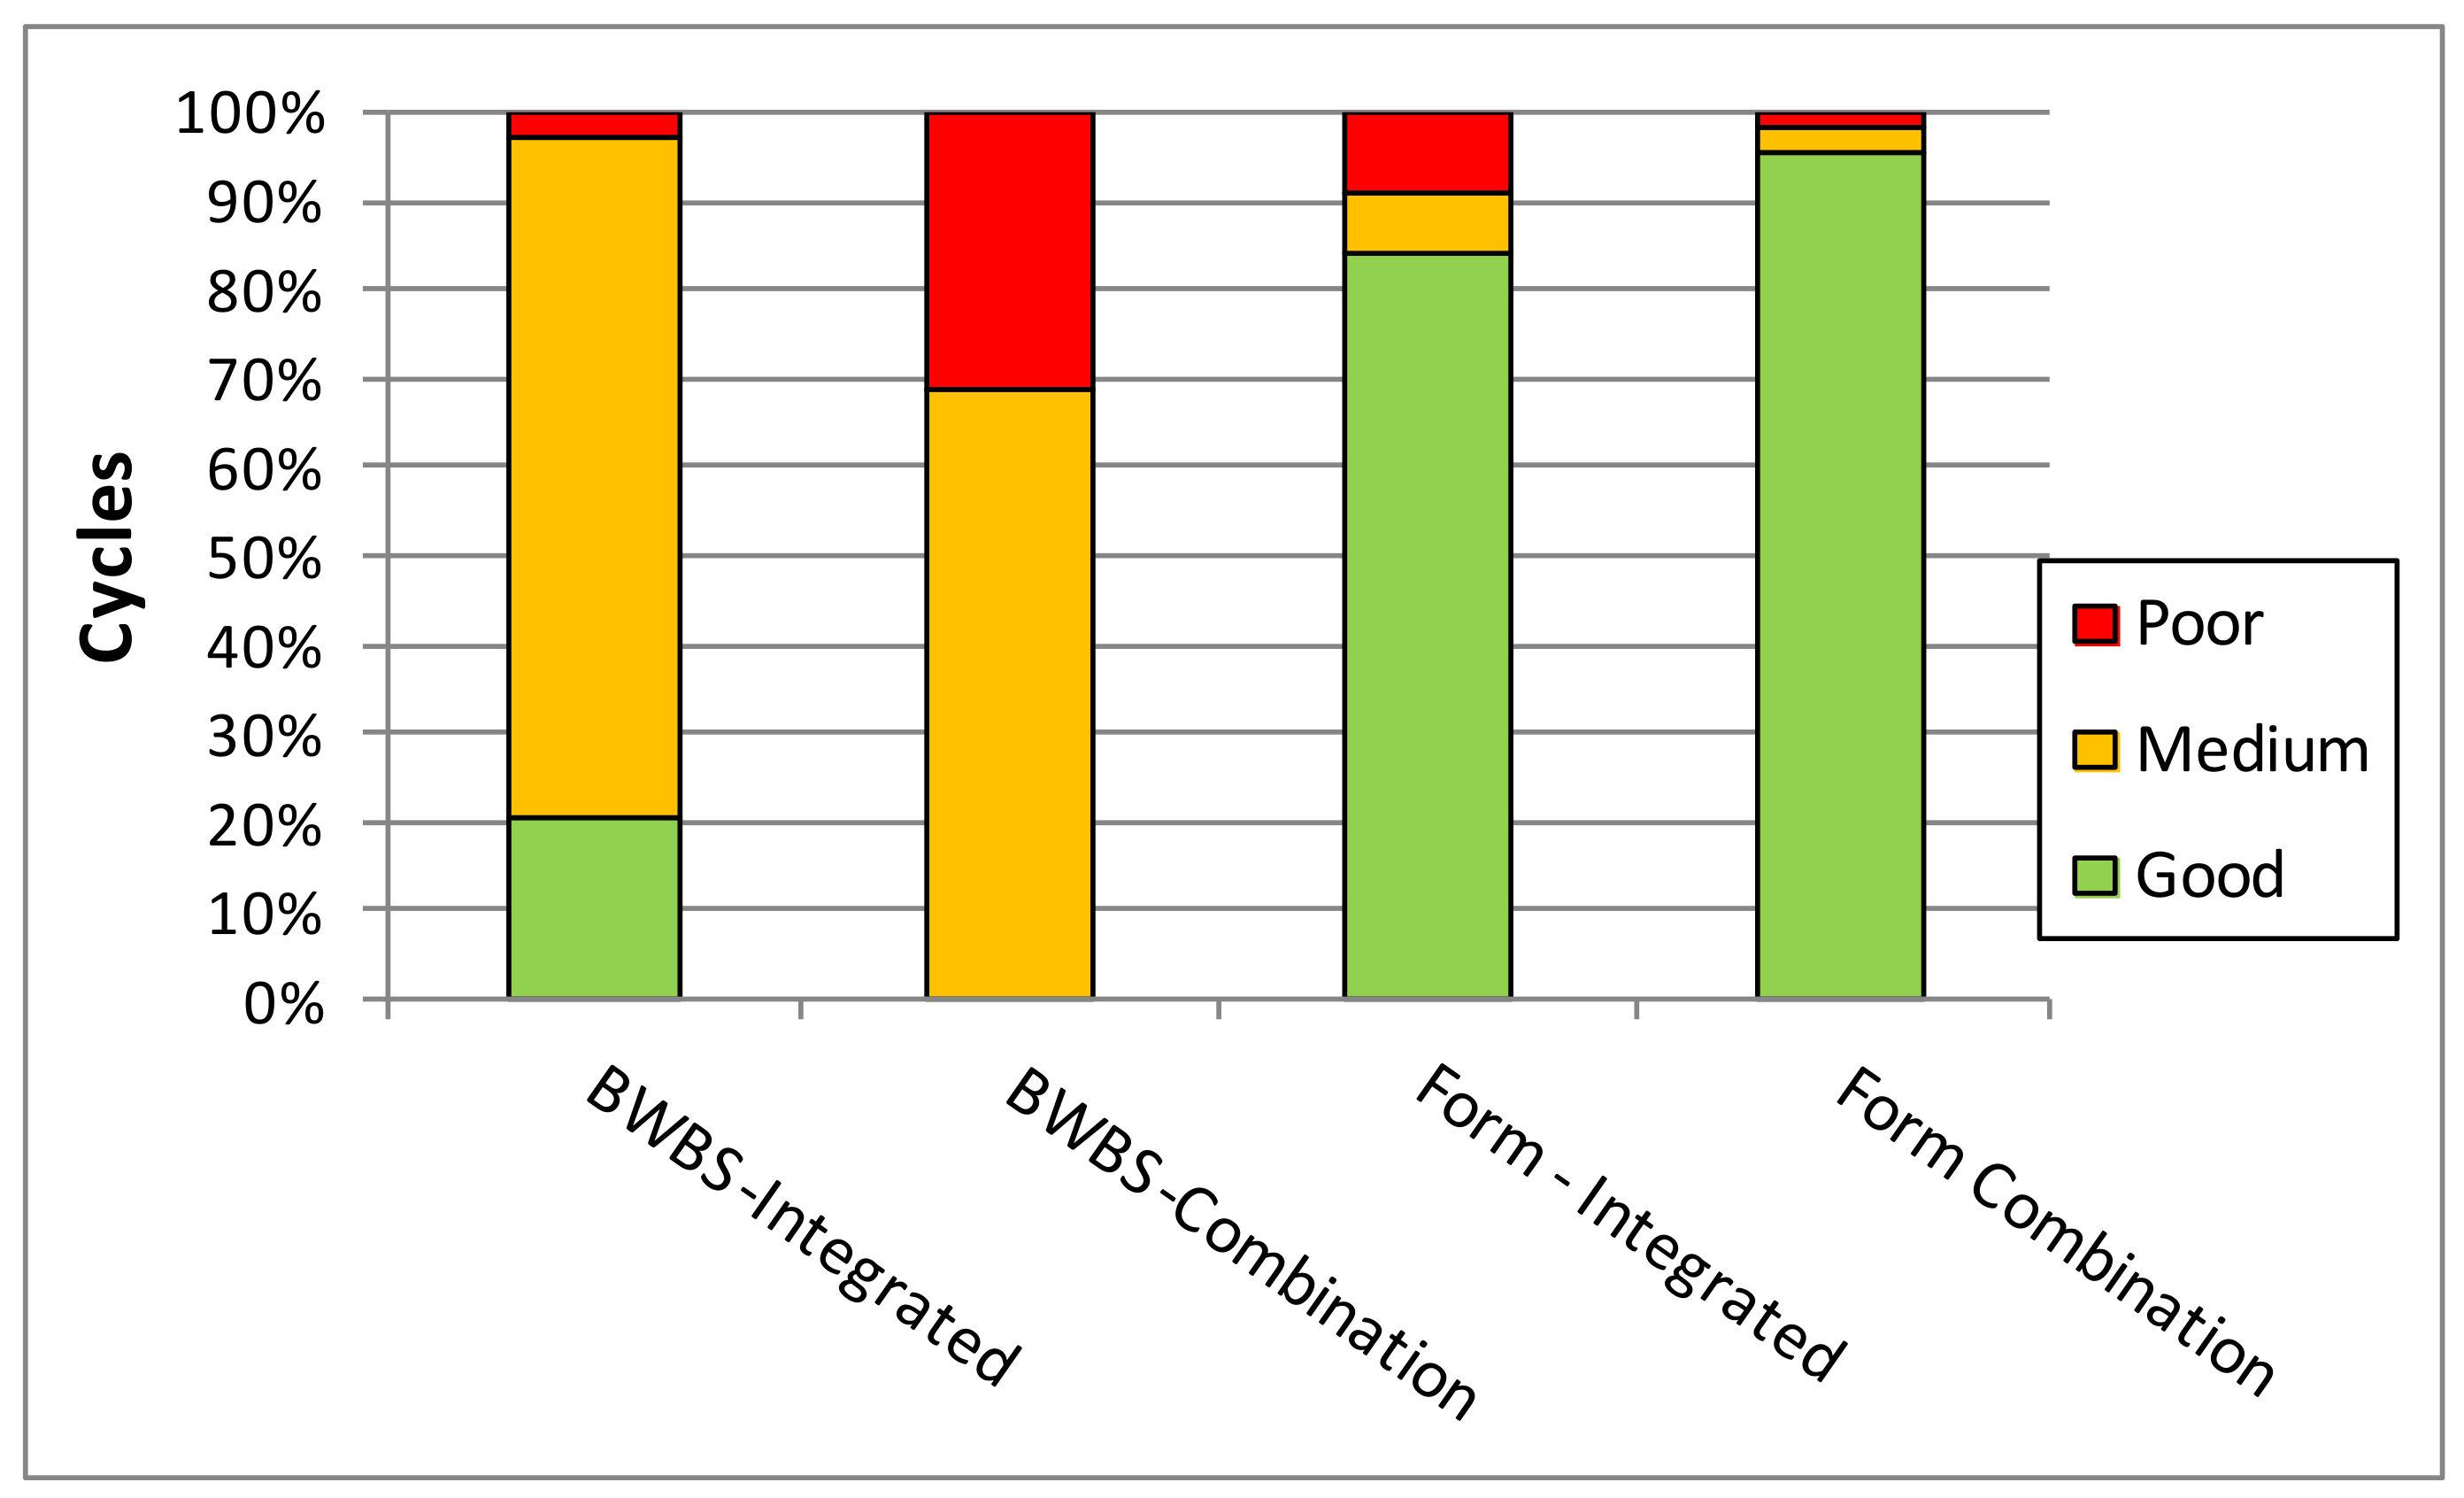
Table 4). However, combination machines also handled smaller tree sizes—in order to process the same amount of clean chips from trees that were 27% smaller, combination machines took 44% more time than integrated machines. Furthermore, combination machines processed a significantly larger proportion of trees with a high BWBS (class 4 = poor), compared with integrated machines (
Figure 2). By contrast, integrated machines negotiated a larger share of trees with poor form (
p < 0.001). Therefore, the analysis of the medians could not indicate whether combination machines were inherently less productive than integrated machines, because work conditions were different for the two treatments and less favorable for the combination machines.
Analysis of the balanced dataset obtained from resampling confirmed the lower productivity of combination machines, even under the same piece size and BWBS conditions (
Table 5). Combination machines incurred a significantly larger time consumption per cycle, which was not fully offset by the significantly larger cycle loads they managed to accumulate.
Normalized resampled data were also tested through the analysis of covariance, in order to gauge how much net productivity was affected by each of the main study variables, namely, machine type, tree size, BWBS, and tree form (
Table 6). The effect of machine type proved significant, but it was much weaker than the effects of tree size and BWBS. Form had the weakest effect, although still significant. Interaction effects were not significant, and they were removed from the table to avoid clutter. In any case, the main study variables only accounted for 30% of the total variability in the dataset, pointing at the strong effect of random variability.
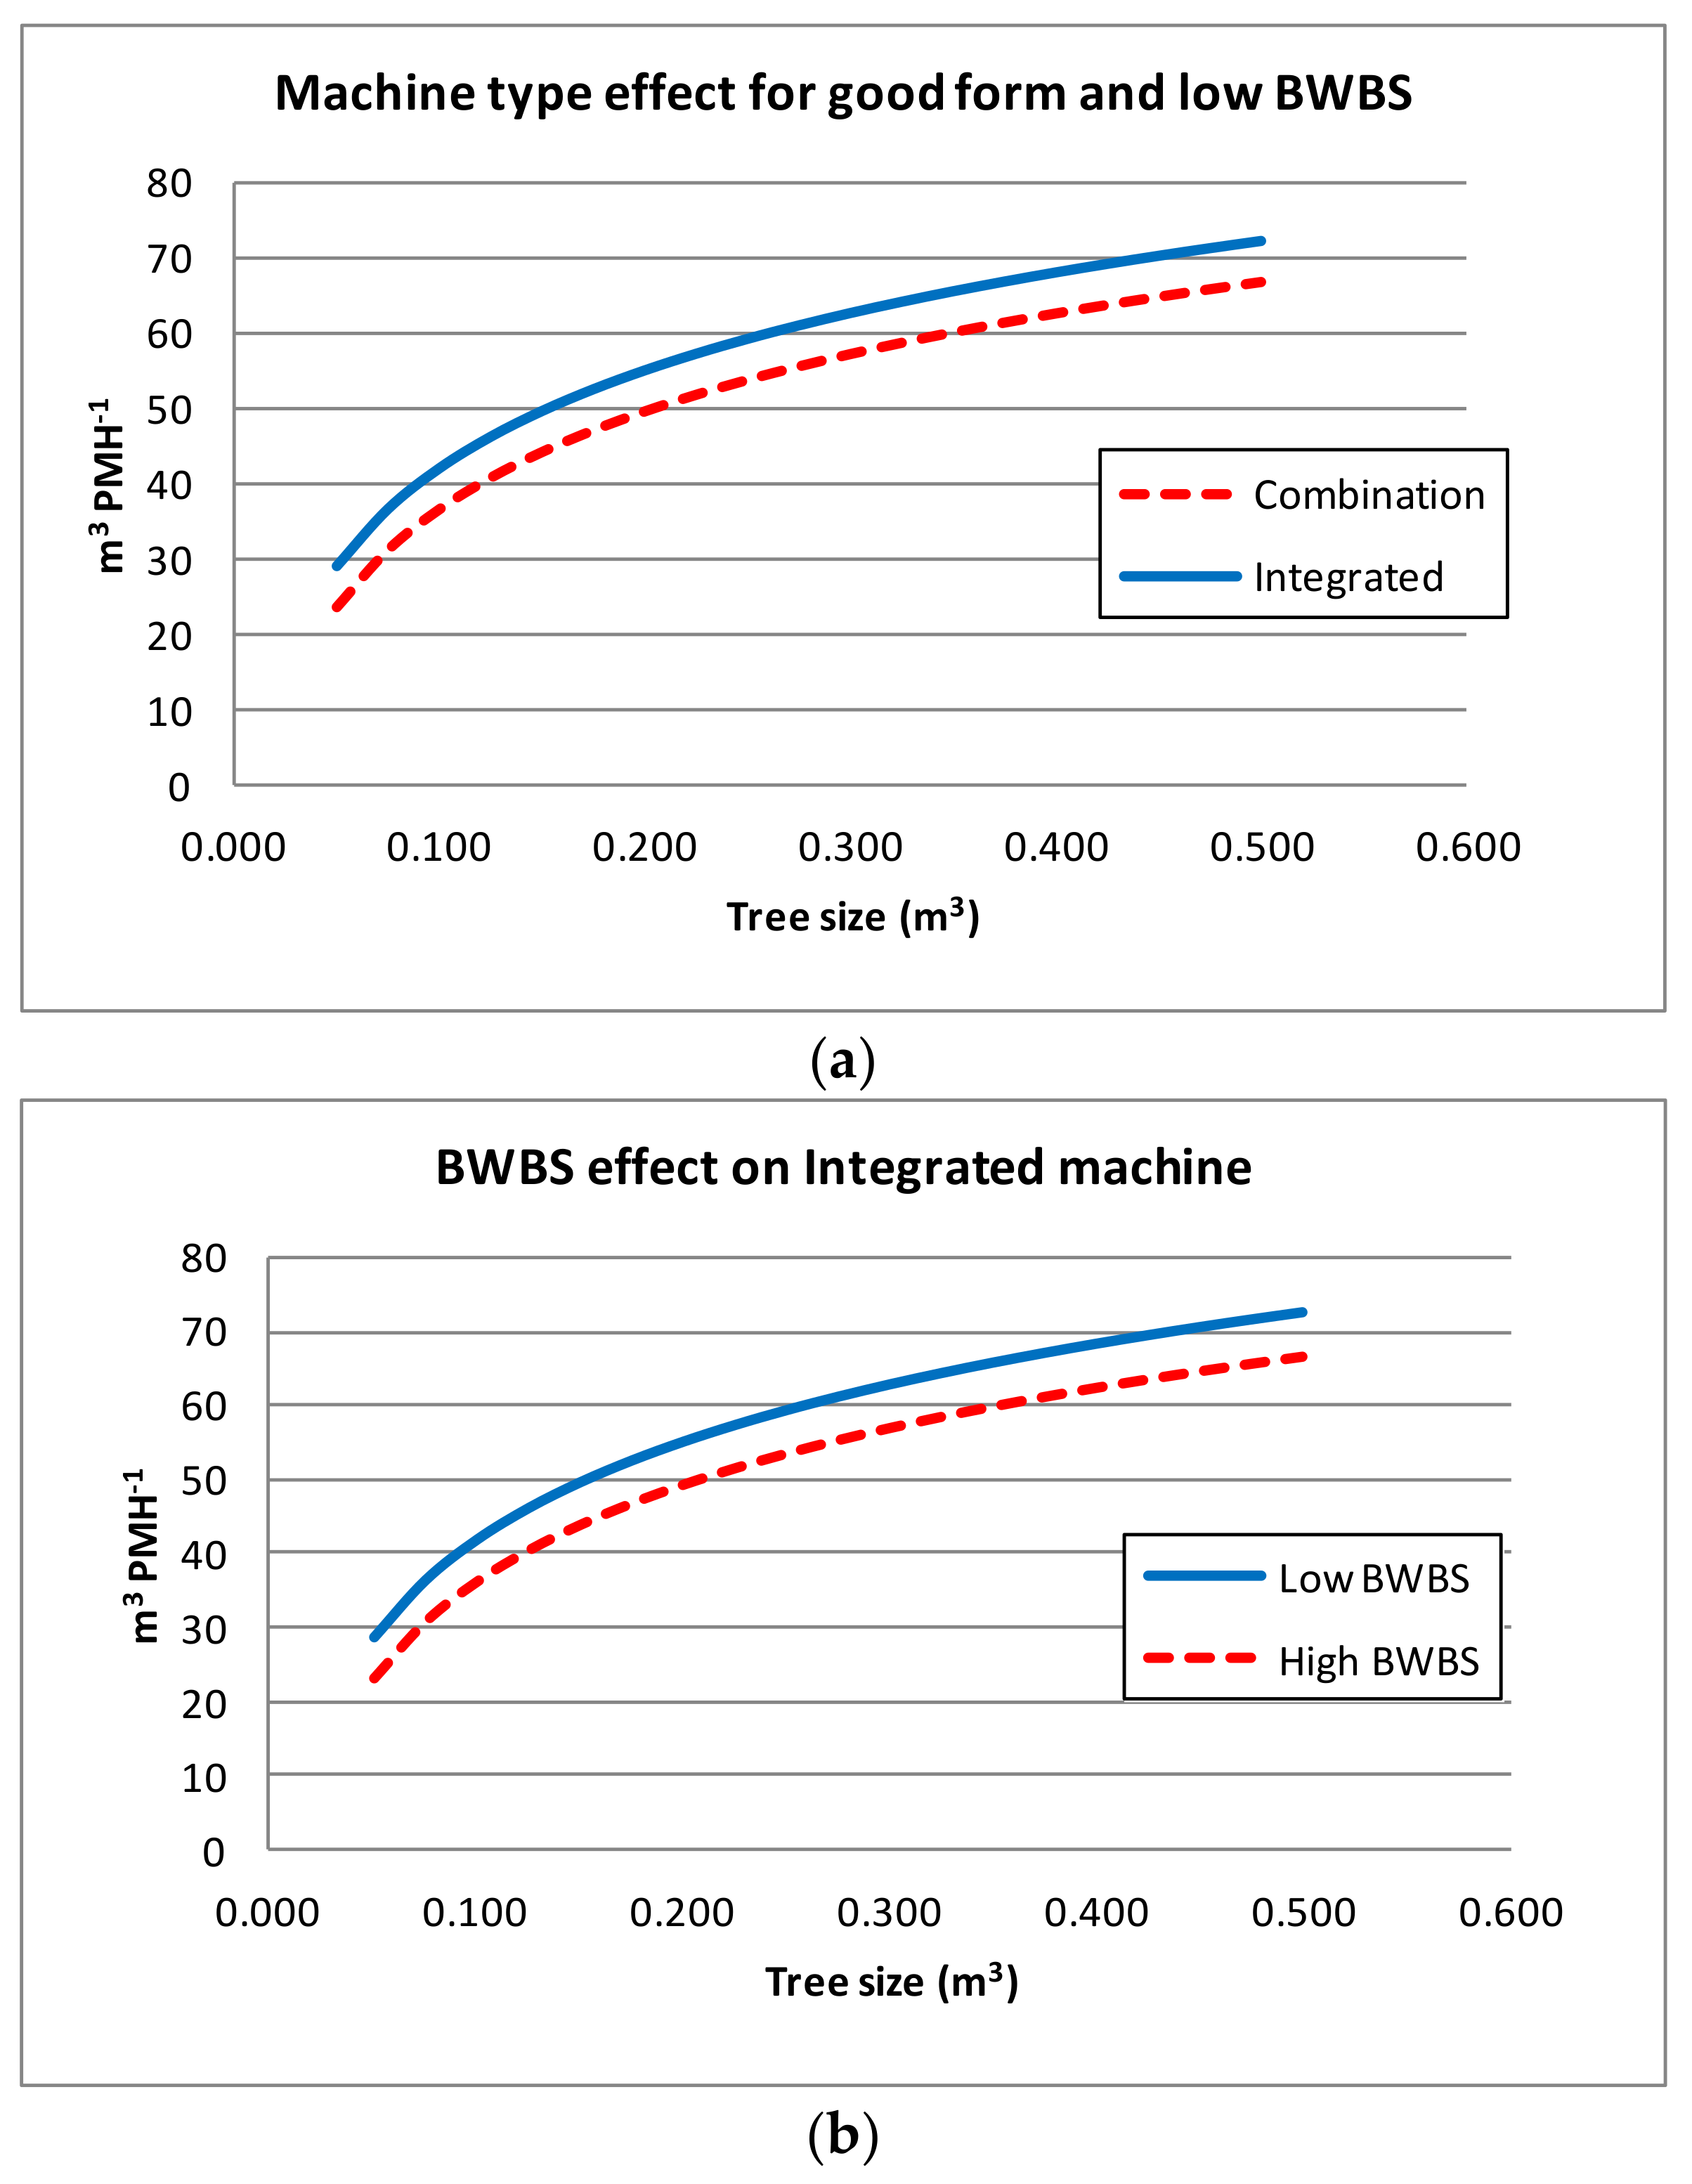
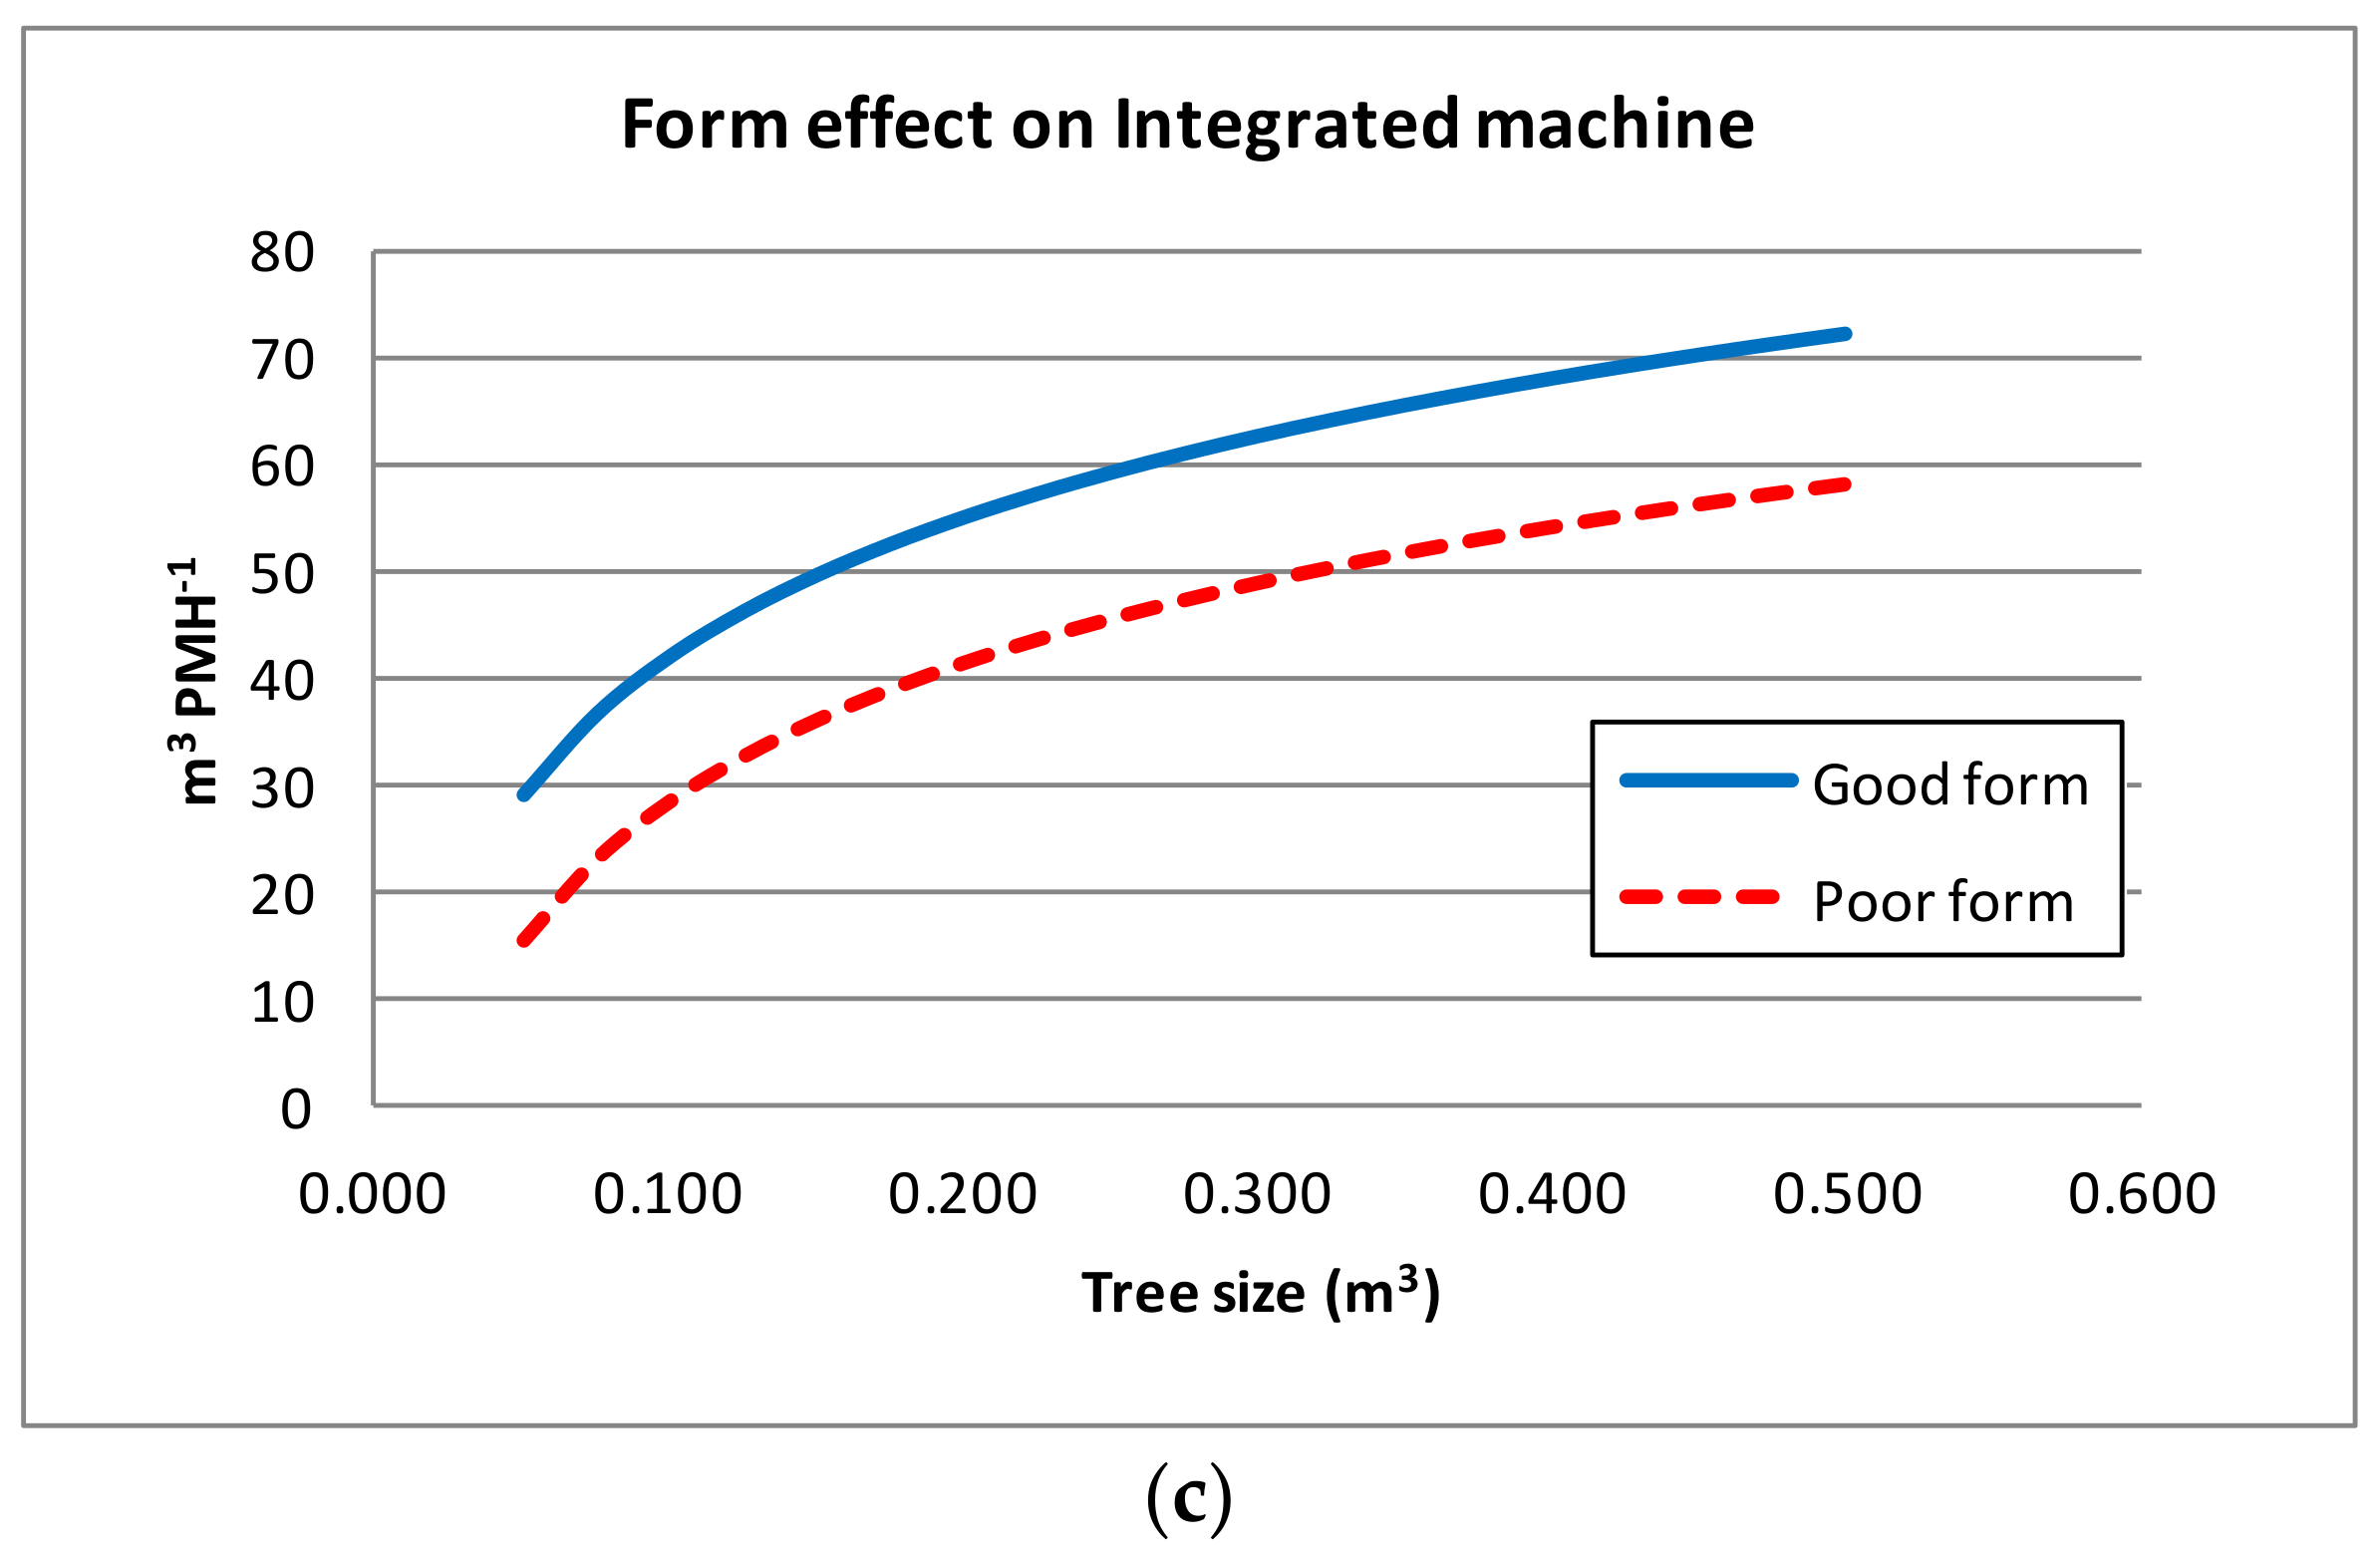
Regression analysis of the original productivity data before resampling confirmed the results of most previous tests and, namely, the dominant effect of tree size, the significant but relatively small effect of machine type, and the large proportion of random variability (
Table 7). At the same time, this analysis generated a prediction model that could be used for estimating productivity as a function of significant independent variables (i.e., tree size, BWBS, tree form, and machine type). The model is a typical logarithm function, which is often used to associate work productivity with work object size (
Figure 3). This model also showed the effect of the other independent variables, confirming the lower productivity (8% to 20%) achieved by combination machines compared with integrated machines. Furthermore, the model indicated that productivity was lower for malformed trees, and more so as they got larger. Productivity also declined with increasing BWBS, as expected.
Delays accounted for 43% of total worksite time, and the largest proportion of delay time was associated with the following causes: waiting for trucks (en route or maneuvering), waiting for wood, service, small repairs, logs and waste getting stuck in the infeed chute or the waste chute. Operator rest accounted for the smallest share of total delay time.
4. Discussion
4.1. Study Limitations
First of all, it is important to state upfront the limitations of the study, mostly derived from the observational character of the experiment and from the relative inaccuracy of some measurement methods. The former was the inevitable consequence of sampling commercial operations, necessary for reflecting realistic work conditions and for expanding the sample. Data imbalance was the main shortcoming of this strategy, which was partly offset by the large number of observations gathered during the study [
30], and was finally mended through resampling.
Concerning poor measurement accuracy, the use of volume classes rather than exact tree volumes introduced some approximation in the production estimates. Further approximation must have derived from using input volume data (i.e., volumes in) rather than output volume data (i.e., volumes out), as a result of processing losses. On the other hand, measuring input volumes was the only solution when conducting a study at the feeding cycle level while blowing chips from multiple feeding cycles into the same container. In any case, truck load data were checked against volume input estimates and the two sets were generally consistent. Ultimately, volume estimate inaccuracy would not invalidate the comparison, since the same method was used for both treatments on test.
4.2. Modeling Productivity
Approximation and poor dataset balance are not enough to justify the low explanatory power of the productivity model, which could only account for 31% of the variability in the dataset. The large amount of unexplained variability is common to many previous CFDD studies, including McEwan et al. [
31] (
R2 = 0.22), Ghaffariyan et al. [
32] (
R2 = 0.19), and Hartsough et al. [
10] (
R2 = 0.31). In fact, Mooney et al. [
19] declared that they attempted to regress CFDD productivity over tree size, but had to give up due to the limited significance of the coefficients returned by the analysis. The low explanatory power of CFDD productivity functions is the inevitable result of multi-tree processing, which does aim at dampening the impact of tree size on productivity. A successful multi-tree processing system is resilient to the effect of tree size: as the tree size gets smaller, more trees are gathered in a load, in order to stabilize load size. As a result, such systems will tend to produce even-sized loads, thus reducing the range of variation that can be explored in a study [
32].
In fact, the explanatory power of the regression obtained from this study could be increased to 47% by introducing the number of trees per load among the independent variables. However, that would entail two main drawbacks: first, the number of trees fed to the machine within the same load is generally associated with tree size, which points to the risk for autocorrelation; second, information about the number of trees per load is difficult to obtain if not in the form of a general average with all the attached approximation, which would deny the benefits of a more powerful model. In contrast, pre-harvest inventories offer reliable information about tree size and tree form, and BWBS can be gleaned from rapid field tests or inferred from the season and/or the delay between felling and debarking. Therefore, introducing the new variable would not offer any practical benefits, while creating the dangerous illusion of a more accurate prediction.
On the other hand, the model produced from this study is as powerful as the best CFDDC models yet produced. While it is specific to eucalypt operations, it is also suitable for cautious generalization, since it was estimated on the basis of multiple operations—not just one case study, like most other similar models.
4.3. Comparison with Previous Studies
The productivity figures returned by this model are consistent with those reported in previous studies of blue gum CFDDC operations. In particular, Ghaffariyan et al. [
33] report a productivity of 58 t PMH
−1 for a combination machine engaged with a mean stem size of 0.200 m
3, while the present model offers an estimate of 50 m
3 PMH
−1 under the same conditions—basically the same result, under the assumption of a fresh wood density equal to 1.1 t m
−3. Similar corroboration is also obtained from the results of the California blue gum study authored by Spinelli et al. [
34]: this study reports figures between 35 and 45 t PMH
−1 for a stem size between 0.09 and 0.130, and these values are exactly between the brackets shown in
Figure 3.
On the other hand, the mean delay incidence reported here is much higher than reported in any of the abovementioned papers: this study estimates delay incidence at 43%, while Ghaffarian et al. [
33] report a mere 8%, and Spinelli et al. [
34] indicate figures between 23 and 25%. In fact, none of these figures can be taken as a reliable estimate of delay incidence, which can only be obtained from long-term follow-up studies [
35]. The duration of all these tests was too short: 45 h here, 4 h for Ghaffarian et al. [
33], and 37 h for Spinelli et al. [
34]. In the best case, one is dealing with 5 working days, which are too few for getting a fair representation of a typically erratic phenomenon, whereby major interruption of the work routine may not occur for several days in a row, and then suddenly recur several times in one unlucky day. One has to conclude that a reliable estimate of the delays normally incurred by CFDDC operations is still missing. This information is crucial to producing accurate machine rates, and it should be obtained, in future, through long-term follow-up studies.
4.4. Integrated Machines vs. Combination Machines
In any case, this experiment achieved its main goals: modeling the net productivity of CFDDC operations and determining if a machine type was more productive than the other. In that regard, the results of all analyses agree on the higher productivity of integrated machine types. Furthermore, the study did not corroborate anecdotal evidence about the better performance of combination machines when negotiating malformed trees [
34]. To that end, several versions of the “machine type * poor form” interaction variable were tested with regression analysis, but none of them proved significant. These findings can be generalized to a good extent because the study included multiple machines for each treatment, and that likely balanced operator effect, although a final confirmation can only be obtained through controlled experiments specifically aimed at gauging operator effect. The better performance of integrated machines can be explained by the fact that these machines are specifically designed for the complete task of delimbing, debarking, and chipping, while combination machines derive from teaming up a chain flail delimber–debarker with a whole-tree chipper, neither of which was specifically designed for working alongside the other. In short: the integrated machine is optimized for the specific task, while the combination machine is not. Some authors point at the capacity to manipulate the distance between flail outfeed and chipper infeed as an asset of combination machines, but integrated machines are likely optimized in that regard too, such that the fixed distance between flail and chipper allows enough space for clearing all the bark while keeping stem travel distance as short as possible, to the benefit of maximized throughput [
34]. Combination machines are less productive, more expensive, and more cumbersome compared with integrated machines: their main asset is higher flexibility, because they can be disjointed and used separately—as when whole-tree chips must be produced, instead of pulp chips. The product quality edge of combination machines still needs to be proven, and this study did not pick up any hints in that direction, as chips from both machine types were equally valued by their final users. In fact, this study did not venture into a detailed analysis of chip quality, which should be addressed in the future.
5. Conclusions
So far, this study is the only one that gathered data from multiple CFDDCs and aimed to determine the productivity difference between integrated and combination machines. The database assembled from this study is quite large, and evenly spread between the two treatments on trial, which offers reasonable assurance about the quality of scientific inference. Results point at the very high productivity of CFDDC systems, regardless of equipment configuration. That said, the study demonstrates that integrated machines are more productive than combination machines. On the other hand, combination machines can be easier to relocate because they are moved as two smaller separate elements. Furthermore, combination machines allow using the two elements independently of each other, which may represent an advantage for those who produce both whole-tree chips and bark-free chips. Integrated machines remain the best option if the main job is that of turning small- and medium-sized trees into clean chips. In any case, eucalypt trees should be processed as soon as possible after felling because BWBS increases after cut, and the productivity of CFDDC machines is sensitive to variations in BWBS. Operational efficiency is also improved by maximizing utilization, which calls for further studies about the actual incidence of delay time, the reasons for delays, and the strategies to reduce their frequency and duration.


