Article

Physiological and Transcriptome Analysis of a Yellow-Green Leaf Mutant in Birch (Betula platyphylla × B. Pendula)

State Key Laboratory of Tree Genetics and Breeding, Northeast Forestry University, 26 Hexing Road, Harbin 150040, China
*
Author to whom correspondence should be addressed.
Forests 2019, 10(2), 120; https://doi.org/10.3390/f10020120
Submission received: 19 December 2018 / Revised: 30 January 2019 / Accepted: 1 February 2019 / Published: 2 February 2019

Abstract

:
Chlorophyll (Chl)-deficient mutants are ideal materials for the study of Chl biosynthesis, chloroplast development, and photosynthesis. Although the genes encoding key enzymes related to Chl biosynthesis have been well-characterized in herbaceous plants, rice (Oryza sativa L.), Arabidopsis (Arabidopsis thaliana), and maize (Zea mays L.), yellow-green leaf mutants have not yet been fully studied in tree species. In this work, we explored the molecular mechanism of the leaf color formation in a yellow-green leaf mutant (yl). We investigated the differentially expressed genes (DEGs) between yl and control plants (wild type birch (WT) and BpCCR1 overexpression line 11, (C11)) by transcriptome sequencing. Approximately 1163 genes (874 down-regulated and 289 up-regulated) and 930 genes (755 down-regulated and 175 up-regulated) were found to be differentially expressed in yl compared with WT and C11, respectively. Kyoto Encyclopedia of Genes and Genomes (KEGG) pathway enrichment analysis for DEGs revealed that photosynthesis antenna proteins represent the most significant enriched pathway. The expressions of photosynthesis antenna proteins are crucial to the leaf color formation in yl. We also found that Chl accumulate, leaf anatomical structure, photosynthesis, and growth were affected in yl. Taken together, our results not only provide the difference of phenomenal, physiological, and gene expression characteristics in leaves between yl mutant and control plants, but also provide a new insight into the mutation underlying the chlorotic leaf phenotype in birch.

1. Introduction

Birch (Betula), a member of the tall deciduous tree family of Betulaceae, contains approximately 20 taxa birch species. Birch is an ecologically important tree species native to parts of China, Siberia, Korea, Japan, and Russia that has been introduced to many northern areas of the world [1]. This species grows fast and has a high tolerance that allows it to be used for revegetation and reforestation [2]. Birch also plays an important role in the forestry industry as a source of timber, fuelwood, plywood, pulpwood, and furniture [3,4,5,6]. Recently, there has been an increased interest in plants with colored leaves. Betula pendula ‘Purple Rain’, an intraspecific variety of B. pendula, has been used as a decorative plant for its purple leaves [7]. Previously, a yellow-green leaf mutant (yl) was derived from cinnamoyl-CoA reductase (BpCCR1)-overexpressing transgenic birch plants. The yl mutant displayed a distinct yellow-green phenotype, while the leaves of all the other BpCCR1-overexpressing lines were a normal color, the same as the wild type birch (WT). One of the BpCCR1-overexpressing lines, C11 with green leaves, was used as control birch [8]. The yl mutant is a very valuable resource because a yellow-green leaf is one of the most popular traits in landscape greening.
Leaf color variation is one of the most common mutated traits as it is easily discovered in higher plants. Up to now, many Chl-deficient mutants have been identified in herbaceous and woody plants, including Arabidopsis [9], rice [10], maize [11], wheat (Triticum aestivum L.) [12], cotton (Gossypium barbadense L.) [13], and tea (Camellia sinensis (L.) O. Kuntze) [14]. It has been reported that a yellow-green leaf mutant (siygl1) of foxtail millet (Setaria italic L.) isolated following ethyl methanesulfonate (EMS) treatment was due to the loss function of the SiYGL1 gene. The identification of the SiYGL1 gene that encodes Mg-chelatase ATPase subunit D facilitated the understanding of the biological processes of chlorophyll (Chl) biosynthesis in millet [15]. Another yellow-green leaf mutant (ygl8) was proved to be controlled by the Ygl8 gene, which encodes a chloroplast-targeted uridine monophosphate (UMP) kinase and affects chloroplast development in rice [16]. Therefore, Chl-deficient mutants are valuable genetic materials for exploring the molecular mechanisms of Chl biosynthesis and regulation, chloroplast development, plastid-to-nucleus signal transduction, and photosynthesis.
Next-generation sequencing (NGS) technologies have been considered as powerful tools for advanced research in many areas. Examples are genome and transcriptome sequencing of animals, plants, and microbes with high-throughput, high-speed, and high-accuracy sequencing data [17,18,19]. Wang, using transcriptome sequencing, analyzed a Chl-deficient chlorina tea plant culticar and reported the molecular mechanisms of the chlorine tea phenotype [14]. Study of a Lagerstroemia indica yellow leaf mutant using transcriptome analysis revealed the formation pathway of a yellow leaf mutant and discovered novel candidate genes related to leaf color [20]. The development of NGS technologies has increased the rate and efficiency of gene discovery and permitted a deeper understanding of the gene expression network.
In this work, we performed transcriptome sequencing for yl with a yellow-green leaf phenotype, BpCCR1 overexpression line 11(C11), and wild type birch (WT) with a normal green leaf phenotype to analyze gene expression in these plants and elucidate the molecular mechanisms related to the different phenotypes. In addition, comparative physiological studies were conducted to investigate the phenotypic differences between yl and control (WT and C11) plants. This study improved our understanding of the yellow-green phenotype in birch.

2. Materials and Methods

2.1. Materials

A birch (Betula platyphylla × B. pendula) Chl-deficient mutant yl, BpCCR1 overexpression line 11 (C11), and wild type birch (WT) were used as the experimental materials. The yl mutant was derived from BpCCR1 overexpression lines. All the plants were grown in the pots with dimensions of 8 × 8 cm and substrata of 9 cm under natural conditions and were well watered at the birch breeding base, Harbin, China. Mature leaves from the new stems were collected in the spring. Immediately after harvest, samples were frozen in liquid nitrogen and stored at −80 °C for RNA extraction.

2.2. Methods

2.2.1. Measurement of Growth Traits and Pigment Content

Forty plants of each line (WT, C11, and yl) were used for the measurement of plant height. Each value was the average of the measurements.
Fresh leaves of WT, C11, and yl plants (from first to sixth leaf) were collected during the growing season and used for the measurement of pigment contents, according to the method of Lichtenthaler [21]. The first leaf was the youngest and the sixth leaf was the oldest on the main stem. Chl and carotenoid (Car) were extracted with 80% acetone at 4 °C for 24 h in the dark, and then calculated from the absorbance at 470 nm, 646 nm, and 663 nm in a Vis-UV spectrophotometer (TU-1901, Persee, China). Contents of Chl a (mg/g), Chl b (mg/g), and Car (mg/g) were calculated as follows:
CChl a (mg/L) = 12.21 A663 − 2.81 A646
CChl b (mg/L) = 20.13 A646 − 5.03 A663
CCar (mg/L) = 4.37 A470 + 2.11 A663 − 9.10 A646
Chl a (mg/g) = CChl a (mg/L) × V (L) / Mfresh (g)
Chl b (mg/g) = CChl b (mg/L) × V (L) / Mfresh (g)
Car (mg/g) = Ccar (mg/L) × V (L) / Mfresh (g)
Chl a/b ratio = Chl a / Chl b

2.2.2. Light Microscopy

The fourth leaves of WT, C11, and yl were used as samples and fixed in FAA (formaldehyde, glacial acetic acid and 50% ethyl alcohol, V:V:V = 1:1:18) for 24 h, dehydrated in a graded ethanol series and xylene, and then embedded in paraffin wax. Sections (10 μm thick) were stained with safranine and fast green dyes. The cell structures of the samples were examined and photographed using an Olympus DP26 digital camera (Olympus, Tokyo, Japan). Five leaf anatomical features, including lamina thickness (LT), adaxial epidermis thickness (UE), abaxial epidermis thickness (LE), palisade parenchyma thickness (PT), and spongy parenchyma thickness (ST), were examined with the cellSens Entry software. Additionally, the palisade parenchyma/mesophyll ratio was calculated. Four positions of each section were measured and each value of leaf anatomical feature was the average of 20 measurements from five individual plants.

2.2.3. Leaf Gas-Exchange Measurement

The net photosynthetic rate (Pn) of the fourth leaves from WT, C11, and yl was measured using an Li-6400 portable photosynthesis system (LI-COR Inc, Lincoln, NE, USA) at 9:00–11:00 am on sunny days. CO2 concentration was controlled at 400 μmol mol−1. Relative air humidity was about 50% and leaf temperature was about 28 °C. The default red/blue LED light source (LI6400-02B) was chosen as the light source. The photosynthetic curves were made against the light intensity of 2000, 1800, 1500, 1200, 1000, 800, 600, 400, 200, 100, 50, 20, and 0 μmol photos m−2 s−1. About 15 min light adaptation was applied to leaves at an initial light step before CO2 measurement and then the values were recorded when they were stable at each light step. The measurements of WT, C11, and yl were made under the same conditions (including time interval of illumination). The averaged values of each light step for each plant were used in the light-response curve.

2.2.4. RNA Extraction, Library Construction, and RNA-seq

The fourth leaves of WT, C11, and yl were used as samples. Total RNAs were extracted from leaf samples using the CTAB (cetyltrimethylammonium bromide) method [22]. A summary of the procedure was as follows: The samples were individually milled in a mortar with liquid nitrogen and then incubated with 2% CTAB (added 2% β-mercaptoethanol) at 65 °C in a water-bath for 5 min. The samples were centrifuged at 13,400 g for 10 min and an equal volume of chloroform was added to the supernatant. A half volume of ethyl alcohol and 0.8 times volume of 5 mol/L LiCl were then added to the supernatant after centrifuging at 13,400 g, 4 °C for 10 min. After standing for 10 min, the samples were centrifuged at 13,400 g, 4 °C for 20 min. Then, the precipitates were washed in 70% ethanol and dried. RNAs were dissolved with diethylpyrocarbonate (DEPC)-treated water and treated with DNaseI. RNA quality, purity, and integrity were detected by 1% agrose gel electrophoresis, a NanoDrop2000 microvolume spectrophotometer (Thermo, Waltham, MA, USA) and an Agilent 2100 Bioanalyzer (Agilent, Palo Alto, CA, USA), respectively. RNAs from three independent replicates were mixed by equal volume. Poly (A) mRNA was enriched using Oligo (dT)-magnetic beads and cleaved into short fragments with fragmentation buffer. These short fragments were used as templates to synthesize the first-strand cDNA. Second-strand cDNA was synthesized using buffer, dNTPs, RNaseH, and DNA polymerase I. Purified cDNA was used as a template for PCR amplification and library construction. Lastly, the library was sequenced on an Illumina HiSeq™ 2500 platform by Biomarker Technology Company (Beijing, China). CTAB, β-mercaptoethanol, chloroform, ethyl alcohol, LiCl, and DEPC were bought from Sigma-Aldrich, St. Louis, MO, USA. DNaseI, dNTPs, RNaseH, and DNA polymerase I were bought from Promega, Madison, WI, USA.

2.2.5. Gene Annotation and DEG Analysis

To elucidate the reason for the different phenotype observed in yl, we explored the gene expression of WT, C11, and yl at the molecular level. After removing adapters and low-quality sequences, we generated an average of approximately 3.46 Gb RNA-seq data with 91.28% Q30 bases and 46.28% GC content for each sample in the transcriptome sequencing. More than 82.21% of the clean reads were mapped to the birch reference genome [23] using TopHat2 [24]. Gene functions were annotated using the Nr, Swiss-Prot, Kyoto Encyclopedia of Genes and Genomes (KEGG), Eukaryotic Orthologous Groups (KOG), Clusters of Orthologous Groups (COG) and Gene Ontology (GO) databases. The expression level of each gene was calculated using FPKM (Fragments per kilobase per million mapped reads). Differentially expressed genes (DEGs) between each two-sample comparison were defined with fold change ≥2 and FDR (false discovery rate) <0.01 as a threshold, according to the statistical analysis performed by EBSeq. The percentages of DEGs in Go classification were calculated as follows:
Percentages of genes = (Number DEGs in a specific term) / (Number all DEGs) × 100%
KEGG pathway terms with corrected enrichment p values less than 0.05 (Fisher’s exact test) were considered to be significantly enriched. The genes involved in photosynthesis-antenna proteins were extracted according to the functional annotation information of the genes.

2.2.6. RNA Extraction and Quantitative RT-PCR

Total RNAs were extracted from the functional leaves of the WT, C11, and yl lines as described in 2.1.4 and treated with DNaseI (Promega, Madison, WI, USA). cDNA was synthesized from 1 µg RNA of WT, C11, and yl using a ReverTreAce® qPCR RT Kit (Toyobo, Osaka, Japan), according to the manufacturers’ instructions, respectively. The procedure was as follows: RNA was incubated with 5x RT Master Mix at 37 °C for 15 min, 50 °C for 5 min, and 98 °C for 5 min, and then diluted 10-fold with nuclease-free water. The quantitative (q)RT-PCR was performed on a 7500 real-time PCR system (Applied Biosystems, Darmstadt, Germany) using SYBR® Green PCR master mix (Toyobo, Osaka, Japan). Each qRT-PCR reaction (total 20 μL) contained 2 μL of cDNA, 10 μL of 2× SYBR Green Real-time PCR Master mix, 0.5 μL of each PCR primer, and 7 μL of nuclease-free water. qRT-PCR conditions were as follows: 95 °C for 30 s followed by 45 cycles of 95 °C for 15 s, 60 °C for 45 s, and a final extension at 72 °C for 30 s. The results were calculated using the 2−ΔΔCt method [25], and Bp18S rRNA was selected as an internal control gene [26]. Primer sequences are listed in Table 1.

2.2.7. Statistical Analysis

Data were analyzed using SPSS statistics software, version 19.0 (International Business Machines, Armonk, NY, USA). Differences between the means of each line on leaf anatomical and plant height were determined using one-way analysis of variance and the Duncan multiple comparison procedure. A p value less than 0.05 was considered statistically significant and labeled with a different letter. The same letter represented that they were not significantly different. The correlations between pigment contents and Pn, stomatal conductance (Gs) and Pn, Gs and transpiration rate (Tr), and Tr and Pn were evaluated using Pearson’s correlation coefficients. The relationship between Tr and Pn was tested for linear, exponential, and logarithmic functions and the best fit regressions were selected. Correlation coefficients (R2) and equations were obtained from nonlinear regression analysis of Tr and Pn using Origin Pro software, version 8.1 (OriginLab, Northampton, MA, USA).

3. Results

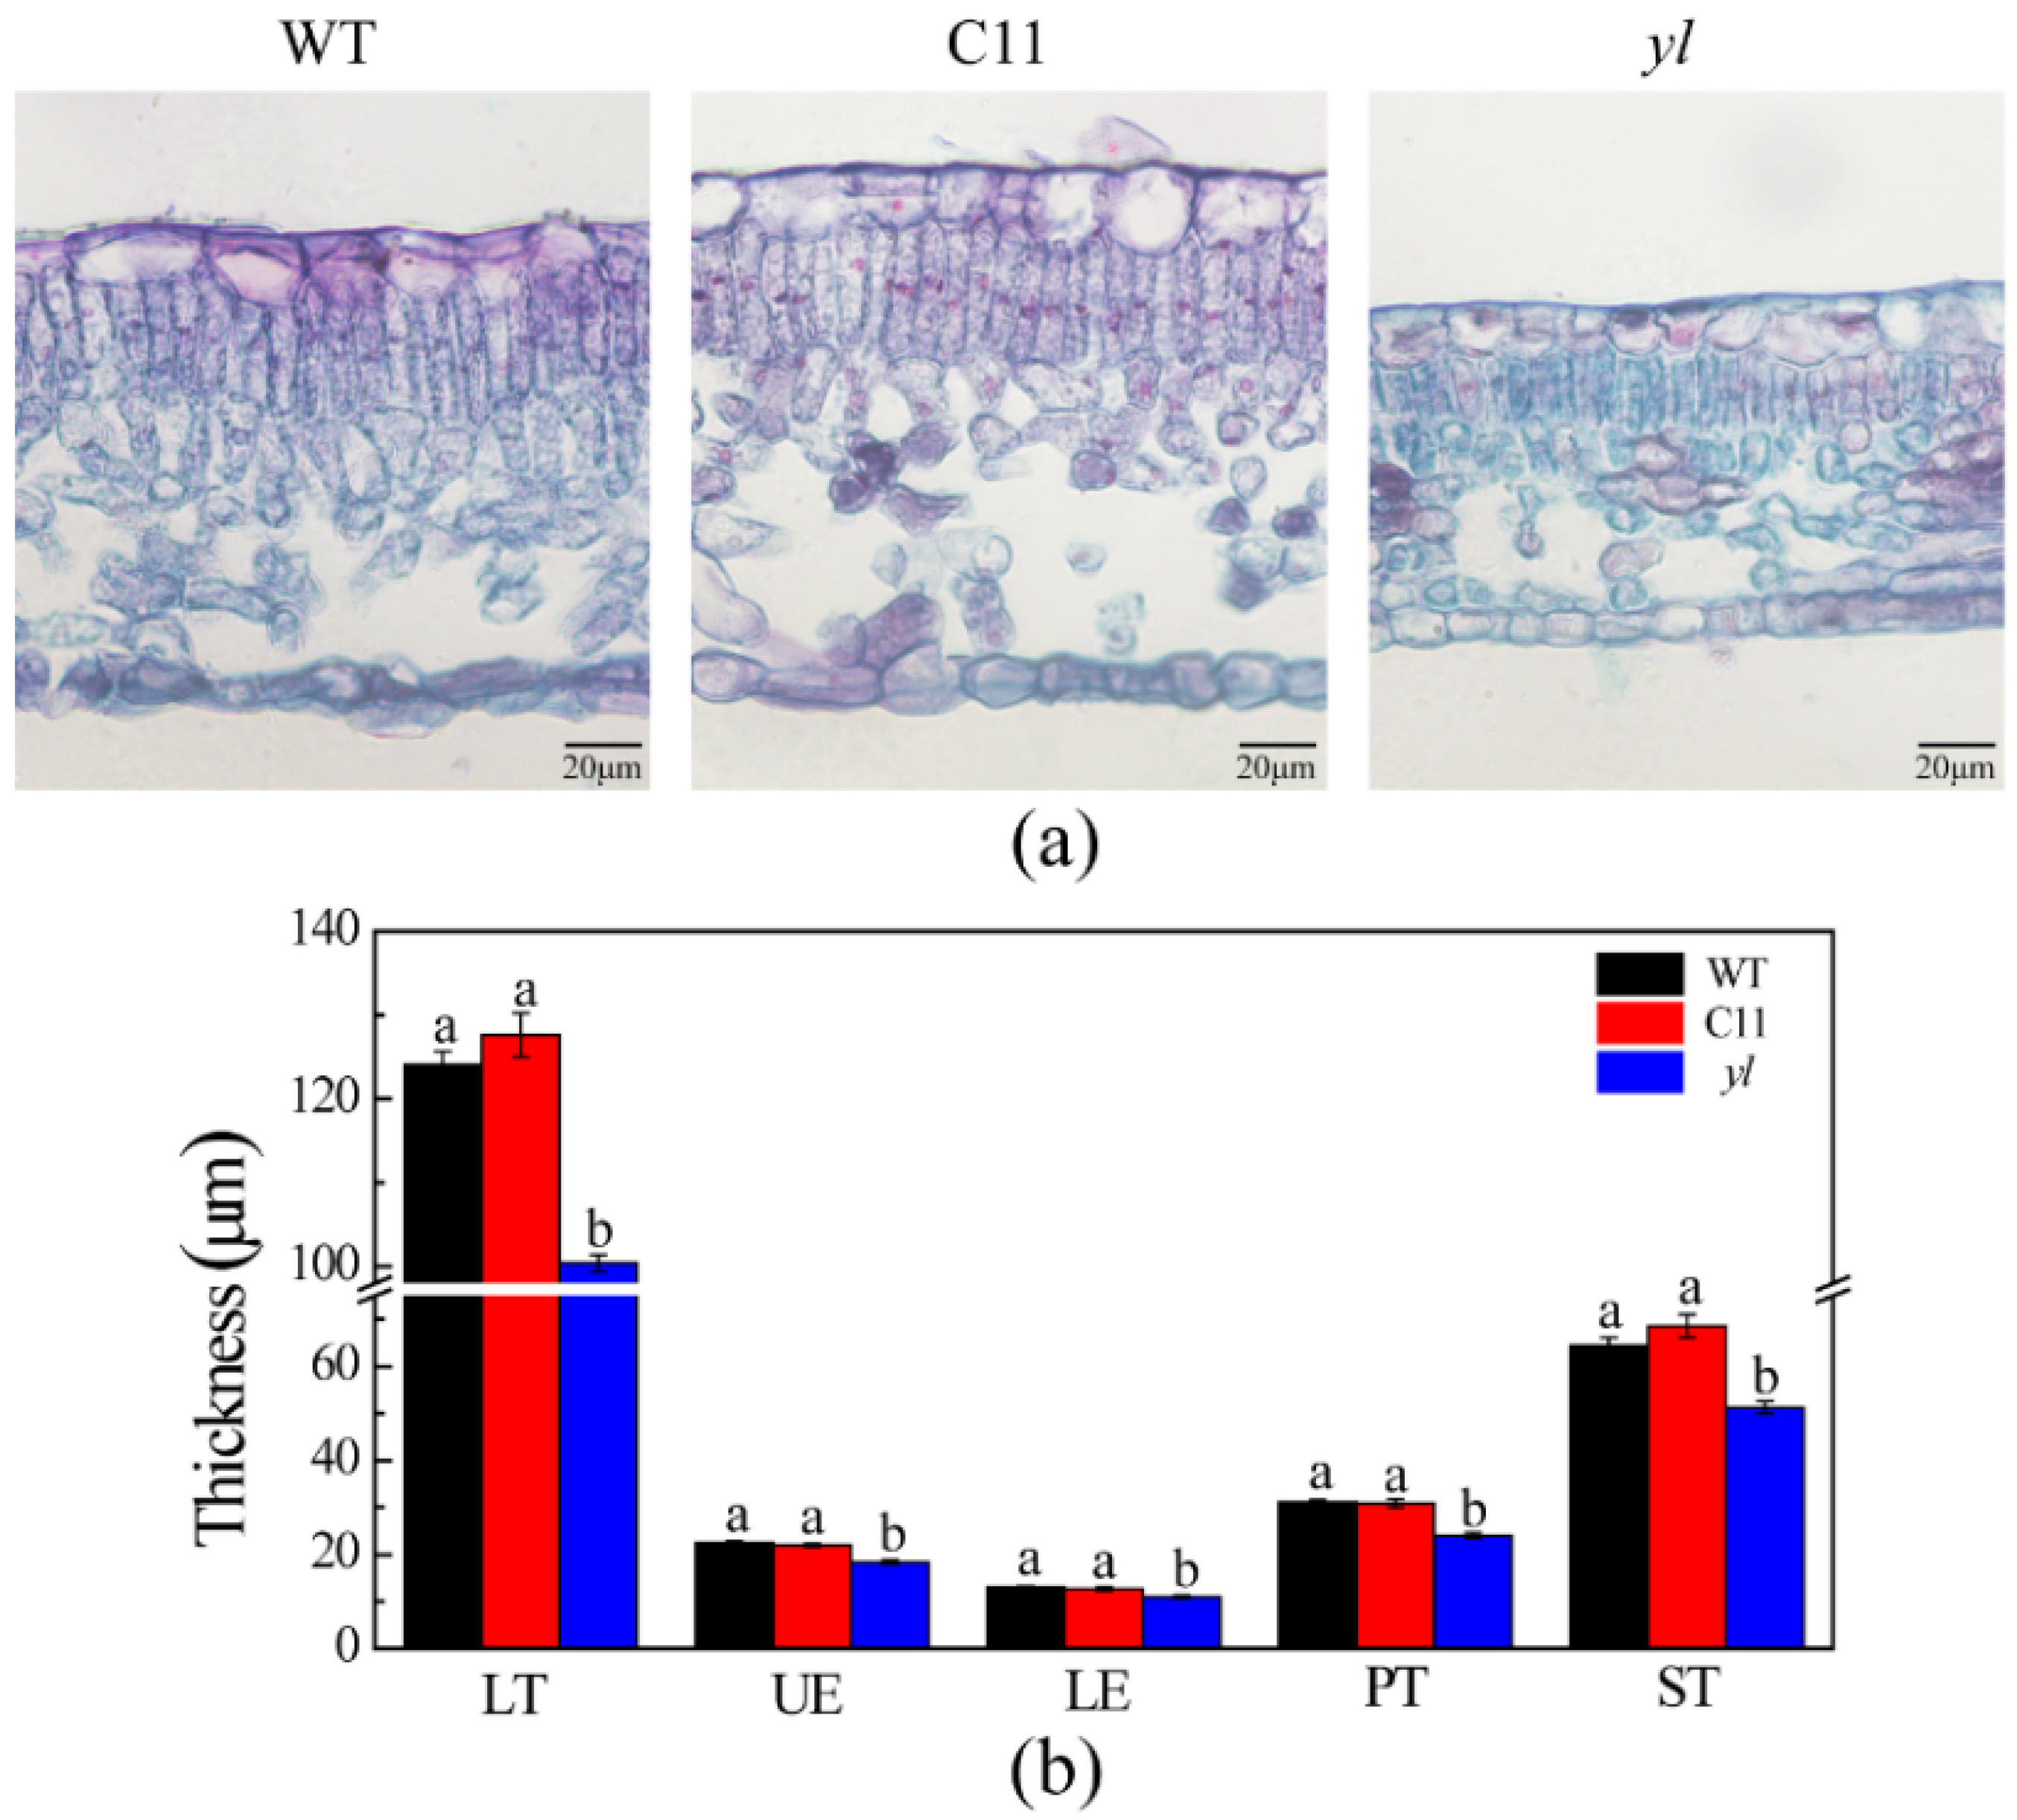
3.1. Pigment Contents and Leaf Anatomical Structure of Chl-Deficient Mutant yl

Previously, we transformed the BpCCR1 gene to a hybrid birch, WT (Betula platyphylla × B. Pendula) by Agrobacterium tumefaciens. We obtained 19 BpCCR1-overexpressing transgenic lines. Among them, a transgenic line (yl) displayed a yellow-green leaf phenotype, which was distinct from other transgenic lines, including C11. During the growth season, the yl mutant exhibited yellow-green leaves, while C11 and WT exhibited green leaves (Figure 1a,b). In order to investigate the difference, we measured the pigment contents and leaf anatomical structure of yl. We measured the Chl and Car contents from the first leaf to the sixth leaf. The result showed that the pigment contents, including Chl a, Chl b, and Car, were increased from the first leaf to sixth leaf in all samples (Figure 1c). However, all pigment levels were lower in the leaves of yl than those of WT and C11. Chl a in yl was decreased by 44–65% of WT, and 41–57% of C11. Chl b in yl was decreased by 62–79% of WT, and 61–73% of C11. Similarly, Car in yl was decreased by 40–55% compared with WT, and 30–54% compared with C11. The ratio of Chl a to Chl b was increased in all leaves of yl.
We then investigated the leaf anatomical structure of WT, C11, and yl, as leaves are important organs for photosynthesis, and their anatomical structures could affect photosynthetic and physiological activities. A significant reduction in the lamina thickness of yl leaves compared with the leaves of WT and C11 was observed in transverse sections of the leaf blades (Figure 2a). Also, adaxial epidermis, abaxial epidermis, palisade parenchyma, and spongy parenchyma were reduced in thickness in yl leaves (Figure 2b). However, there was no difference in the ratio of palisade to spongy parenchyma.

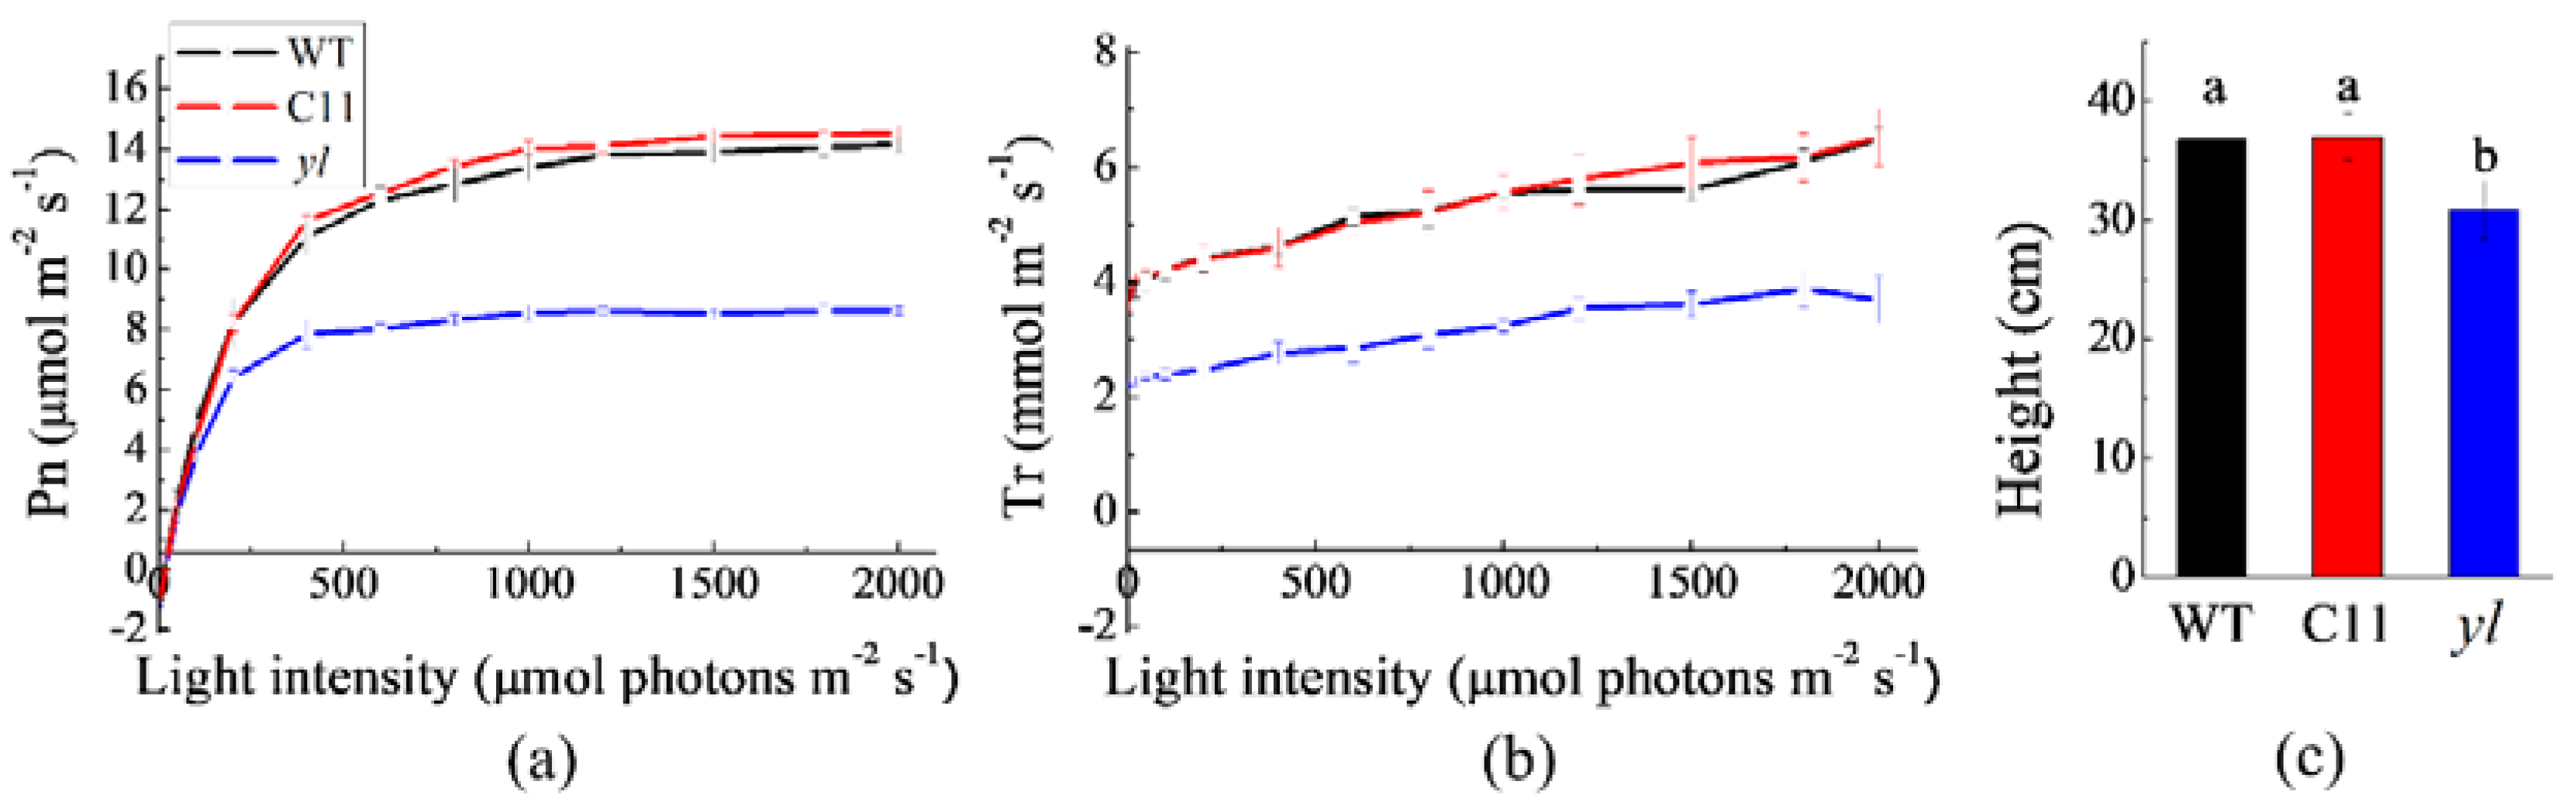
3.2. Changes in Photosynthesis and Growth

To examine the effect of low pigment contents on photosynthesis in the yl mutant, we measured the photosynthetic rate of WT, C11, and yl. The result showed that yl had a lower net photosynthetic rate and a lower transpiration rate than WT and C11 at all light intensities determined (Figure 3a,b).
We then investigated the correlations between pigment contents, transpiration rate, stomatal conductance, and Pn. The results showed that the Pn values had a strong relationship with total Chl, Chl a, Chl b, and Car under high light intensity (p < 0.05). The correlations between pigment contents and Pn were decreased under low light intensity, revealing that not all pigments participated in photosynthesis under low light intensity (Table S1). In addition, we found that Pn and Tr values displayed a significant positive correlation (p < 0.01) with Gs in WT, C11, and yl plants. Similarly, there was also a highly significant correlation (p < 0.01) between Pn and Tr in WT, C11, and yl plants (Table 2). Then, we analyzed the scatter plots between Pn and Tr and found that the exponential decay function was the best fit. The curve could be divided into two stages. In the first stage, the Pn value increased with the rising Tr and the curve was likely to be linear. Gs may be the primary limiting factor in this stage. In the second stage, Pn increased slowly or mantained invariability along with the increase of Tr. Gs may not be the primary limiting factor in this stage (Figure 4a–c).
To explore the effect of low photosynthesis on growth, we measured the height of WT, C11, and yl plants. The heights of one-year-old WT and C11 were 36.7 cm and 37.0 cm, while the yl mutant was 30.9 cm, about 84% and 83% of WT and C11, respectively. The result revealed that yl grew slower compared to WT and C11 (Figure 3c).

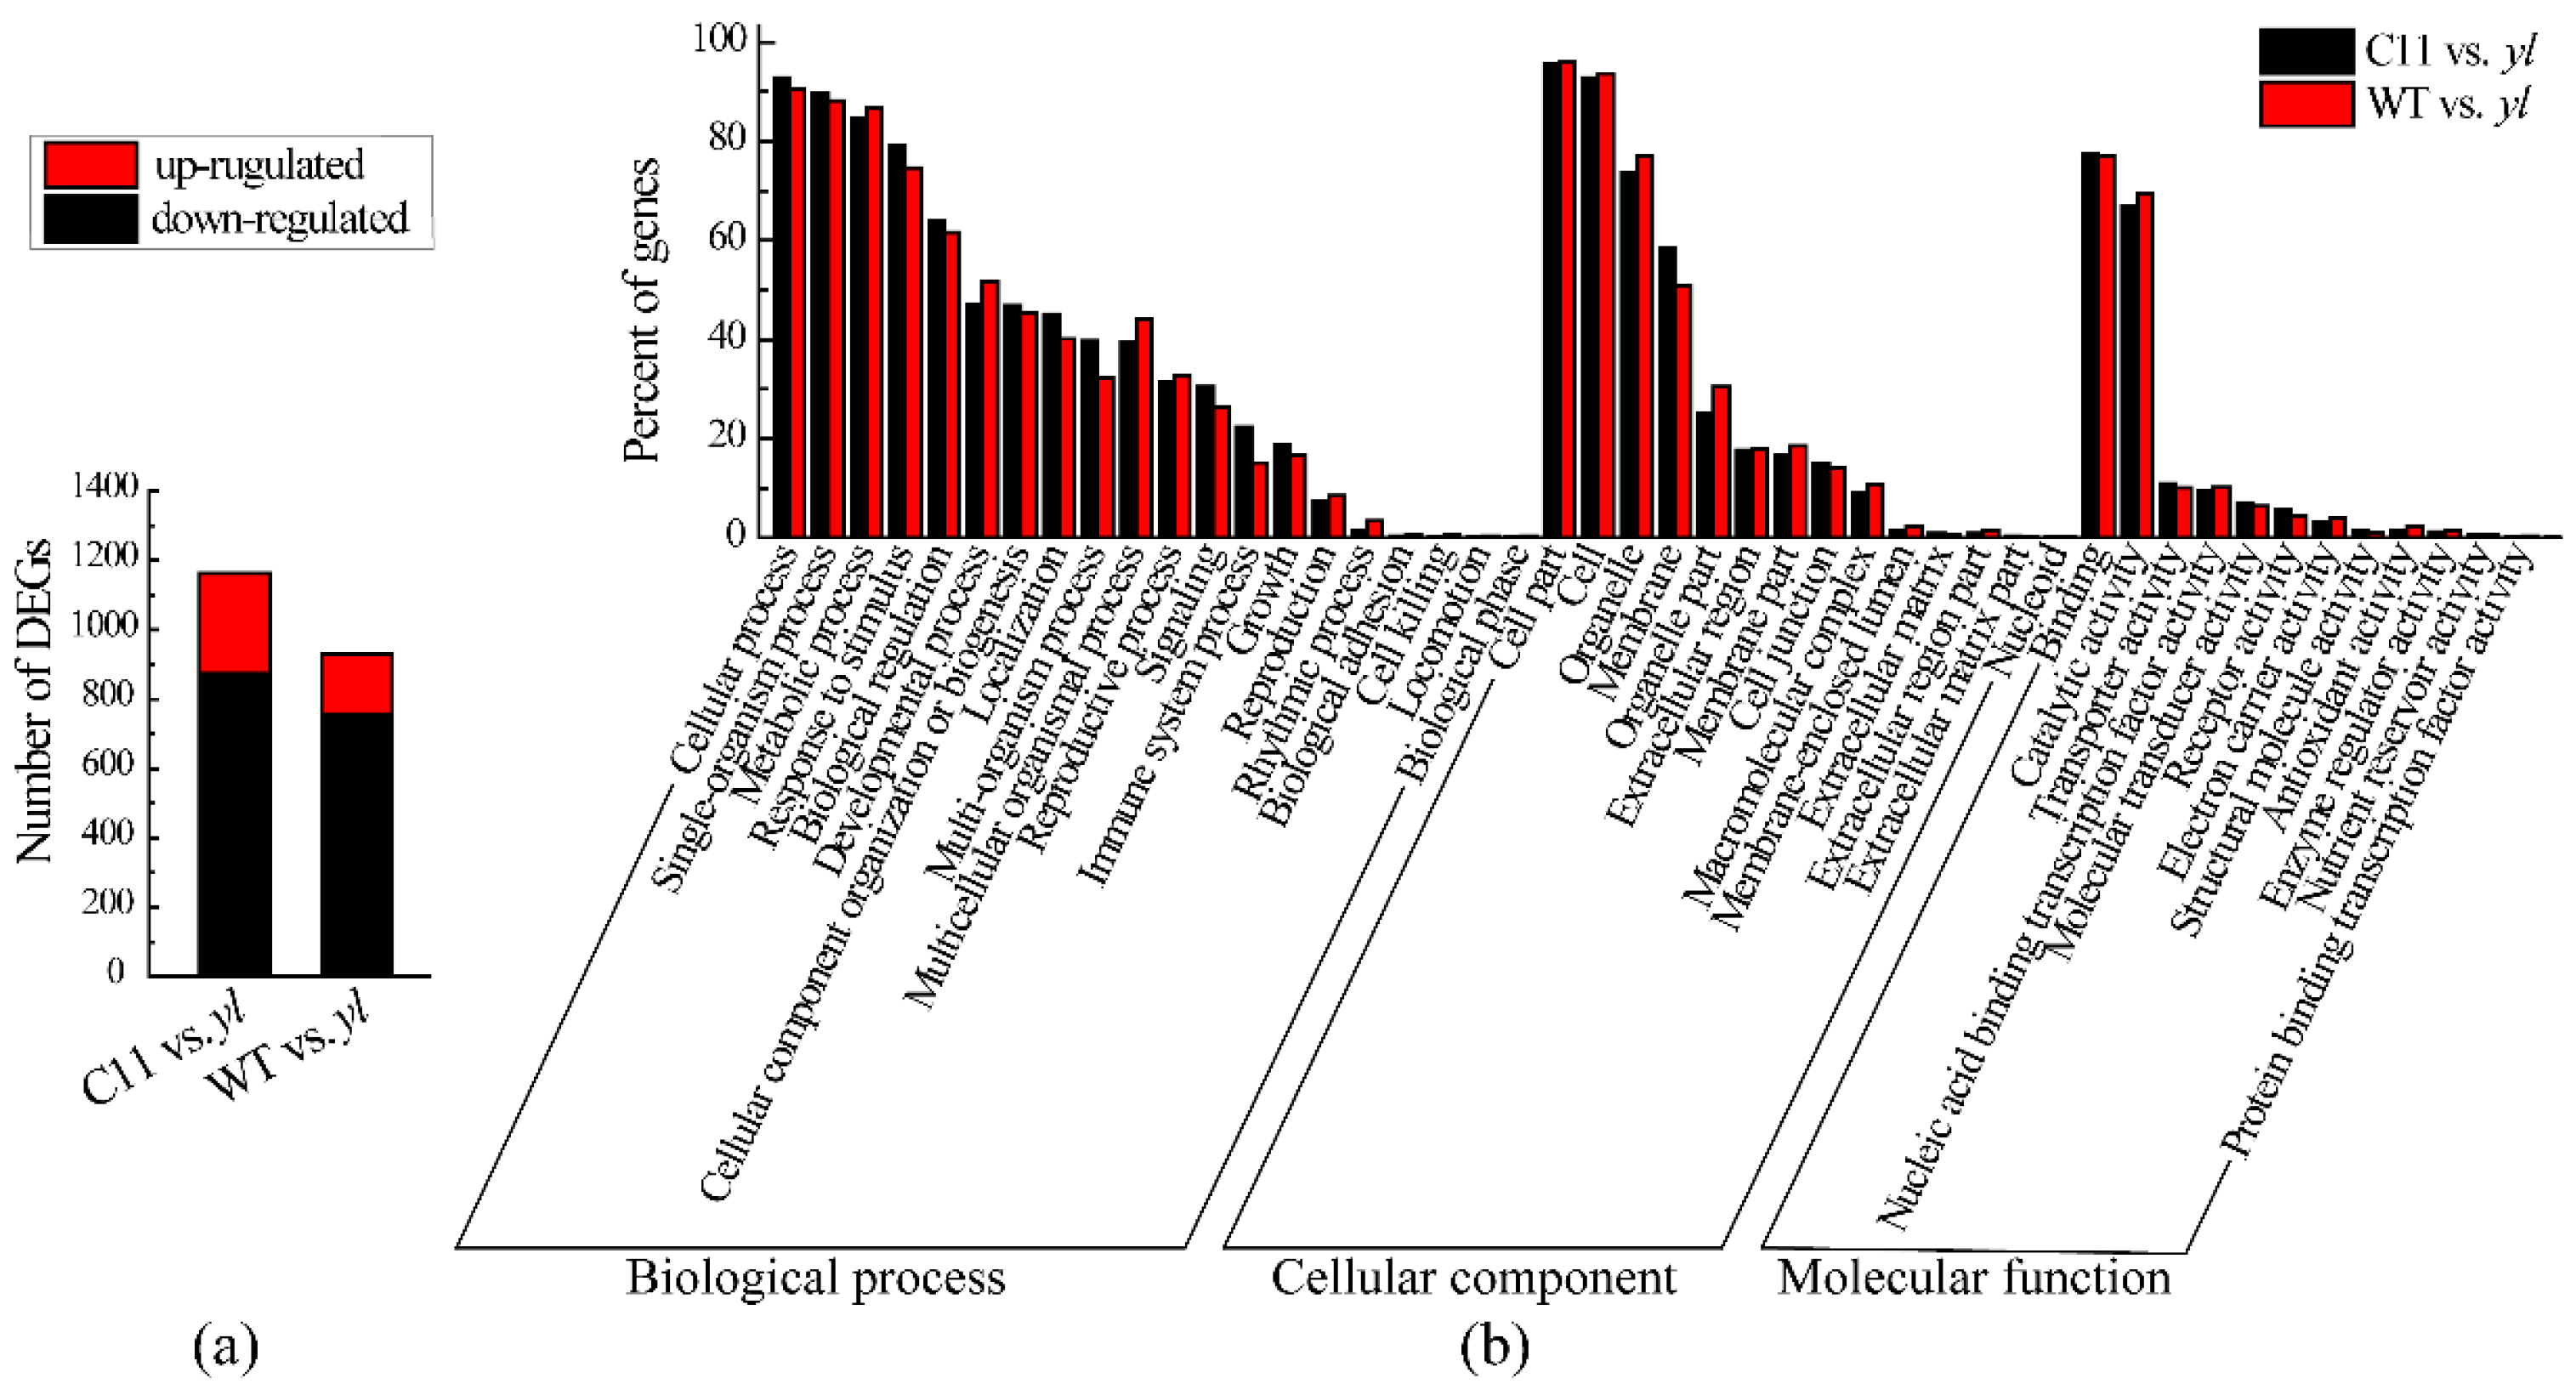
3.3. Differently Expressed Genes between yl and Control Plants

In order to generate DEGs, two transcriptome comparisons were carried-out, including C11 vs. yl and WT vs. yl. As a result, 1163 genes (874 down-regulated and 289 up-regulated) were found to be differentially expressed in yl compared with C11. 930 genes, including 755 down-regulated and 175 up-regulated that were differentially expressed in yl compared with WT (Figure 5a).
GO categories were then assigned to evaluate the potential functions of these DEGs according to the biological process, cellular component, and molecular function ontology. In the biological process, the DEGs were classified into twenty categories, and the most three overrepresented terms were cellular process, single-organism process, and metabolic process. For cell components, there are many DEGs involved in cells, cell parts, and organelles. For molecular functions, most of the DEGs were participates in binding and catalytic activity, as shown in Figure 5b.

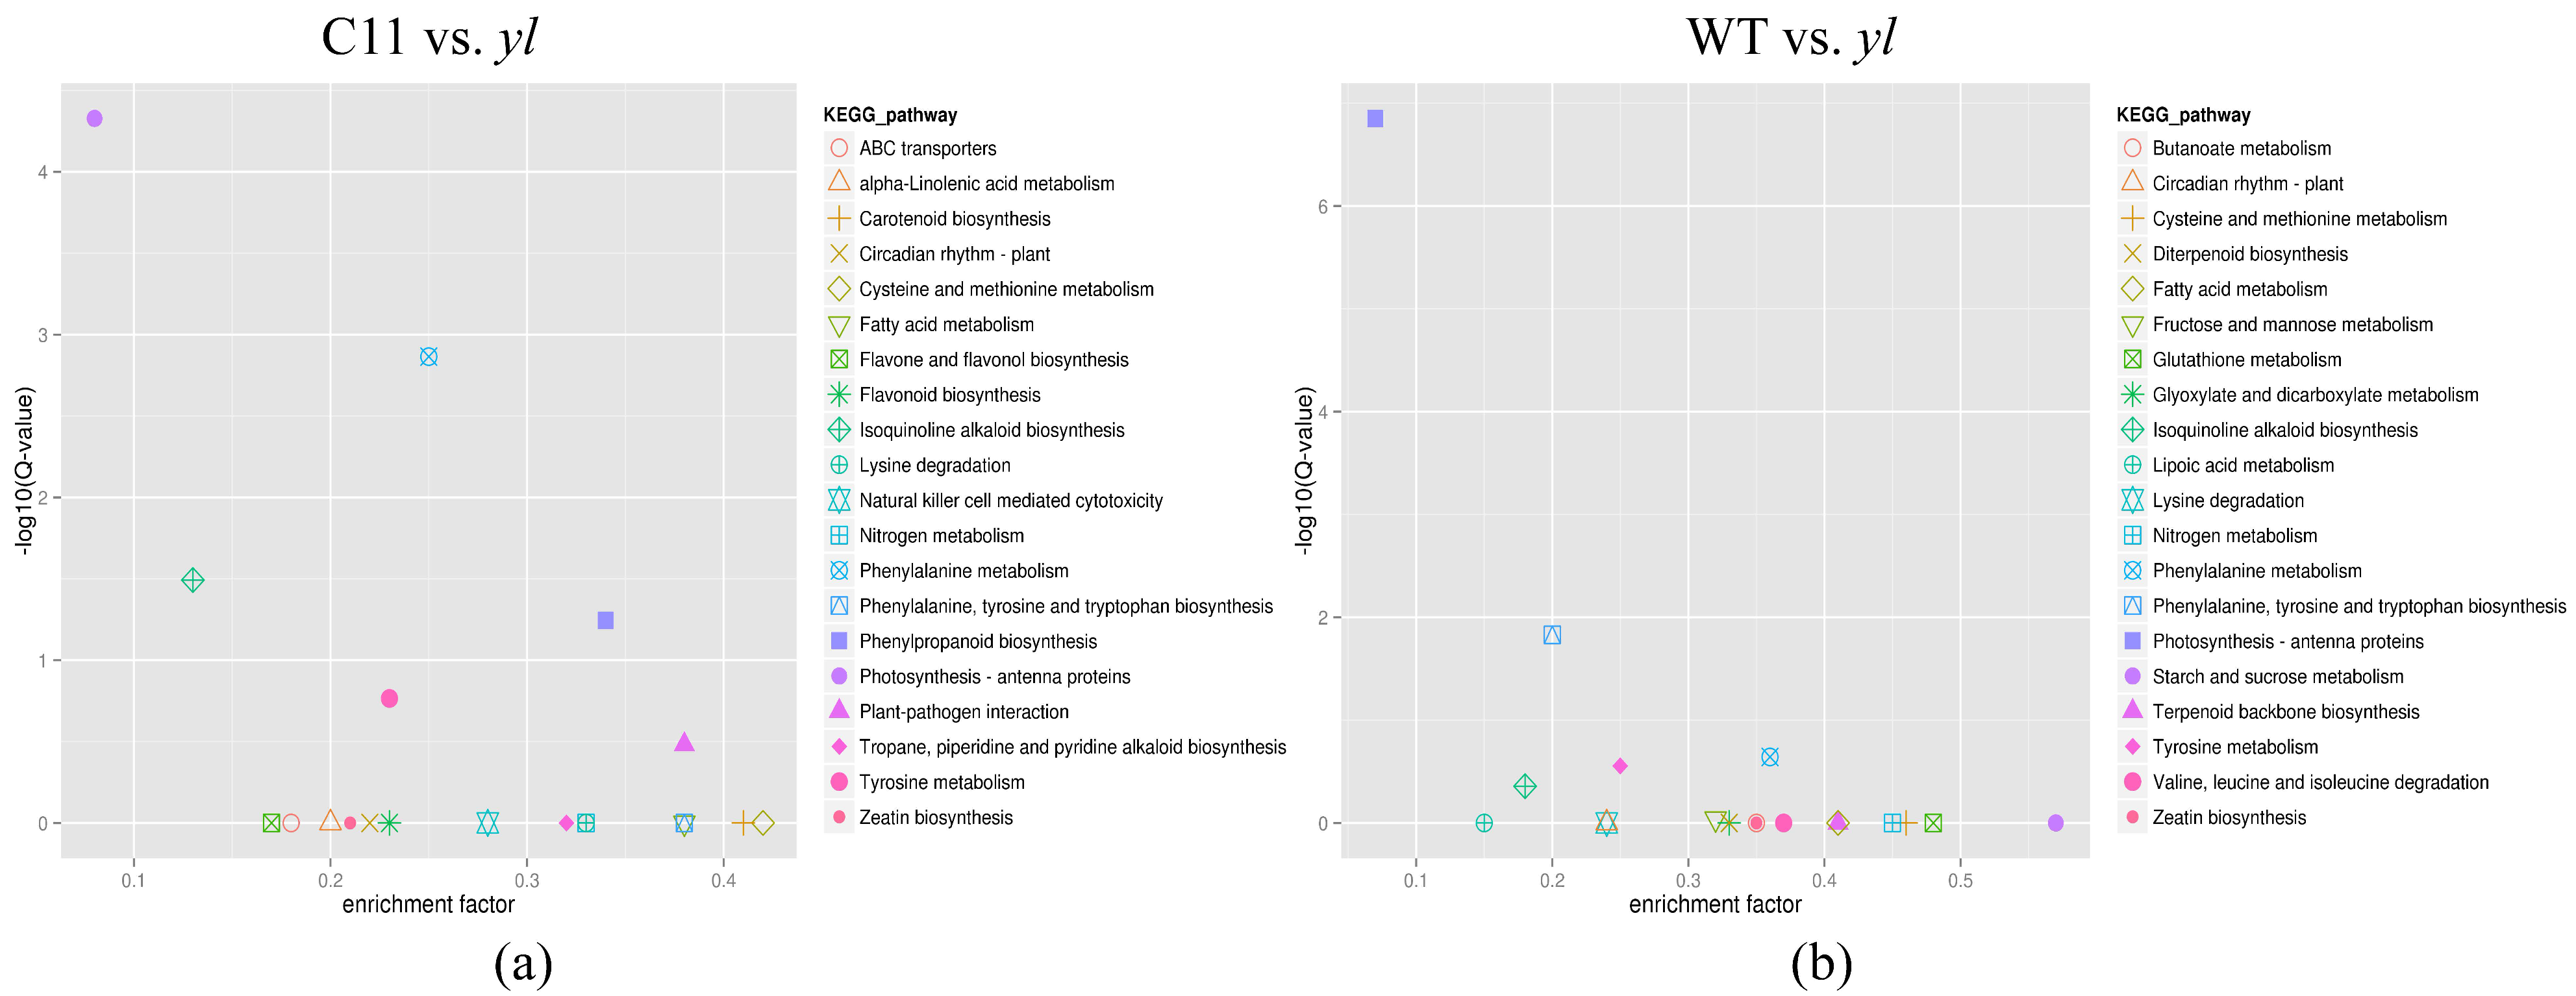
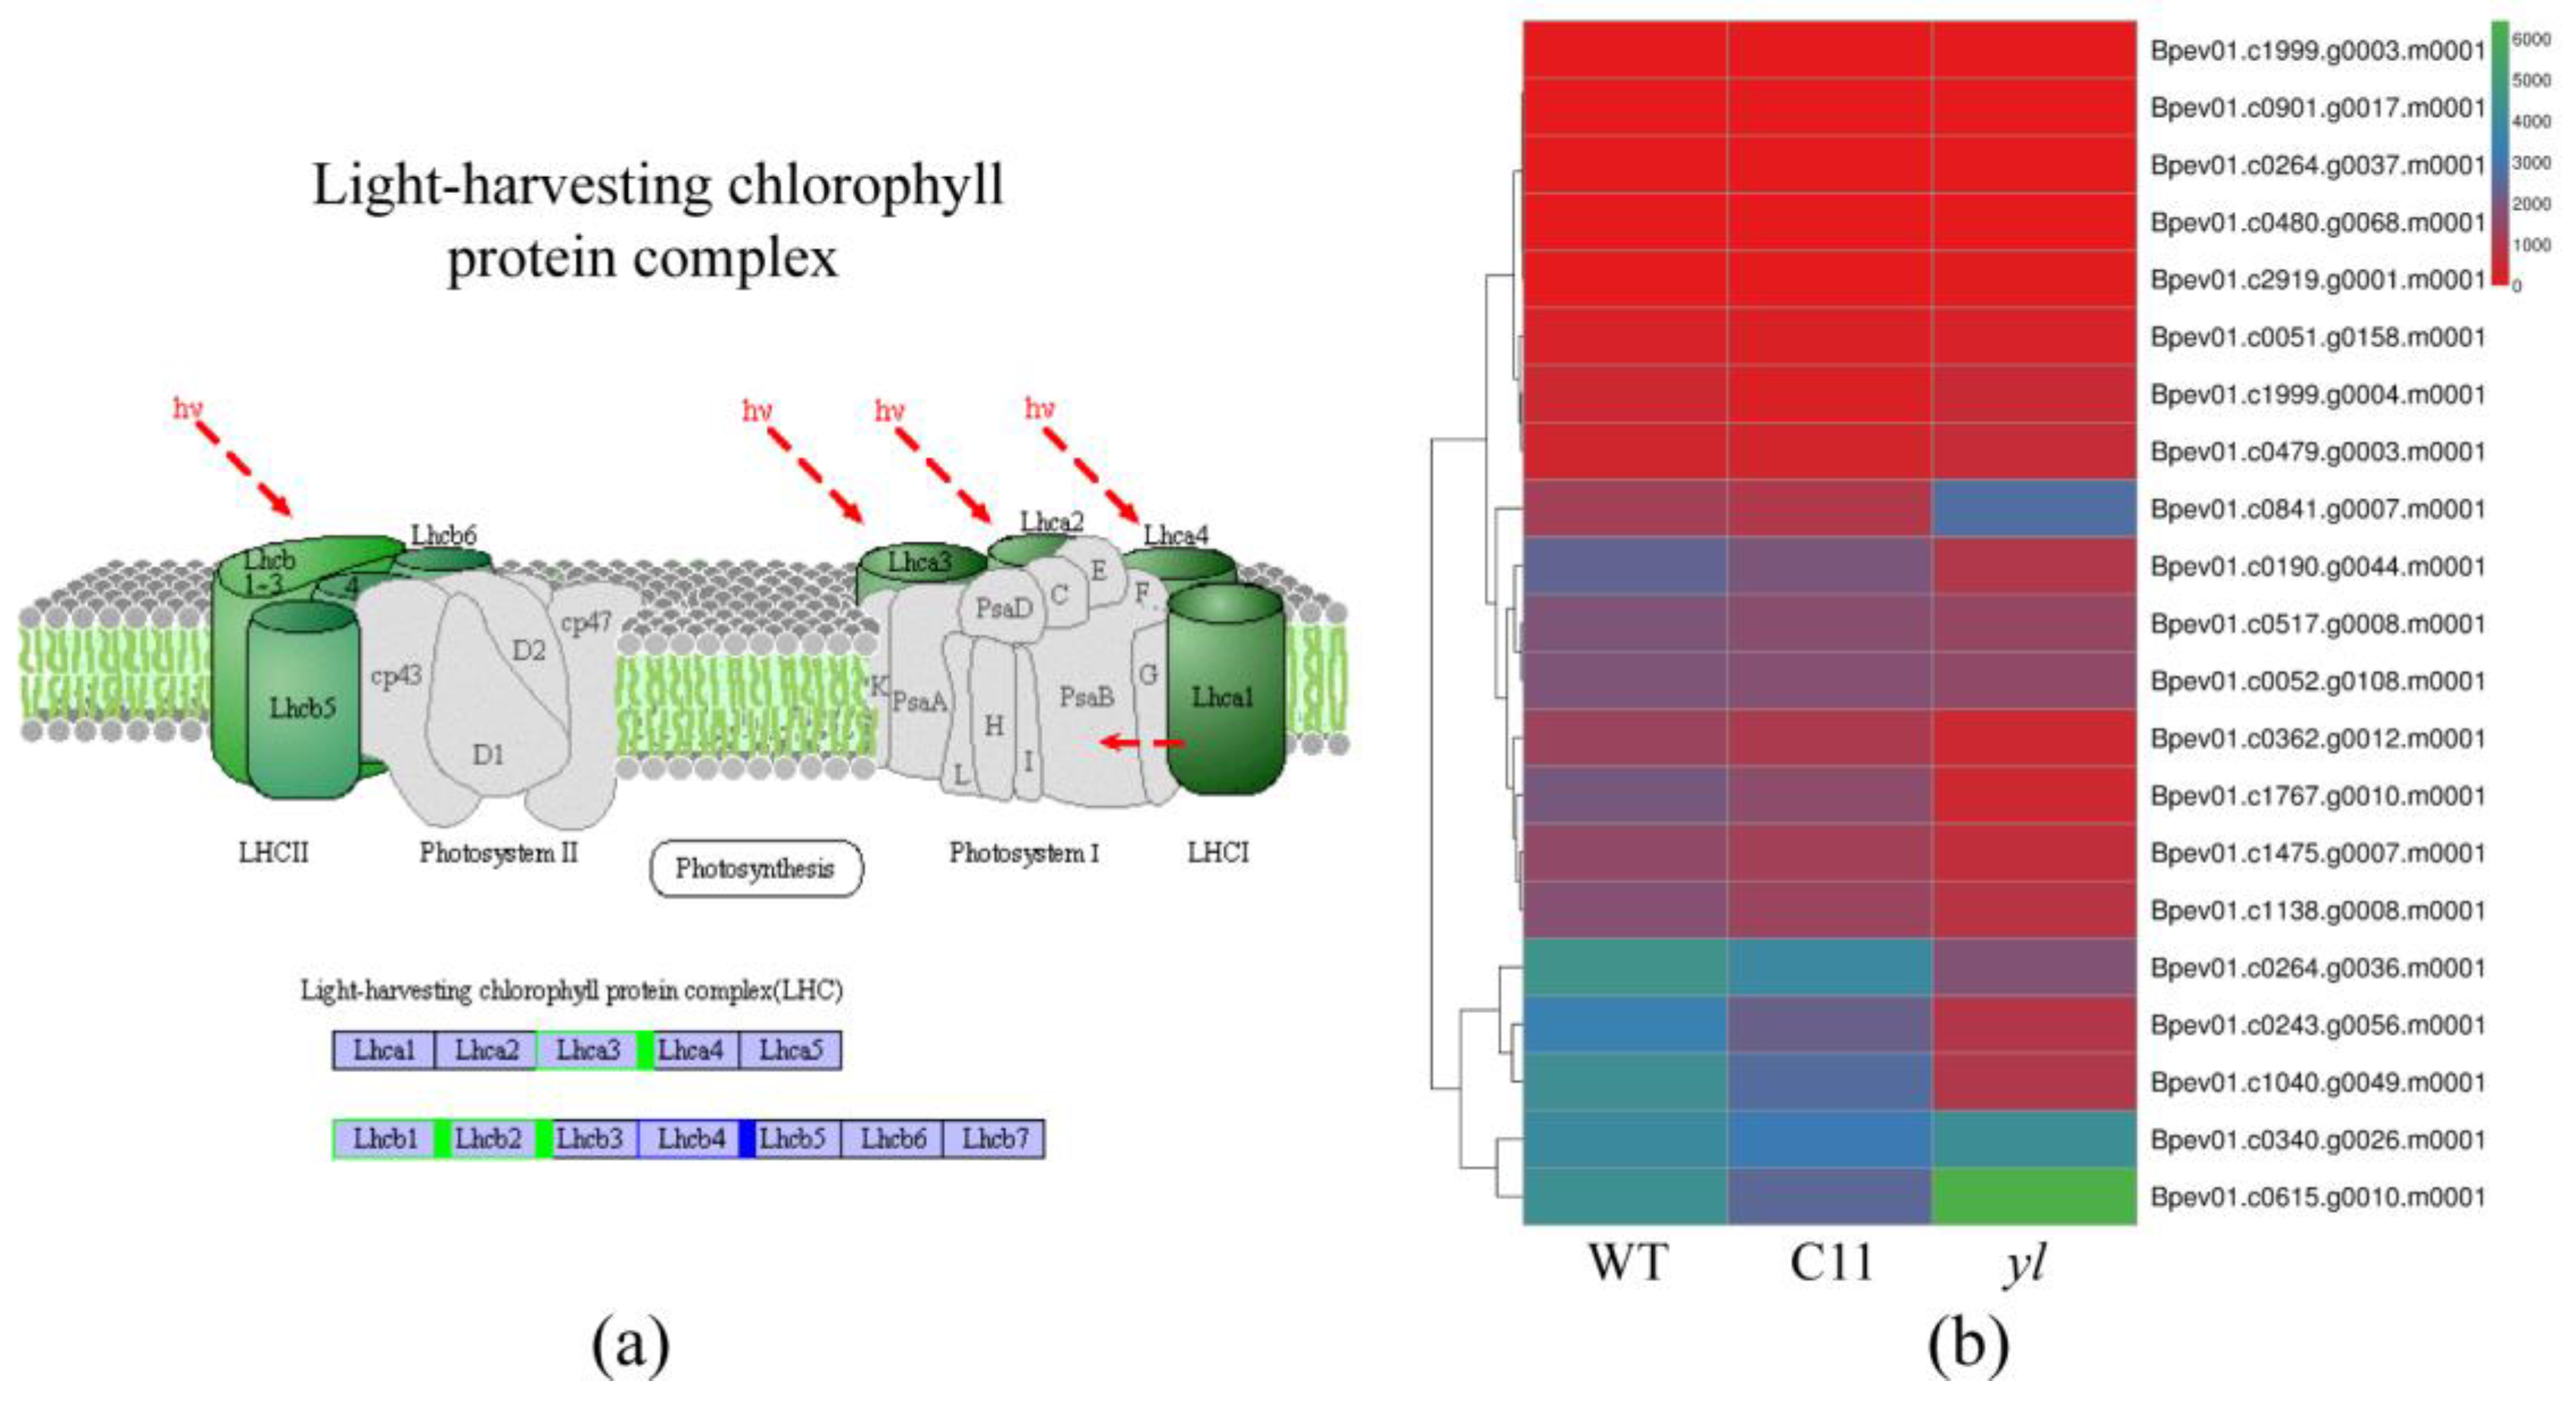
3.4. KEGG Pathway Analysis of DEGs

The DEGs were further subjected to KEGG pathway analysis to identify the enriched biological pathways. The DEGs of C11 vs. yl and WT vs. yl were mapped to 81 and 85 KEGG pathways, respectively. Among them, two pathways, including photosynthesis-antenna proteins and phenylalanine metabolism, were considered significantly enriched at a cut-off P-value < 0.05 and FDR < 0.05 in both C11 vs. yl and WT vs. yl. Photosynthesis-antenna proteins represented the most significantly enriched pathway in the DEGs of yl compared to WT and C11 (Figure 6a,b).
We then explored the photosynthesis-antenna proteins pathway in more detail. A total of twenty-one Lhc (light-harvesting complex) genes were found to be related to the antenna proteins in the birch genome. However, seven of these genes were differently expressed in yl compared to control plants and six displayed low or undetectable levels of expression in all samples. One gene (Bpev01.c0243.g0056.m0001) involved in light-harvesting the Chl a/b binding protein Lhca3 of Photosystem I, three genes (Bpev01.c0362.g0012.m0001, Bpev01.c0264.g0036.m0001, Bpev01.c1767.g0010.m0001) involved in light-harvesting the Chl a/b binding protein Lhcb1, and one gene (Bpev01.c1040.g0049.m0001) involved in light-harvesting the Chl a/b binding protein Lhcb2 of Photosystem II showed significantly reduced transcript levels in yl. Two genes (Bpev01.c0190.g0044.m0001, Bpev01.c0841.g0007.m0001) were involved in light-harvesting the Chl a/b binding protein Lhcb4 of Photosystem II, and Bpev01.c0190.g0044.m0001 was down-regulated and Bpev01.c0841.g0007.m0001 was up-regulated (Figure 7a,b). These results suggested that the changes in the photosynthesis-antenna proteins pathway were important to the unique phenotype of yl.

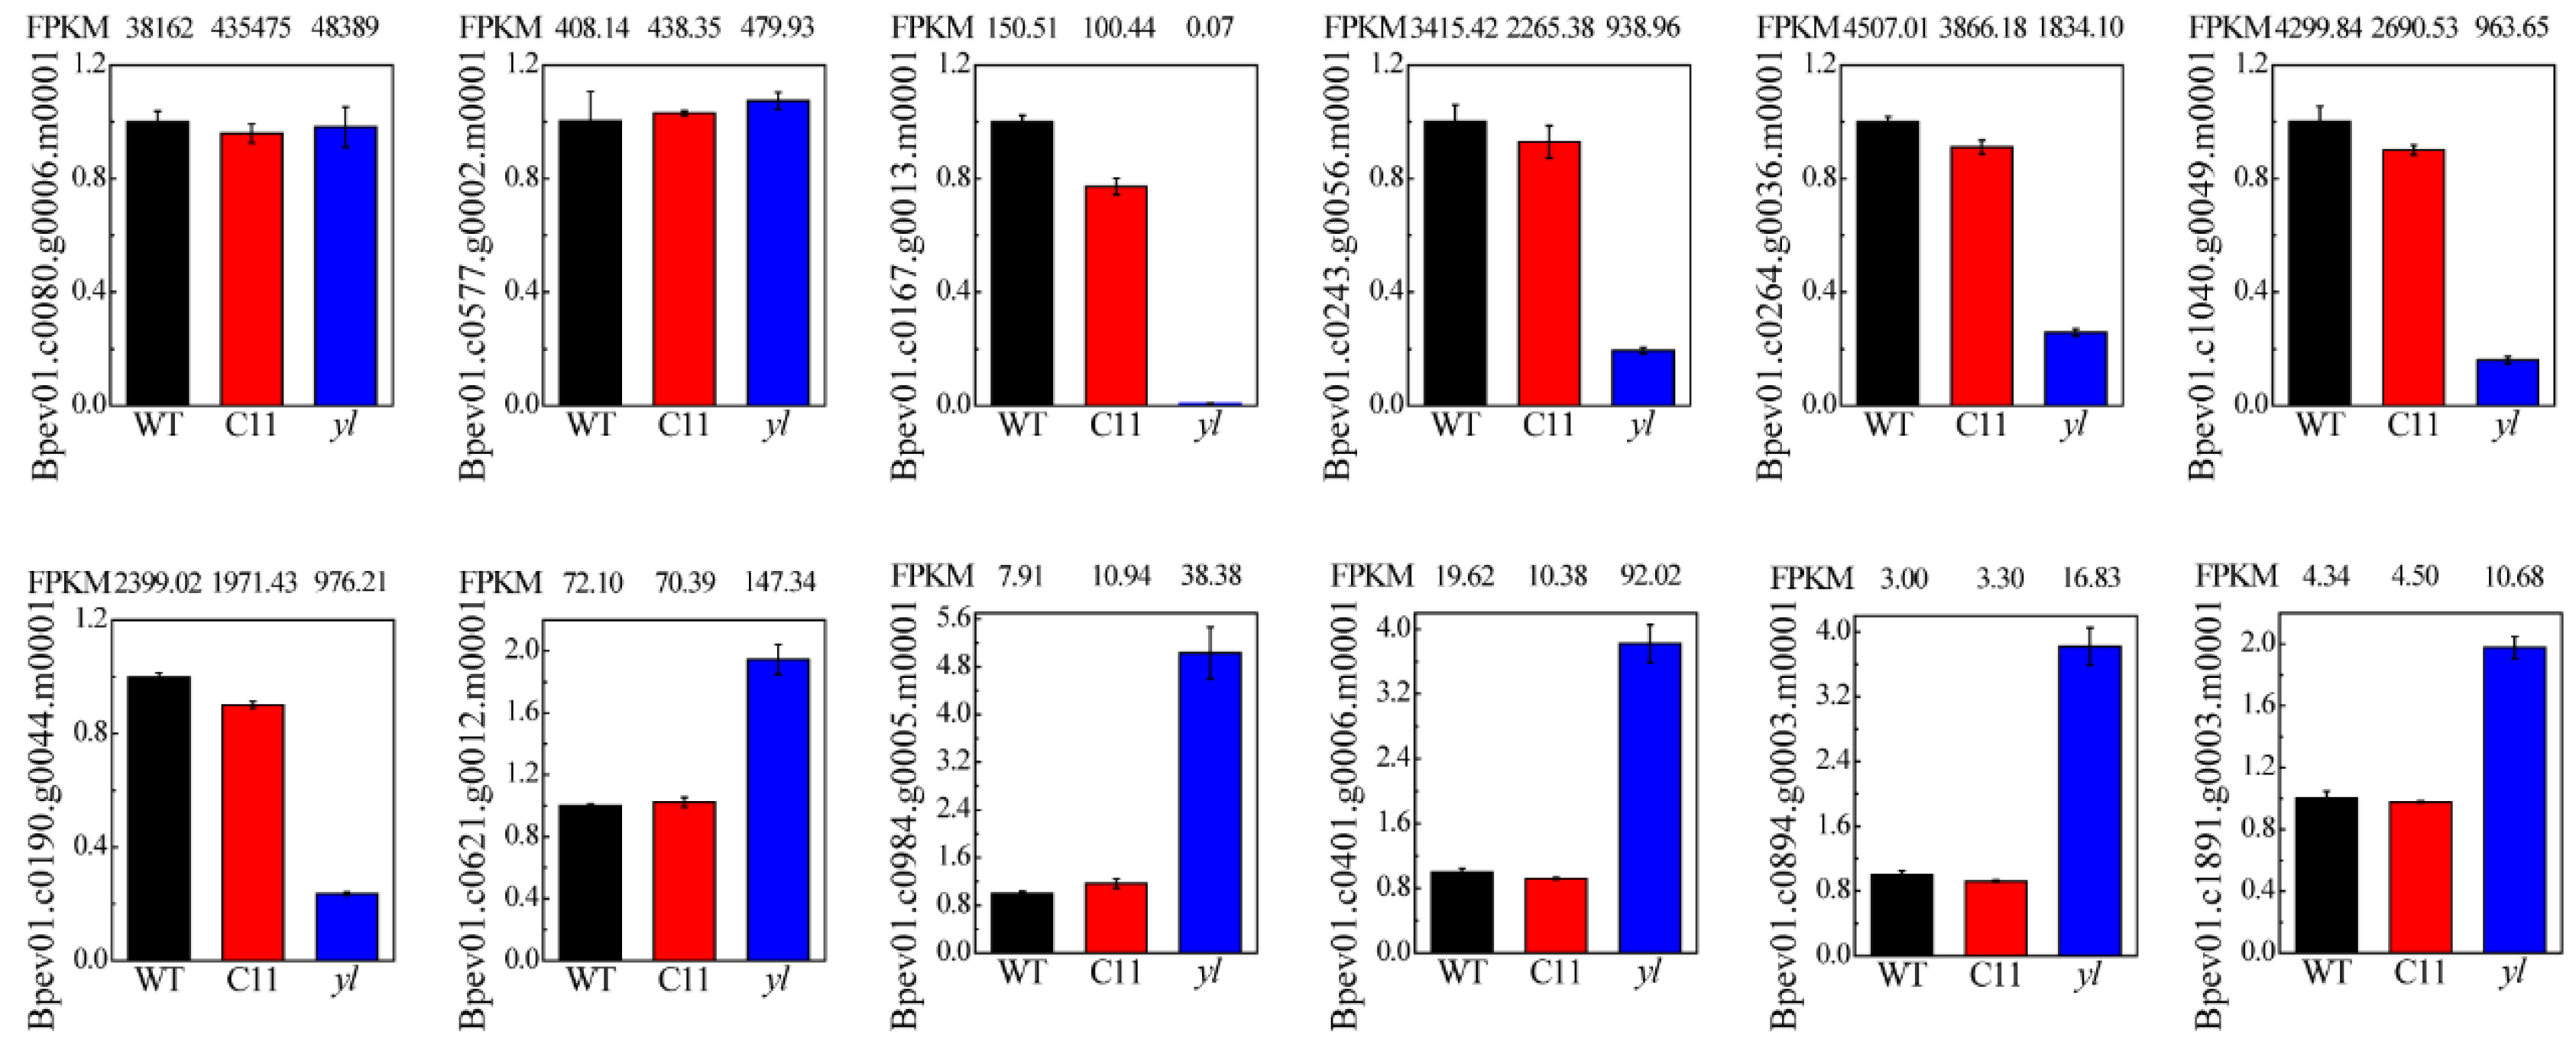
3.5. qRT-PCR Verification of RNA-seq

To test the reliability of RNA-Seq, we selected 12 functionally important and representative genes for validation using qRT-PCR, including two non-DEGs, five down-regulated genes, and five up-regulated genes (Table 3). The expression of all these genes obtained via qRT-PCR showed a similar pattern to that detected by transcriptome sequencing (Figure 8).

4. Discussion

In this study, we reported a Chl-deficient mutant yl that produced yellow-green leaves in birch. The mutant was isolated from BpCCR1 transgenic lines in birch plant breeding. Physiological analysis and gene expression characterization of yl were performed to investigate the difference between yl and control plants (WT and C11).
Chl and Car are the main pigments that trap light energy in leaf tissue. It has been demonstrated that the leaves of Chl-deficient mutants always contain less Chl and Car. Some mutants also showed a change in the ratio of Chl a/b [16,27,28]. Consistent with the previous research, pigment analysis of yl showed that Chl a, Chl b, and Car were reduced in young leaf or mature leaf specimens, compared to WT and C11. We also found that the ratio of Chl a/b was increased in the yl plants (Figure 1). Chl b is thought to be essential to the stability of the light-harvesting Chl a/b protein complex [29]. Thus, the decreased Chl content and increased Chl a/b ratio in yl indicated that there might be fewer light-harvesting antenna complexes than in the WT and C11 controls. There are numerous Chl-deficient mutants that have shown reduced amounts of light-harvesting proteins (LHC) in the thylakoid membranes of the chloroplast [30,31]. Andersson reported that the absence of Lhcb1 and Lhcb2 proteins in Arabidopsis showed reduced Chl levels and increased Chl a/b [32]. According to transcriptomic analysis, DEGs of yl compared with WT and C11 were both significantly enriched in photosynthesis-antenna proteins (Figure 6 and Figure 7). These results revealed that the expression change of genes involved in photosynthesis-antenna proteins plays an important role in the formation of the yellow-green leaf phenotype in yl.
Green plants absorb light energy to convert CO2 and water into carbohydrates and oxygen through photosynthesis. Photosynthesis is the key process that provides energy for catabolic processes and growth in plants. It has been reported that photosynthesis could be influenced by many environmental factors, such as intensity, spectrum and duration of illumination, mechanical wounding, and heating [33,34]. These stimulations would induce the generation and propagation of variation potential [35]. Then, electron flow connected to pH would be changed and the light-harvesting complex would transfer to photosystem II (PSII). As a result, photosynthesis would be decreased in plants [36]. Photosynthesis is a complex process. The changes in pigment contents, stomata conductance, and gene expressions may also affect photosynthesis [37]. Due to the reduced pigment contents, most chlorina mutants have a poorer photosynthetic performance than that observed in wild type specimens [9,38]. However, this is not true for all chlorine mutants. For example, a chlorina rice mutant Huangyu B was found to have a higher photosynthetic efficiency than its wild type [39], and the photosynthetic rate of a Chl-deficient mutant siygl1 in foxtail millet was even higher than that of Yugu1 plants during the reproductive growth stage [15]. In this study, yl showed a reduced pigment, including Chl a, Chl b, and Car contents (Figure 1). The photosynthetic rate, stomata conductance, and transpiration rate of the yl line were lower than WT and C11 under all light intensities set (Figure 3). Additionally, the measurement of photosynthesis in WT, C11, and yl was performed under the same conditions. We also found that there was a significant positive correlation between stomata conductance, pigment contents, and photosynthetic rate. RNA-seq results showed that many genes related to photosynthesis-antenna proteins were down-regulated in yl compared to WT and C11 (Figure 7). As a result, the energy absorbed, trapped, and transferred in photosystem I (PSI) and PSII would probably be affected. Taken together, the decreased photosynthesis in yl was probably mainly due to the low expression level of antenna protein genes, and reduced photosynthetic pigment contents. The difference in Pn may underlie the retarded growth in one-year-old yl mutant plants (Figure 1 and Figure 3).
The molecular mechanism of leaf color mutation is complex. Mutation of genes related to chloroplast development, blocked in photosynthetic pigment biosynthesis, blocked in chloroplast protein transport, and blocked in phytochrome regulation would lead to the formation of a yellow-green mutant [26,27,28,29,30,31]. Studies have shown that plentiful genes are related to the yellow-green leaf phenotype in plants. Examples are cytokinin-responsive gata transcription factor1, Cga1 [40]; chaperone protein ClpC, ClpC1 [41]; signal recognition particle 43 kDa protein, cpSRP43 [42]; chloroplast Signal recognition particle subunit, cpSRP54 [43]; metallo-beta-lactamase, GRY79 [44]; nuclear transcription factor Y, HAP3A [45]; NADPH-dependent thioredoxin reductase C, NTRC [46]; protein stay-green, SGR [47]; and YbeY endoribonuclease, YbeY [38]. However, the expression of all these genes did not change in the yl transcriptome (Table 4).
Plastid-to-nucleus retrograde signaling is considered to coordinate nuclear gene expression. Nott has summarized three independent retrograde signaling pathways from previous studies, including signals generated by Mg-Protoporphyrin IX (Mg-Proto IX), chloroplast gene expression, and the redox state of photosynthetic electron transport components [48]. One possibly important function of retrograde signaling is to regulate the biosynthesis of Chl with the expression of genes for nuclear-encoded Chl-binding proteins, such as the Lhca and Lhcb proteins. Here, we found that the transcription of Chl-binding protein genes (Lhc gene family) was down-regulated via RNA-seq and qRT-PCR analysis (Figure 7 and Figure 8). Members of the Golden2-like (GLK) gene family have been reported to regulate chloroplast development in diverse plant species [49,50]. GLK genes are sensitive to retrograde signaling from the chloroplast, and they could then operate downstream of genes for plastid retrograde signaling [51]. The expression of GLK (Bp023762) was only 0.7% of WT and 0.9% of C11 (Figure 8). In addition, the PSRP1 gene (BP012524), an encoding ribosomal-binding factor (plastid-specific ribosomal protein 1) that inhibits plastid translation by blocking tRNA-binding sites on ribosomes, was upregulated in the yl mutant. These results suggest that plastid-to-nucleus retrograde signaling triggered in yl may regulate nuclear gene expression.

5. Conclusions

In this study, about 1163 DEGs and 930 DEGs were obtained in yl compared with WT and C11, respectively. The DEGs related to the photosynthesis antenna proteins pathway were significantly enriched. In addition, the physiological characteristics analysis showed that the yellow-green leaf mutant yl had reduced amounts of Chl, an increased Chl a/b value, and reduced leaf anatomical compared to control plants. Based on these results, we can conclude that the expression of genes involved in the photosynthesis antenna proteins pathway might be responsible for the lower pigment contents and ratio of Chl a/b, resulting in yellow-green leaves in yl.

Supplementary Materials

The following are available online at https://www.mdpi.com/1999-4907/10/2/120/s1, Table S1: The correlation analysis between pigment contents and Pn.

Author Contributions

J.J. and S.C. designed the experiments; H.G. performed the experiments; S.C. analyzed the data; H.G. wrote the manuscript; J.J., G.L., and S.C. revised the manuscript.

Funding

This research was funded by the National Natural Science Foundation of China (No. 31570647) and the 111 Project (B16010).

Acknowledgments

We are grateful to the transgenic material yl generated by Rui Wei and Wenbo Zhang.

Conflicts of Interest

The authors declare no conflict of interest.

References

  1. Zyryanova, O.A.; Terazawa, M.; Koike, T.; Zyryanov, V.I. White birch trees as resource species of Russia: Their distribution, ecophysiological features, multiple utilizations. Eurasian J. For. Res. 2010, 13, 25–40. [Google Scholar]
  2. Dulamsuren, C.; Hauck, M.; Bader, M.K.-F.; Osokhjargal, D.; Oyungerel, S.; Nyambayar, S.; Runge, M.; Leuschner, C. Water relations and photosynthetic performance in Larix sibirica growing in the forest-steppe ecotone of northern Mongolia. Tree Physiol. 2008, 29, 99–110. [Google Scholar] [CrossRef] [Green Version]
  3. Bekhta, P.; Hiziroglu, S.; Shepelyuk, O. Properties of plywood manufactured from compressed veneer as building material. Mater. Des. 2009, 30, 947–953. [Google Scholar] [CrossRef]
  4. Liu, X.; Wang, Q.; Chen, P.; Song, F.; Guan, M.; Jin, L.; Wang, Y.; Yang, C. Four Novel Cellulose Synthase (CESA) Genes from Birch (Betula platyphylla Suk.) Involved in Primary and Secondary Cell Wall Biosynthesis. IJMS 2012, 13, 12195–12212. [Google Scholar] [CrossRef] [PubMed] [Green Version]
  5. Borrega, M.; Tolonen, L.K.; Bardot, F.; Testova, L.; Sixta, H. Potential of hot water extraction of birch wood to produce high-purity dissolving pulp after alkaline pulping. Bioresour. Technol. 2013, 135, 665–671. [Google Scholar] [CrossRef] [PubMed]
  6. Rubert-Nason, K.F.; Holeski, L.M.; Couture, J.J.; Gusse, A.; Undersander, D.J.; Lindroth, R.L. Rapid phytochemical analysis of birch (Betula) and poplar (Populus) foliage by near-infrared reflectance spectroscopy. Anal. Bioanal. Chem. 2012, 405, 1333–1344. [Google Scholar] [CrossRef] [PubMed]
  7. Lin, L.; Mu, H.; Jiang, J.; Liu, G. Transcriptomic analysis of purple leaf determination in birch. Gene 2013, 526, 251–258. [Google Scholar] [CrossRef] [PubMed]
  8. Zhang, W.B.; Wei, R.; Chen, S.; Jiang, J.; Li, H.Y.; Huang, H.J.; Yang, G.; Wang, S.; Wei, H.R.; Liu, G.F. Functional characterization of CCR in birch (Betula platyphylla x Betula pendula) through overexpression and suppression analysis. Physiol. Plant. 2015, 154, 283–296. [Google Scholar] [CrossRef]
  9. Córdoba, J.; Molina-Cano, J.-L.; Martínez-Carrasco, R.; Morcuende, R.; Pérez, P. Functional and transcriptional characterization of a barley mutant with impaired photosynthesis. Plant Sci. 2016, 244, 19–30. [Google Scholar] [CrossRef] [Green Version]
  10. Liu, J.; Wang, J.; Yao, X.; Dong, X.; Chen, W.; Li, Z.K. Fine mapping and photosynthetic characteristics of the lower chlorophyllb1 mutant in rice (Oryza sativa L.). Plant Breed. 2015, 134, 661–667. [Google Scholar] [CrossRef]
  11. Zhong, X.M.; Sun, S.F.; Li, F.H.; Wang, J.; Shi, Z.S. Photosynthesis of a yellow-green mutant line in maize. Photosynthetica 2015, 53, 499–505. [Google Scholar] [CrossRef]
  12. Li, N.; Jia, J.; Xia, C.; Liu, X.; Kong, X. Characterization and mapping of novel chlorophyll deficient mutant genes in durum wheat. Breed. Sci. 2013, 63, 169–175. [Google Scholar] [CrossRef] [PubMed] [Green Version]
  13. Karaca, M.; Saha, S.; Callahan, F.E.; Jenkins, J.N.; Read, J.J.; Percy, R.G. Molecular and cytological characterization of a cytoplasmic-specific mutant in pima cotton (Gossypium barbadense L.). Euphytica 2004, 139, 187–197. [Google Scholar] [CrossRef]
  14. Wang, L.; Yue, C.; Cao, H.; Zhou, Y.; Zeng, J.; Yang, Y.; Wang, X. Biochemical and transcriptome analyses of a novel chlorophyll-deficient chlorina tea plant cultivar. BMC Plant Biol. 2014, 14, 239. [Google Scholar] [CrossRef]
  15. Li, W.; Tang, S.; Zhang, S.; Shan, J.; Tang, C.; Chen, Q.; Jia, G.; Han, Y.; Zhi, H.; Diao, X. Gene mapping and functional analysis of the novel leaf color gene SiYGL1 in foxtail millet [Setaria italica (L.) P. Beauv]. Physiol. Plant. 2016, 157, 24–37. [Google Scholar] [CrossRef] [PubMed]
  16. Zhu, X.; Guo, S.; Wang, Z.; Du, Q.; Xing, Y.; Zhang, T.; Shen, W.; Sang, X.; Ling, Y.; He, G. Map-based cloning and functional analysis of YGL8, which controls leaf colour in rice (Oryza sativa). BMC Plant Biol. 2016, 16, 134. [Google Scholar] [CrossRef] [PubMed]
  17. Cao, J.; Schneeberger, K.; Ossowski, S.; Günther, T.; Bender, S.; Fitz, J.; Koenig, D.; Lanz, C.; Stegle, O.; Lippert, C.; et al. Whole-genome sequencing of multiple Arabidopsis thaliana populations. Nat. Genet. 2011, 43, 956–963. [Google Scholar] [CrossRef] [Green Version]
  18. Cai, Q.; Li, B.; Lin, F.; Huang, P.; Guo, W.; Zheng, Y. De novo sequencing and sssembly analysis of transcriptome in Pinus bungeana Zucc. ex Endl. Forests 2018, 9, 156. [Google Scholar] [CrossRef]
  19. Du, M.; Ding, G.; Cai, Q. The Transcriptomic Responses of Pinus massoniana to Drought Stress. Forests 2018, 9, 326. [Google Scholar] [CrossRef]
  20. Li, Y.; Zhang, Z.; Wang, P.; Wang, S.; Ma, L.; Li, L.; Yang, R.; Ma, Y.; Wang, Q. Comprehensive transcriptome analysis discovers novel candidate genes related to leaf color in a Lagerstroemia indica yellow leaf mutant. Genes Genom. 2015, 37, 851–863. [Google Scholar] [CrossRef]
  21. Lichtenthaler, H.K.; Wellburn, A.R. Determinations of total carotenoids and chlorophylls a and b of leaf extracts in different solvents. Biochem. Soc. Trans. 1983, 11, 591–592. [Google Scholar] [CrossRef]
  22. Chang, S.; Puryear, J.; Cairney, J. A simple and efficient method for isolating RNA from pine trees. Plant Mol. Biol. Report. 1993, 11, 113–116. [Google Scholar] [CrossRef]
  23. Salojärvi, J.; Smolander, O.-P.; Nieminen, K.; Rajaraman, S.; Safronov, O.; Safdari, P.; Lamminmäki, A.; Immanen, J.; Lan, T.; Tanskanen, J.; et al. Genome sequencing and population genomic analyses provide insights into the adaptive landscape of silver birch. Nat. Genet. 2017, 49, 904–912. [Google Scholar] [CrossRef] [PubMed] [Green Version]
  24. Dobin, A.; Gingeras, T.R. Comment on “TopHat2: Accurate alignment of transcriptomes in the presence of insertions, deletions and gene fusions” by Kim et al. Bioinformatics 2013, 14, 000851. [Google Scholar]
  25. Livak, K.J.; Schmittgen, T.D. Analysis of Relative Gene Expression Data Using Real-Time Quantitative PCR and the 2−ΔΔCT Method. Methods 2001, 25, 402–408. [Google Scholar] [CrossRef] [PubMed]
  26. Huang, H.; Wang, S.; Jiang, J.; Liu, G.; Li, H.; Chen, S.; Xu, H. Overexpression of BpAP1 induces early flowering and produces dwarfism in Betula platyphylla x Betula pendula. Physiol. Plant. 2014, 151, 495–506. [Google Scholar] [CrossRef] [PubMed]
  27. Ma, X.; Sun, X.; Li, C.; Huan, R.; Sun, C.; Wang, Y.; Xiao, F.; Wang, Q.; Chen, P.; Ma, F.; et al. Map-based cloning and characterization of the novel yellow-green leaf gene ys83 in rice (Oryza sativa). Plant Physiol. Biochem. 2017, 111, 1–9. [Google Scholar] [CrossRef]
  28. Dong, H.; Fei, G.-L.; Wu, C.-Y.; Wu, F.-Q.; Sun, Y.-Y.; Chen, M.-J.; Ren, Y.-L.; Zhou, K.-N.; Cheng, Z.-J.; Wang, J.-L.; et al. A rice virescent-yellow Leaf mutant reveals new insights into the role and sssembly of plastid caseinolytic protease in higher plants. Plant Physiol. 2013, 162, 1867–1880. [Google Scholar] [CrossRef]
  29. Tanaka, R.; Koshino-Kimura, Y.; Sawa, S.; Ishiguro, S.; Okada, K.; Tanaka, A. Overexpression of chlorophyllide an oxygenase (CAO) enlarges the antenna size of photosystem II in Arabidopsis thaliana. Plant J. 2002, 26, 365–373. [Google Scholar] [CrossRef]
  30. Highkin, H.R.; Boardman, N.K.; Goodchild, D.J. Photosynthetic Studies on a Pea-mutant Deficient in Chlorophyll. Plant Physiol. 1969, 44, 1310–1320. [Google Scholar] [CrossRef] [Green Version]
  31. Polle, J.E.W.; Benemann, J.R.; Tanaka, A.; Melis, A. Photosynthetic apparatus organization and function in the wild type and a chlorophyll b -less mutant of Chlamydomonas reinhardtii. Dependence on carbon source. Planta 2000, 211, 335–344. [Google Scholar] [CrossRef] [PubMed]
  32. Andersson, J.; Wentworth, M.; Walters, R.G.; Howard, C.A.; Ruban, A.; Horton, P.; Jansson, S. Absence of the Lhcb1 and Lhcb2 proteins of the light-harvesting complex of photosystem II—Effects on photosynthesis, grana stacking and fitness. Plant J. 2003, 35, 350–361. [Google Scholar] [PubMed]
  33. Maxwell, K.; Johnson, G.N. Chlorophyll fluorescence—A practical guide. J. Exp. Bot. 2000, 51, 659–668. [Google Scholar] [CrossRef] [PubMed]
  34. Müller, P.; Li, X.P.; Niyogi, K.K. Non-photochemical quenching. A response to excess light energy. Plant Physiol. 2001, 125, 1558–1566. [Google Scholar] [CrossRef] [PubMed]
  35. Sukhov, V.; Surova, L.; Sherstneva, O.; Katicheva, L.; Vodeneev, V. Variation potential influence on photosynthetic cyclic electron flow in pea. Front. Plant Sci. 2015, 5, 766. [Google Scholar] [CrossRef] [PubMed]
  36. Sukhova, E.; Mudrilov, M.; Vodeneev, V.; Sukhov, V. Influence of the variation potential on photosynthetic flows of light energy and electrons in pea. Photosynth. Res. 2017, 136, 215–228. [Google Scholar] [CrossRef]
  37. Cheng, J.; Fan, P.; Liang, Z.; Wang, Y.; Niu, N.; Li, W.; Li, S. Accumulation of End Products in Source Leaves Affects Photosynthetic Rate in Peach via Alteration of Stomatal Conductance and Photosynthetic Efficiency. J. Amer. Soc. Hort. Sci. 2009, 134, 667–676. [Google Scholar] [CrossRef]
  38. Liu, J.; Zhou, W.; Liu, G.; Yang, C.; Sun, Y.; Wu, W.; Cao, S.; Wang, C.; Hai, G.; Wang, Z.; et al. The Conserved Endoribonuclease YbeY Is Required for Chloroplast Ribosomal RNA Processing in Arabidopsis. Plant Physiol. 2015, 168, 205–221. [Google Scholar] [CrossRef] [Green Version]
  39. Zhou, X.-S.; Wu, D.-X.; Shen, S.-Q.; Sun, J.-W.; Shu, Q.-Y. High photosynthetic efficiency of a rice (Oryza sativa L.) xantha mutant. Photosynthetica 2006, 44, 316–319. [Google Scholar] [CrossRef]
  40. Hudson, D.; Guevara, D.R.; Hand, A.J.; Xu, Z.; Hao, L.; Chen, X.; Zhu, T.; Bi, Y.-M.; Rothstein, S.J. Rice Cytokinin GATA Transcription Factor1 Regulates Chloroplast Development and Plant Architecture. Plant Physiol. 2013, 162, 132–144. [Google Scholar] [CrossRef] [Green Version]
  41. Sjögren, L.L.; Macdonald, T.M.; Sutinen, S.; Clarke, A.K. Inactivation of the clpC1 Gene Encoding a Chloroplast Hsp100 Molecular Chaperone Causes Growth Retardation, Leaf Chlorosis, Lower Photosynthetic Activity, and a Specific Reduction in Photosystem Content. Plant Physiol. 2004, 136, 4114–4126. [Google Scholar] [CrossRef] [PubMed]
  42. Lv, X.-G.; Shi, Y.-F.; Xu, X.; Wei, Y.-L.; Wang, H.-M.; Zhang, X.-B.; Wu, J.-L. Oryza sativa Chloroplast Signal Recognition Particle 43 (OscpSRP43) Is Required for Chloroplast Development and Photosynthesis. PLoS ONE 2015, 10, e0143249. [Google Scholar] [CrossRef] [PubMed]
  43. Yu, B.; Gruber, M.Y.; Khachatourians, G.G.; Zhou, R.; Epp, D.J.; Hegedus, D.D.; Parkin, I.A.P.; Welsch, R.; Hannoufa, A. Arabidopsis cpSRP54 regulates carotenoid accumulation in Arabidopsis and Brassica napus. J. Exp. Bot. 2012, 63, 5189–5202. [Google Scholar] [CrossRef] [PubMed] [Green Version]
  44. Wan, C.M.; Li, C.M.; Ma, X.Z.; Wang, Y.; Sun, C.H.; Huang, R.; Zhong, P.; Gao, Z.Y.; Chen, D.; Xu, Z.J.; et al. GRY79 encoding a putative metallo-beta-lactamase-trihelix chimera is involved in chloroplast development at early seedling stage of rice. Plant Cell Rep. 2015, 34, 1353–1363. [Google Scholar] [CrossRef] [PubMed]
  45. Miyoshi, K.; Ito, Y.; Serizawa, A.; Kurata, N. OsHAP3genes regulate chloroplast biogenesis in rice. Plant J. 2003, 36, 532–540. [Google Scholar] [CrossRef] [PubMed] [Green Version]
  46. Perez-Ruiz, J.M. Rice NTRC Is a High-Efficiency Redox System for Chloroplast Protection against Oxidative Damage. Plant Cell 2006, 18, 2356–2368. [Google Scholar] [CrossRef] [PubMed] [Green Version]
  47. Jiang, H.; Li, M.; Liang, N.; Yan, H.; Wei, Y.; Xu, X.; Liu, J.; Xu, Z.; Chen, F.; Wu, G.; et al. Molecular cloning and function analysis of the stay green gene in rice. Plant J. 2007, 52, 197–209. [Google Scholar] [CrossRef] [Green Version]
  48. Nott, A.; Jung, H.-S.; Koussevitzky, S.; Chory, J. Plastid-to-nucleus retrograde signaling. Annu. Rev. Plant Biol. 2006, 57, 739–759. [Google Scholar] [CrossRef]
  49. Rossini, L.; Cribb, L.; Martin, D.J.; Langdale, J.A. The Maize Golden2 Gene Defines a Novel Class of Transcriptional Regulators in Plants. Plant Cell 2001, 13, 1231. [Google Scholar] [CrossRef]
  50. Yasumura, Y.; Moylan, E.C.; Langdale, J.A. A Conserved Transcription Factor Mediates Nuclear Control of Organelle Biogenesis in Anciently Diverged Land Plants. Plant Cell 2005, 17, 1894–1907. [Google Scholar] [CrossRef] [Green Version]
  51. Wang, P.; Korkaric, M.; Waters, M.T.; Capper, R.G.; Saunders, N.J.; Langdale, J.A. GLK transcription factors coordinate expression of the photosynthetic apparatus in Arabidopsis. Plant Cell 2009, 21, 1109–1128. [Google Scholar]
Figure 1. Growth performance and pigment content of wild type birch (WT), BpCCR1 overexpression line 11 (C11) and yellow-green leaf mutant (yl) lines. (a) Growth performance of one-year-old WT and yl plants. (b) The leaves from first to sixth of WT, C11, and yl lines. (c) Chl a, Chl b, Car, and Chl a/b in first to sixth leaves of WT, C11, and yl lines. Error bars represent the standard deviation (SD) of three independent experiments.
Forests 10 00120 g001
Figure 2. Leaf anatomical characteristics of WT, C11, and yl. (a) Leaf transections of WT, C11, and yl lines. (b) Leaf anatomical structure of WT, C11, and yl. Lamina thickness, LT. Adaxial epidermis thickness, UE. Abaxial epidermis thickness, LE. Palisade parenchyma thickness, PT. Spongy parenchyma thickness, ST. Error bars represent the standard deviation (SD) of 20 measurements from five individual plants.
Forests 10 00120 g002
Figure 3. Photosynthetic and growth performance of WT, C11, and yl lines. Photosynthetic rate (a) and transpiration rate (b) of WT, C11, and yl. Error bars represent the SD of three measurements. (c) Plant height of WT, C11, and yl. Error bars represent the SD of 40 measurements.
Forests 10 00120 g003
Figure 4. The scatter plots between Pn and Tr in WT, C11, and yl.
Forests 10 00120 g004
Figure 5. Differentially expressed genes (DEGs) analysis based on Gene ontology. (a) Number of DEGs in C11 vs. yl and WT vs. yl. (b) Gene ontology classification of DEGs in C11 vs. yl and WT vs. yl.
Forests 10 00120 g005
Figure 6. KEGG-based pathway enrichment of DEGs in C11 vs. yl and WT vs. yl.
Forests 10 00120 g006
Figure 7. Expression pattern of genes involved in light-harvesting Chl complex in WT, C11, and yl. (a) DEGs in the pathway of light-harvesting Chl complex. Green box represents down-regulated genes. Blue box represents down-regulated and up-regulated genes. (b) Expression of all genes involved in light-harvesting Chl complex in WT, C11, and yl.
Forests 10 00120 g007
Figure 8. Quantificational real-time PCR verification of RNA-seq. Error bars represent the SD of three measurements.
Forests 10 00120 g008
Table 1. The primer sequences used in qRT-PCR.
GeneForward Primer (5′-3′)Reverse Primer (5′-3′)
Bpev01.c0080.g0006.m0001GGCTCAATCCAGCATGGTTGCCCACACCTGCATGCATTGCAC
Bpev01.c0577.g0002.m0001CGTTCATGGTGGACCTGAGCCAGCTAAAGTGAGGGACTTTGTCGAT
Bpev01.c0167.g0013.m0001CACAACATAGCCAGCCACCTTCGTCGGTGCTACCCAAGGACTC
Bpev01.c0243.g0056.m0001CAACGGACGTTATGCCATGTTGGTCCCAGCCGGCGGAATTAC
Bpev01.c0264.g0036.m0001CGGTGAGGCCGTGTGGTTCGCCCATCAGGATGACCTGT
Bpev01.c1040.g0049.m0001CCCGAGACATTTGCCAAGAACCGCCTTGAACCAGACTGCCTCTC
Bpev01.c0190.g0044.m0001CTTGGCCGGCGATGTGATCGCCAACATGGCCCACCTC
Bpev01.c0621.g0012.m0001GCAATAGGCCTTGCCTCCTTCATAGCGAGTACCCGTCTTCTCATTCGC
Bpev01.c0984.g0005.m0001GGGAGACTAAGGTACAAGCAGTGGCCAGCTGCTCAATTGCTTCAGAG
Bpev01.c0401.g0006.m0001GGGAAGGCAAGGCTAGTGCAGGCCTTCAACAGCAAGGCAAGT
Bpev01.c0894.g0003.m0001CCTCCAACAGGGAGTGGCAACCTGTCAATCATCCCAGAACAGCTTG
Bpev01.c1891.g0003.m0001GGCGTTCCGTATATGAGCCTCTTCGGCTACTGCTGTTTTACCGGTCT
Table 2. The correlation analysis of transpiration rate (Tr), stomatal conductance (Gs), and Pn in WT, C11, and yl. ** Correlation is significant at the 0.01 level (2-tailed).
CorrelationGs in WT (mol m−2 s−1)Tr in WT (mmol m−2 s−1)Gs in C11 (mol m−2 s−1)Tr in C11 (mmol m−2 s−1)Gs in yl (mol m−2 s−1)Tr in yl (mmol m−2 s−1)
Tr in WT (mmol m−2 s−1)0.987 **-----
Pn in WT (μmol m−2 s−1)0.860 **0.915 **----
Tr in C11 (mmol m−2 s−1)--0.986 **---
Pn in C11 (μmol m−2 s−1)--0.856 **0.895 **--
Tr in yl (mmol m−2 s−1)----0.991 **-
Pn in yl (μmol m−2 s−1)----0.773 **0.815 **
Table 3. The genes used for qRT-PCR.
GeneC11 and WT vs. yl
Bpev01.c0080.g0006.m0001normal
Bpev01.c0577.g0002.m0001normal
Bpev01.c0167.g0013.m0001down-regulated
Bpev01.c0243.g0056.m0001down-regulated
Bpev01.c0264.g0036.m0001down-regulated
Bpev01.c1040.g0049.m0001down-regulated
Bpev01.c0190.g0044.m0001down-regulated
Bpev01.c0621.g0012.m0001up-regulated
Bpev01.c0984.g0005.m0001up-regulated
Bpev01.c0401.g0006.m0001up-regulated
Bpev01.c0894.g0003.m0001up-regulated
Bpev01.c1891.g0003.m0001up-regulated
Table 4. The expression of well-known genes related to leaf color in the transcriptional level of a yl mutant.
GeneIDAnnotationC11 and WT vs. ylMutant phenotype
Cga1Bpev01.c0051.g0036.m0001Cytokinin-responsive gata transcription factor1normalyellow leaf
ClpC1Bpev01.c1202.g0038.m0001Chaperone protein ClpCnormalchlorotic leaf
cpSRP43Bpev01.c1171.g0012.m0001Signal recognition particle 43 kDa proteinnormalyellow-green leaf
cpSRP54Bpev01.c1238.g0002.m0001Chloroplast signal recognition particle subunitnormalyellow-green leaf
GRY79Bpev01.c0787.g0006.m0001Metallo-beta-lactamasenormalyellow turn green
HAP3ABpev01.c0288.g0025.m0001Nuclear transcription factor Ynormalpale-green leaf
NTRCBpev01.c0029.g0129.m0001NADPH-dependent thioredoxin reductase Cnormallight-green leaf
SGRBpev01.c0717.g0015.m0001Protein stay-greennormalstay-green
YbeYBpev01.c1489.g0003.m0001YbeY endoribonucleasenormalpale-green leaf

