Article

Soil Fungal Community in Norway Spruce Forests under Bark Beetle Attack

by
Petra Veselá
1,2,*,
Martina Vašutová
1,3,
Magda Edwards-Jonášová
1 and
Pavel Cudlín
1
1
Department of Carbon Storage in the Landscape, Global Change Research Institute, Czech Academy of Sciences, Lipová 1789/9, 37005 České Budějovice, Czech Republic
2
Department of Carbon Storage in the Landscape, Global Change Research Institute CAS, Zemědělská 1665/1, 61300 Brno, Czech Republic
3
Department of Botany, Faculty of Science, University of South Bohemia, Branišovská 31, 37005 České Budějovice, Czech Republic
*
Author to whom correspondence should be addressed.
Forests 2019, 10(2), 109; https://doi.org/10.3390/f10020109
Submission received: 14 January 2019 / Revised: 25 January 2019 / Accepted: 28 January 2019 / Published: 29 January 2019
(This article belongs to the Special Issue The Ecology of Fine Roots and Mycorrhizas in Forests)

Abstract

:
Bark beetle infestation is a widespread phenomenon in temperate forests, which are facing significant weather fluctuations accompanying climate change. Fungi play key roles in forest ecosystems as symbionts of ectomycorrhizal trees, decomposers, or parasites, but the effect of severe disturbances on their communities is largely unknown. The responses of soil fungal communities following bark beetle attack were determined using Illumina sequencing of soil samples from 10 microsites in a mature forest not attacked by bark beetle, a forest attacked by bark beetle, a forest destroyed by bark beetle, and a stand where all trees were removed after a windstorm. The proportion of ITS2 sequences assigned to mycorrhizal fungal species decreased with increased intensity of bark beetle attack (from 70 to 15%), whereas the proportion of saprotrophs increased (from 29 to 77%). Differences in the ectomycorrhizal (ECM) fungal community was further characterized by a decrease in the sequence proportion of Elaphomyces sp. and Russula sp. and an increase in Piloderma sp., Wilcoxina sp., and Thelephora terrestris. Interestingly, the species composition of the ECM fungal community in the forest one year after removing the windstorm-damaged trees was similar to that of the mature forest, despite the sequence proportion attributed to ECM fungi decreased.

1. Introduction

Bark beetle outbreaks represent the most important disturbance events in temperate and boreal forests [1] and, together with windstorms [2] and fire [3], cause severe damage to forest stands in the northern hemisphere. Extensive damage caused by mountain pine beetle (Dendroctonus ponderosae) and mountain spruce beetle (Dendroctonus rufipennis) were reported from Western Canada [4] and the United States [5,6,7]. In European temperate forests, the European spruce bark beetle (Ips typographus) represents the dominant herbivore insect [3,8].
Bark beetle populations do not usually cause serious damage to the health of natural forests, but they can rapidly breed and spread as soon as conditions become favorable, e.g. sufficient breeding resources and habitats represented by fallen trees after a windstorm [3]. These conditions have become increasingly relevant in a climate change context [1,7,8]. Global warming and changes in precipitation patterns have resulted in the intensification of outbreaks [1,3] and can promote the survival, reproduction, and dispersal of insect herbivores [9], contributing to their higher pressure on forest ecosystems [1].
Soil fungi represent an important component of forest ecosystems. They are regarded as the dominant degraders of organic matter and mediators of carbon cycling [10]. Ectomycorrhizal (ECM) fungi form a symbiosis with tree roots of several plant families including Pinaceae [11] and may influence plant fitness and plant community development [12,13]. ECM fungi can also influence tolerance against herbivores [14] and promote recovery from herbivore infestation [15].
Even though fungi play such important roles in forest ecosystem functioning, information about their reaction to bark beetle infestation is sparse. The only study that has dealt with a bark beetle outbreak in spruce forest reported a decrease in mycorrhizal fungi while saprotrophic fungi increased due to the higher mass of dead plant material and gradual changes in the fungal community drive by substrate availability [16]. Similar observations were made by Treu et al. [17] and Pec et al. [18] in pine forests destroyed by mountain pine beetle in Canada.
A massive European spruce bark beetle outbreak in the Tatra Mts. (Slovakia) spread several years after a severe windstorm in 2004 which destroyed 12,000 ha of spruce forests [19]. The peak of subsequent bark beetle outbreak culminated in 2008 and 2009. The area of dead tree crown projections reached 90% in some forest parts [20], while other parts of these forests were less affected. Nevertheless, the first signs of infestation occurred in 2009 with tree mortality reaching almost 6% in 2012 [20]. The Tatra Mts. were later affected by another windstorm event in 2014, which destroyed about 50 ha of spruce forest.
The aim of our work was to study how the trophic fungal groups were influenced by bark beetle infestation and identify key species that were most affected by this event. We compared the soil fungal communities from forests attacked by bark beetle to those from forests not attacked and with forests where trees were removed after a windstorm, which represents a commonly used management practice after first signs of bark beetle attack. We expected an overall increase in the proportion of saprotrophic fungi in forest damaged by bark beetle and a decrease in the proportion of ECM fungi accompanied by gradual changes in ECM fungal species composition in favor of stress-tolerant species in a forest attacked by bark beetle. A similar effect on trophic fungal groups proportions was expected in a forest with removed trees, but the increase in saprotrophs was expected to be not so distinctive, because of the lower levels of deadwood consisting mainly of branch piles.

2. Materials and Methods

2.1. Study Area and Sample Collection

The study area was located in the Tatra Mts., Slovakia (Figure 1), in originally unmanaged mature spruce forests with an admixture of larch (Lariceto-Piceetum), currently affected by bark beetle attack. All forest types were of similar age, ranging from 130 to 140 years, with canopy cover before disturbance events reaching from 45 to 60% and spruce proportion from 80 to 90% accompanied by larch. The altitudinal range is 1120–1240 m a.s.l., mean annual temperature 4.0–5.3°C, and mean annual precipitation 833–1000 mm; soil types are cambisols and podzols with predominantly granodiorite or moraine bedrock [20,21].
Four types of forest were selected: i) K1 = forest that was attacked by bark beetle, that had a 10% dead tree crown projection in 2015, and where bark beetle infestation started to spread in 2009; ii) K2 = forest that was destroyed by bark beetle in 2012 and where bark beetle infestation started to spread in 2007; iii) DES = forest with fallen trees removed after a windstorm in 2014; iv) REF = mature forest not attacked by bark beetle. K1 was a gradually decaying forest with still living spruce trees, admixture of larch and natural regeneration of spruce, fir, and rowan; Vaccinium myrtillus L. 1753, Oxalis acetosella L. and mosses prevailed in the understory. Deadwood was scattered throughout the microsites. K2 represented a forest completely destroyed by bark beetle in 2012 with standing or downed dead trees and poor natural regeneration, mainly spruce and rowan seedlings, with a dense herb cover dominated by Calamagrostis villosa (Chaix) J.F. Gmel., Vaccinium myrtillus, and Rubus idaeus L. The deadwood was more widespread around the microsites compared to K1. DES was a forest that was destroyed by a windstorm in 2014, where the fallen trees were removed one year before soil sampling, and where only piles of branches (i.e., logging debris) and a few standing spruce and larch trees remained. The regeneration was poor, dominated by spruce, larch, and rowan, with an understory dominated by Vaccinium myrtillus, Calamagrostis villosa, and Avenella flexuosa (L.) Drejer. The mature forest (REF) consisted of spruce with larch admixture, spruce, and larch regeneration and an understory dominated by Vaccinium myrtillus, Avenella flexuosa, and Calamagrostis villosa. The deadwood was sparse and mostly in the form of branch piles.
Soil samples were collected in September 2015. In each forest type, 10 microsites were selected from an area of 100 × 100 m along with two approximately 140 m long crossed diagonals that bisected the center of the sample area. The distance between microsites (approximately 30 m) was inferred from the observed variability of particular patches in mountain spruce forest. Five soil cores (3.5 cm in diameter, 20 cm depth) were collected per each microsite in a 5 m diameter circle and dominant living trees, herbs, and type of dead wood were recorded. The tree, herb, and dead wood cover was estimated in a 5 m diameter circle using a visual assessment based on crown/herb leaf/dead wood surface projection. The dead wood was categorized into four classes (lying logs, hanging logs, piles of branches, and uprooting) and had a threshold diameter between branch and log of 7 cm. The soil cores were taken from places without piles of debris or litter accumulation. The litter- and mineral soil horizons were then removed, and the material from organic soil horizon was passed through a 5 mm sterile sieve. The fresh soil from organic horizon from five cores per each microsite was then mixed together and stored at –20 °C.

2.2. Soil Analysis

Approximately 30 g of organic soil material were used for soil analysis. C and N concentrations were measured using a Flash 2000 CHN analyzer (Thermo Fisher Scientific, Waltham, MA, USA). The pH (H2O) of the soil suspension was determined by the potentiometric method on an OP-208 pH-meter (Radelkis, Budapest, Hungary) equipped with a combination glass electrode.

2.3. DNA Extraction, Amplification, and Sequencing

Total DNA was extracted from ~300 mg of soil using the NucleoSpin Soil Kit (Machery–Nagel Gmbh & Co., Düren, Germany) in three replicates per microsite. The extracted DNA from three replicates was then pooled and used as a template for ITS2 amplification (gITS7/ITS4 primer combination; [22,23]). The PCR reaction was performed in three replicates in a 25 µL reaction mixture, containing 1× reaction buffer (Bioline, London, UK), 1.5 µl BSA (10mg/ml), 1 µL of each primer (0.01mM), 0.75 µL of a polymerase mix (4U:96U of Pfu DNA polymerase (Fermentas, Waltham, MA, USA) and MyTaq polymerase (Bioline, USA)), and 1 µL of template DNA filled with dH2O up to 25 µL. The amplification conditions were 94 °C for 5 min, followed by 35 cycles of 94 °C for 30 s, 56 °C for 30 s, 72 °C for 30 s, and a final extension of 72 °C for 7 min. Three PCR replicates were pooled and purified using the MiniElute PCR purification Kit (Qiagen, Hilden, Germany). The concentration of purified PCR amplicons was quantified using a QUBIT 2.0 Fluorometer (Life Technologies, Carlsbad, CA, USA). The sequencing of fungal amplicons was performed on a MiSeq (Illumina, San Diego, CA, USA) at the Institute of Microbiology of the CAS, v. v. i.

2.4. Data Processing and Analysis

The sequence data were processed using pipeline SEED 1.2.3 [24]. Chimeras were removed using USEARCH 7.0.1090 [25] and the ITS2 region was extracted using ITS EXTRACTOR 1.0.8 [26]. Sequences were then clustered using UPARSE at a 97% similarity threshold, and consensus sequences were created using MAFFT 7.215 [27]. The consensus sequences were then identified using a reference database for fungal ITS classification based on UNITE [28] release 7.1 2016-11-20 (plus plant and animal sequences from GenBank). To maintain a comparable sample size, 2800 reads per sample were randomly selected. Because the operational taxonomic units (OTUs) represented by a small number of reads were found to be not reproducible [29], only OTUs represented by more than 1% of read counts per sample were included in further analysis. After discarding non-reproducible and non-fungal clusters, 184,840 reads remained, representing 229 OTUs. The assignment of OTUs at the species level was based on the 97% similarity threshold, to the genus level on at least an 85% similarity threshold, for a coverage higher than 70%. The Shannon–Wiener index, species richness, and evenness were calculated using the pipeline SEED. The assignment of fungal species to trophic groups was done according to [30,31,32,33,34,35,36,37,38,39,40,41,42,43]. Sequence data were deposited in the GenBank database (dataset number SRP157877).

2.5. Statistical Analysis

Analysis of variance in program R 3.4.3 [44] was used to test the differences in values of organic soil pH/H2O, carbon concentration (C), nitrogen concentration (N), and the C/N ratio among the four forest types. Similarly, differences in fungal trophic groups (ECM fungi, saprotrophic fungi, parasitic fungi) among the forest types were tested. Logarithmic transformation was used in case of parasitic fungi data.
Variation in the fungal communities of the microsites, based on the number of sequences, was analyzed by multivariate methods in Canoco 5 [45]. We analyzed three datasets: fungal sequence abundances, ECM fungal sequence abundances, and saprotrophic fungal sequence abundances, all logarithmically transformed. A principal component analysis (PCA) was first conducted to determine the total variability in the datasets. Redundancy analyses (RDAs) with forward selection of environmental variables with significant effect (Monte Carlo permutation test, 999 permutations) were then conducted for each dataset. As environmental variables were tested, coverage percentages of the tree layer, dominant tree species (Picea abies (L.) H. Karst., Larix decidua Mill., Sorbus aucuparia L.), dominant species of herb layer, including dwarf shrubs (Calamagrostis villosa, Vaccinium myrtillus, Vaccinium vitis-idaea L., Rubus idaeus, Avenella flexuosa, Epilobium angustifolium L., Oxalis acetosella, Dryopteris sp., Luzula sp., and mosses), litter, and dead wood. The forest type and soil characteristics (pH/H2O, C(%), N(%), and C/N) were also tested. The effect of forest type was also tested in separate analyses. Environmental variables were also analyzed in a PCA standardized by species, which shows how the forests differ in their environmental characteristics.

3. Results

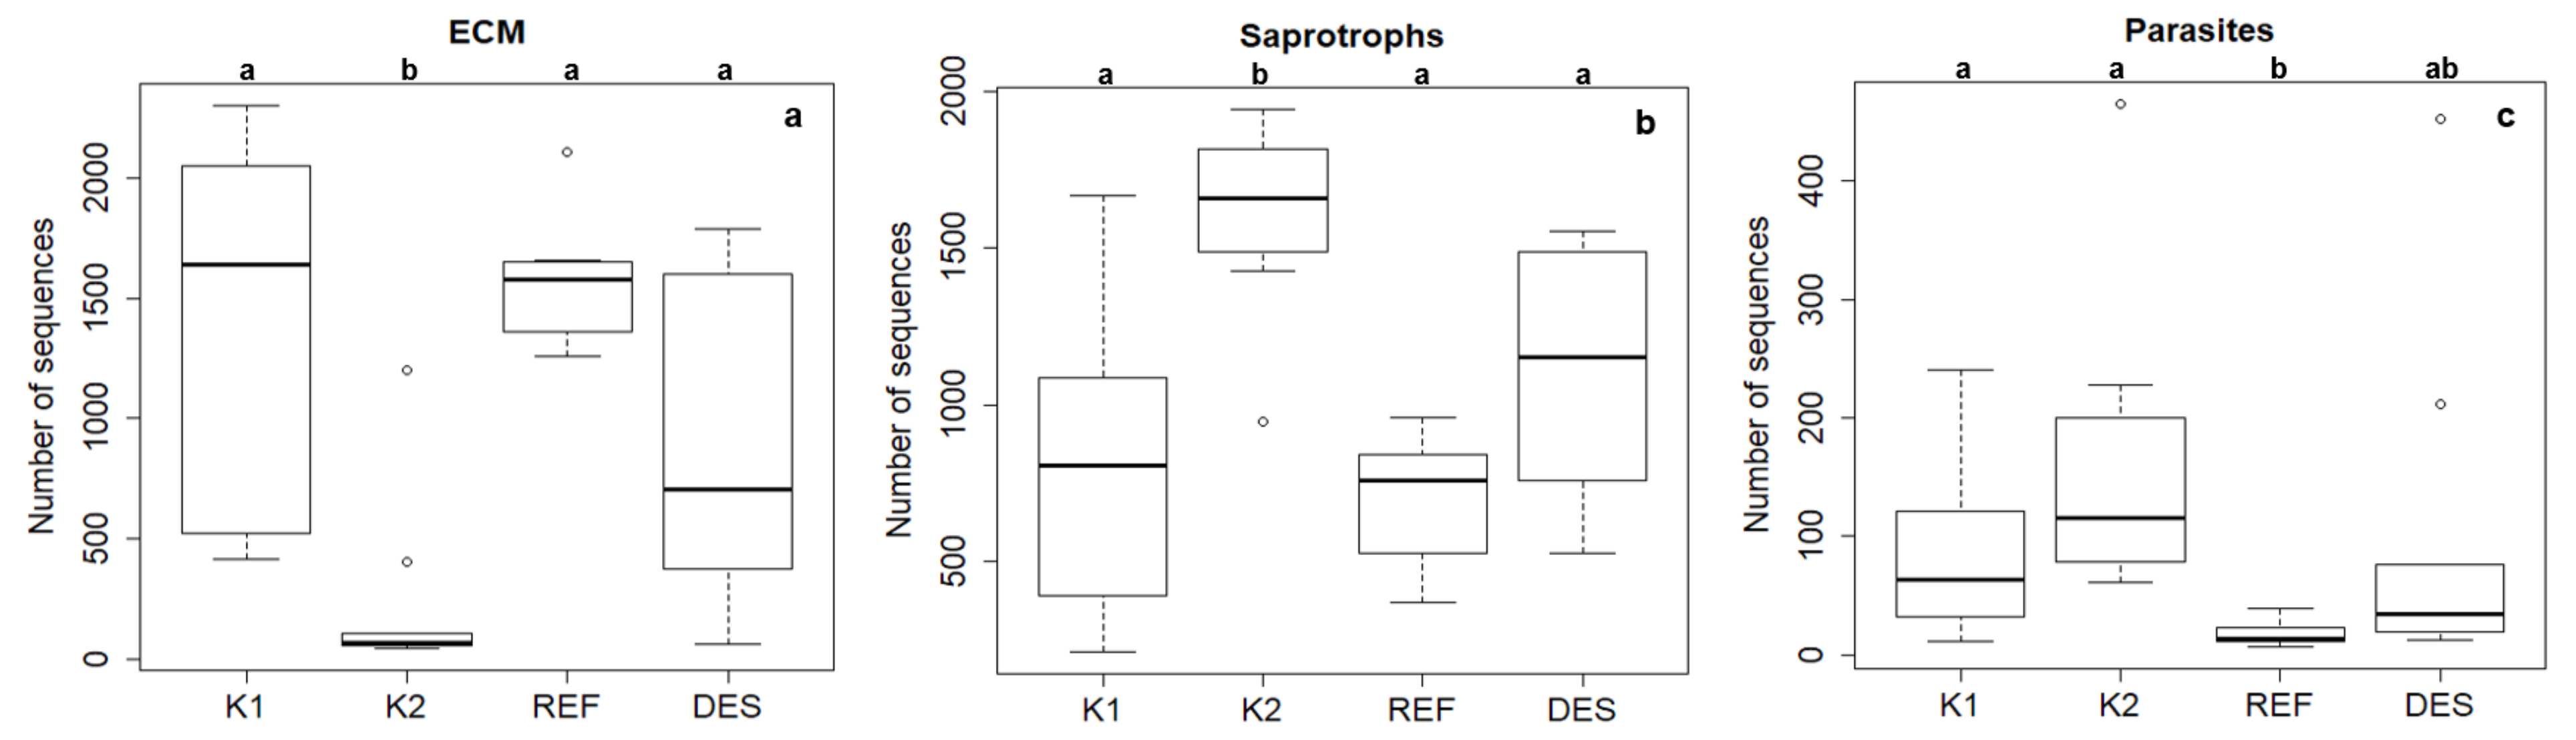
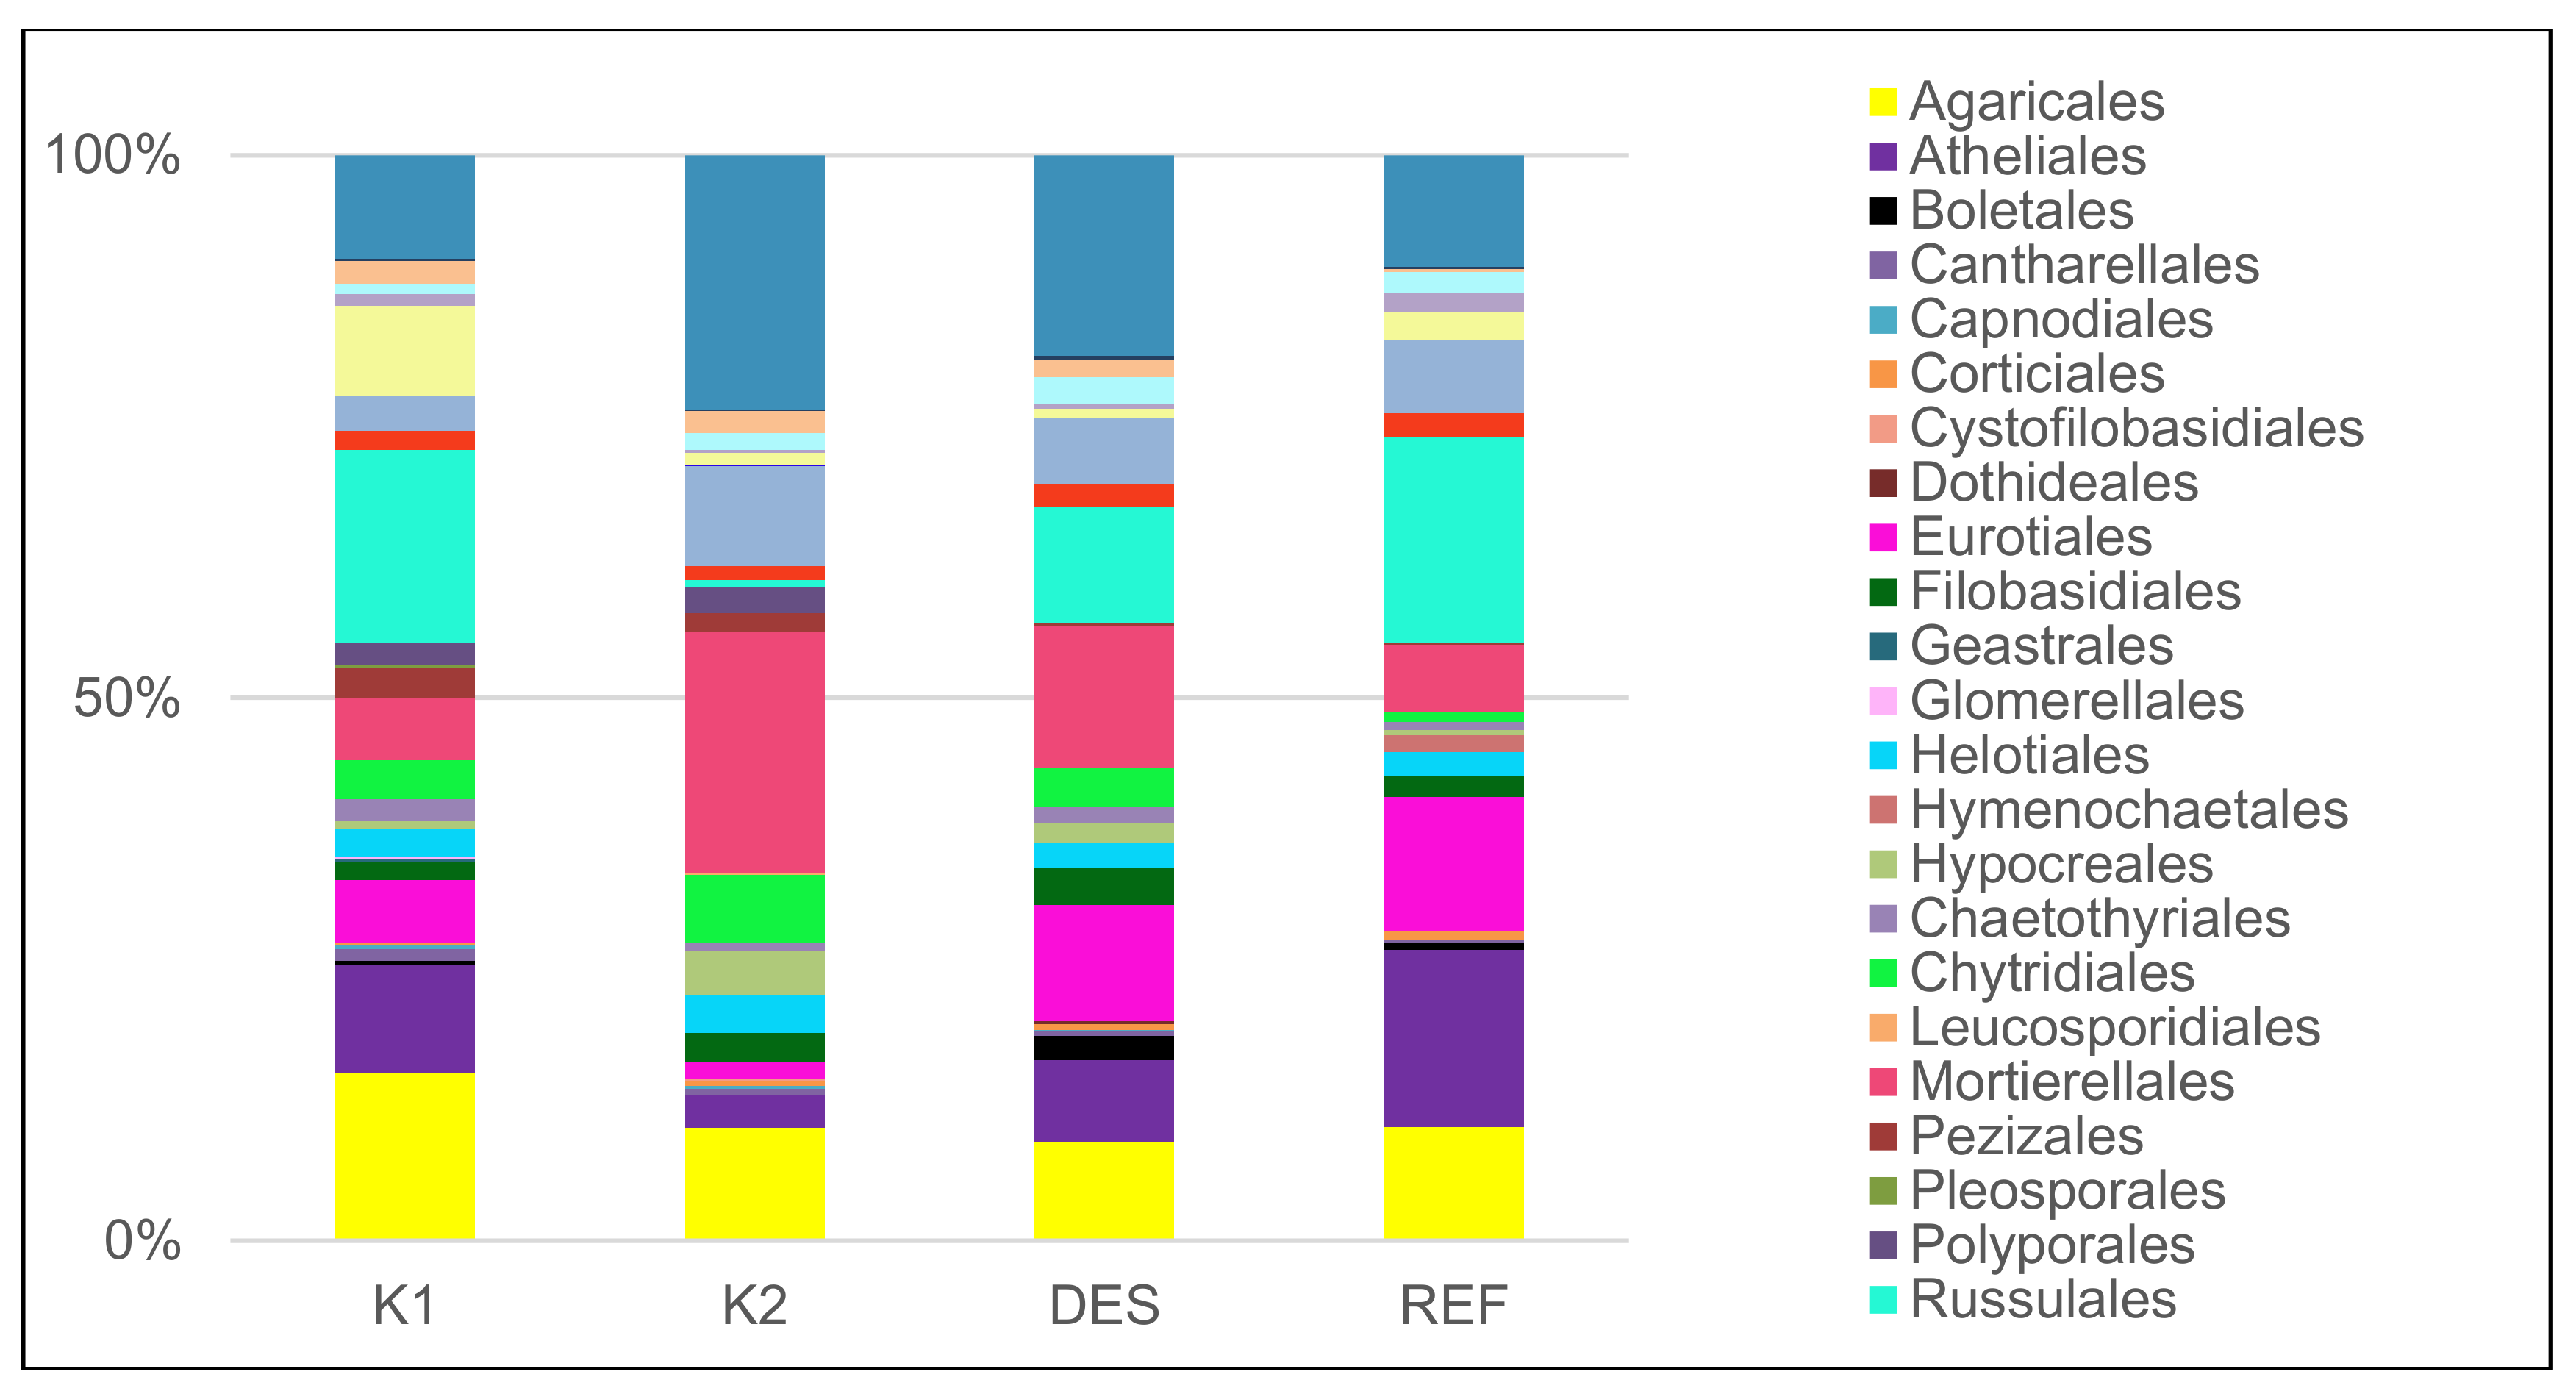
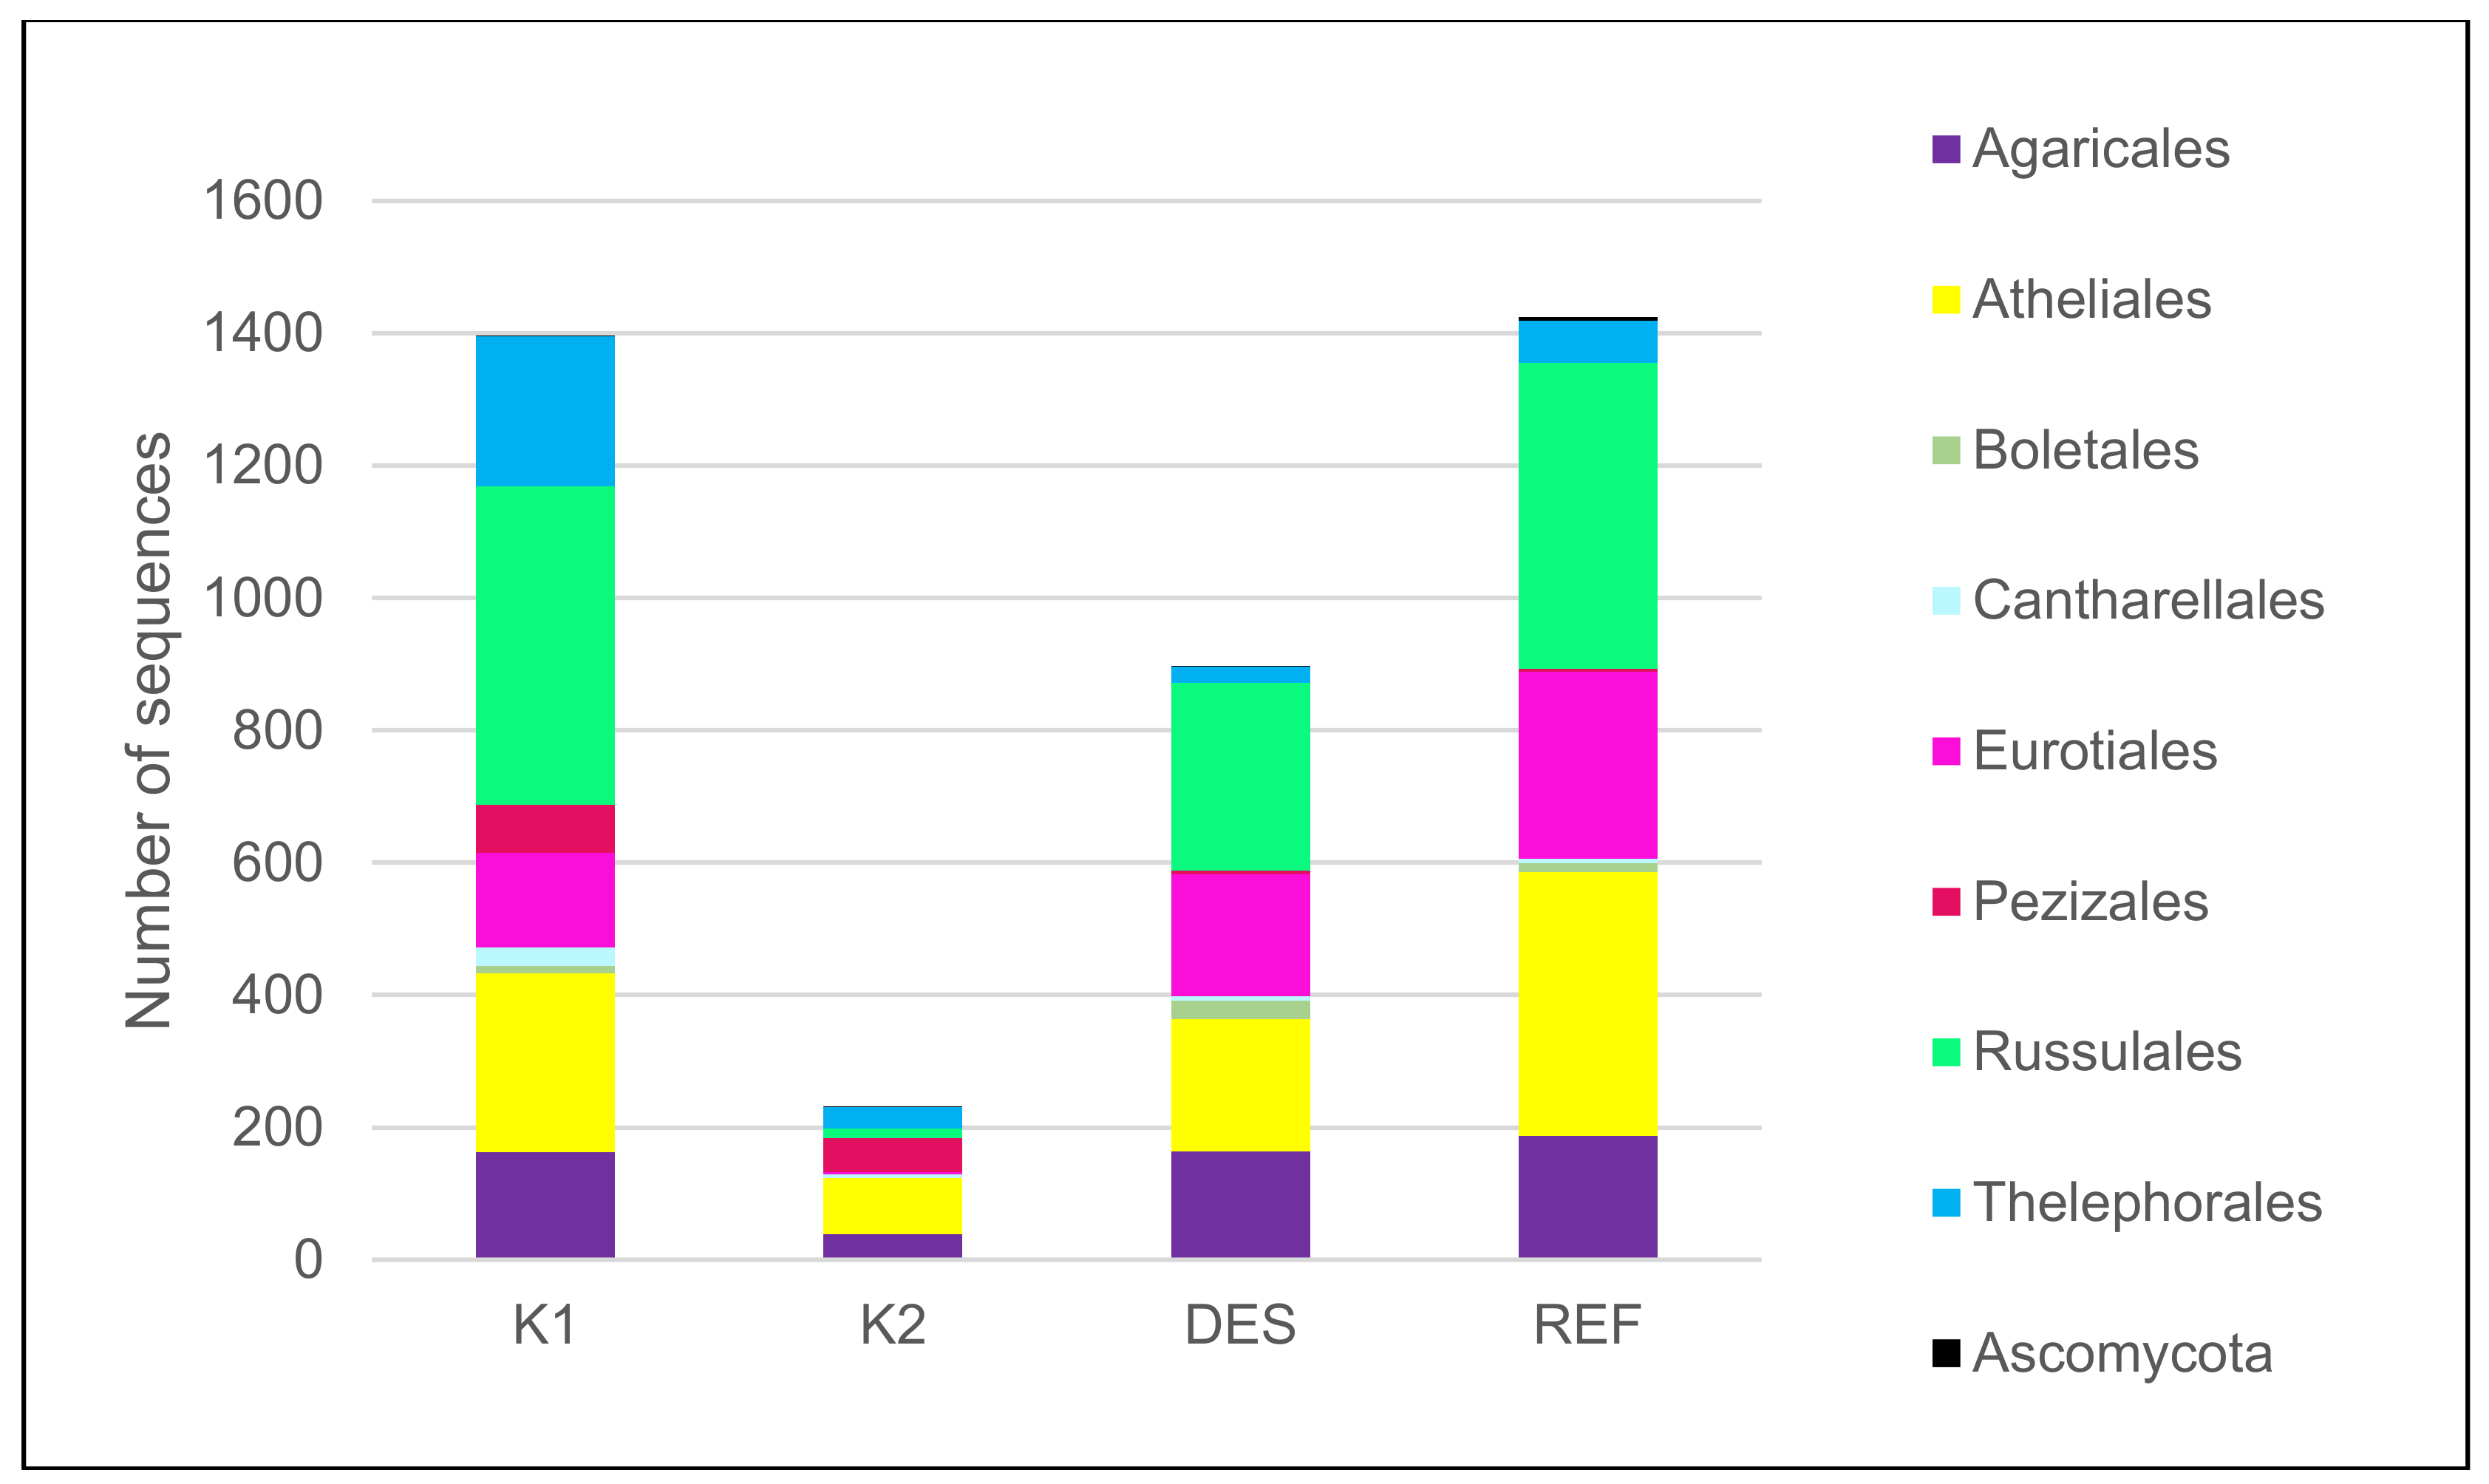
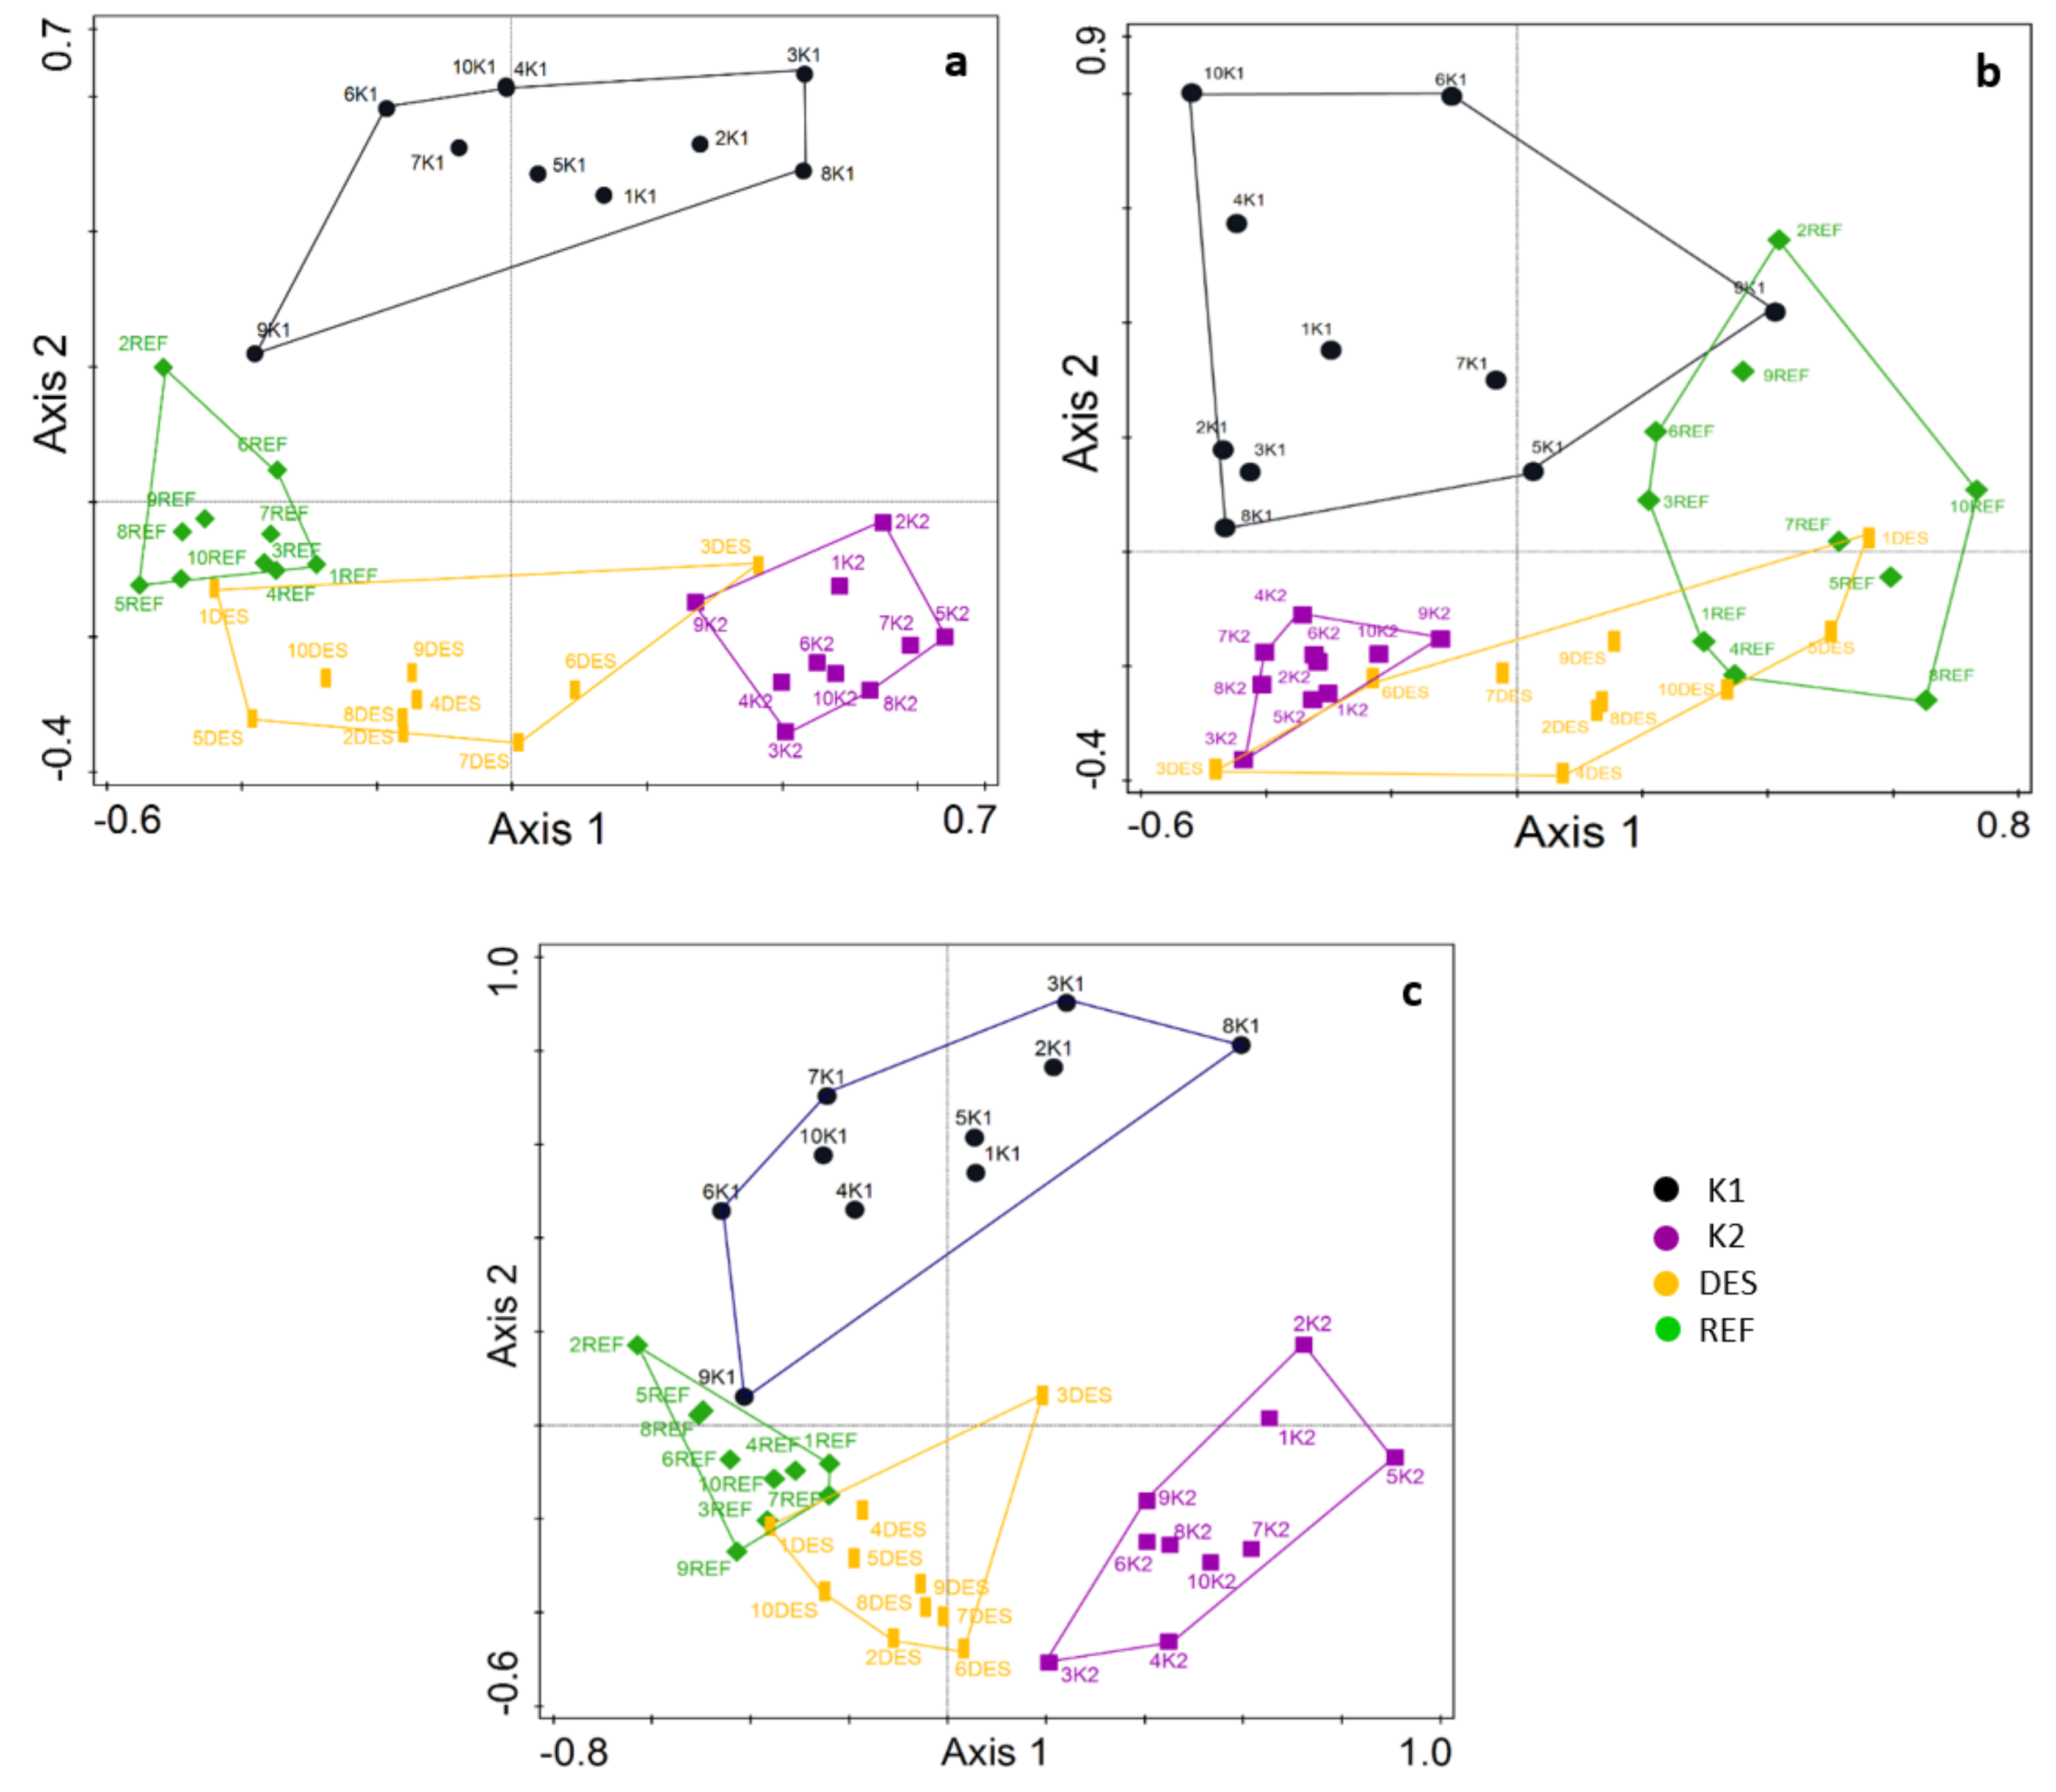
3.1. Fungal Community

In total, we detected 229 OTUs: 92 were mycorrhizal species, 79 were saprotrophic species, 12 were parasitic species, and 3 were endophytic species, and for 43 of them, either they were not identified at the genus level or available information about trophic status was insufficient. The diversity and evenness were similar in all forest types, with a Shannon–Wiener diversity index of ~3.5 and an evenness of ~7.3. Species richness was slightly higher in the K2 site compared to K1, DES, and REF (Table 1).
Mycorrhizal relative sequence abundance inferred from OTU sequences belonging to mycorrhizal species was significantly lower (p < 0.05) in K2 compared to K1, DES, and REF (Table 1, Figure 2a, and Table S1b). A significantly lower number of mycorrhizal sequences was detected also in DES compared to REF (p = 0.05). The opposite trend was found in the case of saprotrophic fungi with a significantly higher (p < 0.01) relative sequence abundance in K2 compared to K1, DES, and REF (Table 1, Figure 2b, and Table S1b). Parasitic fungi were most abundant in K2 but non-significantly, while REF contained a significantly lower (p < 0.05) amount of parasitic fungi sequences compared to the other sites (Table 1, Figure 2c, Table S1b). The total number of OTUs assigned to ECM fungi, as well as saprotrophic and parasitic fungi, is listed in Table 1, including dominant ECM and saprotrophic species.
The differences in fungal communities among forest types (Figure 3) were caused mainly by ECM orders (Figure 4), with Atheliales prevailing in REF (16% of sequences on average), but being substantially reduced in K2 (3%), along with Russulales (K1 18%, K2 1%, DES 11%, REF 19%). In contrast, Mortierellales containing saprotrophic species became more abundant in K2 (22%) and DES (13%), but less abundant in K1 and REF (6%). Eurotiales, including ectomycorrhizal, saprotrophic, and parasitic species, prevailed in DES (11%) and REF (12%) but decreased in K1 (6%) and K2 (2%).
The PCA ordination diagram showed that the forest types were well separated based on fungal species composition (Figure 5a). Axis 1 accounted for 12.9% of the variability and followed the difference between mature forest (REF) and forest destroyed by bark beetle (K2), with DES overlapping both. The bark beetle-attacked forest (K1) was separated on Axis 2 from the other three forest types (10.4% of explained variability). The forest types were well separated according to ECM species composition with tiny overlaps between K1 and REF, DES and REF, and K2 and DES (Figure 5b). Similarly, to fungal composition, Axis 1 largely depicted the difference between K2 and REF, Axis 2 separating out K1. The forest types were also well separated based on saprotrophs, with only a small overlap between REF and DES (Figure 5c), and similar pattern as previous diagram depicting fungal composition. Microsites in mature forest (REF) are more variable in terms of ECM species composition compared to the saprotrophic ones, whereas microsites in forest destroyed by bark beetle (K2) show an opposite trend (Figure 5b,c).

3.2. Vegetation

Tree cover was the highest in K1 and REF forests, being significantly greater than in the more heavily disturbed K2 and DES (Table 2). The understory was dominated by Vaccinium myrtillus in all forest types, accompanied by Oxalis acetosella in K1, Callamagrostis villosa in K2 and DES, and Avenella flexuosa in REF (Table 2). Spruce seedling regeneration was the highest in REF, whereas almost no regeneration was found in the other forest types (Table 2). A high cover of dead wood mass was found in DES in the form of piles of branches and K2 in the form of lying logs. These were present to a lesser extent in K1 and REF, but piles of branches were also present at several REF microsites (Table 2). For detailed information, see Table S1a.

3.3. Soil Properties

The organic soil was strongly acidic in all forest types, with a mean pH of 3.9 ± 0.3 (Figure 6a). Carbon and nitrogen concentrations were the highest (p < 0.05) in K1, whereas the lowest concentrations were in DES (Figure 6b,c). The highest C/N ratio was detected in K1 and DES with means of 25 ± 0.7 SE and 25 ± 0.5 SE, respectively (Figure 6d). The K1 forest had the highest within-microsite variability in all measured soil properties.

3.4. Vegetation and Soil Properties vs. Fungal Communities

Based on the redundancy analysis (RDA) with explanatory environmental variables, forest type explained 18.7% of detected variability within the fungal community composition. Excluding forest type as an explanatory variable, tree cover, the coverage of Vaccinium myrtillus, Oxalis acetosella, and Drypteris sp., the percentages of soil nitrogen and carbon, and latitude (N°) explained 22.2% of the variability among the microsites (Table 3). The ECM community was mainly influenced by forest type, accounting for 13.4% of the explained variation and further by tree cover, cover of Dryopteris sp., and latitude (N°) (Table 3). Saprotrophic species were affected by forest type accounting for 14.0% of the explained variation. Excluding forest type, tree cover, the percentages of soil nitrogen and carbon, pH/H2O, and the presence of Sorbus aucuparia and Calamagrostis villosa explained 11.8% of the variability (Table 3). Correlation of the environmental variables with each forest type is shown in Figure S1. The most important variables are tree cover, carbon and nitrogen concentrations, and cover of Rubus ideaus and Oxalis acetosella.

4. Discussion

Our data confirmed the expected hypothesis that tree dieback will cause changes in proportions of sequences and community composition of soil fungi. These changes were primarily driven by shifts in the occurrence of ECM fungi, because they are directly dependent on carbon provided by their host trees [14].
The decrease in ECM relative sequence abundances was apparent within one year after tree removal (DES), but surprisingly species composition remained comparable with the mature forest (Figure 4). Though it is not possible to determine in absolute terms how the abundance of the ECM species was affected, the fungal community composition in forest with removed trees (DES) was comparable to that in mature forest. This indicates the ability of many ECM species to survive for some time in the absence of living trees. The possibility that we had DNA from dying mycorrhizae or spores is quite low, because dying mycorrhizae would not persist long [46]. Similarly, spores in the soil would have a different composition than the living fungal community, because the detected fungi in the mature forest differ in their investment to fruit bodies and hence expected spore production [47].
The direction of ECM species change is in agreement with our data from stands affected by windstorms [48]. Microsites in the mature forest (REF) and the forest with removed trees (DES) were both dominated by Elaphomyces sp., different Russula species, and Tylospora asterophora, whereas the K2 forest, destroyed by bark beetle, was dominated by Piloderma species, Inocybe soluta, Wilcoxina sp., Thelephora terrestris, and T. asterophora; T. terrestris, Piloderma sp., Tylospora fibrillosa, T. asterophora, and Wilcoxina sp. also dominated in stands 10 years after fire and windstorms [48]. Buscardo et al. [49] and Ford et al. [50] considered T. terrestris and Wilcoxina species to be stress-tolerant, being able to survive disturbances or rapidly re-establish after disturbances [51]. Propagules of T. terrestris and Wilcoxina are also commonly found in spore banks [52]. The ecologies of Piloderma and both Tylospora species are not clear, which could be attributed to taxonomical difficulties and the presence of more strains differentially adapted to local conditions [53]. Tedersoo et al. [54] suggested that they contribute to wood degradation, enabling them to compete with saprotrophs for resources. The ecology of the Russula genus is also uncertain. In our case, it dominates in the healthy mature forest (REF) and forest with removed trees (DES), whereas Štursová et al. (2014) [16] treated it as potentially saprotrophic being able to survive bark beetle outbreak. This difference is most likely caused by different dominant species in forests in the Tatra (R. mustelina, R. puelaris, R. vesca) and Sumava Mts (R. ochroleuca Pers. 1796), which emphasizes the need to take into account species identity in any ecological interpretations. The bark beetle-attacked K1 represented a transitional forest stand with species belonging to both the mature forest (e.g. Russula species, Elaphomyces sp.) and destroyed stand (e.g. T. terrestris), which resulted in a temporal increase in species diversity (Table 1). Relative abundances of ECM fungi in K1 were similar to that of REF forest, supporting the hypothesis that an ECM fungal network may be stable if enough trees remain alive [55,56]. It is not yet clear if leaving such attacked forests for natural development would help maintain a high species pool in the landscape compared to forests being immediately cut after a first sign of bark beetle occurrence. Generally, ECM fungal communities undergo transitions after disturbances, shifting from species with higher demands on resource availability to species more adapted to unfavorable site conditions. ECM fungi compete for resources and, as the resource availability becomes diminished, the weaker competitors are excluded from the stand [57].
In comparison with changes in the ECM communities, the qualitative change in saprotrophic communities was not as straightforward. We expect that this is due to their lower dependence on living trees and smaller body size, enabling them to easily find their optimal niche, even though they were found to be more susceptible to soil abiotic factors compared to ECM fungi (Table 3). Rhodotorula sp. was the dominant genus in all forest types. Together with Cryptococcus sp., which was slightly decreased in K2, it represents stress-tolerant yeast organisms [58]. Cryptococcus sp. has also been found to increase its abundance after bark beetle infestation [16]. Mycena spp. increased in both bark beetle-affected forest types, with M. pura increasing in K1 and M. galopus in K2. Mycena species are free-living filamentous fungi, which compete with yeasts for resources [58]. Their increase after bark beetle infestation could be attributed to higher resource availability represented by dead wood and decaying root systems. Rhizidium phycophyllum decreased only in the mature forest. Even though it is considered to be a saprotroph, it is also described in association with green algae [59]. The reason why it is abundant in destroyed forests is not clear. Due to our focus on soil fungi, we were only able to detect wood-decaying saprotrophs by accident, because it takes decades for attacked trees to fall following a bark beetle outbreak, so the delayed availability of the substrate will contribute to extended delays in changes in saprotrophic composition [18].

5. Conclusions

Bark beetle outbreak significantly influences soil fungal communities. ECM fungal communities in forests affected by bark beetles are dominated by stress-tolerant species and species forming fruit bodies preferentially on wood. It remains unclear how long species of mature forest persist in stands affected by such events. Similarly, there is the question of whether unmanaged forests attacked by bark beetle, harboring both species of mature forest and stress-tolerant species, could contribute to future biodiversity and regeneration as a potential reservoir of ECM propagules. We expect that the weaker differentiation of soil saprotrophs was due to their lower dependence on living trees and smaller body size, making it easier for them to find their optimal niche.

Supplementary Materials

The following are available online at https://www.mdpi.com/1999-4907/10/2/109/s1 Table S1: (1a) Characteristics of microsites (geographic position, cover of trees and seedlings, cover of herbs and shrubs, cover of dead wood, soil properties). (1b) List of fungal OTUs with sequence abundance >1% per forest type. Figure S1: Principal component analysis of environmental variables with forest type used as a passive explanatory variable.

Author Contributions

Conceptualization, Pavel Cudlín and Martina Vašutová; methodology, Pavel Cudlín, Martina Vašutová; investigation, Petra Veselá; formal analysis, Petra Veselá and Magda Edwars-Jonášová; data interpretation, Petra Veselá and Martina Vašutová; data curation, Petra Veselá; writing—original draft preparation, Petra Veselá and Martina Vašutová; writing—review and editing, Pavel Cudlín; funding acquisition, Pavel Cudlín.

Funding

This research was supported by the Ministry of Education, Youth and Sports of CR, within the National Sustainability Program I, grant number LO1415.

Acknowledgments

We thank Lenka Effenberková, Filip Holub, Zdeňka Kovaříková, Ondřej Cudlín, and Jan Purkyt for field and lab assistance.

Conflicts of Interest

The authors declare no conflict of interest.

References

  1. Seidl, R.; Müller, J.; Hothorn, T.; Bässler, C.; Heurich, M.; Kautz, M. Small beetle, large-scale drivers: How regional and landscape factors affect outbreaks of the European spruce bark beetle. J. Appl. Ecol. 2016, 53, 530–540. [Google Scholar] [CrossRef] [PubMed]
  2. Papaik, M.J.; Canham, C.D. Species resistance and community response to wind disturbance regimes in northern temperate forests. J. Ecol. 2006, 94, 1011–1026. [Google Scholar] [CrossRef] [Green Version]
  3. Fischer, A.; Marshall, P.; Camp, A. Disturbances in deciduous forest ecosystems of the northern hemisphere: Their effects on both recent and future forest development. Biodivers. Conserv. 2013, 22, 1863–1893. [Google Scholar] [CrossRef]
  4. Nealis, V.; Peter, B. Risk Assessment of the Threat of Mountain Pine Beetle to Canada’s Boreal and Eastern Pine Forests; Report BC-X-417; Canadian Forest Service, Pacific Forestry Centre: Victoria, BC, Canada, 2008. [Google Scholar]
  5. Hart, S.J.; Veblen, T.T.; Mietkiewicz, N.; Kulakowsky, D. Negative feedback on bark beetle outbreaks: Widespread and severe spruce beetle infestation restricts subsequent infestation. PLoS ONE 2015, 10, e0127975. [Google Scholar] [CrossRef] [PubMed]
  6. Raffa, K.F.; Aukema, B.H.; Bentz, B.J.; Carroll, A.L.; Hicke, J.A.; Turner, M.G.; Romme, W.H. Cross-scale drivers of natural disturbances prone to anthropogenic amplification: The dynamics of bark beetle eruptions. BioScience 2008, 58, 501–517. [Google Scholar] [CrossRef]
  7. Weed, A.S.; Ayres, M.P.; Hicke, J.A. Consequences of climate change for biotic disturbances in North American forests. Ecol. Monogr. 2013, 83, 441–470. [Google Scholar] [CrossRef]
  8. Hlásny, T.; Turčáni, M. Persisting bark beetle outbreak indicates the unsustainability of secondary Norway spruce forets: Case study from Central Europe. Ann. For. Sci. 2013, 70, 481–491. [Google Scholar] [CrossRef]
  9. Ayres, M.P.; Lombardero, M.J. Assessing the consequences of global change for forest disturbance from herbivores and pathogens. Sci. Total Environ. 2000, 262, 263–286. [Google Scholar] [CrossRef]
  10. Rinnan, R.; Bååth, E. Differential utilization of carbon substrates by bacteria and fungi in tundra soil. Appl. Environ. Microbiol. 2009, 75, 3611–3620. [Google Scholar] [CrossRef]
  11. Iordache, V.; Gherghel, F.; Kothe, E. Assessing the effect of disturbances on ectomycorrhiza diversity. Int. J. Environ. Res. Public Health 2009, 6, 411–432. [Google Scholar] [CrossRef]
  12. Dahlberg, A. Community ecology of ectomycorrhizal fungi: An advancing interdisciplinary field. New Phytol. 2001, 150, 555–562. [Google Scholar] [CrossRef]
  13. Haselwandter, K.; Bowen, G.D. Mycorrhizal relation in trees for agroforestry and land rehabilitation. For. Ecol. Manag. 1996, 81, 1–17. [Google Scholar] [CrossRef]
  14. Gehring, C.; Bennett, A. Mycorrhizal-fungal-plant-insect interactions: The importance of a community approach. Environ. Entomol. 2009, 38, 93–102. [Google Scholar] [CrossRef] [PubMed]
  15. Saravesi, K.; Markkola, A.; Rautio, P.; Roitto, M.; Tuomi, J. Defoliation causes parallel temporal responses in a host tree and its fungal symbionts. Oecologia 2008, 156, 117–123. [Google Scholar] [CrossRef] [PubMed]
  16. Štursová, M.; Šnajdr, J.; Cajthaml, T.; Bárta, J.; Šantrůčková, H.; Baldrian, P. When the forest dies: The response of forest soil fungi to a bark beetle-induced tree dieback. ISME J. 2014, 8, 1920. [Google Scholar] [CrossRef] [PubMed]
  17. Treu, R.; Karst, J.; Randall, M.; Pec, G.J.; Cigan, P.W.; Simard, S.W.; Cooke, J.E.; Erbilgin, N.; Cahill, J.F., Jr. Decline of ectomycorrhizal fungi following a mountain pine beetle epidemic. Ecology 2014, 95, 1096–1103. [Google Scholar] [CrossRef]
  18. Pec, G.J.; Karst, J.; Taylor, D.L.; Cigan, P.W.; Erbilgin, N.; Cooke, J.E.; Simard, S.W.; Cahill, J.F. Change in soil fungal community structure driven by a decline in ectomycorrhizal fungi following a mountain pine beetle (Dendroctonus ponderosae) outbreak. New Phytol. 2017, 213, 864–873. [Google Scholar] [CrossRef]
  19. Fleischer, P.; Homolová, Z. Long-term research on ecological condition in the larch-spruce forests in High Tatras after natural disturbance. For. J. 2011, 57, 237–250. [Google Scholar]
  20. Šebeň, V.; Konopka, B.; Bošela, M.; Pajtík, J. Contrasting development of declining and living larch-spruce stands after a disturbance event: A case study from the High Tatra Mts. For. J. 2015, 61, 157–166. [Google Scholar] [CrossRef]
  21. Fleischer, P. Windfall research and monitoring in the High Tatra Mts, objectives, principles, methods and current status. Contrib. Geophys. Geod. 2008, 38, 233–248. [Google Scholar]
  22. Ihrmark, K.; Bödeker, I.; Cruz-Martinez, K.; Friberg, H.; Kubartova, A.; Schenck, J.; Strid, Y.; Stenlid, J.; Brandström-Durling, M.; Clemmensen, K.E.; et al. New primers to amplify the fungal ITS2 region—Evaluation by 454-sequencing of artificial and natural communities. FEMS Microbiol. Ecol. 2012, 82, 666–677. [Google Scholar] [CrossRef]
  23. White, T.J.; Bruns, T.; Lee, S.; Taylor, J. Amplification and direct sequencing of fungal ribosomal RNA genes for phylogenetics. PCR—Protocols and Applications—A Laboratory Manual. In PCR Protocols: A Guide to Methods and Applications; Innis, M.A., Gelfand, D.H., Sninsky, J.J., White, T.J., Eds.; Academic Press: New York, NY, USA, 1990; pp. 315–322. [Google Scholar]
  24. Větrovský, T.; Baldrian, P. Analysis of soil fungal communities by amplicon pyrosequencing: Current approaches to data analysis and the introduction of the pipeline SEED. Biol. Fertil. Soils 2013, 49, 1027–1037. [Google Scholar] [CrossRef]
  25. Edgar, R.C. UPARSE: Highly accurate OTU sequences from microbial amplicon reads. Nat. Methods 2013, 10, 996. [Google Scholar] [CrossRef] [PubMed]
  26. Bengtsson-Palme, J.; Ryberg, M.; Hartmann, M.; Branco, S.; Wang, Z.; Godhe, A.; De Wit, P.; Sánchez-García, M.; Ebersberger, I.; de Sousa, F.; et al. ITSx: Improved software detection and extraction of ITS1 and ITS2 from ribosomal ITS sequences of fungi and other eukaryotes for use in environmental sequencing. Methods Ecol. Evol. 2013, 4, 914–919. [Google Scholar]
  27. Katoh, K.; Asimenos, G.; Toh, H. Multiple alignment of DNA sequences with MAFFT. Methods Mol. Biol. 2009. [Google Scholar] [CrossRef]
  28. Kõljalg, U.; Larsson, K.H.; Abarenkov, K.; Nilsson, R.H.; Alexander, I.J.; Eberhardt, U.; Erland, S.; Høiland, K.; Kjøller, R.; Larsson, E.; et al. UNITE: A database providing web-based methods for the molecular identification of ectomycorrhizal fungi. New Phytol. 2005, 166, 1063–1068. [Google Scholar] [CrossRef] [PubMed]
  29. Lundberg, D.S.; Lebeis, S.L.; Paredes, S.H.; Yourstone, S.; Gehring, J.; Malfatti, S.; Tremblay, J.; Engelbrektson, A.; Kunin, V.; Del Rio, T.G.; et al. Defining the core Arabidopsis thaliana root microbiome. Nature 2012, 488, 86–90. [Google Scholar] [CrossRef] [Green Version]
  30. Boberg, J.B.; Finlay, R.D.; Stenlid, J.; Ekblad, A.; Lindahl, B.D. Nitrogen and carbon reallocation in fungal mycelia during decomposition of boreal forest litter. PLoS ONE 2014, 9, e92897. [Google Scholar] [CrossRef]
  31. Carlucci, A.; Raimondo, M.L.; Phillips, A.J.L. Plectosphaerella species associated with root and collar rots of horticultural crops in southern Italy. Personia 2012, 28, 34–48. [Google Scholar] [CrossRef]
  32. Douhan, G.W.; Rizzo, D.M. Host-parasite relationships among bolete infecting Hypomyces species. Mycol. Res. 2003, 107, 1342–1349. [Google Scholar] [CrossRef]
  33. Garnier-Delcourt, M.; Marson, G.; Reckinger, C.; Schultheis, B.; Tholl, M. Notes mycologiques luxembourgeoises. VII Bulletin de la Société des Naturalistes Luxembourgeois 2013, 114, 35–54. [Google Scholar]
  34. Kauserud, H.; Schalchian-Tabrizi, K.; Decock, C. Multilocus sequencing reveald multiple geographically structured lineages of Coniophora arida and C. olivacea (Boletales) in North America. Mycologia 2007, 99, 705–713. [Google Scholar] [CrossRef] [PubMed]
  35. Knudsen, H.; Vesterholt, J. Funga Nordica: Agaricoid, Boletoid and Cyphelloid Genera, 1st ed.; Nordsvamp: Copenhagen, Denmark, 2008. [Google Scholar]
  36. Kohout, P.; Těšilová, T.; Roy, M.; Vohník, M.; Jerásková, J. A diverse fungal community associated with Pseudorchis albida (Orchidaceae) roots. Fungal Ecol. 2013, 6, 50–64. [Google Scholar] [CrossRef]
  37. Kohout, P.; Charvátová, M.; Štursová, M.; Mašínová, T.; Tomšovský, M.; Baldrian, P. Clearcutting alters decomposition processes and initiates complex restructuring of fungal communities in soil and tree roots. ISME J. 2018, 12, 692–703. [Google Scholar] [CrossRef] [PubMed]
  38. Langer, G.; Langer, E.; Oberwinkler, F.; Chen, J. Speciation of Botryobasidium subcoronatum (Basidiomycota) collected in Taiwan: Morphology, mating tests, and molecular data. Mycoscience 2000, 41, 201–210. [Google Scholar] [CrossRef]
  39. Picard, K.T.; Letcher, P.M.; Powell, M.J. Evidence for a facultative mutualist nutritional relationship between the green coccoid alga Bracteacoccus sp. (Chlorophyceae) and the zoosporic fungus Rhizidium phycophilum (Chytridiomycota). Fungal Biol. 2013, 117, 319–328. [Google Scholar] [CrossRef] [PubMed]
  40. Piel, J.; Atzorn, R.; Gäbler, R.; Kühnemann, F.; Boland, W. Cellulysin from the plant parasitic fungus Trichoderma viride elicits volatile byosynthesis in higher plants via the octadecanoid signalling cascade. FEBS Lett. 1997, 416, 143–148. [Google Scholar] [CrossRef]
  41. Redhead, S.A. A biogeographic overview of the Canadian mushroom flora. Can. J. Bot. 1989, 67, 3003–3062. [Google Scholar] [CrossRef]
  42. Tedersoo, L.; Smith, M.E. Lineages of ectomycorrhizal fungi revisited: Foraging strategies and novel lineages revealed by sequences from belowground. Fungal Biol. Rev. 2013, 27, 83–99. [Google Scholar] [CrossRef] [Green Version]
  43. Wachwska, U.; Borowska, J. Antagonistic yeasts competes for iron with winter wheat stem base pathogens. Gesunde Pflanzen 2014, 66, 141–148. [Google Scholar] [CrossRef]
  44. R Development Core Team. R: A Language and Environment for Statistical Computing; The R Foundation for Statistical Computing: Vienna, Austria, 2011; Available online: http://www.R-project.org/ (accessed on 11 February 2018)ISBN 3-900051-07-0.
  45. Ter Braak, C.J.F.; Šmilauer, P. Canoco Reference Manual and User’s Guide: Software for Ordination, version 5.0; Microcomputer Power: Ithaca, NY, USA, 2012. [Google Scholar]
  46. Brunner, I.; Bakker, M.R.; Björk, R.G.; Hirano, Y.; Lukac, M.; Aranda, X.; Børja, I.; Eldhuset, T.D.; Helmisaari, H.S.; Jourdan, C.; et al. Fine-root turnover rates of European forests revisited: An analysis of data from sequential coring and ingrowth cores. Plant Soil 2013, 362, 357–372. [Google Scholar] [CrossRef]
  47. Horton, T.R.; Bruns, T.D. The molecular revolution in ectomycorrhizal ecology: Peeking into the black-box. Mol. Ecol. 2001, 10, 1855–1871. [Google Scholar] [CrossRef] [PubMed]
  48. Vašutová, M.; Edwars-Jonášová, M.; Veselá, P.; Effenberková, L.; Fleischer, P.; Cudlín, P. Management regime is the most important factor influencing ectomycorrhizal species community in Norway spruce forests after windthrow. Mycorrhiza 2018, 28, 221–233. [Google Scholar] [CrossRef] [PubMed]
  49. Buscardo, E.; Rodríguez-Echeverría, S.; Freitas, H.; De Angelis, P.; Pereira, J.S.; Muller, L.A. Contrasting soil fungal communities in Mediterranean pine forests subjected to different wildfire frequencies. Fungal Divers. 2015, 70, 85–99. [Google Scholar] [CrossRef]
  50. Ford, S.A.; Kleinman, J.S.; Hart, J.L. Effects of wind disturbance and salvage harvesting on macrofungal communities in a Pinus Woodland. For. Ecol. Manag. 2018, 407, 31–46. [Google Scholar] [CrossRef]
  51. Smith, J.E.; McKay, D.; Brenner, G.; McIvers, J.; Spatafora, J.W. Early impacts of forest restoration treatments on the ectomycorrhizal fungal community and fine root biomass in a mixed conifer forest. J. Appl. Ecol. 2005, 42, 526–535. [Google Scholar] [CrossRef]
  52. Glassman, S.I.; Peay, K.G.; Talbot, J.M.; Smith, D.P.; Chung, J.A.; Taylor, J.W.; Vilgalys, R.; Bruns, T.D. A continental view of pine-associated ectomycorrhizal fungal spore banks: A quiescent functional guild with a strong biogeographic pattern. New Phytol. 2015, 205, 1619–1631. [Google Scholar] [CrossRef]
  53. Vašutová, M.; Edwards-Jonášová, M.; Baldrian, P.; Čermák, M.; Cudlín, P. Distinct environmental variables drive the community composition of mycorrhizal and saprotrophic fungi at the alpine treeline ecotone. Fungal Ecol. 2017, 27, 116–124. [Google Scholar] [CrossRef]
  54. Tedersoo, L.; Kõljalg, U.; Hallenberg, N.; Larsson, K.H. Fine scale distribution of ectomycorrhizal fungi and roots across substrate layers including coarse woody debris in a mixed forest. New Phytol. 2003, 159, 153–165. [Google Scholar] [CrossRef] [Green Version]
  55. Castaño, C.; Alday, J.G.; Lindahl, B.D.; de Aragón, J.M.; de-Miguel, S.; Colinas, C.; Parladé, J.; Pera, J.; Bonet, J.A. Lack of thinning effects over inter-annual changes in soil fungal community and diversity in a Mediterranean pine forest. For. Ecol. Manag. 2018, 424, 420–427. [Google Scholar] [CrossRef]
  56. Rosenvald, R.; Lõhmus, A. For what, when, and where is green-tree retention better than clear-cutting? A review of the biodiversity aspects. For. Ecol. Manag. 2008, 255, 1–15. [Google Scholar] [CrossRef]
  57. Sun, H.; Santalahti, M.; Pumpanen, J.; Köster, K.; Berninger, F.; Raffaello, T.; Jumpponen, A.; Asiegbu, F.O.; Heinonsalo, J. Fungal community shifts in structure and function across a boreal forest fire chronosequence. Appl. Environ. Microbiol. 2015, 81, 7869–7880. [Google Scholar] [CrossRef] [PubMed]
  58. Treseder, K.K.; Lennon, J.T. Fungal traits that drive ecosystem dynamics on land. Microbiol. Mol. Biol. Rev. 2015, 79, 243–262. [Google Scholar] [CrossRef] [PubMed]
  59. Picard, K.T.; Letcher, P.M.; Powell, M.J. Rhizidium phycophilum, a new species in Chytridiales. Mycologia 2009, 101, 696–706. [Google Scholar] [CrossRef] [PubMed]
Figure 1. Map of research area; Tatra Mountains National Park, Slovakia (TANAP). Four types of forest: K1 = attacked by bark beetle; K2 = destroyed by bark beetle; DES = with removed trees; REF = mature.
Forests 10 00109 g001
Figure 2. Differences in fungal trophic group abundance based on the number of sequences: (a) ECM fungi, (b) saprotrophic fungi, and (c) parasitic fungi detected in forest that is attacked by bark beetle (K1), destroyed by bark beetle (K2), with removed trees (DES), and mature (REF). The diagrams represent median, quartiles, and range (1.5 * IQR) from 10 microsites.
Forests 10 00109 g002
Figure 3. Average relative abundance of sequences assigned to fungal orders from 10 microsites per forest that is attacked by bark beetle (K1), destroyed by bark beetle (K2), with removed trees (DES), and mature (REF).
Forests 10 00109 g003
Figure 4. ECM fungal taxonomic composition assigned to ECM orders as noted by average absolute sequence abundance from 10 microsites per forest that is attacked by bark beetle (K1), destroyed by bark beetle (K2), with removed trees (DES), and mature (REF).
Forests 10 00109 g004
Figure 5. Principal component analysis (PCA) summarizing variation in the fungal community based on the number of sequences from 10 microsites per forest that is attacked by bark beetle (K1), destroyed by bark beetle (K2), with removed trees (DES), and mature (REF): (a) fungal sequence abundances; (b) ECM fungal sequence abundances; c) saprotroph sequence abundances.
Forests 10 00109 g005
Figure 6. Soil (a) pH/H2O, (b) carbon concentration (C%), (c) nitrogen concentration (N%), (d) C/N ratio detected in forest that is attacked by bark beetle (K1), destroyed by bark beetle (K2), with removed trees (DES), and mature (REF). The diagrams represent median, quartiles, and range (1.5 * IQR) from 10 microsites.
Forests 10 00109 g006
Table 1. Species richness, the relative sequence proportion, the number of species and dominating ECM, and saprotrophic species in the forest. K1 = attacked by bark beetle; K2 = destroyed by bark beetle; DES = with removed trees; REF = mature and not attacked by bark beetle.
K1K2DESREF
average species richness123 ± 4.3 135 ± 3.8 115 ± 2.4 119 ± 2.7
mycorrhizal sequences proportion*62 ± 815 ± 545 ± 970 ± 3
saprotrophic sequence proportion*34 ± 677 ± 4 50 ± 6 29 ± 2
parasitic sequence proportion*4 ± 18 ± 2 4 ± 21 ± 0.1
total number of mycorrhizal species52162746
total number of saprotrophic species52524744
total number of parasitic species51073
dominant ECM species* (5 dominant species)Russula decolorans (Fr.) Fr. 1838 (14.3), Pseudotomentella mucidula (P. Karst.) Svrček (8.1), Elaphomyces sp. (7.4), R. puellaris Fr. (6.2), Thelephora terrestris Ehrh. (5.4) Piloderma olivaceum (Parmasto) Hjortstam (23.6), Inocybe soluta Velen. (12.6), Wilcoxina sp. (11.9), T. terrestris (8.2), Tylospora asterophora (Bonord.) Donk (5.8)Elaphomyces sp. (20), R. vesca Fr. 1836 (17.3), R. mustelina Fr. 1838 (9.8), T. asterophora (9.7), Inocybe umbrina Bres. (7.9)Elaphomyces sp. (16.3), R. puellaris (13.8), T. asterophora (7.3) and R. vesca (6.9), Amanita fulva Pers. 1818 (3.7)
dominant saprotrophic species* (5 dominant species)Rhodotorula sp. (10.5), Mycena pura (Pers.) P. Kumm. 1871 (9), Rhizidium phycophilum K.T. Picard (8.8), Physisporinus sanguinolentus (Alb. & Schwein.) Donk 1966 (6.2), Cryptococcus terricola T.A. Pedersen (5.5)Rhodotorula sp. (15.1), Mortierella macrocystis W. Gams (8.8), M. humilis Linnem. (7.5), R. phycophilum (6.5), Mycena galopus (Pers.) P. Kumm. 1871 (5.0)Rhodotorula sp. (14.5), M. humilis (9.1), C. terricola (8.2), M. macrocystis (6.9), R. phycophilum (6.6)Rhodotorula sp. (24.8), Cryptococcus sp. (7.1), M. humilis (6.9), C. terricola (6.8), M. macrocystis (4.5)
*average relative sequence proportion in % and standard error from 10 microsites per forest type.
Table 2. Mean cover of trees, dominant herbs, spruce regeneration, and dead wood mass in forests: K1 = attacked by bark beetle, K2 = destroyed by bark beetle, DES = with removed trees; REF = mature.
K1K2DESREF
tree cover *43 ± 10.905 ± 343 ± 9.2
cover of dominant herbs (more than 10%)*Vaccinium myrtillus (36 ± 11), Oxalis acetosella (25 ± 7.4), Dryopteris sp. (17 ± 8.7)Callamagrostis villosa (31 ± 9.6), Vaccinium myrtillus (24 ± 6.2), Rubus idaeus (23 ± 5.3) Vaccinium myrtillus (32 ± 5.9), Callamagrostis villosa (18 ± 5.8), Avenella flexuosa (17 ± 4.9) Vaccinium myrtillus (39 ± 11), Avenella flexuosa (14 ± 6.2), Calamagrostis villosa (13 ± 5.4)
spruce seedling cover*1.4 ± 0.61.2 ± 0.53 ± 110 ± 8
dead wood cover*lying logs (4.4 ± 2.9)lying logs (15 ± 4.4)piles of branches (22 ± 5.9)piles of branches (14.5 ± 7.9), lying logs (3.2 ± 3)
*average cover in % and standard error from 10 microsites per forest type.
Table 3. Variation in the fungal community based on the number of sequences using RDA; environmental variables used as explanatory variables: a) forest type as an explanatory variable, b) environmental variables excluding forest type, and c) all environmental variables (N%, nitrogen content; C%, carbon content; N°, north latitude) in forests: K1 = attacked by bark beetle; K2 = destroyed by bark beetle; DES = with removed trees; REF = mature.
Explanatory VariablesExplained Variation Adjusted (%)Pseudo-Fp
Dataset all
a) forest type18.74.00.001
b) tree cover, Vaccinium myrtillus, Oxalis acetosella, Dryopteris sp., N%, C%, N°22.22.60.001
ECM dataset
a) forest type13.43.00.001
c) tree cover, Dryopteris sp., N°15.33.30.001
Saprotroph dataset
a) forest type23.35.00.001
b) tree cover, Sorbus aucuparia, Calamagrostis villosa, N%, C%, pH/H2O23.53.00.001

