Article

A Slash-And-Mulch Improved-Fallow Agroforestry System: Growth and Nutrient Budgets over Two Rotations

by
Aaron H. Joslin
1,*,
Steel S. Vasconcelos
2,
Francisco de Assis Oliviera
3,
Osvaldo R. Kato
2,
Lawrence Morris
1 and
Daniel Markewitz
1
1
Warnell School of Forestry and Natural Resources, The University of Georgia, Athens, GA 30602, USA
2
Embrapa Amazônia Oriental, PA 66095-903 Belém, Brazil
3
University of Agricultural Sciences of Amazonia (UFRA), Institute of Agricultural Sciences (ICA), PA 66095-903 Belém, Brazil
*
Author to whom correspondence should be addressed.
Forests 2019, 10(12), 1125; https://doi.org/10.3390/f10121125
Submission received: 9 October 2019 / Revised: 5 November 2019 / Accepted: 11 November 2019 / Published: 10 December 2019

Abstract

:
Agroforestry systems are important, globally affecting 1.2 billion people and covering 0.6 billion hectares. They are often cited for providing ecosystem services, such as augmenting soil fertility via N accumulation and increasing soil C stocks. Improved-fallow slash-and-mulch systems have the potential to do both, while reducing nutrient losses associated with burning. In the absence of burning, these systems also have the potential to grow trees through multiple rotations. This project collected soil, mulch, and biomass data over the course of one 9-year crop-fallow rotation and the first two years of the second rotation. A split-plot design was used to assess the effects of P + K fertilization and inclusion of an N-fixing tree species, Inga edulis, on crop and tree biomass production. Fertilization increased growth and nutrient accumulation during Rotation 1 by an average of 36%, ranging from 11% in Parkia multijuga to 52% in Ceiba pentandra. Residual P + K fertilization improved tree and crop growth 20 months into Rotation 2 by an average of 50%, ranging from 15% in Cedrela odorata to 73% in Schizolobium amazonicum. The improved-fallow slash-and-mulch system increased the rates of secondary succession biomass accumulation (11−15 Mg ha−1 yr−1) by 41–64% compared to natural succession (7–8 Mg ha−1 yr−1). Furthermore, P + K fertilization increased secondary-succession biomass accumulation by 9–24%. Nutrient accumulation through biomass production was adequate to replace nutrients exported via crop root and timber stem harvests.

1. Introduction

Agroforestry systems (AFS), agricultural land with >20% tree cover, account for 0.6 billion hectares and support approximately 1.2 billion people often with limited landholdings that depend on some form of these practices for their livelihoods [1,2]. AFS are commonly employed in Brazilian Amazonia by smallholding farmers (<100 ha) and could comprise up to 35% of land under cultivation in that region [3]. Slash-and-burn land preparation is a common way used by smallholding farmers to prepare land for cultivation, in which the standing vegetation is cut, left to dry, and then burned. Burning vegetation creates an initial pulse of available nutrients for crop production via ash, but leaching, erosion, and crop export lead to declining fertility resulting in crop field abandonment [4].
Slash-and-burn agricultural production is dependent on the length of time fallow vegetation can accumulate nutrients before being cleared and burned again for cropping, since nutrient accumulation in the fallow vegetation is the primary source of crop nutrients [5]. For example, N (~500 kg ha−1) and P (~30 kg ha−1) accumulation were five- and three-fold greater in 8-year-old compared to 3-year-old regenerating secondary forest [6]. Improved fallow (i.e., the planting of desired species) is one method used to enhance vegetative growth in secondary succession. Although much of the research into use of improved fallows in AFS has looked at cover crops and herbaceous plants [7], the use of tree species is also possible and in various tropical locations has increased nutrient accumulation [8,9,10].
Pioneer tree species (e.g., Cecropia spp.) that first establish on sites in natural forest succession are typically of low commercial timber value [11]. Species planted for improved fallow could generate income via timber sales, potentially resulting in increased fallow lengths or even the purchase of fertilizers. Improved fallow plantings with commercial timber (e.g., Schizolobium amazonicum) or biomass species (e.g., Inga edulis) may be harvested as early as six years after slashing [12]. In the absence of fire, slower growing species (e.g., Parkia multijuga) of higher value that are also planted might be sustained through successive crop–fallow cycles prior to harvest.
In addition to fast-growing nutrient accumulators or timber species, improved fallow can improve soil fertility by using nitrogen (N)-fixing species (i.e., Inga sp.). Use of N-fixing cover crops (i.e., Centrosema macrocarpum) and hedgerows as green manures are common in continuous cultivation systems, where incorporation of cover crop or hedgerow biomass adds N to the agroecosystem [7]. Alternatively, as it is done in improved fallow, N fixers are added to the fallow mix to stimulate N acquisition for subsequent release to the cropping phase after the fallow is cleared [7]. Enrichment plantings with various N-fixing tree species, including I. edulis, were shown to increase fallow biomass by 6–117%, compared to unimproved fallow [13]. In Panama, young forests (<12 years) were estimated to have the highest rates of N fixation along a 300-year forest age gradient, and N fixers were estimated to supply >50% of the N necessary for biomass growth [14]. Other research in mixed-species plantings of non-fixing Eucalyptus sp. with N-fixing Acacia mearnsii found 3x the foliar N concentration in eucalypt when grown in a 50–50 mix [15], and Theobroma cacao roots contained as much as 60% higher N concentrations when grown in the presence of I. edulis [16]. The tropical N-fixing tree species Gliricidia sepium was reported to supply up to 63% of the N content of neighboring grass species via root exudation [17]. These results indicate that N-fixing trees can increase neighbor N content.
In contrast, some recent studies in moist tropical forests did not support the notion of N-fixing trees facilitating the growth or nutrient acquisition of neighboring plants during secondary succession [18] or any effect on the total biomass accumulation of the secondary forest [19]. Rather than depleting agroecosystem N capital, as happens in slash-and-burn systems due to gaseous losses of N during burning [5], the inclusion of N-fixing tree species to enhance N stocks in AFS requires continued validation.
The slash-and-mulch technology was developed to reduce losses of soil fertility due to biomass burning and can fell, chop, and evenly distribute secondary forest vegetation using a mulching tractor [20]. Mulching the forest adds all biomass nutrients to the soil surface, which become available for future plant uptake, and, unlike burning, the mulching tractor can maneuver around planted trees.
In 2005, a field trial was initiated to develop an improved-fallow AFS that could take advantage of the slash-and-mulch technology and the potential for multiple rotations of tree growth that have economic value [21]. After mulching of a 7-year-old unimproved secondary forest, tree rows were planted on a 4 m spacing that would allow future passage of the mulching tractor. Trees included four timber species, i.e., S. amazonicum, a fast-growing pioneer that could be harvested after one rotation, and Ceiba pentandra, Cedrela odorata, and P. multijuga, all likely to require >2 rotations. Additionally, I. edulis, an N fixer, was co-planted in some improved-fallow treatments. The expectation was that I. edulis growth and mulching as a green manure would improve the N stocks of the soil. A P+K fertilization (Fert) treatment was also included, since these are also primary limiting elements along with N. The regional staple food crop Manihot esculenta was planted simultaneously with the trees.
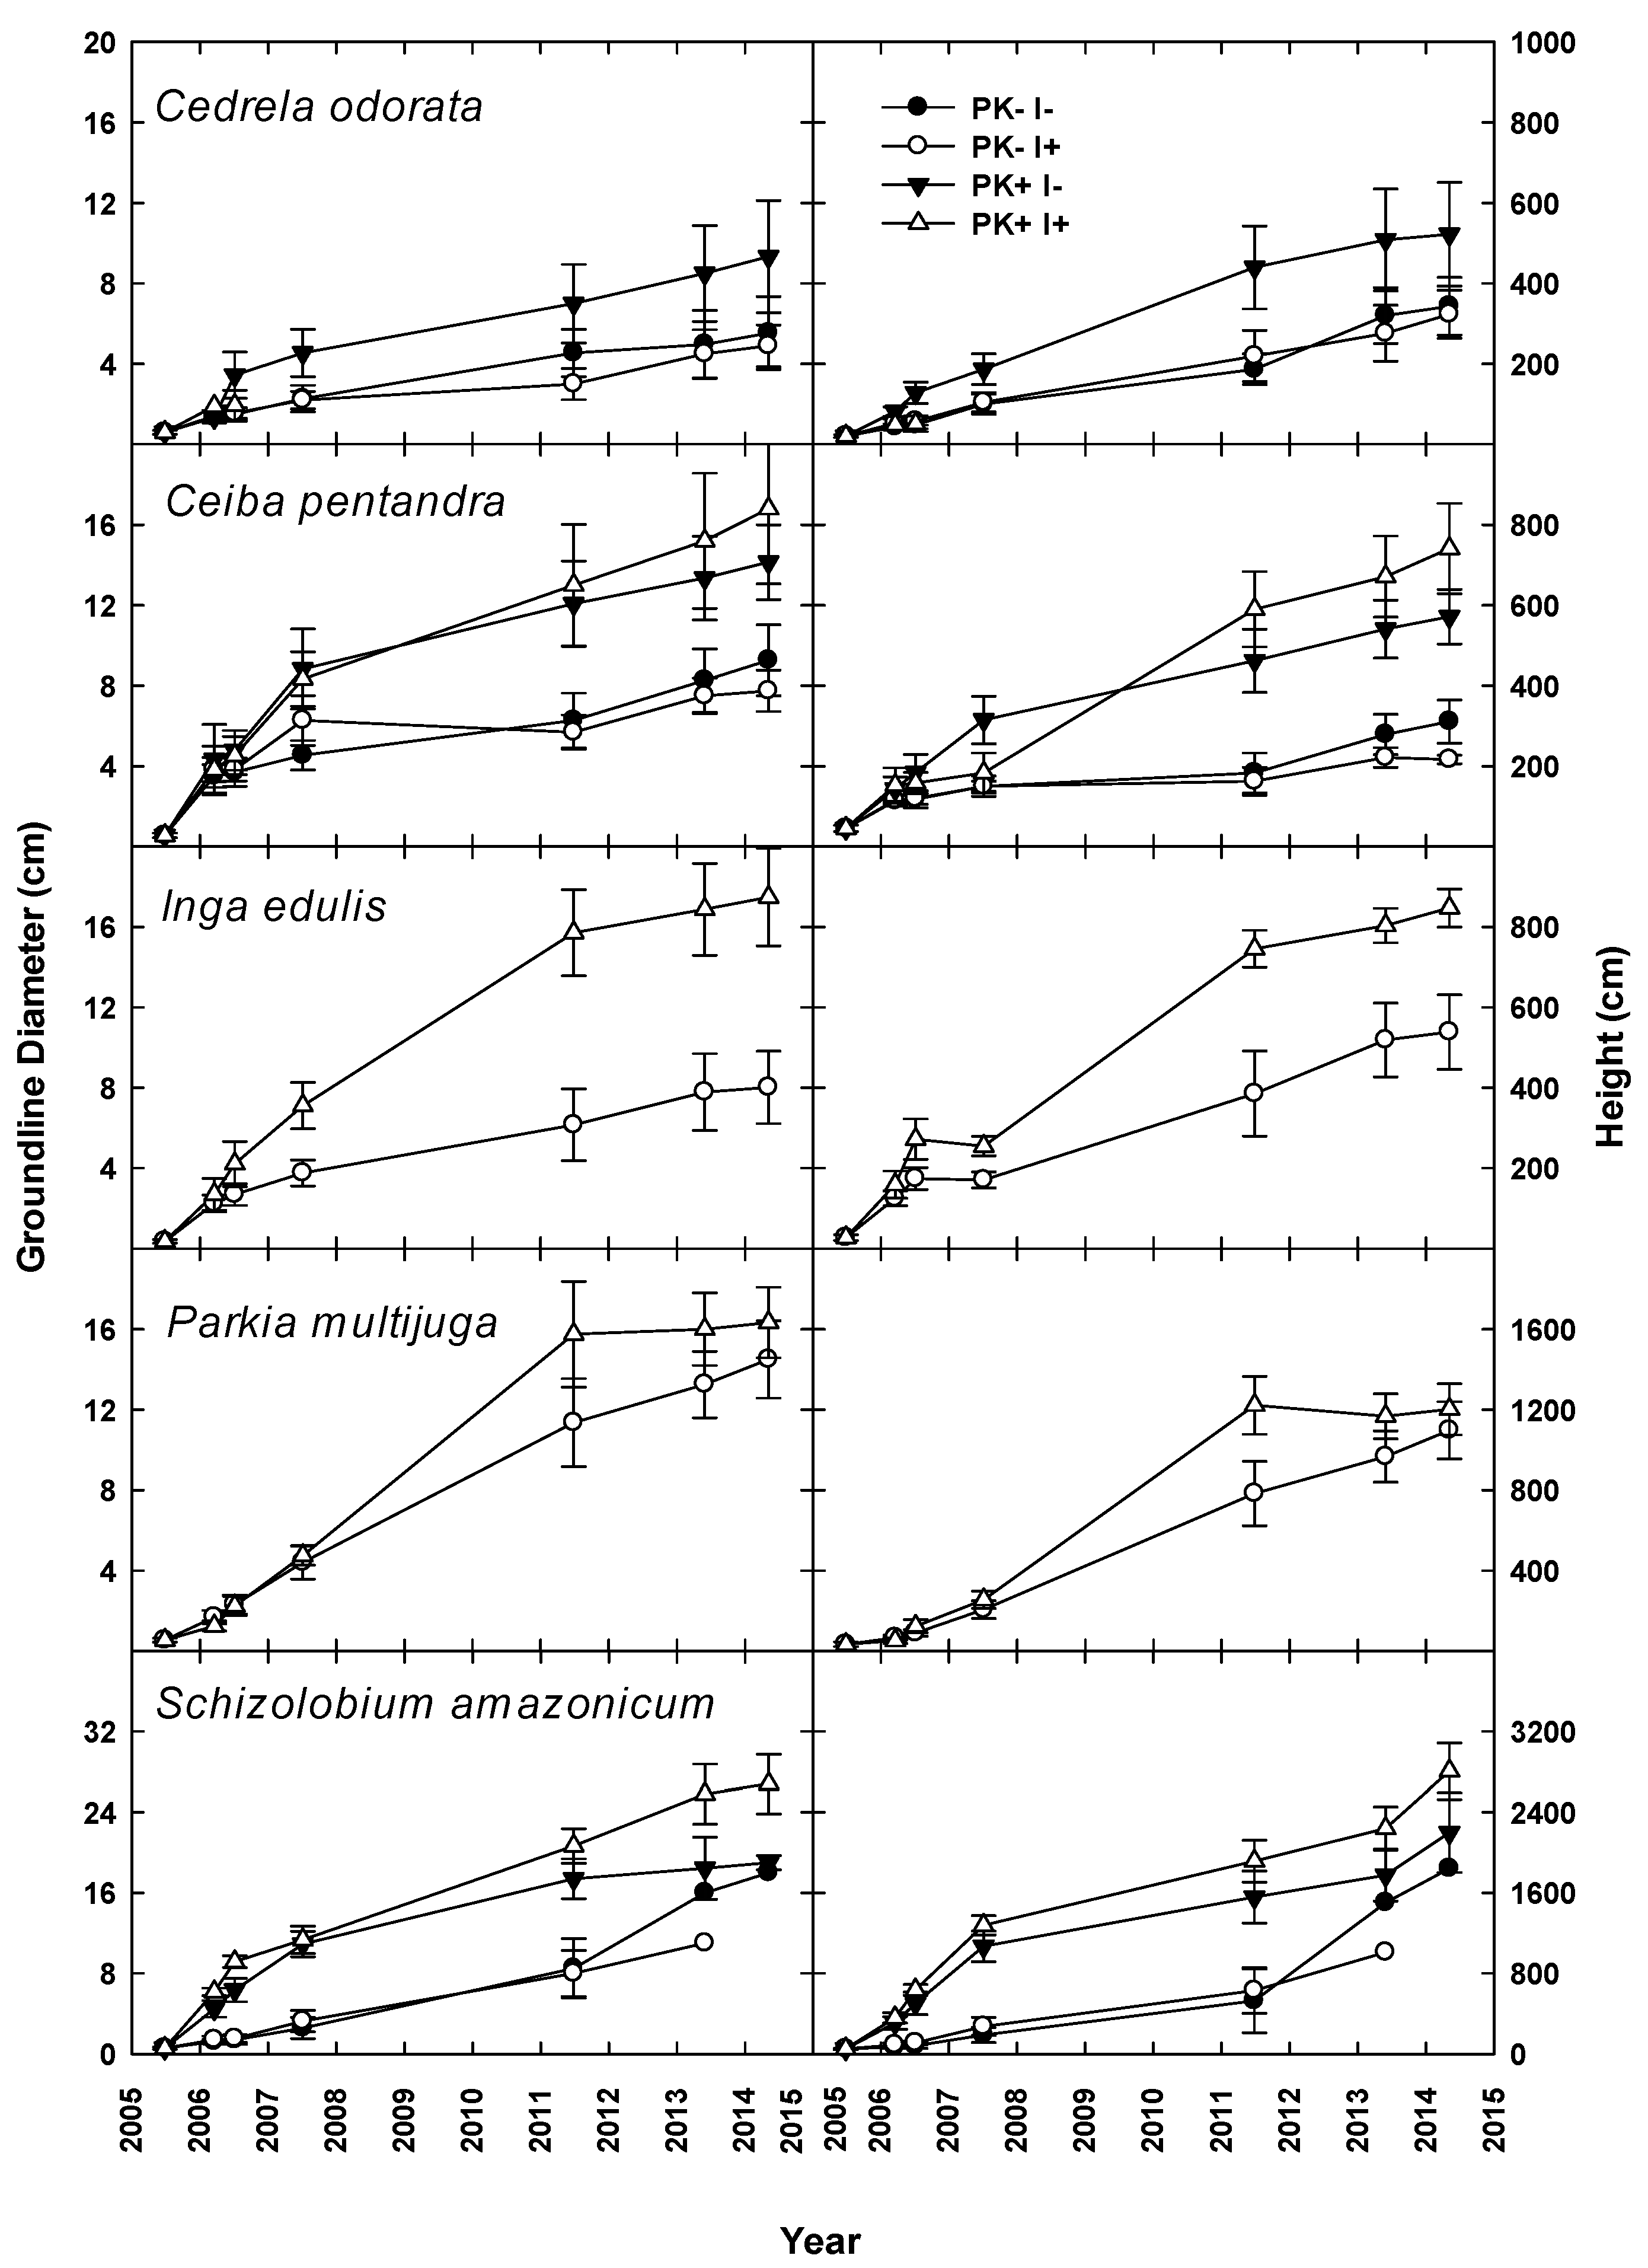
During the first two years of Rotation 1, manioc growth increased significantly with P+K fertilization, but there was no response to the N fixer [21]. P+K fertilization also enhanced tree growth through Year 6, and estimates of planted tree biomass and nutrient accumulation indicated that inclusion of I. edulis increased the N stock [
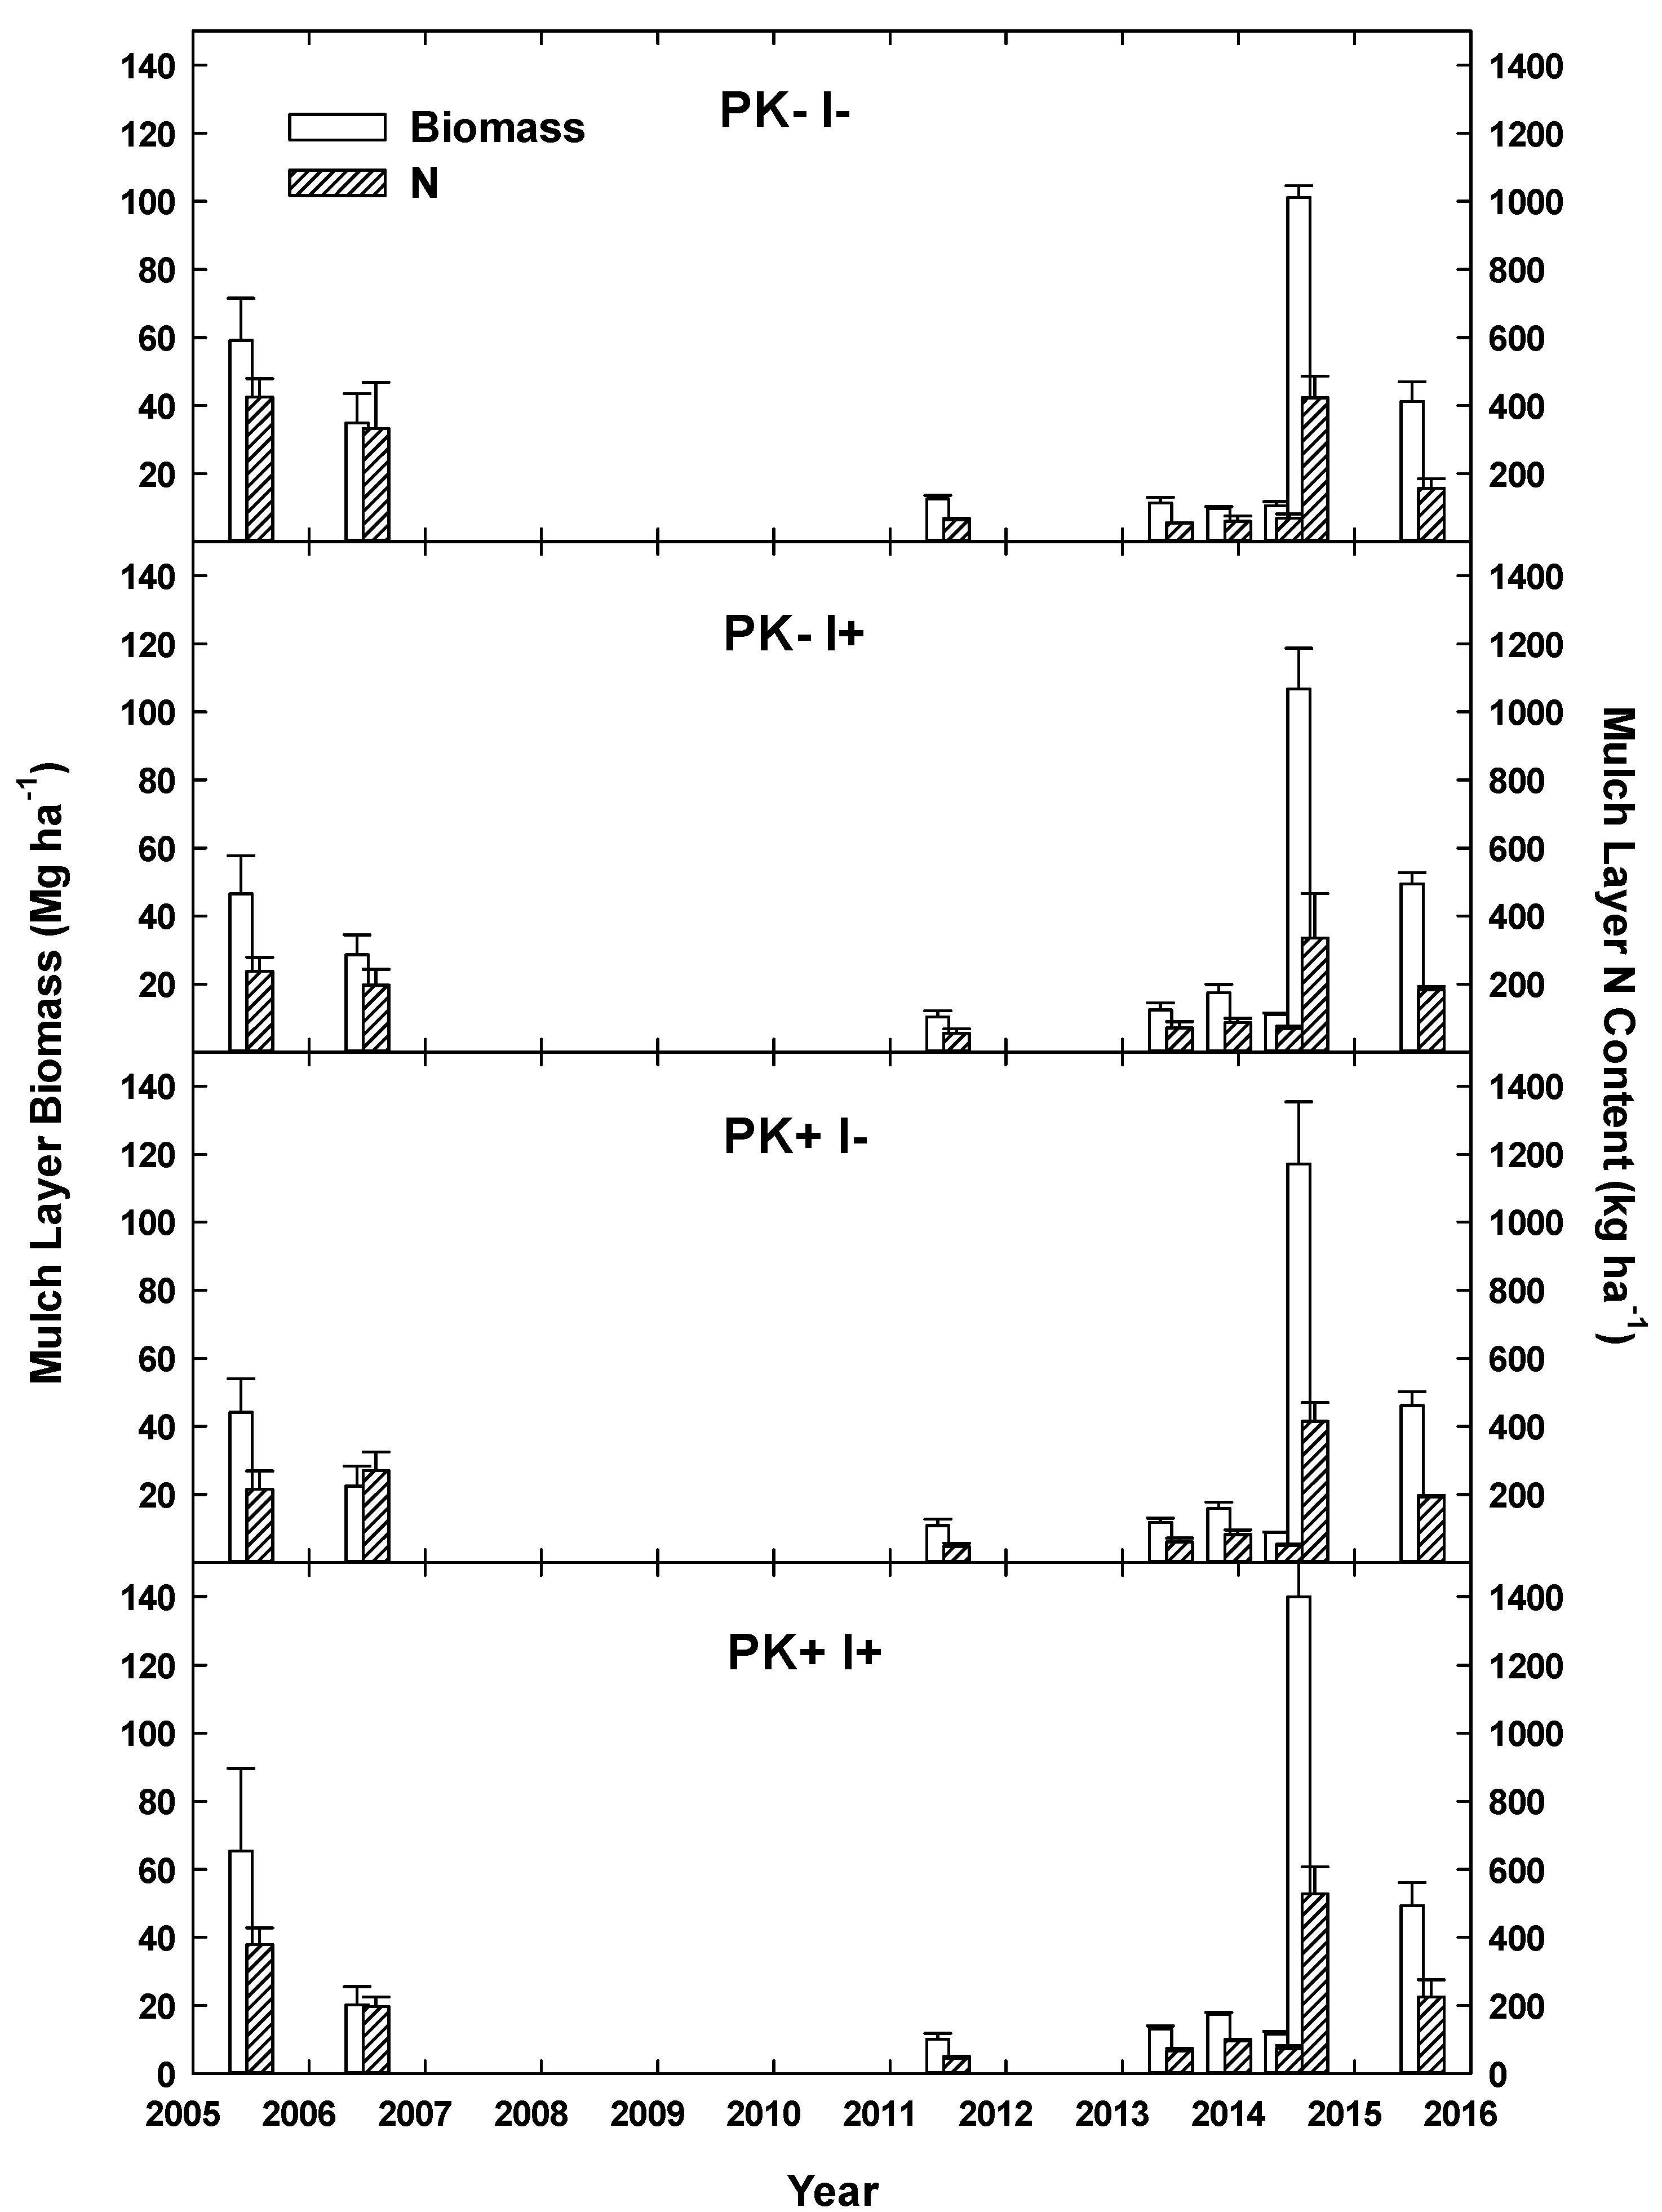
22]. The mulch layer at site initiation had a mean mass of 54 Mg ha−1 with ~300 kg N ha−1 [21] and decreased by Year 6 to 10–15 Mg ha−1 with N contents of ~130 kg ha−1 [22]. In year 6, mulch mass and N content showed no treatment effects. Mineral soil N at that time was not clearly elevated by the presence of I. edulis, but soil P concentration had clearly increased by 37% and 45% to ~6 and 4 µg/dm−3 in the 0–10 and 10–20 cm soil layers.
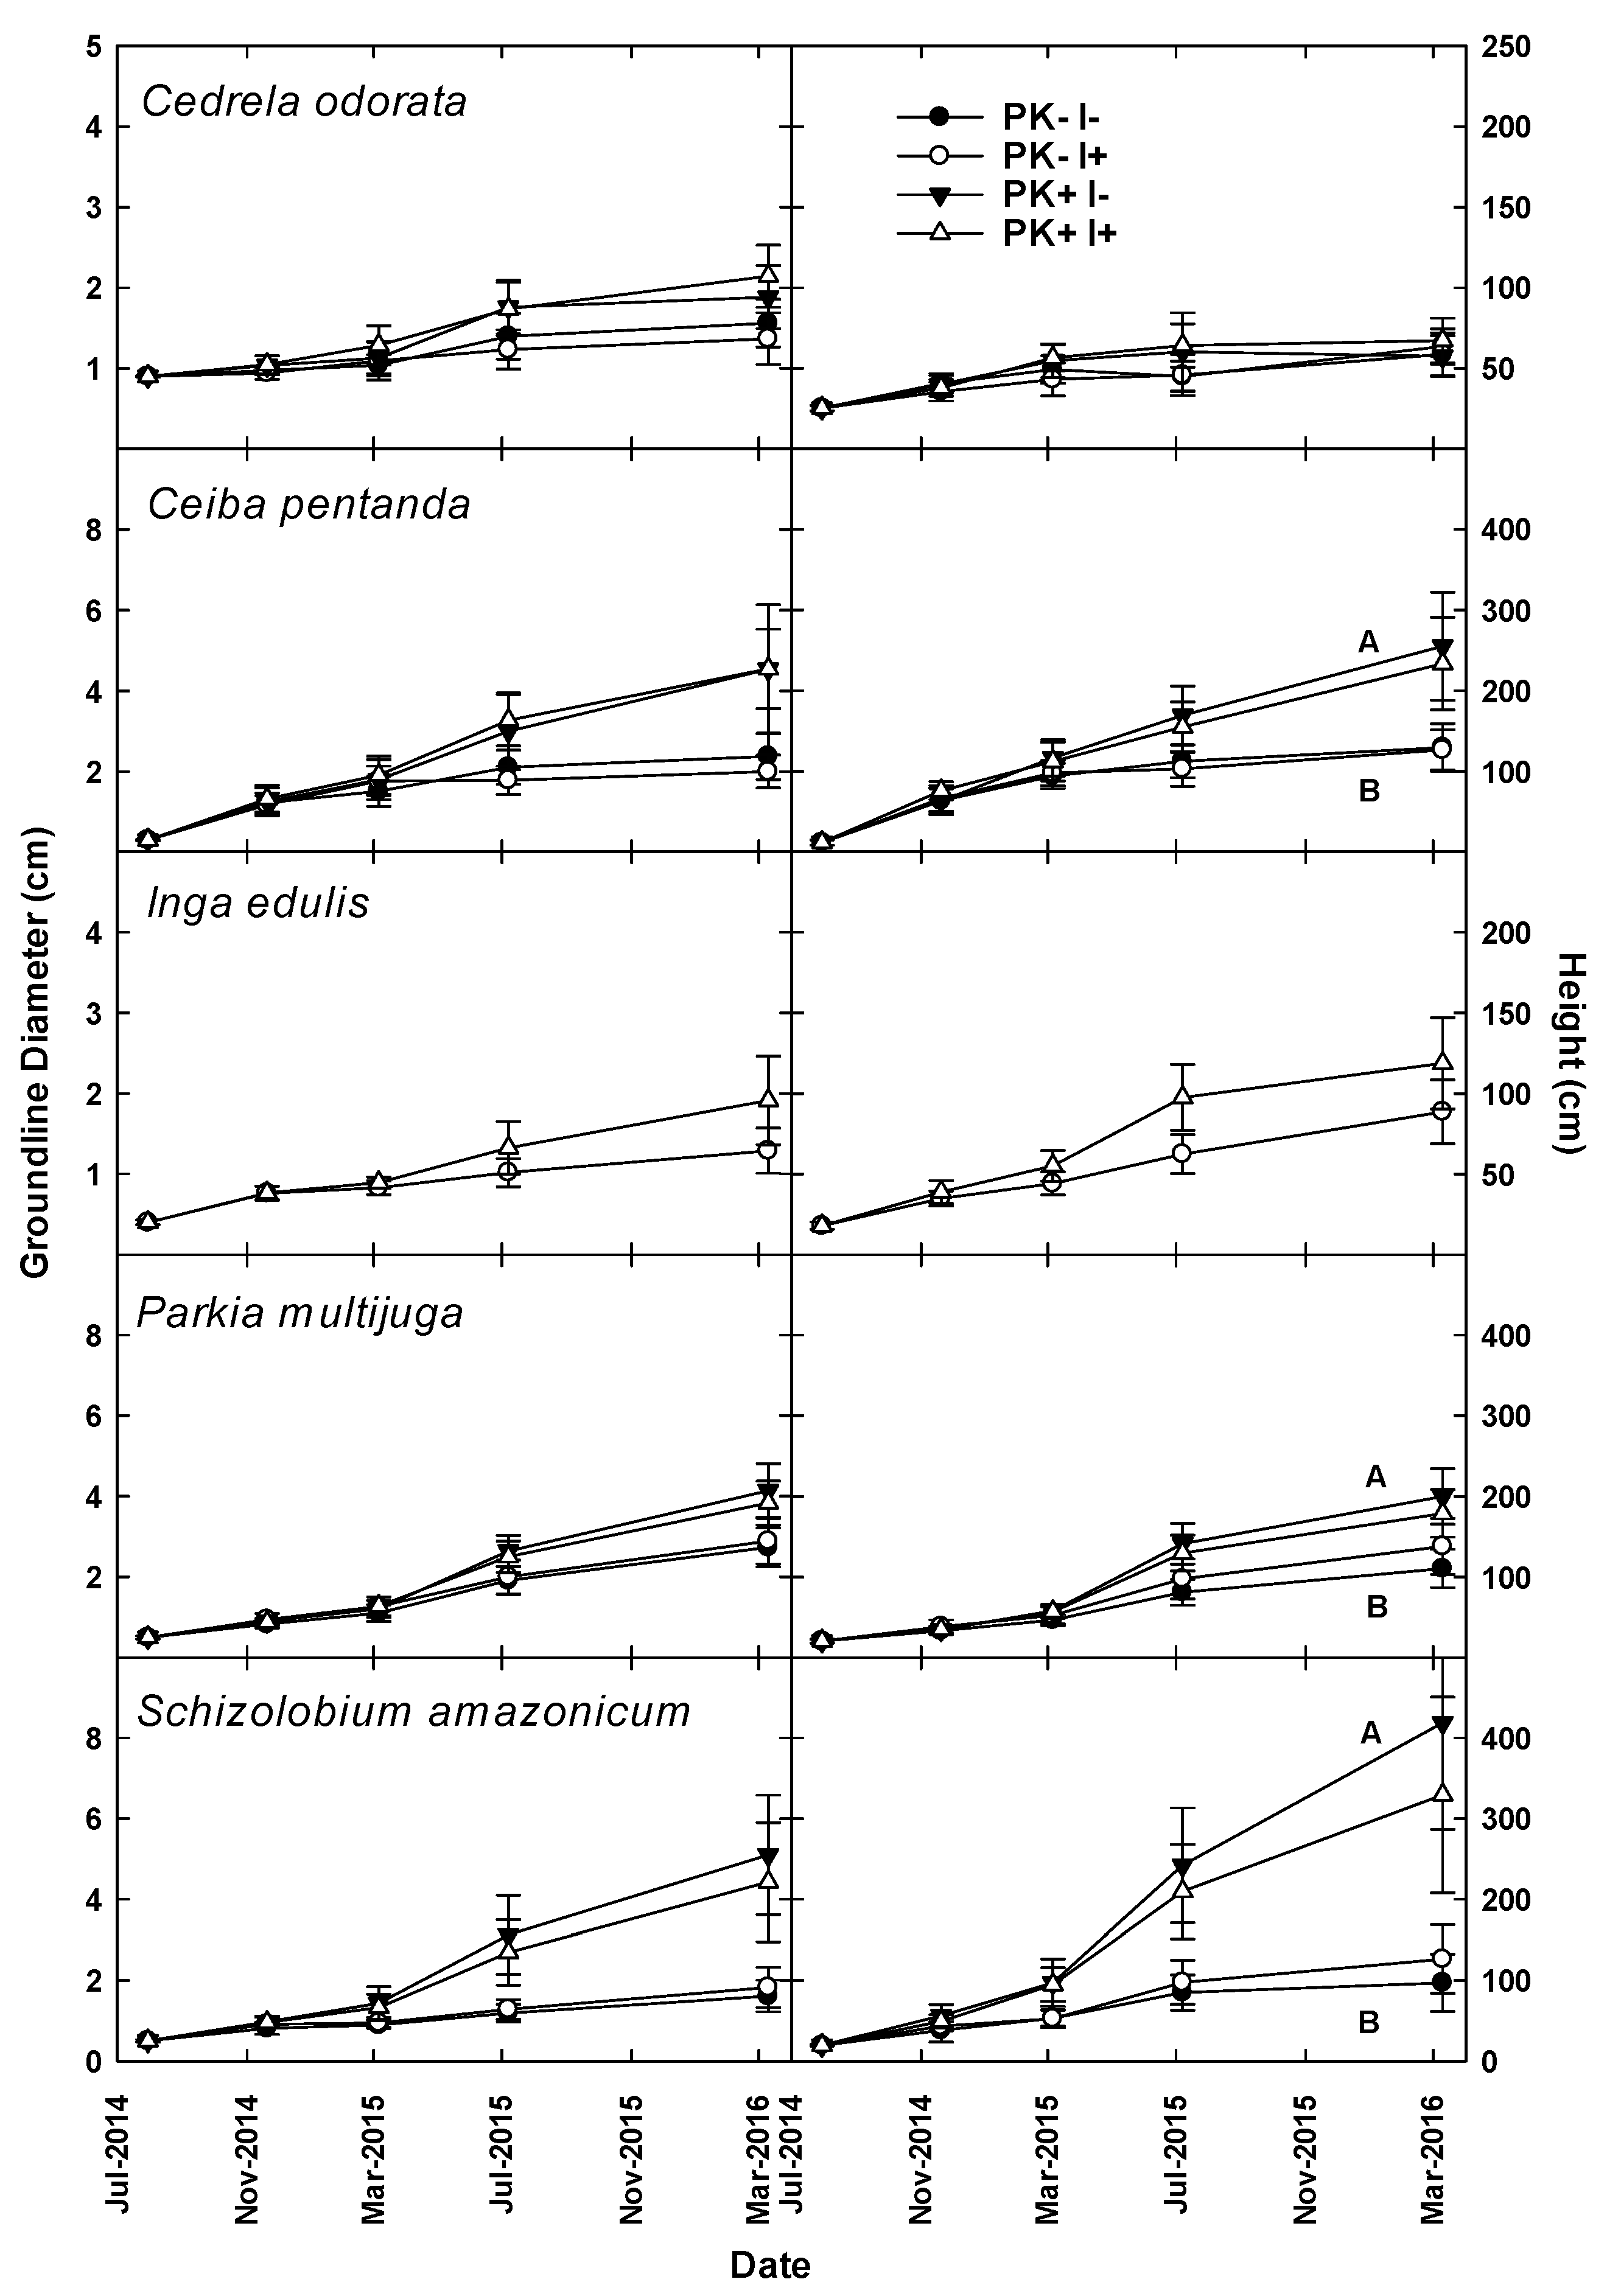
In this paper, we report on the end of the first rotation (Year 9) of this experiment and the initiation of the second rotation through years 10 and 11 that included driving the mulching tractor between planted tree rows, converting I. edulis trees to green manure, harvesting all S. amazonicum trees, and planting a second crop of manioc and trees as initially designed. Many AFS studies, including several from this region, have investigated 3–5 years after forest clearing [4,5,20,23], but only one decade-long study was identified, on shade-grown cacao [24].
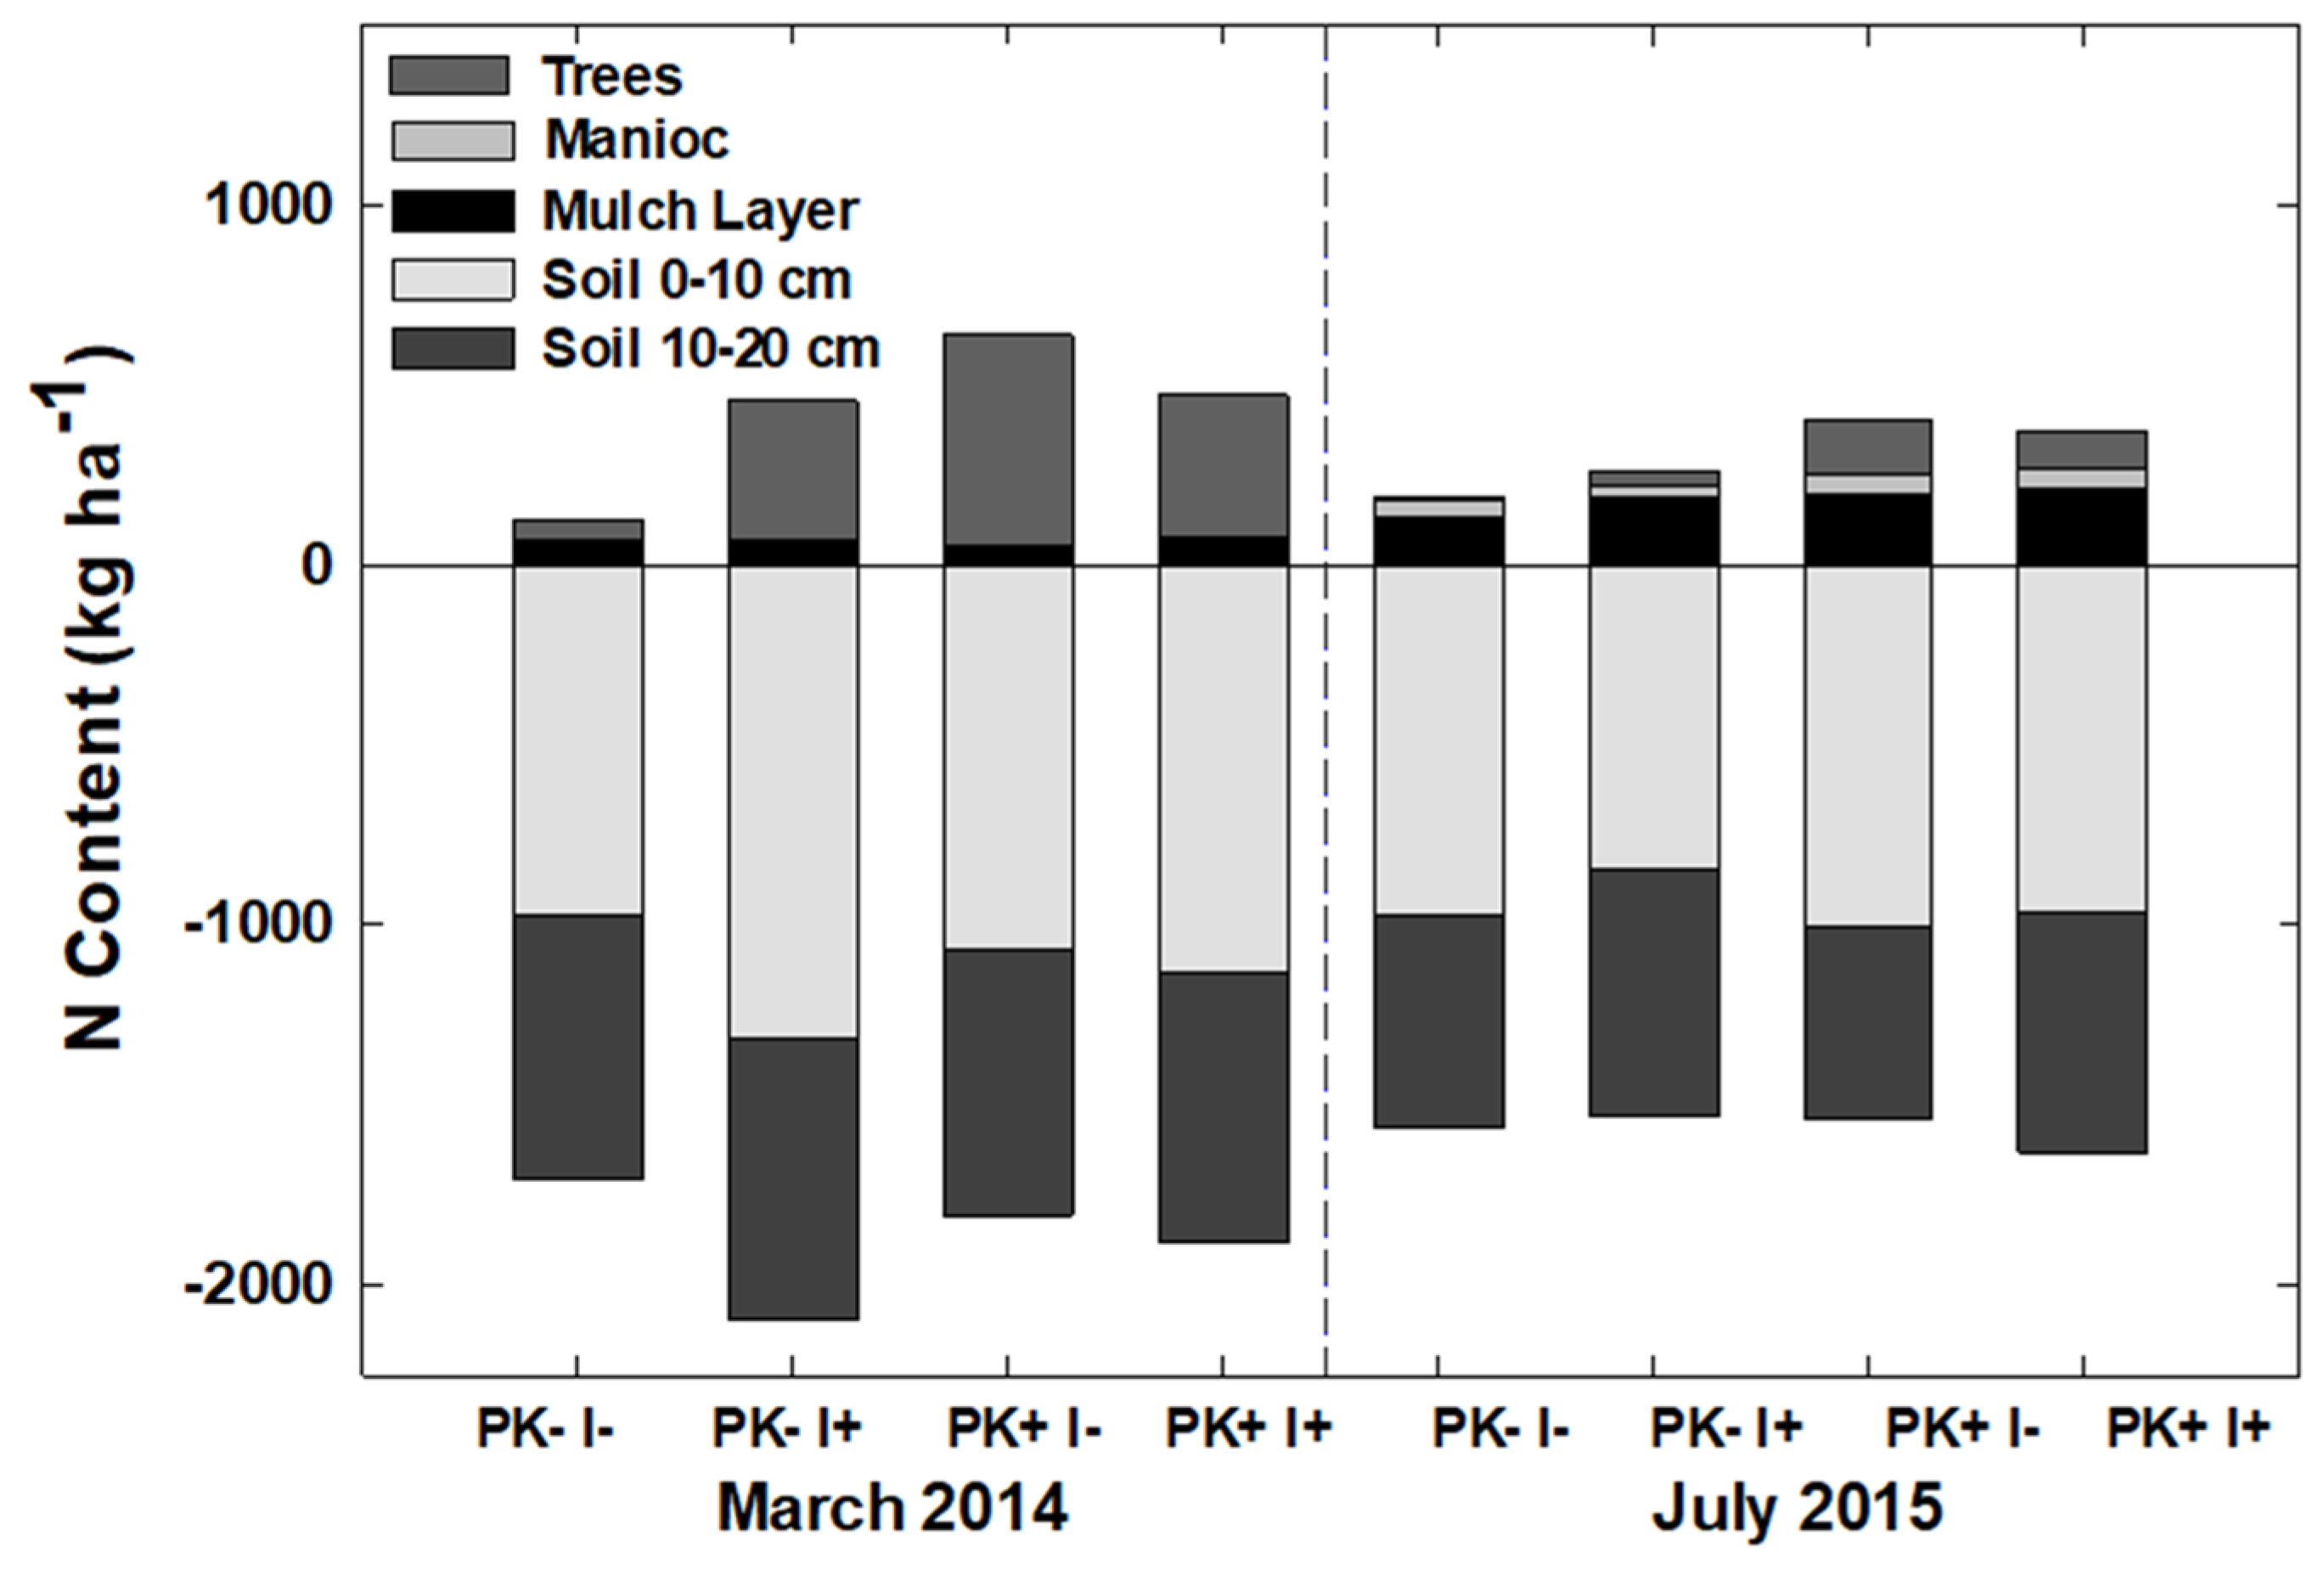
Given the multiple-rotation nature of this experiment, we posed hypotheses relative to the end of the first rotation and others related to the second rotation. In May 2014 at the end of Rotation 1, we hypothesized that the improved-fallow plantings would generate higher biomass and nutrient stocks than the unimproved fallow prior to site conversion. Furthermore, tree growth during Rotation 1 would increase with P+K fertilization and the presence of I. edulis (Nfix). Since we previously observed increased aboveground stocks of N [25] under improved fallow, we hypothesized that agroecosystem N stocks would be higher with P+K fertilization and with the presence of I. edulis at the end of the first Rotation. In July 2014 after mulching to initiate the second rotation, we hypothesized that the growth of newly planted trees would be greater due to P+K fertilization at initiation, as residual effects of fertilization on tree growth have been previously observed up to 20 years after application [26]. We also expected greater tree growth with I. edulis due to green manure effects, and that manioc growth would be greater with Fert and N fix treatments in Rotation 2.

2. Materials and Methods

2.1. Site Description

The research was conducted at the Fazenda Experimental de Igarapé Açu (FEIGA) of the Universidade Federal Rural da Amazônia (UFRA) in the Municipality of Igarapé Açu (1°07′41″ S 47°47′15″ W), approximately 110 km East of Belém, Pará, Brazil (Figure 1a). This region, the Bragantina, is one of the oldest continually inhabited agricultural areas in Amazonia [4], and the landscape is now dominated by human activities, such as urban, row-crop farms, plantation forests, cattle ranches, and secondary forests.
Soils in the municipality of Igarapé Açu are predominantly Kandiudults [27]. Particle size analyses for 2 m soil profiles were recently performed in 2016 on soils from one plot from within each block and one of each treatment (n = 4). Each plot location was sampled at increments of 0–10, 10–20, 20–50, 50–100, 100–150, and 150–200 cm. Particle size distribution was determined using the hydrometer method [28] (Table S1). Prior bulk density (BD) measures found 1.2 g cm−3 from 0 to 5 cm and 1.4 g cm−3 from 5 to 10 cm [21]. Igarapé Açu has an average annual temperature of 26 °C and annual rainfall of 2500 mm [29]; the driest months are August–November, and the wettest months are January–May.

2.2. Species Descriptions

The five planted tree species are native to forests of the Bragantina region. I. edulis (Fabaceae) is the only known planted N fixer, although other N-fixing species may be present due to natural recruitment in secondary succession. S. amazonicum (Fabaceae) and C. pentandra (Malvaceae) are rapid-growing pioneers with soft wood. P. multijuga (Fabaceae) and C. odorata (Meliaceae) are slower growing tropical hardwoods (see [21] for a more complete species description).
All five tree species were planted with the food crop manioc (M. esculenta), which was sampled after 12 months and then harvested after 20 months during the first crop–fallow rotation. Manioc growth response has been reported [21]. The same tree species were planted with manioc within 10 days of site conversion via mulching tractor in July 2014 to begin the second rotation of the crop–fallow cycle. Manioc sampling of the second rotation was performed 12 months after site preparation, but the majority of the manioc plants were stolen prior to the 20-month sampling event, so that data are not present in this study.

2.3. Plot Establishment

Plot establishment of this site was previously described [21]. Briefly, in March of 2005, a 1 ha study site within FEIGA (Figure 1b) was selected and mulched. Experimental treatments were applied in June 2005, and the aforementioned species were planted in four experimental blocks (N = 4). Each block was divided into four plots (n = 16) that measured 24 × 24 m. Trees and manioc were planted simultaneously, with trees planted at 4 × 1.8 m spacing, for a total of 78 trees per plot, or 1354 trees ha−1. The crop species M. esculenta was planted at 1 × 1 m spacing, or 10,000 stems ha−1 (Figure 2).
A factorial combination of fertilization treatment and N-fixing species was assigned in a split-plot randomized complete block design. The two main plot fertilizer treatments consisted of no fertilization (PK−) and fertilization (PK+) by an application around the base of planted trees of 46 kg P ha−1 as P2O5 (100 kg Simple-Super Phosphate with 46% P) and of 30 kg K ha−1 as KCl (50 kg KCl with 60% K). Sub-plot treatments consisted of planting 26 trees each of the native species C. odorata, C. pentandra, and S. amazonicum together (I−) or in combination with the N-fixing species I. edulis and P. multijuga (I+). In the I+ treatment, half of the trees planted were I. edulis, while the remainder was divided evenly among the remaining species.
In July 2014, the site was prepared for the second rotation of the crop-–fallow system via mulching tractor, as was done during the first rotation. However, the tractor passed between the 4 m-wide spacing between rows of trees, mulching the secondary vegetation but leaving the planted trees to continue growing. Unfortunately, many small trees did not survive the mulching event, either because they were mulched or because other vegetation fell on them. The same five species of trees were planted in both rotations.

2.4. Soil/Litter Sampling and Analysis

During both the end of Rotation 1 and the beginning of Rotation 2, mulch layer samples were collected for plot-level analysis from four random sample locations between rows 2 and 5 and between the 4th and the 10th trees of those rows to avoid edge effects of neighboring plots. Samples were collected within 1 m × 1 m polyvinyl chloride (PVC) quadrats, dried in a forced-air oven at 65 °C, weighed, and averaged per plot. Soil samples were taken from a 0–10 cm depth from the center of each framed location beneath where litter samples had been collected. These samples were air-dried and composited by plot.
All samples were ground to a powder using a vial roller or ball mill grinder (SPEX, Metuchen, NJ). Soil and litter samples were analyzed for carbon (C) and nitrogen (N) concentrations using a CN analyzer (CE Elantech, Lakewood, NJ, USA). Litter samples were analyzed for additional elements using the EPA-3050B (U.S. EPA, 1996) method [30]. Soil samples were analyzed for cations and P via Mehlich−1 double-acid extraction [31]. Extracts of 1 M KCl were analyzed via flow-injection spectrometry for NH4 and NO3 concentrations (OI Analytical, College Station, TX, USA).

2.5. Plant Biomass

Trees’ diameters at breast height (DBH) and ground line (GLD) were measured in 2013, 2014, 2015, and 2016. Additionally, height was measured in 2014, 2015, and 2016 using a hypsometer (Hägloff, Långsele, Sweden) or a range pole for shorter trees. The diameter was measured using digital calipers for smaller girth trees and seedlings or slide calipers for larger diameters.
For seedlings and saplings that had not achieved DBH, the tree volume was estimated using the frustum formula:
V = ( π · h 3 · ( R 2 + R · r + r 2 ) )
where h = length of the section measured, R = radius of the lower end of the section, r = radius of the upper end of the section
Planted-tree aboveground biomass was estimated by multiplying published wood density values [32] by the frustum volume estimate:
B = V · ρ
where B is biomass, V is volume, and ρ is wood density.
Exceptions to this estimate are noted below.
S. amazonicum trees were harvested after mulching at the beginning of the second rotation. Nine trees, out of 42 survivors (21.5%), were selected for measurement of DBH and for diameter at each 5 m increment along the stem. Total length was measured, and branches were measured for diameter at the junction with the main stem. All leaves were collected, dried, and weighed. Discs of the stem were collected, dried, and weighed. The lengths of individual branches were not measured but estimated with a species-specific allometric equation for S. amazonicum (R2 = 0.8916) derived from saplings sampled in this research:
L = 80.104 · D 49.66
where L = branch length (cm), D = branch diameter (cm).
Volume estimates of S. amazonicum at the end of the first rotation (Year 9) used [33]:
V = 0.077476 + 0.517987 · ( D B H 2 · H )
where V = volume (m3), DBH = diameter at breast height (cm), H = height (m).
For trees under 2.0 m of height, the frustum volume Equation (1) was used and multiplied by the wood density [32] to generate the biomass of the stem. Stem biomass was then multiplied by the ratio of the stem biomass to total biomass measured from the nine sample trees mentioned above to generate a total biomass estimate. For trees with height above 2.0 m, biomass (B) was estimated using diameter at breast height (DBH) by the allometric equation [34]:
B = 0.076 · D B H 2.346
I. edulis trees were cut at ground level in May 2014 prior to site conversion via mulching tractor, so that the biomass could be mulched and distributed as green manure with the rest of the secondary vegetation. Twelve trees, 7% of trees in the 2014 sample event, with at least one tree per I+ plot was selected for allometric analysis. These 12 trees were sampled for GLD and DBH, and the mass of each section was weighed wet. The wet weight was converted to wood biomass using data from Reference [35] in which 39% of wet weight was wood. Additionally, all leaves were collected per tree and dried in a forced-air oven at 65 °C until a constant weight. Height, GLD (cm), and DBH (cm) were used in regression equations to predict total biomass, with the best fit (R² = 0.9127) for trees of GLD < 13.5 cm:
B = 44.461 · G L D 2.2579
where B is biomass (kg), and GLD is ground line diameter (cm); for trees with GLD > 13.5 cm (R² = 0.9086):
B = 138.39 · D B H 2.4706
where B is in kg, and DBH = diameter at breast height (cm).
Since I. edulis trees were not measured for height in 2013 due to understory vegetation blocking sight of the tops of most fertilized trees, height, GLD, and DBH measurements from 2011 were used to find the best allometric equation to predict height for the measurements in 2013 and 2014. The best fit was (R2 = 0.8047):
D B H = 233.6 · H 0.5172
where H = height (cm).
I. edulis leaf biomass estimates were generated from the leaf-to-stem biomass ratio from the sampled trees, and the best fit was a linear regression (R² = 0.8168):
L M = ( 42.973 · S B ) 2079.3
where LM = leaf mass (g), SB = stem biomass (g).
For C. odorata saplings without DBH, biomass estimates were generated using the frustum volume (Equation 1) multiplied by the specific gravity of C. odorata (0.39 g cm−3; [32]). For all trees above 2.0 m height, the allometric equation [36] was used to estimate the biomass:
B = 200.2 · D B H 2 · H 0.5615
To separate stem biomass from leaf biomass for trees under 200 cm of height, the leaf biomass was assumed to be 28% of the total biomass [37], and for trees above 200 cm, the allometric equation [36] was used to predict leaf biomass:
L B = 126.5 · D B H 2 · H 0.2787
Foliar and wood N content were estimated using published data: 3.07% N for leaf [38] and 0.109% N for wood [39].
P. multijuga biomass estimates for trees <2.0 m of height were generated using the frustum volume (Equation 1) multiplied by the specific gravity of P. multijuga (0.38 g cm−3; [32]). Foliar N content was determined from the mean of published data, i.e., 2.362% [40,41,42], multiplied by leaf biomass estimates. Wood N content was estimated from published data, i.e., 0.109% [40], multiplied by wood biomass estimates. Wood mass was separated from leaf mass using a 7.3:1 wood/leaf ratio for P. multijuga from Central Amazonia [43]. The content of other macronutrients was determined using reported concentrations for wood [43] and leaf [39]. For trees with height >2.0 m, the following biomass estimate [43] was used:
B = 0.076 · D B H 2.346
The following power function (R2 = 0.9218) was used to estimate the height (H) of P. multijuga that could not be measured due to secondary vegetation interference:
H = 124.65 · D B H 0.8337
C. pentandra volume was estimated using the frustum method (Equation 1). The volume was then multiplied by the basic density, 0.28 g cm−3 [32]. We used reported biomass allometry for C. pentandra in plantation at 4 years of age [44] and used the height of 300 cm which was the average height of surviving trees at approximately that age (299 cm ± 182). Leaf and wood biomass distribution was based on the reported aboveground biomass [43]. Wood N concentration was reported [45], as well as leaf N concentration [38].
Manioc stems were planted at the beginning of the second rotation in July 2014, and biomass was measured in July 2015 by placing a 1 × 1 m PVC frame at four randomly selected points in each plot. All biomass from within the vertical plane of the frame was collected, aboveground and belowground. Manioc biomass was divided into three compartments: leaf, stem, and root. Biomass compartments were dried in a forced-air oven at 65 °C and weighed.

2.6. Statistical Analyses

All statistical analyses were performed using SAS University Edition (SAS, Cary, NC, USA). Data distributions were evaluated prior to analysis and transformed as needed. Analyses were performed using Proc MIXED. In the factorial model, the main-plot treatment was with or without P+K fertilization, and the sub-plot treatment was with or without the N-fixing tree species I. edulis. Fert and Nfix were treated as fixed effects, and block as a random effect. Repeated measures analysis was used to account for covariance among dates, with plot as the subject. Contrast statements were used to test differences in growth rates between specific years.
Multivariate regressions (Proc REG) were used to evaluate the role of soil variables (mineral soil and O horizon) on tree and manioc growth. Sampling dates used in the multivariate regressions were: July 2013, May 2014 during Rotation 1, and July 2015 during Rotation 2. Macronutrients N, P, K, Ca, and Mg were used as regressors for both mineral soil and O horizon, as well the C/N ratio. Additionally, O horizon (mulch layer) mass and macronutrient content were used as regressors.

3. Results

3.1. Survival

At the end of the first rotation in May 2014, the survival of trees ranged from 0% for C. odorata in PK+I+ to 76% for P. multijuga in PK−I+ (Table 1). Both Fert and NFix treatments affected the survival of the planted trees, although P+K fertilization more consistently decreased the survival than did the presence of I. edulis (Table 1). In the first two years after the establishment of Rotation 2, P+K fertilization continued to have a significant effect on the survival of four of the five planted species (Table S2). The survival for all species was higher 20 months after planting in the second rotation in 2014, than 24 months after planting in 2005 (Table 1). C. odorata had the most dramatic increase in survival in the full-factorial treatment (PK+I+), with 66.7% survival after 20 months in Rotation 2 vs. 0% after 24 months in Rotation 1. However, C. odorata survival decreased without fertilization in Rotation 2 relative to Rotation 1. The only other species with reduced survival in Rotation 2 relative to Rotation 1 without fertilization was I. edulis (84 vs. 92%, respectively). The presence of I. edulis (I+) did not significantly affect survival for any species 20 months after planting in Rotation 2 relative to 24 months after planting in Rotation 1 (Table S2).

3.2. Planted Trees

With all species grouped together (henceforth, All-Species), planted tree growth was enhanced by P+K fertilization (Figure 3) during Rotation 1, with all measured attributes responding to fertilization (Table 2). However, by Year 9, the differences in growth rate ceased to be significant in most instances for individual species (Table S3). During Rotation 2, the presence of the N fixer I. edulis increased GLD (p = 0.02) and height (p = 0.01) in the All-Species grouping and DBH for C. pentandra (p = 0.03), but there was no Fert–Nfix interaction in planted tree growth during the second rotation. During Year 2 of Rotation 2, only GLD differed for All-Species with P+K fertilization (p = 0.06). Fertilization increased height for C. odorata, I. edulis, and S. amazonicum during the Year 2 Rotation 2 (Table S3; Figure 4).
By the end of Rotation 1, the estimated N content of the trees ranged from 100 to 600 kg N ha−1 in PK−I− and PK+I−, respectively (Figure 5). The estimated N content of planted trees decreased after mulching and tree harvest for Rotation 2 by 70–90%, despite the retention of “leave trees” that were not harvested or felled and mulched (Table S4).

3.3. Manioc

Ten years after P+K fertilization at the initiation of Rotation 1, both manioc biomass (p = 0.07) and N content (p < 0.10) during Rotation 2 were greater in fertilization plots (Figure 6; Table S5). In contrast, the presence of the N-fixing tree species I. edulis did not affect the N-content of manioc in Rotation 2.

3.4. Mulch Layer

The mulch layer resulting from site preparation at the beginning of Rotation 1 had a mass of 54 Mg ha−1 (Figure 7). By Year 6 after site establishment, the mulch layer achieved a steady mass that remained between 10 and 15 Mg ha−1 until Year 9. Mulching of secondary forest biomass in Year 9 in 2014 generated between 100 and 140 Mg ha−1 of mulch layer biomass. After mulching the site for Rotation 2, the presence of the N-fixing I. edulis contributed to the increase in mulch layer biomass and C content (p = 0.04 and 0.03, respectively) but did not increase N content (p = 0.2; Table S6). Concentrations of C (26–41%) and N (30–58%) in the mulch did vary with date (p = 0.001 for both C and N) but did not differ with treatment. From establishment to Year 1 of Rotation 2, the mulch material decreased by an average of 57%, from ~120 to 55 Mg ha−1, and the mulch layer N content also declined during this period, from ~370 to 160 kg ha−1 (Figure 7).

3.5. Soil

Soil N concentration at a 0–10 cm depth increased slightly during secondary succession from 2013 to 2014 from 0.09 to 0.10% (p = 0.14) but decreased to 0.08% (p = 0.002) one year after mulching for Rotation 2. There were no significant changes in soil C at 0−10 cm but soil C/N decreased during secondary succession from 2013 to 2014 (Tables S7 and S8) from 16.1 to 14.2 (p = 0.02) and increased to 18.5 (p < 0.0001) one year after mulching for Rotation 2.
Soil C and N concentrations differed at 0–10 and 10–20 cm depths during the pre- and post- mulching sampling dates, and trends of higher soil C and lower soil N were observed during Rotation 2 sampling in July 2015 with the inclusion of I. edulis in the planting mix (I+; Table 3 and Table S9). The sum of soil C content across both depths was not different between May 2014 and July 2015 (p = 0.3), or with treatment on either date. The sum of soil N content was 20% greater with Inga (I+) than without (I−) in May 2014 (p = 0.02) but not in July 2015 (p = 0.9).
Soil P concentrations were greater at the 0−10 cm depth in 2013 with P+K fertilization (p = 0.02), but not in 2014 or 2015, while soil K concentrations were not different with fertilization on any measurement date. Soil P concentrations were greater with I. edulis (p = 0.09) in 2013 and again in 2015 (p = 0.08), but not in 2014, while soil K concentration did not differ with I. edulis on any measurement date (Table 4 and Table S10).
Soil P concentration was a significant predictor of All-Species height, total biomass, and total N across the three sampling dates explaining 57%, 31%, and 30% of the variance (Table 5). Soil K or N were never included in the multivariate regressions for all species, while soil Ca and Al were included for height prediction (Table 5). On an individual species bases, soil P was the best predictor of biomass for C. pentandra, P. multijuga, and S. amazonicum, explaining 32%, 80%, and 20% of the variance, respectively (Table 6). For I. edulis soil Mg was the best predictor, and soil K was the best predictor for C. odorata, followed by soil C (Table 6).
Multivariate regression analyses of soil and litter macronutrient concentrations showed that P, K, and N concentrations and C/N ratio were significant predictors of GLD, DBH, and height (Table 7). The most frequent significant regressor for growth measurements for individual tree species was soil P concentration (10 times), followed by C/N ratio (6), and soil K concentration (3).

4. Discussion

4.1. Survival

Fertilization reduced the survival when pooled across the five planted tree species and reduced the survival of C. odorata and P. multijuga by the end of Rotation 1. Competing vegetation from secondary forest succession can suppress the survival of planted trees, and stimulated growth by P+K fertilization can enhance this competitive interaction [45]. For example, C. odorata, which suffered nearly 50% reduction of survival with P+K fertilization, was likely unable to escape light competition due to increased competing vegetation growth with fertilization. On the other hand, S. amazonicum survival was enhanced by over 30% with P+K fertilization, indicating that it was able to outgrow competitors with fertilization.
The presence of I. edulis reduced the survival of S. amazonicum to 0% in PK−I+ and that of C. pentandra to 0% in PK+I+ by the end of Rotation 1. Despite potential N benefits from N fixation, Inga is also a competitor with neighboring trees for light, water, and nutrient resources. For example, Inga suppressed secondary vegetation in a Costa Rican AFS [46], and in tropical secondary forests, evidence indicates that N-fixing species survive better than non-fixers in young (i.e., 10−11-year-old) forests [47]. Annualized mortality rates reported here ranged from 6% to 9% over Rotation 1, which were similar to the 7% mortality rate of non-fixing trees described [47]. Evidence presented here indicates that the presence of the N-fixing I. edulis can affect individual species survival.
The survival of planted tree species was greater 20 months after planting in the second rotation, relative to survival 24 months after site establishment of Rotation 1. During the second rotation, nearly all C. odorata individuals were attacked by Hypsipyla grandella insects at the meristems, causing deformation of the main stem and open wounds, both of which likely increased mortality. Other, unknown insects attacked C. pentandra, causing wounds on the stem, which sometimes led to meristem death and, in some cases, tree death.

4.2. Planted Tree Growth

Fertilization with P+K increased planted tree growth rates and size through Year 6 [22]. During the final year of Rotation 1 (Year 9), however, although trees were still larger in the presence of P+K fertilization, there was no longer a significant effect on growth rates in most cases. This is consistent with other research from Eastern Amazonia that showed that P and/or K fertilization increased secondary forest growth [45,48]. The presence of the N-fixing I. edulis was not associated with increased growth, survival, or volume of any other planted tree species. As such, no companion tree benefit can be ascribed to planting of this N-fixer. We had hypothesized that root and foliar turnover, particularly over the course of 9 years, would increase soil N and accelerate plant growth, but this was not supported by our data, though it may also indicate that P or K are more limiting nutrients in this system [45]. One premise that supports the use of many forms of AFS is that the use of N fixers increases N availability in an agroecosystem, so these results are somewhat surprising. However, other recent research has similarly indicated that N-fixing trees may neither benefit nor inhibit neighboring trees [18] and may not confer a competitive or facilitative effect on secondary growth [19]. It may be necessary to convert N fixers into green manure to capture N benefits.
Fertilization in Rotation 1 had a residual effect, as shown by increased seedling growth during the first 20 months of Rotation 2. Competing vegetation was severely reduced with mulching, and reduced light and rooting competition during the initial months of Rotation 2 may have improved conditions for initial seedling growth, as was the case during the first two years of Rotation 1, when the fertilization effect was greater. Although competition control is likely to have benefitted planted tree growth performance during the first 20 months of the second rotation in all treatments, P+K fertilization was shown to have legacy effects on planted tree growth for up to 20 years [26].
Higher soil P enhanced tree growth as a whole and increased the N content of planted trees. Fertilizer P can also enhance N-fixation in symbiotic N-fixing legumes [49], although the concentrations of wood and leaf N in I. edulis reported here were lower than in other studies [50]. At the end of Rotation 1, S. amazonicum was the dominant tree when present, accounting for 50–70% of planted tree N.

4.3. Plant and Soil N Stocks

Agroecosystem N stock in trees, manioc, mulch, and 0–20 cm soil compartments contained as much as 2500 kg N ha−1 at the end of the first Rotation (Figure 7). The N stock decreased from the last sampling event prior to site conversion via mulching tractor in March 2014 to the Year 1 sampling of Rotation 2 (Figure 7), with 4–30% (PK−I− and PK+I+, respectively) more N at the end of Rotation 1. Between 3% and 19% of the mean difference (422 kg ha−1) was contained in the planted trees, 0.2% of which was exported with S. amazonicum stems in the PK−I− treatment and 2.8% in the PK+I− treatment, and between 0.06% and 0.12% was lost as N2O gas [51]. Additional 0.9 and 18 kg ha−1 N (PK−I− and PK+I+, respectively) were removed in the first manioc harvest. The 136–215 kg N ha−1 accumulated by the improved-fallow vegetation during Rotation 1, as compared to the secondary vegetation prior to site preparation, was more than adequate to compensate for N lost to S. amazonicum timber export and manioc export.
Soil N content in the 0–10 cm depth ranged from 850 to 1300 kg ha−1, which was similar to the 1000–1250 kg ha−1 of soil N contents previously reported from soils at this same research station [23]. Declines of N content in the 0−10 cm soil horizon from pre- to post-mulching, although not statistically significant, were about equal to the gain of N in the mulch horizon during that time. This could indicate that N was immobilized by the high C/N ratio woody mulch material added to the soil surface. However, leaching losses of mobile NO3 beyond the surface rooting zone after forest disturbance are also possible [52], although any inputs from the surface horizon were not recovered in the 10–20 cm horizon as higher reported soil N.

4.4. Mulch Layer and Secondary Succession Biomass

The 7-year-old secondary forest that was converted to AFS in this research project produced 53.8 ± 5.1 Mg ha−1 of mulched biomass or 7.7 ± 0.7 Mg ha−1 yr−1 of secondary forest biomass accumulation prior to initial site conversion. This mass is comparable to the mean secondary vegetation of an Amazon basin-wide sampling study (53 Mg ha−1; [53]) and slightly higher than the mean annual accumulation determined in a secondary forest study from the same municipality (6.6 Mg ha−1 yr−1; [54]). Implementation of the improved-fallow slash-and-mulch AFS appeared to enhance secondary forest biomass growth by 116% relative to unimproved fallow preceding it. The improved fallow enhanced fallow vegetation growth to 12.9 ± 1.0 Mg ha−1 yr−1, an annual rate increase of 60%.
Increases in improved-fallow biomass relative to secondary forest prior to site preparation resulted in mulched fallow biomass that was 13% greater with I. edulis (I +) than without it (I −) at site conversion for Rotation 2. This result is consistent with short-fallow AFS in Central Amazonia [55], although the increase was not as large as that reported for I. edulis in improved-fallow plantings in Eastern Amazonia (46%; [47]). Increases in fallow biomass were not necessarily a response to increased soil N, as planted trees did not grow larger in the presence of I. edulis, but I. edulis itself was a good grower and biomass accumulator. Increased planted tree biomass was related to available soil P, as both the height and biomass of planted trees increased with soil P, which ranged only from 4 to 6 µg dm−3. In a secondary forest chronosequence study, [56] the suggested tighter N cycling in <10-year-old forests indicated greater N limitation to growth. In our study, however, soil N was a significant predictor of growth only for I. edulis, but here it is difficult to know if greater soil N with larger I. edulis is responsible for growth or rather a response to it. Fertilization studies in 6- [44] and 26-year-old secondary forests [57], also in the state of Pará, similarly demonstrated no tree growth response to P fertilization alone. In our study, P was always applied with K, and soil K was as significant predictor of growth for C. odorata, C. pentandra, and P. multijuga. This study suggests tree growth was improved with P fertilization and in the presence of higher soil P.

4.5. Manioc

Manioc growth was also improved with higher site P. In fact, total manioc biomass and N content were higher in the second rotation than in the first one across all treatments, and P+K fertilization increased manioc biomass and N content in all biomass compartments. These increases indicate that improved-fallow slash-and-mulch system was able to efficiently accumulate nutrients to sustain crop growth. This conclusion is supported by the increase in mulch layer biomass, which reflects secondary vegetation biomass accumulation between mulching events 1 and 2. The associated increase in mulch layer nutrients, even in the control treatment, exceeded and thus could sustain, nutrient export for manioc root and S. amazonicum stem harvests. Fertilization may not have stimulated manioc growth in Year 10 as much as in Year 1, but its effect on manioc growth was still evident 10 years after application.

5. Conclusions

Results from this research indicate that the simultaneous planting of the staple crop manioc with native tree species, in conjunction with slash-and-mulch site preparation, can yield two crop harvests and a merchantable timber harvest through the course of one crop–fallow rotation with P + K fertilization, while leaving other tree species for harvest in future crop–fallow cycles. This combination of site preparation techniques may give producers who utilize agroforestry systems multiple points of income (e.g., during the first two crop harvests at Years 1 and 2 and at the conclusion of the fallow phase at Year 9, in this case), as opposed to only generating income with crop harvests, which is typical without simultaneous improved-fallow plantings.
The improved-fallow design increased the annualized fallow biomass accumulation during Rotation 1, and the increased biomass provided enough nutrients to replace those exported via crop and timber export. The slash-and-mulch site preparation, when combined with improved-fallow planting, can sustain, and even increase, nutrient stocks as compared to nutrient losses prevalent in slash-and-burn site preparation, even with crop export at 12 and 20 months and timber export at Year 9. The inclusion of rapid-growing pioneer species such as S. amazonicum and I. edulis in an improved-fallow design with P + K fertilization will allow producers to harvest manioc and merchantable timber after one crop–fallow rotation, while returning enough nutrients to the agroecosystem via green manure to sustain crop harvest.
After the end of a full rotation and the initiation of a second, this research justifies the use of the leguminous species S. amazonicum and Parkia multijuga in a mixed-species planting design, with the inclusion of I. edulis for use as green manure. Harvest of P+K fertilized S. amazonicum at the end of Rotation 1, mulching, and then re-planting I. edulis and leaving P. multijuga for harvest at the end of Rotation 2 are supported by this study. Due to widespread pest attacks which caused deformation of the stems, and therefore loss of timber value, the results of this study cannot justify the inclusion of the slower growing, although higher value, timber species C. odorata or C. pentandra.

Supplementary Materials

The following are available online at https://www.mdpi.com/1999-4907/10/12/1125/s1, Figure S1: Mulch layer C content (kg ha−1) of an improved-fallow slash-and-mulch agroforestry system in Eastern Amazonia of Brazil., Figure S2: Soil-C content by depth increments 0–10 and 10–20 cm in an improved-fallow slash-and-mulch agroforestry system in Eastern Amazonia, Brazil., Table S1: Soil particle-size distribution at different depths in an improved-fallow slash-and-mulch agroforestry system in Eastern Amazonia, Brazil., Table S2: Differences in survival of five species of native trees after 24 months after planting of Rotation 1 and newly planted trees at 20 months of Rotation 2 of a crop-fallow agroforestry system in eastern Amazonia of Brazil., Table S3: Statistical contrasts of Height, DBH, and GLD of five species of native trees grown in mixed-culture, crop-fallow agroforestry system in eastern Amazonia of Brazil., Table S4: Sum of estimated total planted-tree aboveground biomass (kg) by plot and total biomass-N of planted-trees (g), and Percent (%) by Species of Total Biomass and Total N, at four different dates., Table S5: Statistical output of Manihot esculenta biomass and N content (kg ha−1) by root, stem, leaf compartments, and sum of all compartments, measured at Year 1 after establishment of Rotation 2 (2015) of crop-fallow system in Eastern Amazonia of Brazil., Table S6: Statistical output of Mulch layer Mass, N and C concentration, and N and C content of an improved-fallow slash-and-mulch agroforestry system in Eastern Amazonia of Brazil, Table S7: Statistical output of significant differences for plot-level soil sampling at 0 – 10 cm depth of an improved-fallow slash-and-mulch agroforestry system in Eastern Amazonia, Brazil., Table S8: Soil N and C concentrations (%) in the 0–10 and 10–20 cm depths at three different years during the first rotation of a slash-and-mulch agroforestry system in eastern Amazonia of Brazil., Table S9: Statistical output of significant differences for plot-level soil sampling at 0–10 vs. 10–20 cm depths of an improved-fallow slash-and-mulch agroforestry system in Eastern Amazonia, Brazil., Table S10: Statistical significance of P and K concentrations and content of Manioc by compartment, Mulch layer, and 0–10 cm Soil horizon.

Author Contributions

Conceptualization, A.H.J., O.R.K., L.M., and D.M.; Data curation, A.H.J.; Formal analysis, A.H.J., and D.M.; Funding acquisition, O.R.K., L.M., and D.M.; Investigation, A.H.J., L.M., and D.M.; Methodology, A.H.J., O.R.K., L.M., and D.M.; Project administration, A.H.J., S.S.V., F.d.A.O., O.R.K., L.M., and D.M.; Resources, S.S.V., F.d.A.O., O.R.K., L.M., and D.M.; Supervision, F.d.A.O., O.R.K., L.M., and D.M.; Writing—Review & editing, A.H.J., L.M., and D.M.

Funding

This research was funded by: Warnell School of Forestry & Natural Resources, University of Georgia, Athens, GA, USA; Tinker Foundation, Graduate Student Summer Research Travel Awards; and The Climate Food and Farming (CLIFF) Research Network, CGIAR—Climate Change, Agriculture and Food Security (CCAFS), PhD Research Grants for Climate Change Mitigation in Smallholding Agriculture.

Acknowledgments

I would like to thank Lori Sutter for her help in the lab, as well as my fellow graduate students Uma Nagendra, Ross Pringle, Rachel Ryland, Maryam Foroughi, Diego Barcellos, Karla McGee, and Peter Baas for their encouragement, inspiration, stimulation, and assistance. I want to thank meu amigo Livy Madeira for our spirited exchanges about science and knowledge in general, and him and his band, Alpha Doze, for letting me make my international rock n′ roll debut. I would also like to thank Vermelha, the FEIGA farm dog, for her company, carinhos, and for always being super excited to see me when I would come to visit.

Conflicts of Interest

The authors declare no conflict of interest. Additionally, the funders had no role in the design of the study; in the collection, analyses, or interpretation of data; in the writing of the manuscript, or in the decision to publish the results.

References

  1. World Agroforestry Centre. Annual Report 2008–2009: Agroforestry—A Global Land Use; World Agroforestry Centre: Nairobi, Kenya, 2009. [Google Scholar]
  2. Leakey, R.R.B. Living with the Trees of Life: Towards the Transformation of Tropical Agriculture; CABI: Wallingford, UK, 2012; p. 200. [Google Scholar]
  3. Brondizio, E.S.; Cak, A.; Caldas, M.M.; Mena, C.; Bilsborrow, R.; Futemma, C.T.; Ludewigs, T.; Moran, E.F.; Batistella, M. Small farmers and deforestation in Amazonia. In Amazonia and Global Change; Keller, M., Bustamante, M., Gash, J., Dias, P.S., Eds.; American Geophysical Union: Washington, DC, USA, 2009; pp. 117–143. Available online: https://www.alice.cnptia.embrapa.br/handle/doc/663208 (accessed on 12 November 2019).
  4. Denich, M.; Vielhauer, K.; Kato, M.S.A.; Block, A.; Kato, O.R.; Sá, T.D.A.; Lücke, W.; Vlek, P.L.G. Mechanized land preparation in forest-based fallow systems: The experience from Eastern Amazonia. Agrofor. Syst. 2004, 61, 91–106. [Google Scholar]
  5. Metzger, J.P. Landscape dynamics and equilibrium in areas of slash-and-burn agriculture with short and long fallow period (Bragantina region, NE Brazilian Amazon). Landsc. Ecol. 2002, 17, 419–431. [Google Scholar] [CrossRef]
  6. Buschbacher, R.; Uhl, C.; Serrão, E.A.S. Abandoned pastures in Eastern Amazonia II: Nutrient stocks in the soil and vegetation. J. Ecol. 1998, 76, 682–699. [Google Scholar] [CrossRef]
  7. Sanchez, P.A. Improved fallows come of age in the tropics. Agrofor. Syst. 1999, 47, 3–12. [Google Scholar] [CrossRef]
  8. Szott, L.T.; Palm, C.A. Nutrient stocks in managed and natural humid tropical fallows. Plant Soil 1996, 186, 293–309. [Google Scholar] [CrossRef]
  9. Barrios, E.; Cobo, J.G. Plant growth, biomass production and nutrient accumulation by slash/mulch agroforestry systems in tropical hillsides of Colombia. Agrofor. Syst. 2004, 60, 255–265. [Google Scholar] [CrossRef]
  10. Basamba, T.A.; Barrios, E.; Singh, B.R.; Rao, I.M. Impact of planted fallows and a crop rotation on nitrogen mineralization and phosphorus and organic matter fractions on a Colombian volcanic-ash soil. Nutr. Cycl. Agroecosystems 2007, 7, 127–141. [Google Scholar] [CrossRef]
  11. Pinedo-Vasquez, M.; Zarin, D.J.; Coffey, K.; Padoch, C.; Rabelo, F. Post-boom logging in Amazonia. Hum. Ecol. 2001, 29, 219–239. [Google Scholar] [CrossRef]
  12. Joslin, A.; Markewitz, D.; Morris, L.; Kato, O.R.; Figueiredo, R.; Oliveira, F.A. Crescimento de Cinco Espécies Nativas em Successão Natural na Amazônia Oriental. In Proceedings of the VIII Congresso Brasileiro de Sistemas Agroflorestais, Belém, Brasil, 21–25 November 2011; Available online: http://www.alice.cnptia.embrapa.br/alice/handle/doc/910528 (accessed on 12 Nov., 2019).
  13. Brienza, S., Jr. Biomass dynamics of fallow vegetation enriched with leguminous trees in the Eastern Amazon of Brazil. PhD. Thesis, University of Göttingen, Göttingen, Germany, 1999. [Google Scholar]
  14. Batterman, S.A.; Hedin, L.O.; van Breugel, M.; Ransijn, J.; Craven, D.J.; Hall, J.S. Key role of symbiotic dinitrogen fixation in tropical forest secondary succession. Nature 2013, 502, 224–227. [Google Scholar] [CrossRef]
  15. Bauhus, J.; Khanna, P.K.; Menden, N. Aboveground and belowground interactions in mixed plantations of Eucalyptus globulus and Acacia mearnsii. Can. J. For. Res. 2000, 30, 1886–1894. [Google Scholar] [CrossRef]
  16. Iglesias, L.; Salas, E.; Leblanc, H.A.; Nygren, P. Response of Theobroma cacao and Inga edulis seedlings to cross-inoculated populations of arbuscular mycorrhizal fungi. Agrofor. Syst. 2011, 83, 63–73. [Google Scholar] [CrossRef]
  17. Jalonen, R.; Nygren, P.; Sierra, J. Transfer of nitrogen from a tropical legume to an associated fodder grass via root exudation and common mycelial networks. Plantcell Environ. 2009, 32, 1366–1376. [Google Scholar] [CrossRef] [PubMed]
  18. Taylor, B.N.; Chazdon, R.L.; Bachelot, B.; Menge, D.N.L. Nitrogen-fixing trees inhibit growth of regenerating Costa Rican rainforests. Proc. Natl. Acad. Sci. USA 2017, 114, 8817–8822. [Google Scholar] [CrossRef] [PubMed] [Green Version]
  19. Lai, H.R.; Hall, J.S.; Batterman, S.A.; Turner, B.L.; van Breugel, M. Nitrogen fixer abundance has no effect on biomass recovery during tropical secondary forest succession. J. Ecol. 2018, 106, 1415–1427. [Google Scholar] [CrossRef] [Green Version]
  20. Kato, M.S.A.; Kato, O.R.; Denich, M.; Vlek, P.L.G. Fire-free alternatives to slash-and-burn for shifting cultivation in the eastern Amazon region: The role of fertilizers. Field Crop. Res. 1999, 62, 225–237. [Google Scholar] [CrossRef] [Green Version]
  21. Joslin, A.H.; Markewitz, D.; Morris, L.A.; Oliveira, F.A.; Figueiredo, R.O.; Kato, O.R. Five native tree species and manioc under slash-and-mulch agroforestry in the eastern Amazon of Brazil: Plant growth and soil responses. Agrofor. Syst. 2011, 81, 1–14. [Google Scholar] [CrossRef] [Green Version]
  22. Joslin, A.; Markewitz, D.; Morris, L.A.; Assis, F.A.; Kato, O.R. Improved fallow: Growth and nitrogen accumulation of five native tree species in Brazil. Nutr. Cycl. Agroecosyst. 2016, 106, 1–15. [Google Scholar] [CrossRef]
  23. Hölscher, D.; Ludwig, B.; Müller, R.F.; Fölster, H. Dynamic of soil chemical parameters in shifting agriculture in the Eastern Amazon. Agric. Ecosyst. Environ. 1997, 66, 153–163. [Google Scholar] [CrossRef]
  24. Fassbender, H.W.; Beer, J.; Heuveldop, J.; Imbach, A.; Enriquez, G.; Bonnemann, A. Ten year balances of organic matter and nutrients. For. Ecol. Manag. 1991, 45, 173–183. [Google Scholar] [CrossRef]
  25. Joslin, A.H.; Markewitz, D.; Morris, L.A.; Oliveira, F.A.; Figuereido, R.O.; Kato, O.R. Soil and plant N-budget one year after planting of a slash-and-mulch agroforestry system in the Eastern Amazon of Brazil. Agrofor. Syst. 2013, 87, 1339–1349. [Google Scholar] [CrossRef]
  26. Pritchett, W.L.; Comerford, N.B. Long-term Response to Phosphorus Fertilization on Selected Southeastern Coastal Plain Soils. Soil Sci. Soc. Am. J. 1982, 46, 640–644. [Google Scholar] [CrossRef]
  27. Rego, R.S.; Silvam, B.N.R.; Raimundo, S.O. Detailed soil survey in an area in the municipality of Igarapé Açu, Pará. In Summaries of Lectures and Posters, Presented at the 1st SHIFT-Workshop, Belém, Brazil, 8–13 March 1993; Junk, W.J., Bianchi, H., Eds.; Bundesministerium für Forschung und Technologie (BMFT): Geesthact, Germany, 1993. [Google Scholar]
  28. Gee, G.W.; Bauder, J.W. Particle Size Analysis. In Methods of Soil Analysis, 2nd ed.; Klute, A., Ed.; Soil Science Society of America: Madison, WI, USA, 1986; pp. 383–411. [Google Scholar]
  29. Kato, O.R.; Kato, M.S.A.; de Carvalho, C.R.; Figueiredo, R.O.; Sá, T.D.A.; Vielhauer, K.; Denich, M. Manejo de Vegetação Secundária na Amazônia Visando ao Aumento da Sustentabilidade do uso Agrícola do Solo. In Proceedings of the XXX Congresso Brasileiro de Ciência do Solo, Recife, Brazil, 12–22 July 2005. [Google Scholar]
  30. United States Environmental Protection Agency (U.S. EPA). Method 3050B: Acid Digestion of Sediments, Sludges, and Soils, 2nd ed.; United States Environmental Protection Agency: Washington, DC, USA, 1996. [Google Scholar]
  31. Mehlich, A. Determination of P, Ca, Mg, K, Na, NH4; Soil Testing Division Publication No. 1–53; North Carolina Department of Agriculture, Agronomic Division: Raleigh, NC, USA, 1953. [Google Scholar]
  32. Fearnside, P. Wood density for estimating forest biomass in Brazilian Amazonia. For. Ecol. Manag. 1997, 90, 59–87. [Google Scholar] [CrossRef]
  33. Keefe, K.; Schulze, M.D.; Pinheiro, C.; Zweede, J.C.; Zarin, D. Enrichment planting as a silvicultural option in the eastern Amazon: Case study of Fazenda Cauaxi. For. Ecol. Manag. 2009, 258, 1950–1959. [Google Scholar] [CrossRef]
  34. Silva, A.K.L.; Vasconcelos, S.S.; de Carvalho, C.J.R.; Cordeiro, I.M.C.C. Litter dynamics and fine root production in Schizolobium parahyba var. amazonicum plantations and regrowth forest in Eastern Amazon. Plant Soil 2011, 347, 377–386. [Google Scholar] [CrossRef]
  35. Poorter, L. The Relationships of Wood-, Gas- and Water Fractions of Tree Stems to Performance and Life History Variation in Tropical Trees. Ann. Bot. 2008, 102, 367–375. [Google Scholar] [CrossRef] [Green Version]
  36. Cole, T.G.; Ewel, J.J. Allometric equations for four valuable tropical tree species. For. Ecol. Manag. 2006, 229, 351–360. [Google Scholar] [CrossRef]
  37. Menalled, F.D.; Kelty, M.J. Crown structure and biomass allocation strategies of three juvenile tropical tree species. Plant Ecol. 2001, 152, 1–11. [Google Scholar] [CrossRef]
  38. Dreschel, P.; Zech, W. Foliar nutrient levels of broad-leaved tropical trees: A tabular review. Plant Soil 1991, 131, 29–46. [Google Scholar]
  39. Heitz, P.; Dünisch, O.; Wanek, W. Long-Term Trends in Nitrogen Isotope Composition and Nitrogen Concentration in Brazilian Rainforest Trees Suggest Changes in Nitrogen Cycle. Environ. Sci. Technol. 2010, 44, 1191–1196. [Google Scholar] [CrossRef]
  40. Bayala, J.; Mando, A.; Teklehaimano, Z.; Ouedraogo, S.J. Nutrient release from decomposing leaf mulches of karité (Vitellaria paradoxa) and néré (Parkia biglobosa) under semI−arid conditions in Burkina Faso, West Africa. Soil Biol. Biochem. 2005, 37, 533–539. [Google Scholar] [CrossRef]
  41. Ometo, J.P.H.B.; Ehleringer, J.R.; Domingues, T.F.; Berry, J.A.; Ishida, F.Y.; Mazzi, E.; Higuchi, N.; Flanagan, L.B.; Nardoto, G.B.; Martinelli, L.A. The stable carbon and nitrogen isotopic composition of vegetation in tropical forests of the Amazon Basin, Brazil. Biogeochemistry 2006, 79, 251–274. [Google Scholar] [CrossRef]
  42. Kern, J.; Kreibich, H.; Koschorreck, M.; Darwich, A. Nitrogen Balance of a Floodplain Forest of the Amazon River: The Role of Nitrogen Fixation. In Amazonian Floodplain Forests. Ecological Studies (Analysis and Synthesis); Junk, W., Piedade, M., Wittmann, F., Schöngart, J., Parolin, P., Eds.; Springer: Dordrecht, The Netherlands, 2010; Volume 210. [Google Scholar]
  43. Da Costa, K.C.P.; Ferraz, J.B.S.; Bastos, R.P.; Ferreira, M.; Trinidade, A.S.; Piotto, G. Biomass and Nutrients in three species of Parkia plantings on degraded area in Central Amazon. Florestas 2014, 44, 637–646. [Google Scholar]
  44. Yeboah, D.; Burton, A.J.; Astorer, A.J.; OpunI−Frimpong, E. Variation in wood density and carbon content of tropical plantation tree species from Ghana. New For. 2014, 45, 35–52. [Google Scholar] [CrossRef]
  45. Davidson, E.A.; Carvalho, C.J.R.; Vieira, I.C.G.; Figueiredo, R.O.; Moutinho, P.; Ishida, F.Y.; dos Santos, M.T.P.; Guerrero, J.B.; Kalif, K.; Sabá, R.T. Nitrogen and phosphorus limitation of biomass growth in a tropical secondary forest. Ecol. Appl. 2004, 14, S150–S163. [Google Scholar] [CrossRef] [Green Version]
  46. Kettler, J.S. Fallow enrichment of a traditional slash/mulch system in southern Costa Rica: Comparisons of biomass production and crop yield. Agrofor. Syst. 1996, 2, 165–176. [Google Scholar] [CrossRef]
  47. Menge, D.N.L.; Chazdon, R.L. Higher survival drives the success of nitrogen-fixing trees through succession in Costa Rican forests. New Phytol. 2016, 209, 965–977. [Google Scholar] [CrossRef] [PubMed] [Green Version]
  48. Rangel-Vasconcelos, L.G.T.; Kato, O.R.; Vasconcelos, S.S.; Oliveira, F.A. Phosphorus fertilization increases biomass and nutrient accumulation under improved fallow management in a slash-and-mulch system in Eastern Amazonia, Brazil. Revista Brasileira de Ciência do Solo 2017, 41, 1806–9657. [Google Scholar] [CrossRef] [Green Version]
  49. Binkley, D.; Sencok, R.; Cromack, K., Jr. Phosphorus limitation on nitrogen fixation by Falcataria seedlings. For. Ecol. Manag. 2003, 186, 171–176. [Google Scholar] [CrossRef]
  50. Lojka, B.; Preininger, D.; Lojkova, J.; Banout, J.; Polesny, Z. Biomass growth and farmer knowledge of Inga edulis in Peruvian Amazon. Agric. Trop. Et Subtrop. 2005, 38, 44. [Google Scholar]
  51. Joslin, A.; Vasconcelos, S.S.; Oliveira, F.A.; Kato, O.R.; Morris, L.A.; Markewitz, D. Do Nitrogen-fixing Trees in an Improved-Fallow Slash-and-Mulch Agroforestry System affect Nitrous Oxide and Methane Efflux? Glob. Chang. Biol. (under review).
  52. Vitousek, P.M.; Gosz, J.R.; Grier, C.C.; Melillo, J.M.; Reiners, W.A. A Comparative Analysis of Potential Nitrification and Nitrate Mobility in Forest Ecosystems. Ecol. Monogr. 1982, 52, 155–177. [Google Scholar] [CrossRef] [Green Version]
  53. Saatchi, S.S.; Houghton, R.A.; dos Santos Alvalá, R.C.; Soares, J.; Yu, Y. Distribution of aboveground live biomass in the Amazon basin. Glob. Chang. Biol. 2007, 13, 816–837. [Google Scholar] [CrossRef]
  54. Davidson, E.A.; Sá, T.D.A.; Carvalho, C.J.R.; Figueiredo, R.O.; Kato, M.S.A.; Kato, O.R.; Ishida, F.Y. An integrated greenhouse gas assessment of an alternative to slash-and-burn agriculture in eastern Amazonia. Glob. Chang. Biol. 2008, 14, 998–1007. [Google Scholar] [CrossRef]
  55. Staver, C. Shortened bush fallow rotations with relay-cropped Inga edulis and Desmodium ovalifolium in wet central Amazonian Peru. Agrofor. Syst. 1989, 8, 173–196. [Google Scholar] [CrossRef]
  56. Davidson, E.A.; Carvalho, C.J.R.; Figueira, A.M.; Ishida, F.Y.; Ometto, J.P.H.B.; Nardoto, G.B.; Sabá, R.T.; Hayashi, S.N.; Leal, E.C.; Vieira, I.C.G.; et al. Recuperation of nitrogen cycling in Amazonian forests following agricultural abandonment. Nature 2007, 447, 995–998. [Google Scholar] [CrossRef] [PubMed]
  57. Markewitz, D.; Figueiredo, R.O.; Carvalho, C.J.R.; Davidson, E.A. Soil and tree response to P fertilization in a secondary tropical forest supported by an Oxisol. Biol. Fertil. Soils 2012, 48, 665–678. [Google Scholar] [CrossRef]
Figure 1. (a) Map of the Bragantina region, in the northeast of Pará State, Brazil. The study was located in the town in the center of the map, Igarapé Açu; (b) map of the Fazenda Experimental de Igarapé Açu (FEIGA) research station, with the one-hectare plot within FEIGA.
Forests 10 01125 g001
Figure 2. Pictorial representation of site selection, preparation, treatment application, and growth for Rotation 1 and subsequent site preparation for Rotation 2 of a slash-and-mulch improved-fallow agroforestry system.
Forests 10 01125 g002
Figure 3. Groundline diameter and height of five native tree species grown in mixed culture during the first crop–fallow cycle of an improved-fallow slash-and-mulch agroforestry system in Eastern Amazonia of Brazil
Forests 10 01125 g003
Figure 4. GLD and height of five native tree species grown in mixed culture during the second crop–fallow cycle of an improved-fallow slash-and-mulch agroforestry system in Eastern Amazonia of Brazil. Capital letters indicate significant differences for the indicated species by main-plot P + K fertilization treatment.
Forests 10 01125 g004
Figure 5. Agroecosystem N content (kg ha−1) during the final year of Rotation 1 and the first year of Rotation 2 of an improved-fallow slash-and-mulch agroforestry system in Eastern Amazonia of Brazil.
Forests 10 01125 g005
Figure 6. Nitrogen content and biomass (kg ha−1) of Manihot esculenta by root, stem, and leaf compartments measured in Year 1 after the establishment of Rotation 1 (2006) and Rotation 2 (2015) in the crop–fallow system in Eastern Amazonia of Brazil; ** indicates p = 0.07, and *** indicates p < 0.10.
Forests 10 01125 g006
Figure 7. Mulch layer mass and N content of an improved-fallow slash-and-mulch agroforestry system in Eastern Amazonia of Brazil. Site establishment via mulching tractor took place in June 2005 and was abandoned to secondary succession in 2007 before the second rotation was established via mulching tractor in July 2014.
Forests 10 01125 g007
Table 1. Survival rates of five native tree species, mean (SE), planted in an improved-fallow, slash-and-mulch agroforestry system in Pará State, Brazil. Capital letters indicate significant differences in the main-plot (P+K fertilization, Fert), and lower-case letters indicate differences in the sub-plot (I. edulis, Nfix) treatments.
SpeciesTreatment 1 Rotation 1 Rotation 2
2006200720112013 May 201420152016
% Survival (SE)
Cedrela odorataPK− I−85 (18)73 (22)70 (23)53 (25)51 (25) A89 (16)64 (24)
PK− I+82 (20)68 (24)68 (24)55 (26)55 (26) A89 (12)52 (26)
PK+ I−14 (17)11 (16)9 (15)9 (15) 9 (15) B81 (20)42 (25)
PK+ I+10 (15) --- --- --- --- B95 (11)67 (24)
Ceiba pentandraPK− I−100 (0)85 (18)50 (25)33 (24)26 (22) a84 (18)84 (18)
PK− I+100 (0)83 (19)54 (25)25 (22)17 (19) b93 (13)93 (13)
PK+ I−44 (25)44 (25)46 (25)43 (25)41 (25) a80 (19))81 (20)
PK+ I+28 (23)24 (22)20 (20)20 (20)20 (20) b85 (19)85 (19)
Inga edulisPK− I−
PK− I+99 (5)92 (14)72 (23)50 (25)46 (22) A93 (13)84 (19)
PK+ I−
PK+ I+51 (25)47 (25)41 (25)34 (24)27 (22) B89 (16)86 (18)
Parkia multijugaPK− I− 90 (15)87 (17) b
PK− I+91 (15)81 (20)82 (20)76 (22)76 (22) A95 (12)95 (12) a
PK+ I− 85 (18)85 (18) b
PK+ I+19 (20)19 (20)19 (20)76 (22)14 (18) B90 (15)90 (15) a
Schizolobium amazonicumPK− I−62 (25)23 (21)7 (13)2 (7)2 (7) B62 (25)44 (25)
PK− I+71 (23)38 (25)19 (20)5 (11) --- B87 (17)78 (21)
PK+ I−46 (25)42 (25)42 (25)35 (24)35 (24) A83 (19)81 (20)
PK+ I+33 (24)33 (24)33 (24)28 (23)28 (23) A85 (18)78 (21)
1 Treatments are indicated by: P+K fertilization (PK+) or without (PK−) in the main-plot, and the presence of Inga edulis and Parkia multijuga in the planting mix (I+) or without (I−).
Table 2. Statistical output of ground line diameter (GLD), diameter at breast height (DBH), and height data for five species of native trees grown during two crop–fallow rotations in a 12-year-old slash-and-mulch improved-fallow agroforestry system in Eastern Amazonia of Brazil.
All SpeciesCedrela odorateCeiba pentandraInga edulisParkia multijugaSchizolobium amazonicum
VariableGLDDBHHeightGLDDBHHeightGLDDBHHeightGLDDBHHeightGLDDBHHeightGLDDBHHeight
Pr > FPr > FPr > FPr > FPr > FPr > F
Rotation 1Fert 10.004 *0.003 *0.001 *0.25.0.60.08 +0.03 *0.02 *0.01 *0.003 *0.008 *0.550.30.40.007 *0.01 *0.004 *
Nfix 20.03 *0.40.005 *0.94.0.170.60.180.8 0.30.90.18
Date<0.001 *<0.001 *<0.001 *<0.001 *.<0.001 *<0.001 *<0.001 *<0.001 *<0.001 *<0.001 *<0.001 *<0.001 *<0.001 *<0.001 *<0.001 *<0.001 *<0.001 *
Fert*Nfix0.004 *0.001 *0.001 *0.7.0.080 +>0.90.10 +0.18......0.50.41.0
Fert*Date<0.001 *<0.001 *<0.001 *0.8.0.5<0.001 *0.001 *<0.001 *<0.001 *<0.001 *<0.001 *0.20.50.3<0.001 *0.03 *<0.001 *
Nfix*Date<0.001 *<0.001 *<.001 *0.3.0.70.80.30.5 0.30.20.3
Fert*Nfix*Date0.02 *0.40.30.01 *.0.110.20.50.04 *......0.03 *0.40.4
Rotation 2Fert0.07 +0.06 +0.02 *0.09 +.0.190.07 +0.02 *0.03 *0.140.40.20.08 +0.40.07 +0.04 *0.20.02 *
Nfix0.02 *0.90.01 *0.9.0.40.60.03 *0.7...0.90.71.00.81.00.7
Date<0.001 *0.3<0.001 *<0.001 *.<0.001 *<0.001 *0.02*<0.001 *<0.001 *0.83<0.001 *<0.001 *0.002*<0.001 *<0.001 *<0.001 *<0.001 *
Fert*Nfix0.70.80.130.19.0.140.20.01 *0.4...0.20.07 +0.140.70.60.3
Fert*Date<0.001 *0.6<.001 *0.3.0.05 *0.01 *0.05 *0.02 *0.11.0.004 *0.002 *0.02 *<0.001 *<0.001 *0.05 *<0.001 *
Nfix*Date0.02 *0.40.60.8.1.00.40.002 *0.3...0.40.120.60.90.71.0
Fert*Nfix*Date0.90.40.009 *0.5.0.90.60.004 *0.9...1.00.06 +0.30.90.40.08 +
1 Fert is the main-plot treatment of P+K fertilization, or without. 2 Nfix is the sub-plot treatment inclusion of the N-fixing tree species Inga edulis in the planting mix, or not; * indicates significant difference at the p < 0.05 level; + indicates significant difference at the p < 0.10 level.
Table 3. Soil C and N concentrations by depth increments in an improved-fallow slash-and-mulch agroforestry system in Eastern Amazonia, Brazil. Site establishment via mulching tractor took place in June 2005 and was abandoned to secondary succession in 2007 before the second rotation was established via mulching tractor in July 2014.
DateFertNfixDepthCN
cm% (SE)
May 2014NN0–101.20 (0.07)0.08 (0.00)
10–200.80 (0.07)0.06 (0.00)
NY0–101.08 (0.25)0.11 (0.02)
10–200.89 (0.08)0.07 (0.00)
YN0–101.39 (0.03)0.09 (0.01)
10–200.81 (0.05)0.06 (0.00)
YY0–101.31 (0.07)0.09 (0.01)
10–200.84 (0.03)0.06 (0.00)
July 2015NN0–101.50 (0.08)0.08 (0.00)
10–200.77 (0.01)0.04 (0.00)
NY0–101.34 (0.14)0.07 (0.01)
10–200.72 (0.03)0.07 (0.03)
YN0–101.56 (0.19)0.08 (0.01)
10–200.73 (0.03)0.04 (0.00)
YY0–101.44 (0.07)0.08 (0.00)
10–200.86 (0.03)0.05 (0.00)
Table 4. Soil P and K concentrations at the 0–10 cm horizon in a slash-and-mulch agroforestry system in Eastern Amazonia of Brazil; ** indicates statistical significance in the main-plot treatment within the year, and + indicates statistical significance in the sub-plot N-fixer treatment within the year.
YearTreatmentPK
mg kg−1 (SE)
2013PK−I−1.01 (0.02)5.91 (0.48)
PK−I+1.04 (0.06) +6.38 (0.84)
PK+I−1.25 (0.11) **6.62 (1.01)
PK+I+1.53 (0.08) ** +7.15 (0.37)
2014PK−I−0.82 (0.10)12.47 (1.36)
PK−I+0.72 (0.06)12.29 (1.93)
PK+I−1.06 (0.06)13.31 (1.98)
PK+I+1.25 (0.05)14.28 (2.41)
2015PK−I−0.99 (0.04)5.86 (0.68)
PK−I+1.11 (0.07) +6.94 (0.83)
PK+I−1.31 (0.16)6.75 (0.75)
PK+I+1.41 (0.06) +5.82 (0.37)
Table 5. Predictors of height, biomass and N content after the first rotation for five native tree species grown in a mixed-culture, crop-fallow agroforestry system in eastern Amazonia of Brazil. Trees and crops were initially planted in 2005, abandoned to secondary succession in 2007 until 2014, when the second rotation of the crop–fallow system was planted and subsequently abandoned to secondary succession in 2016.
Dependent variableIndependent VariableSample DatePartial R 2Model R 2C(p)F ValuePr > F
HeightSoil P5/2014 10.4810.481−1.67313.00.003 *
Soil P7/2015 20.5910.591−0.79120.20.0005 *
Soil Al0.0590.650−0.4052.20.163
Soil PBy Date30.5660.56615.88118.30.0008 *
Soil Ca0.2250.7913.42814.00.003 *
Soil Al0.0570.8481.7754.50.056†
Sum BiomassSoil P5/20140.2380.238−2.92514.40.0004 *
Soil P7/20150.1280.128−2.57910.30.002 *
Soil P0.3120.312−2.57221.4<0.0001 *
Sum NSoil P5/20140.2090.209−3.56412.20.001 *
Soil P7/20150.1140.114−2.9869.00.004 *
Soil PBy Date0.3020.302−1.96720.3<0.0001 *
1 Sampling Date 5/2014 was the final sampling event of Rotation 1, 9 Years after site establishment; 2 Sampling Date 7/2015 was Year 1 sampling event of Rotation 2, 10 years after site establishment; 3 By Date represents regression analyses of 3 sampling events in 7/2013, 5/2014, and 7/2015. *indicates significant difference at the p < 0.05 level; †indicates significant difference at the p < 0.10 level.
Table 6. Multivariate regression analysis of biomass and N Content of five species of native trees grown in a mixed-culture, crop-fallow agroforestry system in eastern Amazonia of Brazil. Trees and crops were initially planted in 2005, abandoned to secondary succession in 2007 until 2014, when the second phase of the crop–fallow system was planted and subsequently abandoned to secondary succession in 2016.
Dependent VariableSpeciesIndependent VariableModel R 2C(p)F ValuePr > F
Sum BiomassCedrela odorataSoil K0.5335.311.40.007
Soil C0.6045.21.60.2
Ceiba pentandraSoil P0.32315.35.70.03
Soil K0.49610.93.80.08
Inga edulisSoil Mg0.5969.12.50.15
Soil P0.921.70.4<0.001
Soil N0.955.3.70.11
Parkia multijugaSoil P0.802.16.20.02
Soil N0.972.18.20.02
Soil K0.999.71.30.01
Soil Al1.000.44.00.095
Schizolobium amazonicumSoil P0.1988.21.70.2
Sum Biomass NCedrela odorataSoil K0.4557.28.30.02
Soil C0.5556.42.00.2
Ceiba pentandraSoil P0.32315.45.70.03
Soil K0.49610.93.80.08
Soil Mg0.5969.12.50.15
Inga edulisSoil P0.919.68.4<0.001
Soil N0.948.2.80.16
Parkia multijugaSoil P0.675.8.30.05
Soil N0.935.12.00.04
Soil K0.975.3.20.2
Schizolobium amazonicumSoil P0.1988.21.70.2
Table 7. Multivariate regression analysis of soil and mulch layer nutrient concentrations and contents against planted tree GLD, DBH, and height in an improved-fallow slash-and-mulch agroforestry systems in Eastern Amazonia, Brazil. Rotation 1 extended from site preparation and planting in 2005 until 2014, and Rotation 2 measurements extended from clearing of secondary forest and re-planting the site in 2014 until the final measurement in 2015.
SpeciesVariableRotation GLDDBHHeight
Parameter EstimatePartial R 2F ValuePr > FParameter EstimateModel R 2F ValuePr > FParameter EstimateModel R 2F ValuePr > F
Cedrela odorataSoil1C:N0.1010.3776.70.03
P (%) 1.4100.3495.40.04
Ca (%) 1.3750.1923.80.08
2K (%)0.2900.3126.30.02
C:N 0.7430.55610.00.01
Mulch1
2C:N0.0040.2615.00.04 0.0180.43610.80.005
Ceiba pentandraSoil1P (%)1.3610.60519.90.00063.3080.71232.2<.00012.3400.70230.7<.0001
2P (%)1.7740.3126.40.022.0950.2444.50.051.8710.3096.30.03
Mulch1P (%)1.4960.49212.60.0042.9990.3948.50.012.0600.56617.00.001
2C:N 0.0130.0983.50.09
Inga edulisSoil1P (%)1.9690.79523.20.0031.6830.35330.80.0031.1090.72115.50.008
K (%)−1.8610.1065.30.07
2C:N0.0360.70614.40.0090.2190.5710.60.05−0.2490.80524.80.003
Ca (%) −0.9710.2460.80.08
Mulch1P (%) 2.2750.45218.40.008
K (%) −1.8580.4254.40.08
2C:N0.0020.78722.10.003 −0.0160.83229.60.002
Parkia multijugaSoil1P (%) 0.3180.1476.50.06
Mg (%) 0.2980.07414.00.03
Al (%) −0.8420.76416.10.01
2Al (%)−1.4830.3457.40.02−3.3640.3016.00.03−2.0290.2865.60.03
K (%) 2.3690.2838.90.011.1780.1643.90.07
Schizolobium amazonicumSoil1P (%)0.5910.77043.4<.00013.0180.63622.70.00044.7490.73736.5<0.0001
C:N0.1090.0574.00.07 0.2580.0613.60.08
2P (%)0.2910.58920.10.00050.9350.1554.40.061.8240.57919.20.0006
C (%)0.3390.1678.90.01
N (%) 1.4050.4199.40.0090.9970.1134.70.05
Mulch1P (%)3.4330.3988.60.01 4.0570.4169.30.009
2C:N−0.0170.3296.90.02 −0.0220.3798.60.01

