Article

Changes in Soil Microbial Biomass, Community Composition, and Enzyme Activities After Half-Century Forest Restoration in Degraded Tropical Lands

1
Key laboratory of Vegetation Restoration and Management of Degraded Ecosystem, South China Botanical Garden, Chinese Academy of Sciences, Guangzhou 510650, China
2
Center for Plant Ecology, Core Botanical Gardens, Chinese Academy of Sciences, Guangzhou 510650, China
3
Southern Marine Science and Engineering Guangdong Laboratory (Guangzhou), Guangzhou 510301, China
4
College of Resources and Environment, University of Chinese Academy of Sciences, Beijing 10049, China
5
Department of Biological Sciences, Tennessee State University, Nashville, TN 37209, USA
*
Authors to whom correspondence should be addressed.
Forests 2019, 10(12), 1124; https://doi.org/10.3390/f10121124
Submission received: 5 November 2019 / Revised: 1 December 2019 / Accepted: 5 December 2019 / Published: 9 December 2019
(This article belongs to the Section Forest Ecology and Management)

Abstract

:
Soil carbon (C) sequestration and stabilization are determined by not only the C input to the soil but also the decomposition rate of soil organic matter (SOM), which is mainly mediated by soil microbes. Afforestation, an effective practice to restore forests from degraded or bare lands, may alter soil microbial properties, and thus soil C and nitrogen (N) dynamics. The aim of this study was to investigate the impacts of different afforestation strategies on soil microbial compositions and activities after afforestation for half a century. Soil samples were collected from two afforested sites (i.e., a restored secondary forest (RSF) and a managed Eucalyptus forest (MEP)) and two reference sites (i.e., a nearby undisturbed forest (UF), representing the climax vegetation and a bare land (BL), representing the original state before restoration) in south China. We quantified the soil microbial biomass, microbial community compositions, and activities of nine extracellular enzymes at different soil depths and in different seasons. Results showed that the soil microbial biomass, all the main soil microbial groups, and the activities of all extracellular enzymes were significantly increased after afforestation compared to the BL sites, while the ratios of fungi/bacteria (F/B), specific enzyme activities, and the ecoenzymatic stoichiometry were significantly decreased regardless of the season and soil depth. Between the two afforested sites, these microbial properties were generally higher in the RSF than MEP. However, the microbial properties in the RSF were still lower than those in the UF, although the differences varied with different seasons, soil depths, and microbial groups or enzymes. Our findings demonstrated that afforestation might significantly improve microbial properties. Afforestation is more effective in mixed-species plantation than in the monoculture Eucalyptus plantation but needs a much longer time to approach an equivalent level to the primary forests.

Graphical Abstract

1. Introduction

Soil degradation due to deforestation creates a series of issues, such as ecosystem carbon (C) losses, low productivity, and decreases in biodiversity [1,2]. Reforestation or afforestation has been considered as one of the most effective methods to alleviate these issues [3,4]. Many countries, including China, have established national programs to increase plantation areas and have successfully increased the areas of vegetation [5,6,7]. Numerous studies have demonstrated that C stocks in plant biomass and soil can rapidly increase with afforestation [8,9] and recover to an equivalent level to the nearby undisturbed forests within a few decades [10]—particularly in tropical regions, where the consistent warm temperature and ample rainfall favor rapid plant growth [7]. However, there are also many restoration projects that achieved very limited success or failed completely [11,12], mostly due to the nutrient limitation, poor tree species selection, and a lack of understanding of the plant-soil-microbe interaction [13,14,15,16]. Studies regarding the influence of afforestation on soil C and nutrient pools have been conducted extensively in recent years; however, how the microbial properties will change with afforestation are still not well understood [17,18], which may have important implications for ecosystem function and stability in these restored forests.
Soil microorganisms play an indispensable role in ecosystem services, such as C sequestration and nutrient cycling, by degrading and transforming plant debris and organic compounds [19,20,21]. For instance, the soil microbial biomass can be used as a general index of the organic matter turnover rate in the soil [22]. Different microbial communities play different roles in the process of degradation. Fungi (F) prefer organic matter with a more complex structure, while bacteria (B) prefer labile C compounds [21,23,24]. A higher ratio of F/B is often linked to the higher C storage potential [25,26,27]. In addition, the processes of degradation and transformation of soil C and nutrients are actually mediated by the extracellular enzymes, which are secreted by soil microorganisms [21,28,29,30]. Enzyme activities provide a useful linkage between soil microbial community composition and organic matter turnover [31] and become an indicator of soil nutrient limitation and availability. As such, a better understanding of soil microbial biomass, community composition, and enzyme activities is critical for the long-term C accumulation and sustainable development of restored forest ecosystems [32].
The growth, activity, size, and composition of soil microorganisms are affected by abiotic and biotic factors, including tree species, the quality and quantity of organic matter input, soil properties (such as soil pH, moisture, temperature, and nutrient), and physical disturbance [33,34,35]. Various soil-dwelling arthropods alter soil microbial communities and associated soil functions [36]. Likewise, soil microbial communities and associated enzyme activities depend on the chemical composition of plant chemistry and their chemical composition [37,38]. All of these factors may be altered by afforestation (e.g., changes in tree composition) and silvicultural techniques (e.g., residue management). Studies have indicated that soil microbial properties are usually improved with afforestation, but whether they could be recovered to equivalence to the nearby undisturbed forests remains controversial [39,40]. For example, Jangid et al. [41] reported that after 50 years of afforestation on croplands, the soil microbial community composition was restored to a similar level to the primary forests, and the recovery rate was faster than those for aboveground vegetation and soil properties. However, Ananbeh et al. [18] found that, even after nearly 100-year forest restoration, the activities of soil extracellular enzymes at the afforested sites were still lower than those at the primary forests. These inconsistent results might be primarily related to multiple factors, such as the climate, soil type, previous land use, and tree species planted [42]. Furthermore, most of these studies have been conducted in temperate and boreal regions [39,40], and there has been very limited information regarding the impact of afforestation on the soil microbial community in tropical regions, particularly in relation to long chronosequences (over 50 years) of forest restoration.
Here, we investigated changes in soil microbial properties after forest restoration. We selected a bare land (BL) as a control, two forest sites afforested over a half-century (a managed Eucalyptus plantation (MEP) and a restored secondary forest (RSF)), and a nearby undisturbed forest (UF, representing the climax vegetation) in a tropical region of China. Our previous work at these sites demonstrated that C stocks in plant biomass and topsoil (0–10 cm) increased significantly after half-century forest restoration, particularly for the RSF site, which approached equivalence to those in the UF. In this study, we focused on detecting the changes of soil microbial properties after afforestation and quantified the soil microbial biomass, microbial community compositions, and the activities of nine extracellular enzymes. We addressed the following three questions in this study: (1) How were microbial properties changed after afforestation over the half-century? (2) Did the changes of microbial properties vary with different restoration strategies? (3) Could the microbial properties at the restored secondary forest recover equivalence to the nearby undisturbed forest? The findings of this study would be useful in selecting adequate tree species and assisting in the better restoration of degraded lands in the future.

2. Materials and Methods
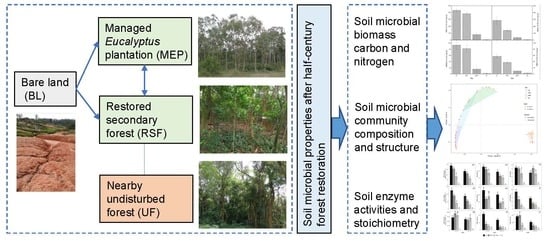
2.1. Study Site

The study site is located at the Xiaoliang Tropical Ecosystem Research Station of the Chinese Academy of Science in Guangdong province of China (21°27′49″ N, 110°54′18″ E). The site has suffered severe soil erosion and is characterized by low vegetation coverage [43]. The mean annual temperature is 23 °C, and the annual precipitation ranges from 1400 mm to 1700 mm [44,45]. The period from October to April is the dry season, and that from May to September is the wet season. Almost 75.8% of precipitation concentrates in the wet season with typhoon rain [46]. The original topsoil almost completely lost due to strong erosion caused by long-term anthropogenic disturbances. The soil is low in water content and poor in nutrients [43]. It is lateritic and formed from highly weathered granite [44]. The highest elevation is about 50 m [46].
To restore the degraded land, scientists launched an afforestation campaign in 1959 and established two types of artificial forests and one bare land (BL) as a control in three geographically similar catchments [9,43]. The two forests include a managed Eucalyptus (Eucalyptus exserta) plantation (MEP) and a restored secondary forest (RSF). The Eucalyptus forest was restored with Eucalyptus exserta seedlings in the early 1960s, and the rotating and harvesting were performed every 5–8 years. The restored secondary forest, which is a broad-leaved mixed-species plantation, was established on the basis of the Eucalyptus forest, but all the Eucalyptus were clear-cut in 1974 and forested with 312 native tree species, and it was eventually developed into a restored secondary forest. We also selected a nearby undisturbed forest (UF, a zone forest type that has been preserved by residents for about 200 years) as a reference site. Some more detailed description of the species richness and diversity can be found in previous studies [9,47,48].

2.2. Soil Sampling

Soil samples at 0–10 cm and 10–20 cm depths were collected during a rainless period in the dry season and a rainy period in the wet season in November 2016 and June 2017, respectively. Six plots (20 m × 20 m) were randomly set up at each research site, and one composite sample was collected randomly from five cores in each plot. Soil samples were sealed in airtight polyethylene bags and were stored in an icebox before being moved to the laboratory. In the laboratory, visible roots and stones were picked out using forceps from the field-moist soil, and the remaining soils were passed through a 2 mm diameter screen sieve. A subsample of fresh soil sample was freeze-dried and used for phospholipid fatty acid (PLFAs) analysis. Another subsample of fresh soil was kept chilled at 4 °C and used for the analyses of microbial biomass using the chloroform-fumigation extraction method, and the enzyme activities were determined using micro-plate fluorometric assay within two weeks.

2.3. Soil Physicochemical Analysis

The concentrations of total C (TC) and N (TN) in the soil were assessed by dry combustion (Vario ISOTOPE CUBE, Elementary, Hanau, Germany) in June 2017. The soil water content was measured gravimetrically using 10 g of field moist soil sample oven-dried at 105 °C for 24 h in the two seasons (November 2016 and June 2017).

2.4. Soil Microbial Biomass

Soil microbial biomass carbon and nitrogen (MBC and MBN) were determined by the fumigation-extraction method [49]. Soil samples (15 g) were fumigated with ethanol-free chloroform for 24 h at 25 °C in an evacuated extractor. A subsample of the same quality was treated as a control. Fumigated and non-fumigated soils were extracted with 50 mL 0.5 mol L−1 K2SO4 and shaken for 1 h in a reciprocal shaker. The extracts were filtered using Whatman filter paper with a diameter of 11 cm and analyzed within one week. The conversion factors for the calculation of MBC and MBN were 0.45 and 0.54, respectively [49,50].

2.5. Phospholipid Fatty Acids Analyses

Phospholipid fatty acid (PLFA) content was determined using the method of Bossio and Scow [51] and Fang et al. [52]. Fatty acid nomenclature used is as follow: total number of C atoms: number of double bonds, followed by the position of the double bond from the methyl end of the molecule [51]. The prefixes a, i, and cy refer to anteiso, iso, and cyclopropyl branching fatty acids, respectively; while a number followed by Me indicates the position of a methyl group [53]. Briefly, PLFAs were extracted from 8 g of freeze-dried soil, fractionated, and analyzed. The concentration of each PLFA was calculated based on the 19:00 internal standard concentrations. Soil microbial community composition was investigated on the basis of specific PLFAs for different microbial groups. PLFAs for Gram-positive (G+) bacterial biomass were a15:0, i15:0, i16:0, a17:0, and i17:0. Gram-negative (G−) bacterial biomass was identified by the PLFAs: 16:1ω7c, 17:0cy, and 18:1ω7c. We calculated the sum of G+ and G− bacterial biomass and 15:00 and 17:00 as indicators of bacterial biomass [53,54]. The abundance of fungal PLFAs were represented by the summing up of 18:1ω9c and 18:2ω6c PLFA biomarkers. The methylic, mid-chain-branched saturated PLFA 10Me 16:0, 10Me 17:0, and 10Me 18:0 were used as indicators for actinomycetes (ACT) [55]. The F/B ratio was calculated by dividing the total fungal PLFAs by total bacterial PLFAs. The PLFA 16:1ω5c was used as a marker of arbuscular mycorrhizal fungi (AMF) [56]. The total PLFAs of soil microbial community, which is an index of living microbial biomass, were the sum of all the above PLFAs.

2.6. Soil Enzyme Activities Analysis

Soil enzyme activities and the physicochemical analysis were measured on soil collected in June 2017. The enzyme assay method was adopted from the works of Bell et al. [57] and Wang et al. [58]. Nine extracellular enzymes (Cellobiohydrolase (CBH), β-1,4-glucosidase (βG), α-1,4-glucosidase (αG), β-1,4-xylosidase (XYL), β-N-acetylglucosaminidase (NAG), leucine aminopeptidase (LAP), acid phosphatase (ACP), peroxidase (Perox), and phenol oxidase (PhOx)) were measured for the soil samples collected at all four sites. The functions and substrates, according to Caldwell [59] and Sinsabaugh [60], are shown in Table 1. In total, 1.5 g field fresh soil (except for the BL, for which it was 2.75 g) and 100 mL sodium acetate (pH = 5.0) buffer were homogenized using a Midea blender; then, the soil slurry was dispensed into 96-well microplates. There were three replicates for each sample well, and eight replicates for each blank and negative well. The deep-well plates were incubated in the dark at 20 °C for 3 h for C- and N-cycling enzymes and for 1 h for the P-cycling enzyme. Fluorescence was measured using 365 nm extraction and 450 nm emission filters. Perox and PhOx were measured spectrophotometrically (450 nm) using L-3,4-dihydroxyphenylalanine (DOPA). However, PhOx was incubated in the dark (20 °C) for 24 h, and Perox was for 8 h. The absolute activities of all enzymes were expressed in units of nmol g−1 soil h−1. To decouple changes in absolute enzyme activity from changes in soil organic matter contents, we further calculated the specific enzyme activities (μnmol mg C−1 h−1) by dividing the absolute enzyme activity (nmol g−1 soil h−1) by the soil total C MBC (mg kg−1). The specific enzyme activity allows a reliable comparison of soil with different land-use types [61] and can give an insight into the nutritional status of the organic matter regarding soil microorganisms [62].

2.7. Statistical Analysis

Prior to data analysis, the normality of the data was tested using the Kolmogorov–Smirnov test, and the homogeneity of the variances was tested with Levene’s test. An sqrt(x) transformation was applied to meet normality and homogeneity when necessary. The difference among four sites at the same soil depth and in the same season was tested using one-factor ANOVA. The effects of the research site, season, and their interactions on the measured variables were tested using a two-factor ANOVA. Further data analysis was performed to evaluate significant differences (LSD’s test) at the same depth and in the same season. Analysis for all data was carried out using IBM SPSS Statistics 21.0 for Windows (IBM Corp., Armonk, NY, USA). The PCoA (principal coordinates analysis) analyses were performed using the R software (version 3.6.1) “vegan” package, and the figure was generated with it. All results were reported as means ± standard errors (SE). Significance was considered if p < 0.05.

3. Results

3.1. Soil Physicochemical Characteristics and Microbial Biomass

Soil water content, TC, and TN contents increased following afforestation and showed significant differences among the four research sites (p < 0.001, Table 2). However, the ratio of C/N in the three forest sites showed no difference irrespective of soil depths. Soil water content showed a significant difference in different seasons (p < 0.001, Table S1). Compared to the UF, the two seasons’ and two soil depths’ average values of soil water content in RSF, MEP, and BL declined by 9.81%, 53.87%, and 51.42%, respectively (Table 2). TC and TN contents in the RSF even reached a similar level at 0–10 cm soil depth compared to the UF (Table 2).
There was a significant difference in the soil microbial biomass C and N with respect to soil depths and forest sites (p < 0.05, Table 3). Among different sites, although not always significant, the MBC and MBN were generally higher in UF, RSF, and MEP compared to BL (Table 3). The values of MBC and MBN were found to be in the order of UF > RSF > MEP > BL at both depths (Table 3, p < 0.05). However, no significant differences in MBC and MBN were detected between the UF and RSF at 0–10 cm soil depth in the wet season (Table 3). There was also no difference in MBC and MBN between the MEP and BL in the dry season (Table 3). Compared to MEP, MBC and MBN were significantly increased in the RSF by 406.80% and 405.62% at 0–10 cm soil depth and 444.30% and 346.07% at 10–20 cm soil depth, respectively. On a seasonal basis, the microbial biomass was higher in the wet season compared to that in the dry season (Table 3, Table S1). No significant interaction effects between sites and seasons were found (Table S1).

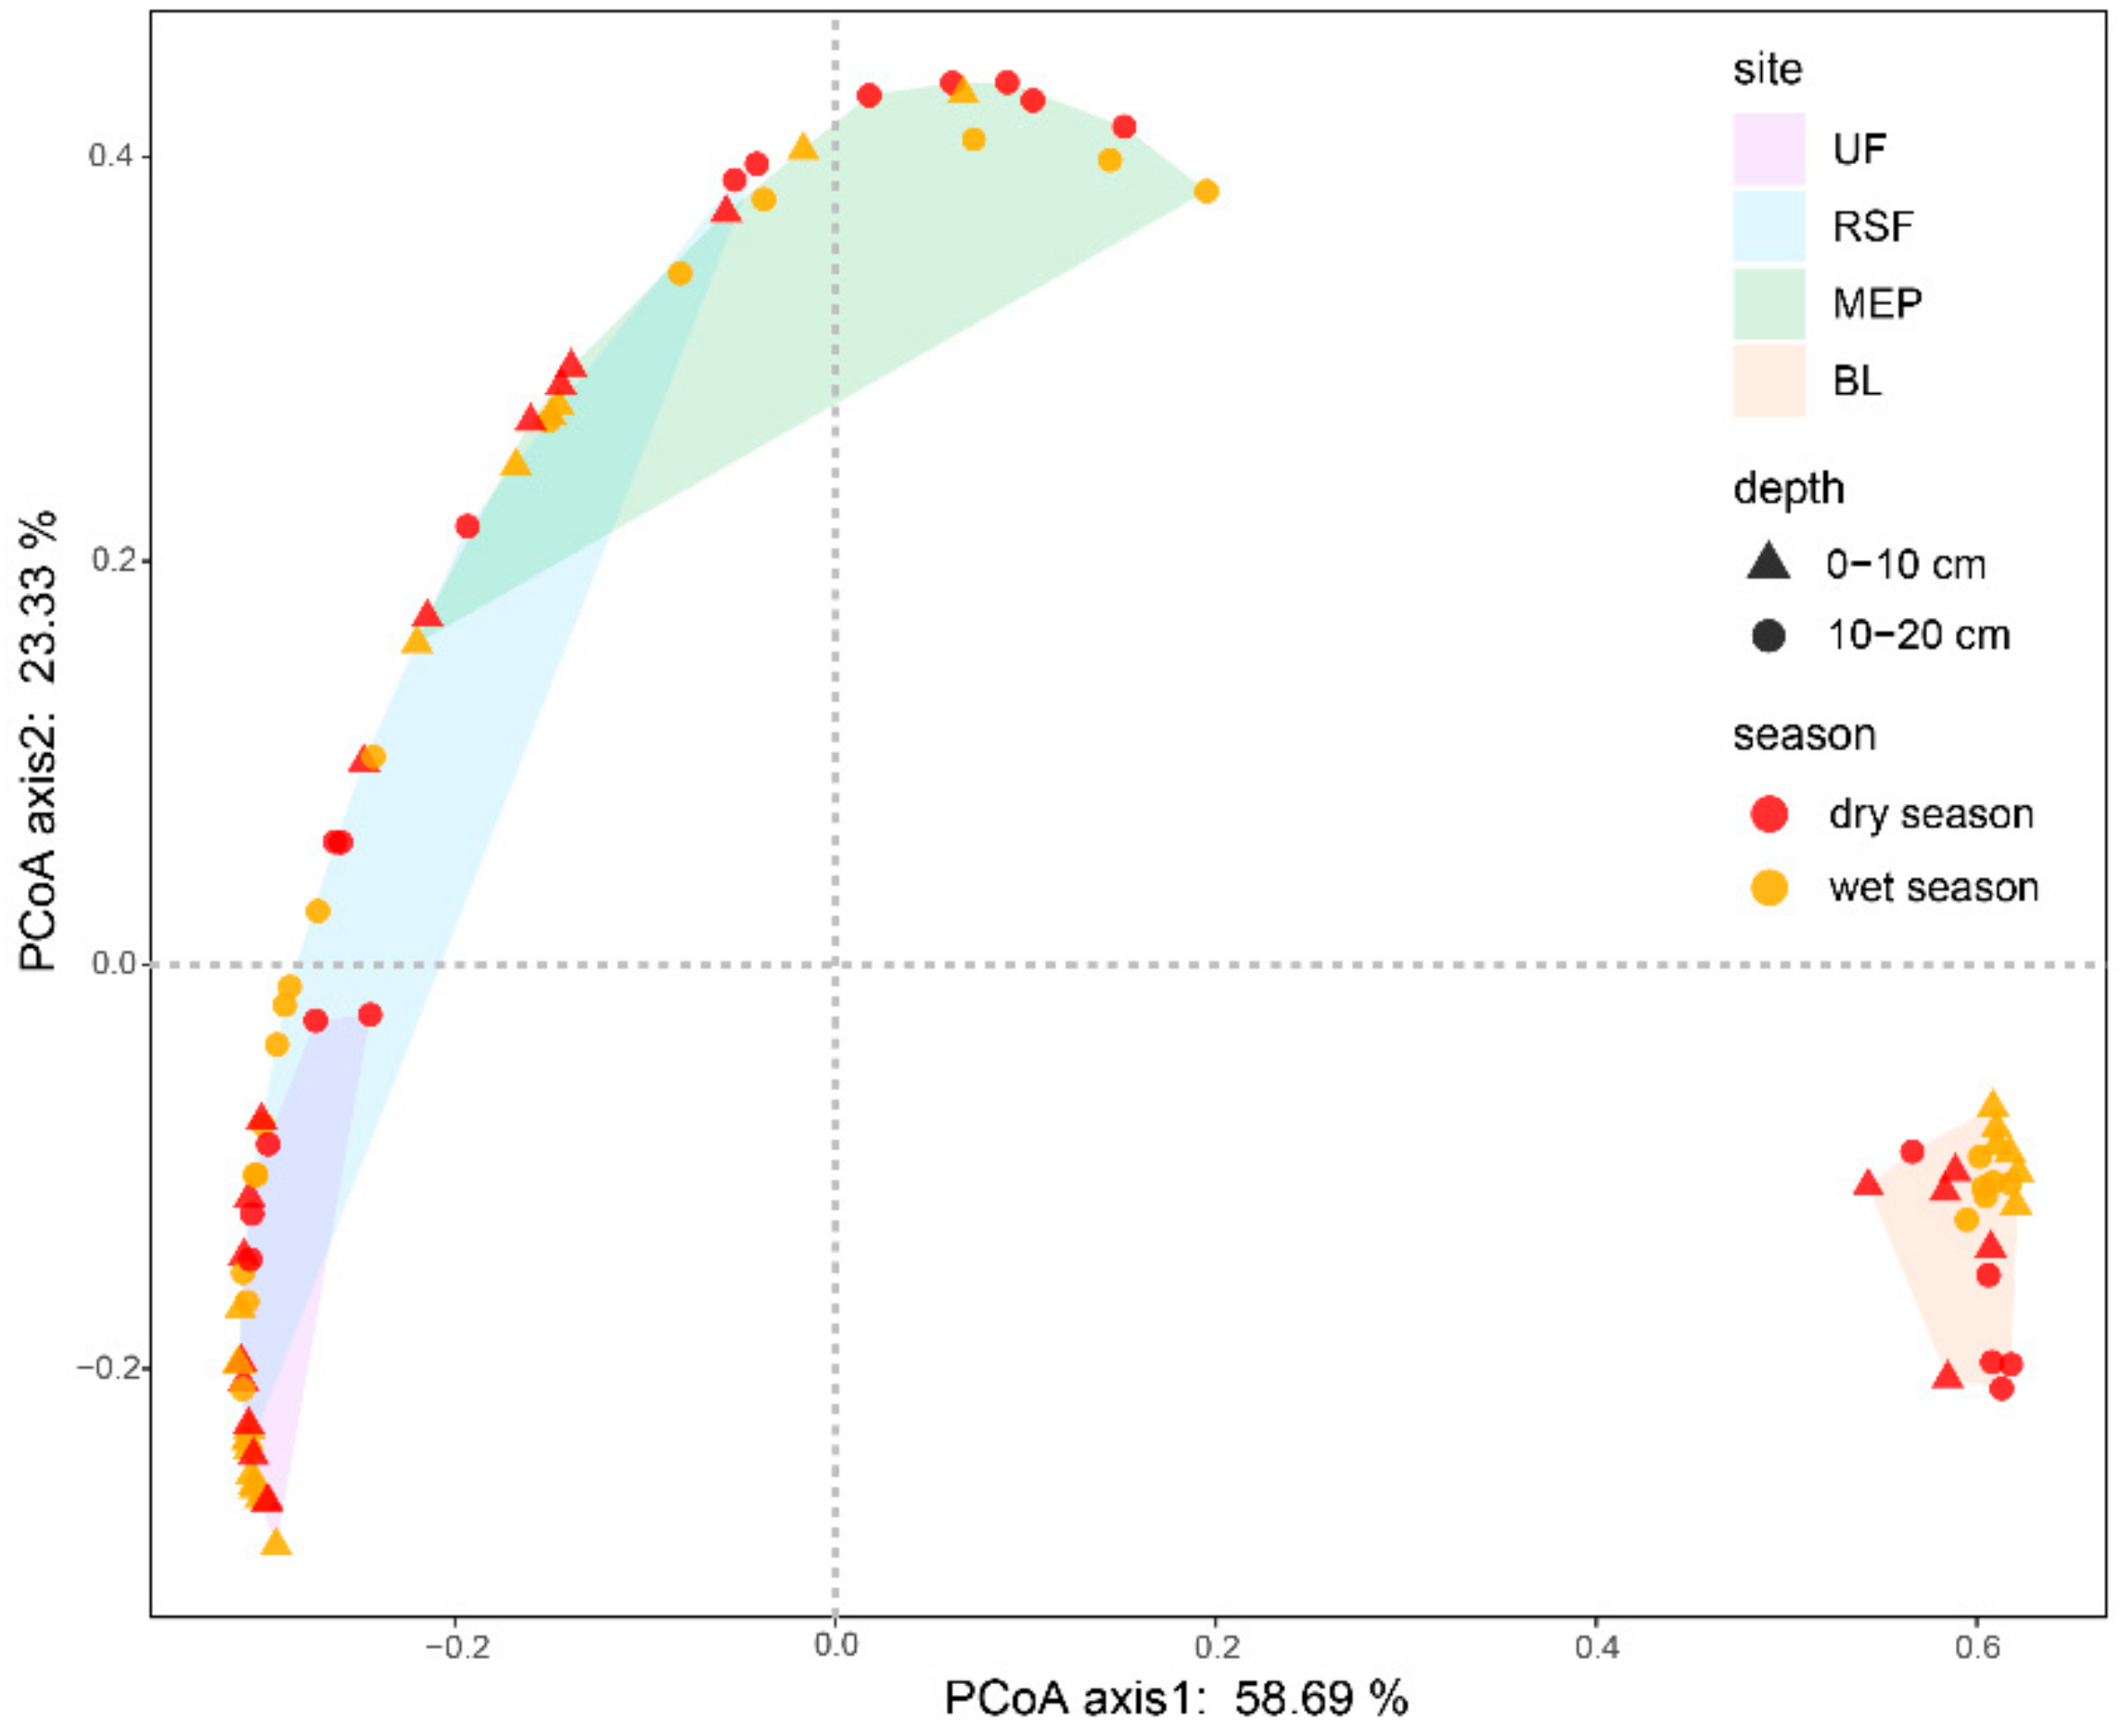
3.2. Soil Microbial Community Abundance and Structure

The absolute abundances of total PLFAs and different microbial groups were significantly higher at the three forest sites than the BL with respect to the seasons and soil depths (p < 0.001, Table 4). There were significant differences in the absolute abundances of microbial groups among the four sites (Table 4, Table S2), however, no significant interaction effects were found between sites and seasons (Table S2). They also increased more at 0–10 cm soil depth than 10–20 cm soil depth or in the wet season compared with the dry season (Table 4). Compared to the dry season, the absolute abundance of total PLFAs and different microbial groups were significantly increased except for the MEP at 0–10 cm soil depth in the wet season, although they still showed the lowest level at the BL site (Table 4). Both the total PLFAs and different individual microbial groups showed a similar pattern, with higher values at the afforested sites than at the BL site. G− bacterial PLFAs and fungal PLFAs at the RSF site were even averagely increased by 6.42% and 9.56%, respectively; relative to the UF (4.52 ± 0.13 nmol g−1 soil and 6.59 ± 0.28 nmol g−1 soil, respectively) in the wet season surface soil, there was no significant difference between these two sites (Table 4).
The ratios of F/B and G+/G− bacteria showed the opposite trends, in that the values of the BL were higher than the forest sites, especially in the wet season (Table 4). In the dry season, there was no significant difference between the RSF and MEP of the F/B and G+/G− bacteria ratios (Table 4). There were significant differences among the four sites in the relative abundances of different microbial groups (Table 5, Table S3). The relative abundances of ACT showed no significant difference at different soil depths or in different seasons among the three forest sites (Table 5). Bacterial PLFAs accounted for more than 50% of the total PLFAs at all sites except for the BL in the wet season (Table 5). Furthermore, the relative abundances of F at the BL site in the dry season and the relative abundances of ACT at the BL site in the wet season were much higher compared to the other three sites (Table 5).
The PCoA analyses were conducted with 16 PLFAs at two depths sampled in the dry season (November 2016) and wet season (June 2017) (Figure 1). PLFA profiles showed significant separation among the sites—especially the BL, which was distant from the other forest sites. The UF and MEP sites also had significant differences. The PCoA in the two seasons showed that PCoA1 and PCoA2 accounted for 58.69% and 23.33% of the total variance, respectively.

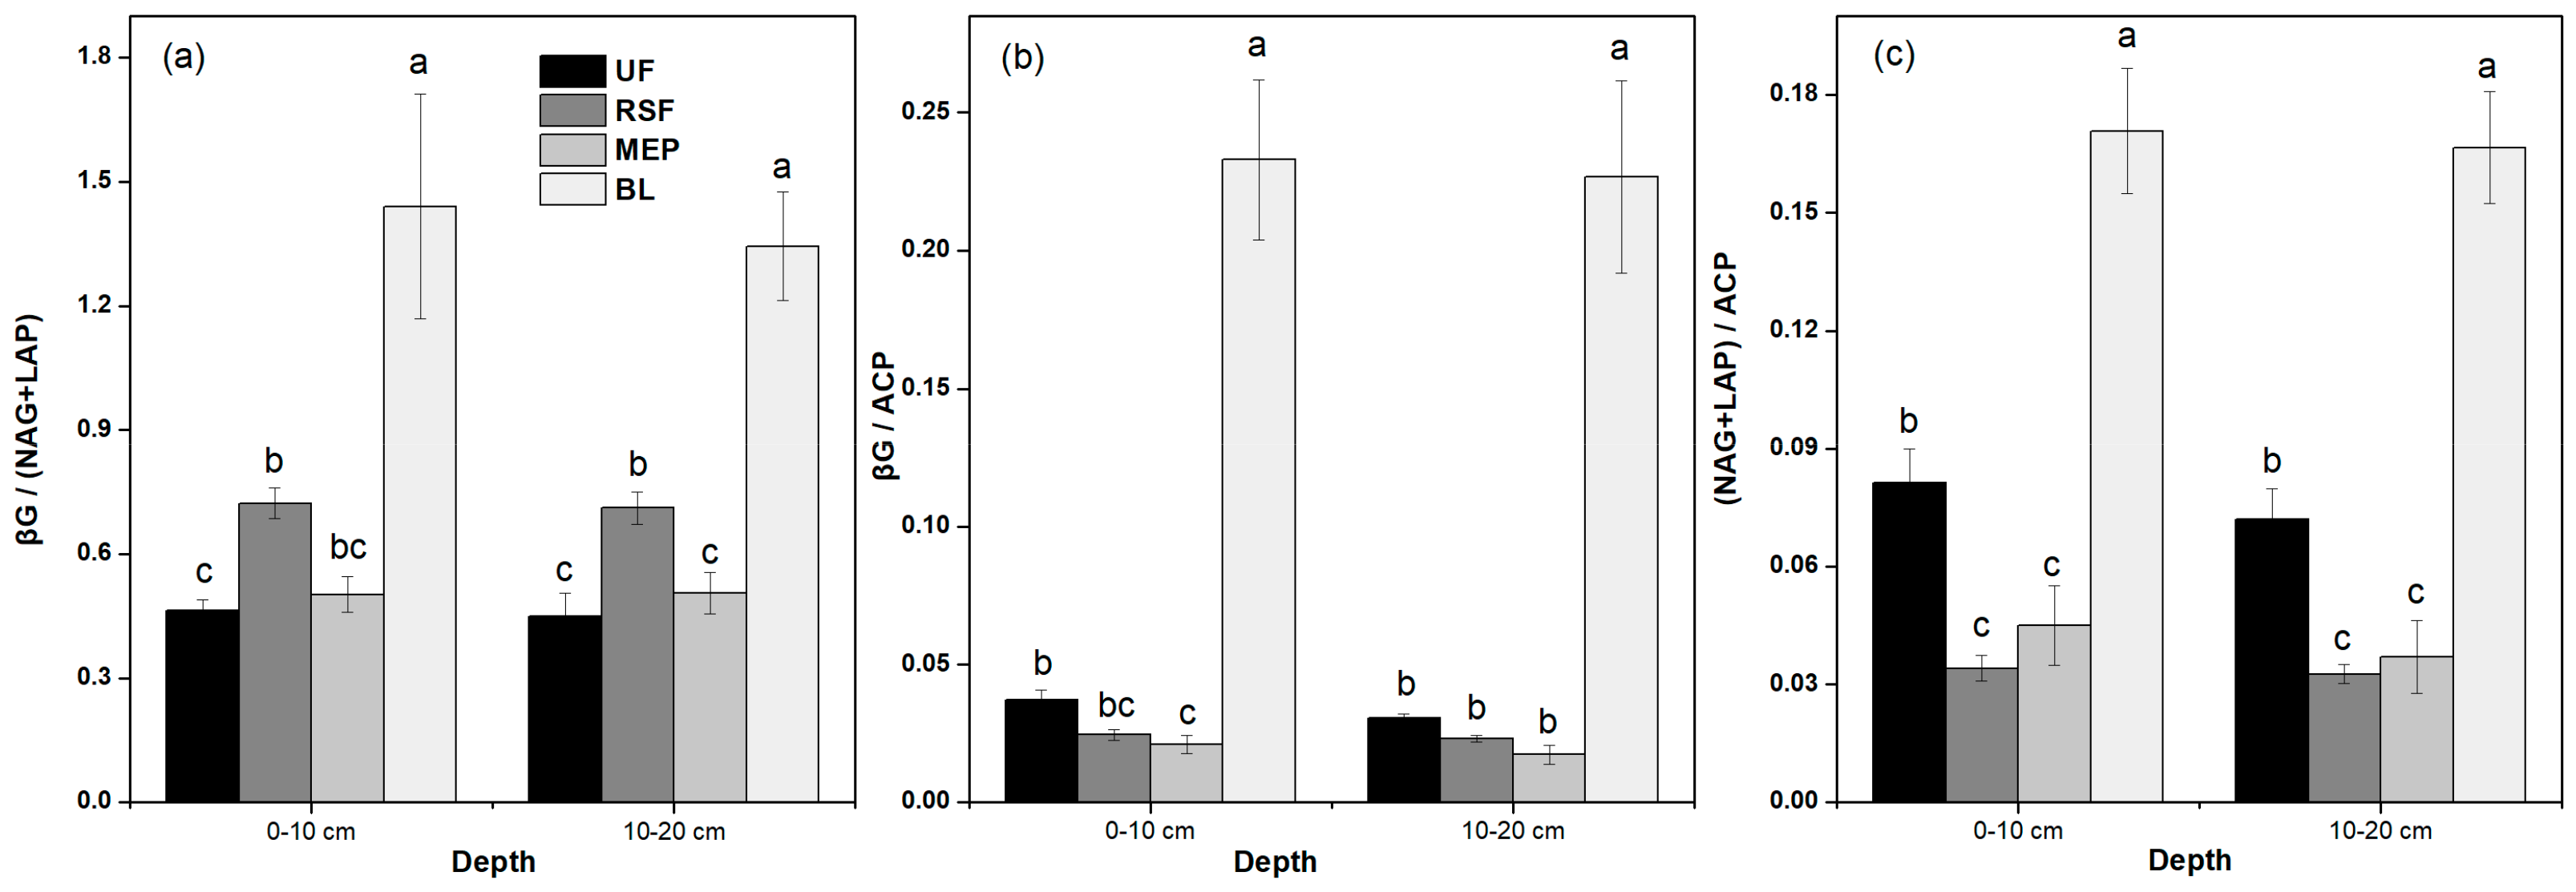
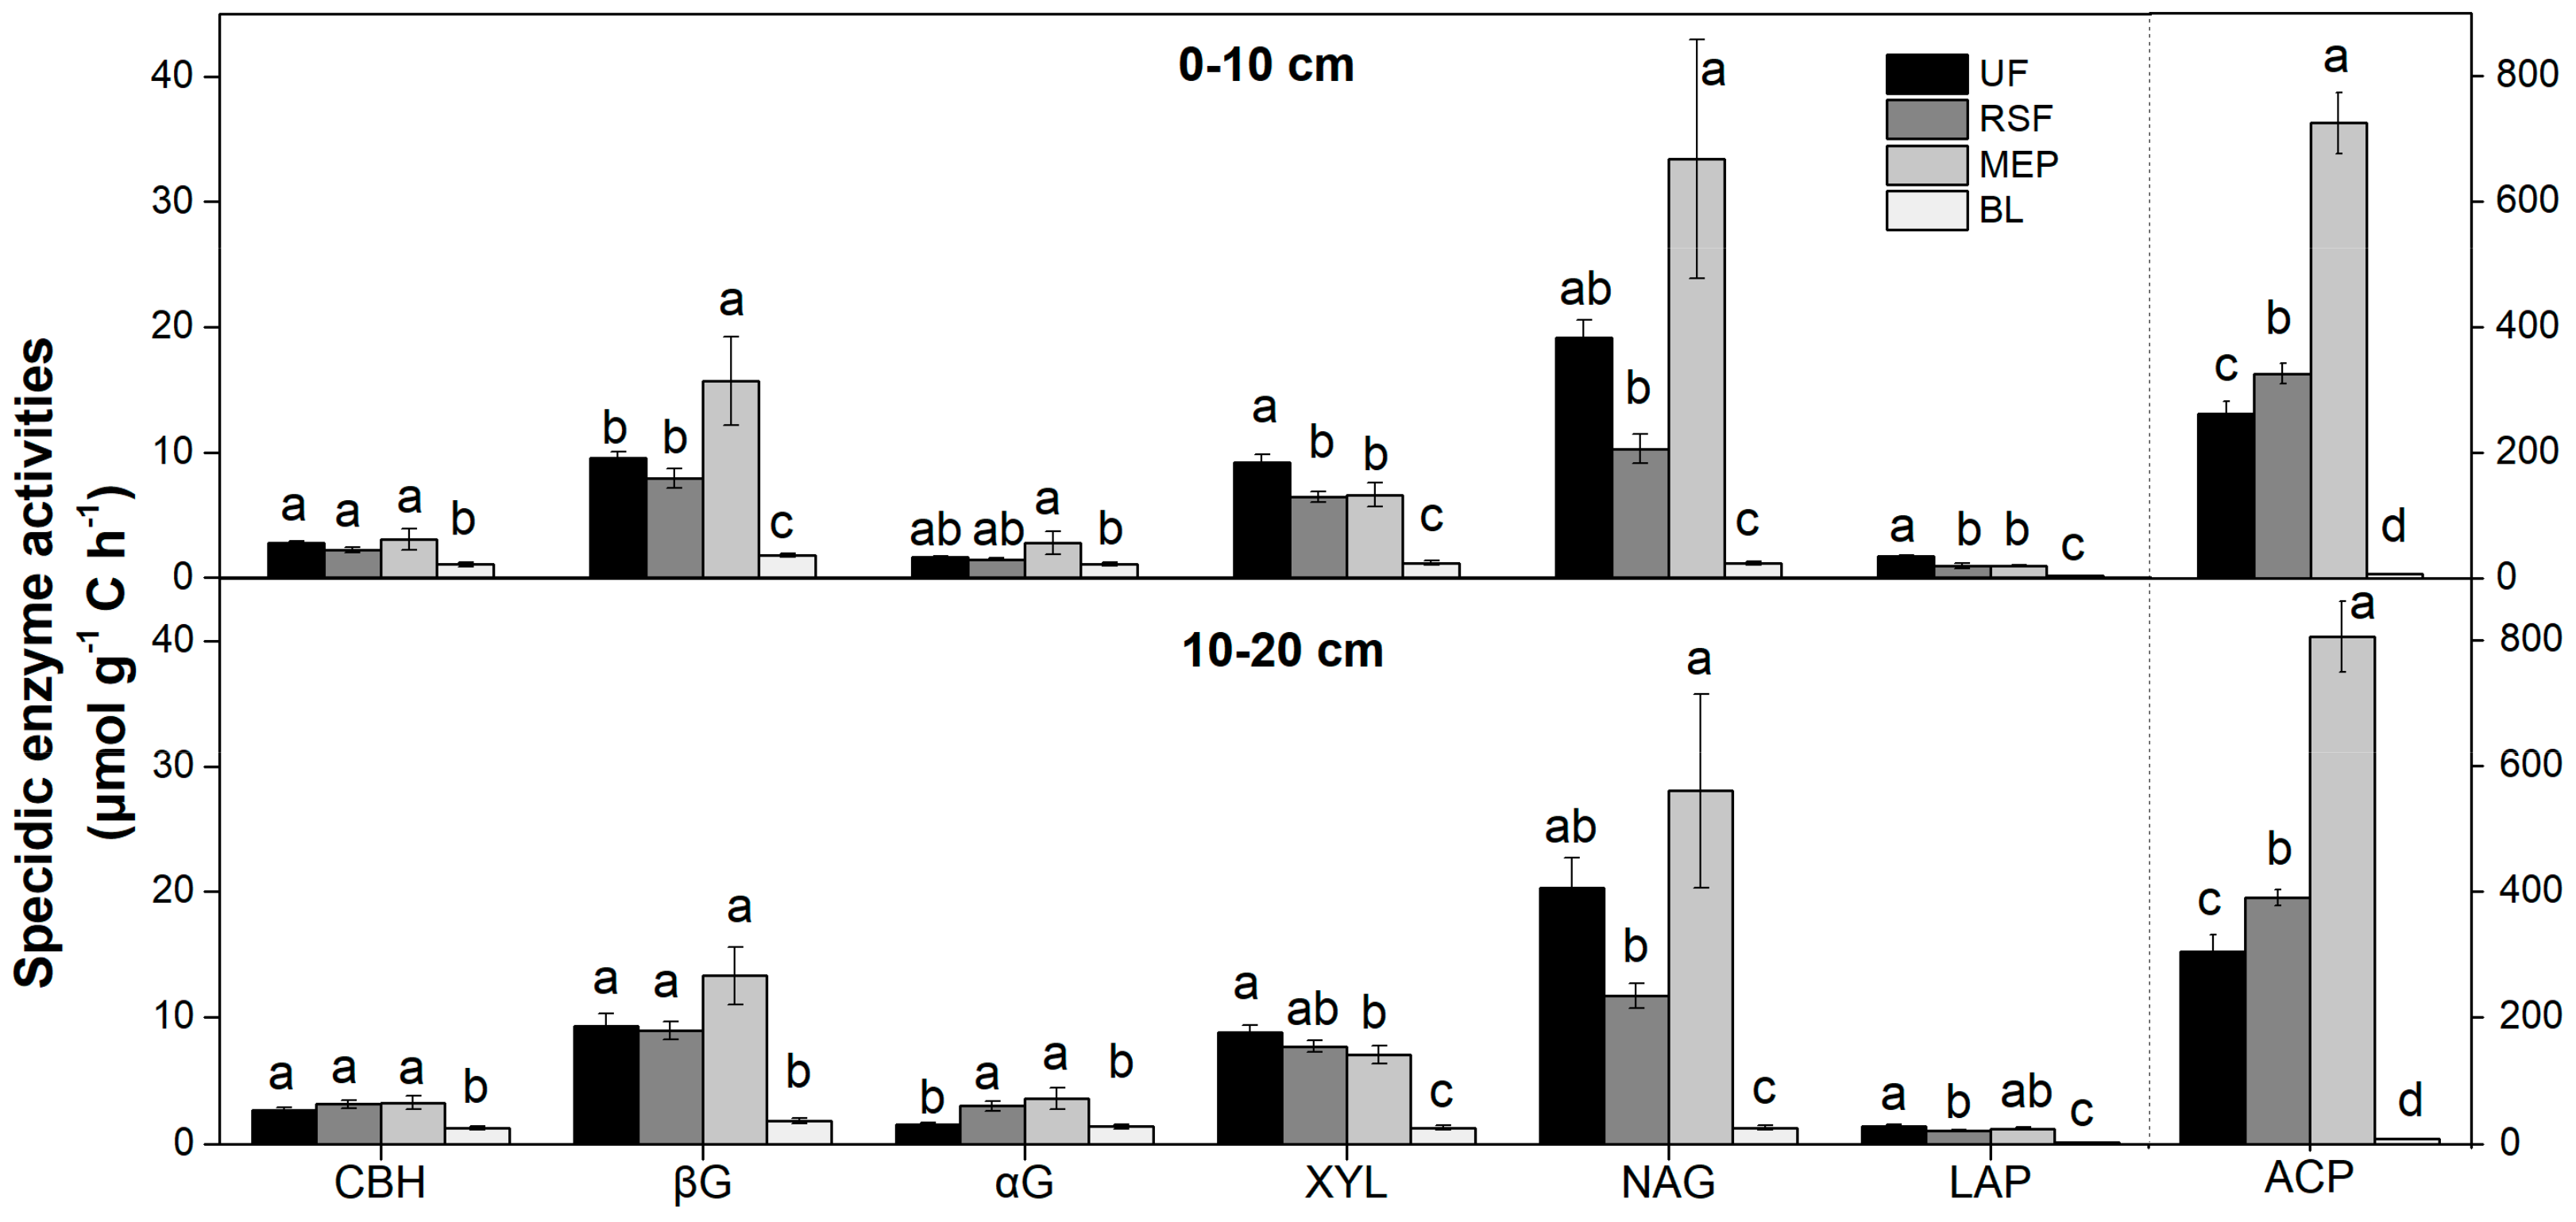
3.3. Soil Enzyme Activities

Soil enzyme activities were significantly increased after the afforestation and decreased from the surface soil depth to subsurface depth, particularly in the RSF (Figure 2). However, no difference in ACP activity was observed among the three forest sites at the 0–10 cm and 10–20 cm soil depths (p = 0.137 and p = 0.482, respectively). Most soil hydrolytic activities and oxidase activities were higher in the UF compared to the other two afforested sites and the BL. The value of ACP was the highest among all the hydrolytic activities (Figure 2g). Furthermore, compared to the BL, the average increase rates of C-cycling, N-cycling, and P-cycling enzyme activities were, respectively, 14.11, 135.93, and 295.57 times in the UF; 11.48, 67.77, and 33.29 times in the RSF; and 5.97, 81.06, and 22.07 times in the MEP (Figure 2).
We analyzed the stoichiometry of the βG, NAG, LAP, and ACP activities (Figure 3, Table 6). The average ratios of the soil βG/(NAG+LAP), βG/ACP, and (NAG+LAP)/ACP were 0.77, 0.08, and 0.08, respectively. There were significant differences among the four sites (p < 0.001, Table 6). Soil ecoenzymatic stoichiometry ratios were the highest in the BL and did not show the same trend among the three forest sites (Figure 3).
CBH: Cellobiohydrolase; βG: β-1,4-glucosidase; αG: α-1,4-glucosidase; XYL: β-1,4-xylosidase; NAG: β-1,4-N-acetyl-glucosaminnidase; LAP: L-leucine aminopeptidase; ACP: acid phosphatase; PhOx: phenol oxidase; Perox: peroxidase.
Changes in the specific enzyme activities were different from the variations in the absolute enzyme activities (Figure 2 and Figure 4). Among the four research sites, specific enzyme activities were significantly different, with the highest value in the MEP and the lowest value in the BL (Figure 4).

4. Discussion

This study demonstrated that afforestation in the degraded lands could enhance the biomass and the PLFAs of all major soil microbial groups, as well as the activities of nine extracellular enzymes. The results reported here were consistent with most of the previous studies (e.g., Zhang et al.) [63].
The enhanced soil microbial biomass and activities could be attributed to the increases in soil C and N stocks due to plant residue inputs with afforestation [16,64]. The higher C and N stocks in the afforested sites may provide more substrate for microbial assimilation [65]. This study (Table 2) and previous work at our sites indeed found that soil C and N stocks were increased significantly after afforestation—especially the RSF at the 0–10 cm soil depth compared to the UF [48]. In addition, the enhanced soil moisture at our afforested sites could stimulate microbial growth and activities. Soil bulk density and sand and clay percentage were changed following afforestation [48]; this might affect the soil hydrological characteristics, such as infiltration rates and times and water retention [66,67]. At the same time, the higher underground biomass and its ability also facilitated the formation of pore meshes and improved the water holding capacity [68]. Since the RSF increased more soil C and N stocks than the MEP and created a higher moisture content in the soil, the microbial biomass in the RSF was enhanced more than at the MEP site in this study. As Eucalyptus is a water-consuming species [69], the toxicity of harmful allelochemical compounds released from its leaf litter could also inhibit the increase of microbial growth and activity in the MEP [70]. However, despite the similar level of soil water content and C and N contents at 0–10 cm soil depth in the wet season between the RSF and UF, the soil microbial biomass—especially the MBN in the RSF—did not reach a similar level to the UF with respect to soil depths and seasons (Table 3).
Our results also showed that afforestation altered soil community composition with a decreased ratio of F/B at the afforested sites compared to the BL. This was in contrast to some studies that found that afforestation increased the soil F/B ratio [13,40]. The different response of soil microbial composition was probably due to different land use and management histories. The afforestation on croplands might increase the soil F/B ratio as agriculture practices often stimulate bacteria growth, resulting in a relatively low F/B ratio in the soil. In this and a previous study, afforestation on the degraded lands improved the soil environment, such as by enhancing the soil moisture [48]. Fungal communities are often thought to dominate the soil microbial biomass, especially under nutrient-limited, warmer, and drier environments [71]. In addition, soil fungi and bacteria have distinct substrate preferences [72]. Fungi mainly use recalcitrant C, while bacteria mainly use the active C pool [73,74,75]. Long-term soil erosion and degradation in the BL leads to large amounts of labile C losses, leaving mostly recalcitrant C in the soil [9,48]. As a result, the ratio of F/B was the highest in the BL compared to the afforested sites. There was a significant difference in soil C recalcitrant indices between the RSF and MEP in the wet season [48], probably causing different F/B ratios in these two afforested sites (Table 4). Previous studies showed that the F/B ratio was positively correlated with the soil C/N ratio [23,40,76]. The relative lower F/B ratio at the UF sites (Table 4) might be due to the relative lower C/N ratio in the soil (Table 2).
Both hydrolytic and oxidative enzyme activities were increased by afforestation, and their activities varied among different sites, which was similar to previous studies [77,78]. These changes might also be explained by the increase in the C substrate availability and changes to the suitable growth environment for microorganisms [18,79]. We noticed that the ACP activity in the RSF at 0–10 cm soil depth was even higher than those in the UF (Figure 2g), probably caused by the difference in P availability. Phosphorus has been shown to be the element that mostly limits plant productivity in tropical forests [80]. The higher ACP activity reported here suggested that plants in the three forests are all limited by P availability (Figure 2g). Ecoenzymatic stoichiometry is widely used as an indicator to estimate the limiting and resource allocation of microbes [81,82]. In our study, all of the ecoenzymatic stoichiometry was higher in the BL than that of the afforested sites, indicating intensive C and N limits for microbes at the BL site and a relative P limit at the afforested sites. This looks reasonable because the BL site does not have plant cover, meaning there are almost no atmospheric C and N inputs, while afforested sites with C and N inputs and effective nutrient retention could deplete soil P through plant tissue accumulation. Intensive C and N shortages in the BL might be responsible for it having the lowest specific enzyme activities. Usually, soils with the less organic matter should have higher specific enzyme activity [62], as indicated by higher specific enzyme activities at the MEP site compared to the UF and RSF sites. Thus, the BL site with the lowest organic matter content should have the highest specific enzyme activities. However, intensive C and N shortages could constrain microbial enzyme production at the BL site, as enzyme production needs large C and N investments.
Changes in the relative abundance and activity of microbes may significantly affect C cycling and storage [26]. Our previous work at these sites demonstrated that C and N stocks in the surface soil in the RSF could recover to the equivalent level of the UF over 56 years [48]. It can be concluded that afforestation could promote soil C sequestration due to a proportional increase in the bacterial and fungal biomass, soil microbial biomass, and hydrolytic and oxidative enzyme activities, despite the decrease in F/B compared to the BL. In this study, we found that the microbial properties in the RSF were still lower than those in the UF, although the differences varied for different seasons, soil depths, and microbial groups or enzymes. This might be due to different environmental conditions, such as soil moisture between the RSF and UF in microbial properties, as the moisture in the RSF was also lower than in the UF, especially in the dry season (Table 2). Since our study sites receive 1120 mm to 1360 mm rainfall in the wet season (April–September) and only 280 mm to 340 mm in the dry season (October–March), soil water is usually not the limiting factor in the wet season, but in the dry season, it often inhibits soil microbial growth and activity [83,84]. As a result, the difference of soil moisture between the RSF and UF likely contributed to changes in soil microbial biomass C and N in the dry season but not in the wet season (Table 2 and Table 3). In addition, different microbial groups may have different tolerances for water stress [73,85,86]. The drier and much more impoverished soils in the BL resulted in a higher ratio of F/B. Thus, the enzyme activities were strongly limited by substrate supply. On the contrary, afforestation significantly increased the absolute and specific enzyme activities due to there being a more available substrate, which might simulate the decomposition of litter and provide more P from litter back to the soil.

5. Conclusions

In this study, we found that half-century afforestation in degraded tropical lands enhanced the soil microbial biomass and activities as the microbial biomass C and N, the PLFAs of all the main soil microbial groups, as well as the activities of nine extracellular enzymes, were significantly higher at the afforested sites than those in the BL. Afforestation also altered microbial community composition and specific enzyme activities as decreases in the F/B ratio and the ecoenzymatic stoichiometry were observed. Moreover, the soil microbial biomass and activities in the mixed-species plantation were significantly higher than the monoculture Eucalyptus plantation. However, these microbial properties at the restored secondary forest sites were still lower than those at the undisturbed forest sites, suggesting that much longer recovery times were needed. This study improved our understanding of the microbial composition and function with afforestation and provided valuable information for forest restoration and management.

Supplementary Materials

The following are available online at https://www.mdpi.com/1999-4907/10/12/1124/s1. Table S1: Statistical test of the effects of different research sites, seasons, and their interactions on soil water content and soil microbial biomass based on two-factor AVOVA. Table S2: Statistical test of the effects of research sites, seasons, and their interactions on the absolute abundance of PLFAs (nmol g−1 soil) and the ratios of F/B and G+/G− in November 2016 and June 2017. Table S3: Statistical test of the effects of research sites, seasons, and their interactions on the relative abundance of PLFAs (mol %) in November 2016 and June 2017.

Author Contributions

Experimental design, D.Z.; Writing—Original Draft Preparation, H.Z.; Writing—Review and Editing, Q.D., D.H., and D.Z.; Funding Acquisition, Q.D., D.Z., and G.Z.; Data Curation: X.X. and J.W. Investigation: G.C.; Visualization: J.Z. and M.Z.

Funding

This research was financially supported by the National Natural Science Foundation of China (41573077, 41773088, 31870461), the “Hundred Talent Program” of South China Botanical Garden at the Chinese Academy of Sciences (Y761031001), the Key Research Program of the Chinese Academy of Sciences (QYZDJ-SSW-DQC003), and by Key Special Project for Introduced Talents Team of Southern Marine Science and Engineering Guangdong Laboratory (Guangzhou) (GML2019ZD0408).

Acknowledgments

We thank Cong Wang for his assistance in the field and enzyme assay. We thank Jing Zhang, Xiong Fang, and Yongxia Jia for their help with the analysis of PLFAs. We also wish to thank Yingwen Li and Yongxing Li for their help in the fieldwork.

Conflicts of Interest

The authors declare no conflict of interest.

References

  1. Chen, J.; Chen, J.Z.; Tan, M.Z.; Gong, Z.T. Soil degradation: A global problem endangering sustainable development. J. Geogr. Sci. 2002, 12, 243–252. [Google Scholar]
  2. Seymour, F.; Harris, N.L. Reducing tropical deforestation. Science 2019, 365, 756–757. [Google Scholar] [CrossRef] [Green Version]
  3. Nave, L.E.; Domke, G.M.; Hofmeister, K.L.; Mishra, U.; Perry, C.H.; Walters, B.F.; Swanston, C.W. Reforestation can sequester two petagrams of carbon in US topsoils in a century. Proc. Natl. Acad. Sci. USA 2018. [Google Scholar] [CrossRef] [Green Version]
  4. Bastin, J.-F.; Finegold, Y.; Garcia, C.; Mollicone, D.; Rezende, M.; Routh, D.; Zohner, C.M.; Crowther, T.W. The global tree restoration potential. Science 2019, 365, 76–79. [Google Scholar] [CrossRef]
  5. Chen, C.; Park, T.; Wang, X.H.; Piao, S.L.; Xu, B.D.; Chaturvedi, R.K.; Fuchs, R.; Brovkin, V.; Ciais, P.; Fensholt, R.; et al. China and India lead in greening of the world through land-use management. Nat. Sustain. 2019, 2, 122–129. [Google Scholar] [CrossRef]
  6. Hou, G.L.; Delang, C.O.; Lu, X.X.; Olschewski, R. Valuing Carbon Sequestration to Finance Afforestation Projects in China. Forests 2019, 10, 754. [Google Scholar] [CrossRef] [Green Version]
  7. Romijn, E.; Coppus, R.; De Sy, V.; Herold, M.; Roman-Cuesta, R.M.; Verchot, L. Land Restoration in Latin America and the Caribbean: An Overview of Recent, Ongoing and Planned Restoration Initiatives and Their Potential for Climate Change Mitigation. Forests 2019, 10, 510. [Google Scholar] [CrossRef] [Green Version]
  8. Don, A.; Schumacher, J.; Freibauer, A. Impact of tropical land-use change on soil organic carbon stocks—A meta-analysis. Glob. Chang. Biol. 2011, 17, 1658–1670. [Google Scholar] [CrossRef] [Green Version]
  9. Wang, F.M.; Ding, Y.Z.; Sayer, E.J.; Li, Q.L.; Zou, B.; Mo, Q.F.; Li, Y.W.; Lu, X.L.; Tang, J.W.; Zhu, W.X.; et al. Tropical forest restoration: Fast resilience of plant biomass contrasts with slow recovery of stable soil C stocks. Funct. Ecol. 2017, 31, 1–12. [Google Scholar] [CrossRef] [Green Version]
  10. Martin, P.A.; Newton, A.C.; Bullock, J.M. Carbon pools recover more quickly than plant biodiversity in tropical secondary forests. Proc. R. Soc. B 2013, 280, 20132236. [Google Scholar] [CrossRef] [PubMed]
  11. Jacobs, D.F.; Oliet, J.A.; Aronson, J.; Bolte, A.; Bullock, J.M.; Donoso, P.J.; Landhäusser, S.M.; Madsen, P.; Peng, S.; Rey-Benayas, J.M. Restoring forests: What constitutes success in the twenty-first century? New For. 2015, 46, 601–614. [Google Scholar] [CrossRef]
  12. Asmelash, F.; Bekele, T.; Birhane, E. The Potential Role of Arbuscular Mycorrhizal Fungi in the Restoration of Degraded Lands. Front. Microbiol. 2016, 7, 1095. [Google Scholar] [CrossRef] [Green Version]
  13. Li, D.J.; Wen, L.; Jiang, S.; Song, T.Q.; Wang, K.L. Responses of soil nutrients and microbial communities to three restoration strategies in a karst area, southwest China. J. Environ. Manag. 2018, 207, 456–464. [Google Scholar] [CrossRef] [PubMed]
  14. Forrester, D.I.; Bauhus, J.; Cowie, A.L.; Vanclay, J.K. Mixed-species plantations of Eucalyptus with nitrogen-fixing trees: A review. For. Ecol. Manag. 2006, 233, 211–230. [Google Scholar] [CrossRef] [Green Version]
  15. Chen, F.L.; Zheng, H.; Zhang, K.; Ouyang, Z.Y.; Lan, J.; Li, H.L.; Shi, Q. Changes in soil microbial community structure and metabolic activity following conversion from native Pinus massoniana plantations to exotic Eucalyptus plantations. For. Ecol. Manag. 2013, 291, 65–72. [Google Scholar] [CrossRef]
  16. Brockett, B.F.T.; Prescott, C.E.; Grayston, S.J. Soil moisture is the major factor influencing microbial community structure and enzyme activities across seven biogeoclimatic zones in western Canada. Soil Biol. Biochem. 2012, 44, 9–20. [Google Scholar] [CrossRef]
  17. Mangalassery, S.; Mooney, S.J.; Sparkes, D.L.; Fraser, W.T.; Sjögersten, S. Impacts of zero tillage on soil enzyme activities, microbial characteristics and organic matter functional chemistry in temperate soils. Eur. J. Soil Biol. 2015, 68, 9–17. [Google Scholar] [CrossRef]
  18. Ananbeh, H.; Stojanović, M.; Pompeiano, A.; Voběrková, S.; Trasar-Cepeda, C. Use of soil enzyme activities to assess the recovery of soil functions in abandoned coppice forest systems. Sci. Total Environ. 2019, 694, 133692. [Google Scholar] [CrossRef] [PubMed]
  19. Nannipieri, P.; Ascher, J.; Ceccherini, M.T.; Landi, L.; Pietramellara, G.; Renella, G. Microbial diversity and soil functions. Eur. J. Soil Sci. 2003, 54, 655–670. [Google Scholar] [CrossRef]
  20. Singh, B.K.; Bardgett, R.D.; Smith, P.; Reay, D.S. Microorganisms and climate change: Terrestrial feedbacks and mitigation options. Nat. Rev. Microbiol. 2010, 8, 779–790. [Google Scholar] [CrossRef]
  21. Cusack, D.F.; Silver, W.L.; Torn, M.S.; Burton, S.D.; Firestone, M.K. Changes in microbial community characteristics and soil organic matter with nitrogen additions in two tropical forests. Ecology 2011, 92, 621. [Google Scholar] [CrossRef] [PubMed] [Green Version]
  22. Sparling, G.P. Ratio of microbial biomass carbon to soil organic carbon as a sensitive indicator of changes in soil organic matter. Aust. J. Soil Res. 1992, 30, 195–207. [Google Scholar] [CrossRef]
  23. Crowther, T.W.; van den Hoogen, J.; Wan, J.; Mayes, M.A.; Keiser, A.D.; Mo, L.; Averill, C.; Maynard, D.S. The global soil community and its influence on biogeochemistry. Science 2019, 365, eaav0550. [Google Scholar] [CrossRef] [PubMed]
  24. Bhandari, K.B.; West, C.P.; Acosta-Martinez, V. Assessing the role of interseeding alfalfa into grass on improving pasture soil health in semi-arid Texas High Plains. Appl. Soi. Ecol. 2019. [Google Scholar] [CrossRef]
  25. Bailey, V.L.; Smith, J.L.; Bolton, H., Jr. Fungal-to-bacterial ratios in soils investigated for enhanced C sequestration. Soil Biol. Biochem. 2002, 34, 997–1007. [Google Scholar] [CrossRef]
  26. Six, J.; Frey, S.D.; Thiet, R.K.; Batten, K.M. Bacterial and fungal contributions to carbon sequestration in agroecosystems. Soil Sci. Soc. Am. J. 2006, 70, 555–569. [Google Scholar] [CrossRef]
  27. Malik, A.A.; Chowdhury, S.; Schlager, V.; Oliver, A.; Puissant, J.; Vazquez, P.G.M.; Jehmlich, N.; von Bergen, M.; Griffiths, R.I.; Gleixner, G. Soil Fungal: Bacterial Ratios are Linked to Altered Carbon Cycling. Front. Microbiol. 2016, 7, 1247. [Google Scholar] [CrossRef] [Green Version]
  28. Sinsabaugh, R.L. Phenol oxidase, peroxidase and organic matter dynamics of soil. Soil Biol. Biochem. 2010, 42, 391–404. [Google Scholar] [CrossRef]
  29. Burns, R.G.; Deforest, J.L.; Marxsen, J.; Sinsabaugh, R.L.; Stromberger, M.E.; Wallenstein, M.D.; Weintraub, M.N.; Zoppini, A. Soil enzymes in a changing environment: Current knowledge and future directions. Soil Biol. Biochem. 2013, 58, 216–234. [Google Scholar] [CrossRef]
  30. Waring, B.G.; Averill, C.; Hawkes, C.V. Differences in fungal and bacterial physiology alter soil carbon and nitrogen cycling: Insights from meta-analysis and theoretical models. Ecol. Lett. 2013, 16, 887–894. [Google Scholar] [CrossRef] [PubMed]
  31. Waldrop, M.P.; Balser, T.C.; Firestone, M.K. Linking microbial community composition to function in a tropical soil. Soil Biol. Biochem. 2000, 32, 1837–1846. [Google Scholar] [CrossRef]
  32. Teixeira, Z.; Teixeira, H.; Marques, J.C. Systematic processes of land use/land cover change to identify relevant driving forces: Implications on water quality. Sci. Total Environ. 2014, 470–471, 1320–1335. [Google Scholar] [CrossRef] [Green Version]
  33. Schmidt, M.W.I.; Torn, M.S.; Abiven, S.; Dittmar, T.; Guggenberger, G.; Janssens, I.A.; Kleber, M.; Kögel-Knabner, I.; Lehmann, J.; Manning, D.A.C.; et al. Persistence of soil organic matter as an ecosystem property. Nature 2011, 478, 49–56. [Google Scholar] [CrossRef] [Green Version]
  34. Smith, A.P.; Marin-Spiotta, E.; Balser, T. Successional and seasonal variations in soil and litter microbial community structure and function during tropical postagricultural forest regeneration: A multiyear study. Glob. Chang. Biol. 2015, 21, 3532–3547. [Google Scholar] [CrossRef]
  35. Suseela, V.; Conant, R.T.; Wallenstein, M.D.; Dukes, J.S. Effects of soil moisture on the temperature sensitivity of heterotrophic respiration vary seasonally in an old-field climate change experiment. Glob. Chang. Biol. 2012, 18, 336–348. [Google Scholar] [CrossRef]
  36. Bhandari, K.B.; West, C.P.; Longing, S.D.; Brown, C.P.; Green, P.E. Comparison of Arthropod Communities among Different Forage Types on the Texas High Plains using Pitfall Traps. Crop Forage Turfgrass Manag. 2018, 4. [Google Scholar] [CrossRef]
  37. Bhandari, K.B.; West, C.P.; Longing, S.D. Communities of Canopy-Dwelling Arthropods in Response to Diverse Forages. Agric. Environ. Lett. 2018, 3. [Google Scholar] [CrossRef]
  38. Kuťáková, E.; Cesarz, S.; Münzbergová, Z.; Eisenhauer, N. Soil microarthropods alter the outcome of plant-soil feedback experiments. Sci. Rep. 2018, 8, 11898. [Google Scholar] [CrossRef]
  39. Fichtner, A.; von Oheimb, G.; Härdtle, W.; Wilken, C.; Gutknecht, J.L.M. Effects of anthropogenic disturbances on soil microbial communities in oak forests persist for more than 100 years. Soil Biol. Biochem. 2014, 70, 79–87. [Google Scholar] [CrossRef]
  40. Deng, Q.; Cheng, X.L.; Hui, D.F.; Zhang, Q.; Li, M.; Zhang, Q.F. Soil microbial community and its interaction with soil carbon and nitrogen dynamics following afforestation in central China. Sci. Total Environ. 2016, 541, 230–237. [Google Scholar] [CrossRef]
  41. Jangid, K.; Williams, M.A.; Franzluebbers, A.J.; Schmidt, T.M.; Coleman, D.C.; Whitman, W.B. Land-use history has a stronger impact on soil microbial community composition than aboveground vegetation and soil properties. Soil Biol. Biochem. 2011, 43, 2184–2193. [Google Scholar] [CrossRef]
  42. Laganiere, J.; Angers, D.A.; Pare, D. Carbon accumulation in agricultural soils after afforestation: A meta-analysis. Glob. Chang. Biol. 2010, 16, 439–453. [Google Scholar] [CrossRef]
  43. Ren, H.; Li, Z.A.; Shen, W.J.; Yu, Z.Y.; Peng, S.L.; Liao, C.H.; Ding, M.M.; Wu, J.G. Changes in biodiversity and ecosystem function during the restoration of a tropical forest in south China. Sci. China C Life Sci. 2007, 50, 277–284. [Google Scholar] [CrossRef] [PubMed]
  44. Yu, Z.Y.; Pi, Y.F. The path and its effects to rehabilitating vegetation on the tropical littoral eroded land in Guangdong province. Trop. Subtrop. For. Ecosyst. Res. 1985, 3, 97–108. (In Chinese) [Google Scholar]
  45. Tang, X.Y.; Liu, S.G.; Liu, J.X.; Zhou, G.Y. Effects of vegetation restoration and slope positions on soil aggregation and soil carbon accumulation on heavily eroded tropical land of Southern China. J. Soils Sed. 2010, 10, 505–513. [Google Scholar] [CrossRef]
  46. Cao, H.L.; Yu, Z.Y. Comparative study on the community structure of four different forests in Xiaoliang Experimental Station, Dianbai County, south Guangdong. Chin. J. Appl. Environ. Biol. 1998, 4, 315–319. (In Chinese) [Google Scholar]
  47. Ding, M.M.; Yi, W.M.; Liao, L.Y.; Martens, R.; Insam, H. Effect of afforestation on microbial biomass and activity in soils of tropical China. Soil Biol. Biochem. 1992, 24, 865–872. [Google Scholar] [CrossRef]
  48. Zhang, H.L.; Deng, Q.; Hui, D.F.; Wu, J.P.; Xiong, X.; Zhao, J.Q.; Zhao, M.D.; Chu, G.W.; Zhou, G.Y.; Zhang, D.Q. Recovery in soil carbon stock but reduction in carbon stabilization after 56-year forest restoration in degraded tropical lands. For. Ecol. Manag. 2019, 441, 1–8. [Google Scholar] [CrossRef]
  49. Vance, E.D.; Brookes, P.C.; Jenkinson, D.S. An extraction method for measuring soil microbial biomass C. Soil Biol. Biochem. 1987, 19, 703–707. [Google Scholar] [CrossRef]
  50. Brookes, P.C.; Landman, A.; Pruden, G.; Jenkinson, D.S. Chloroform fumigation and the release of soil nitrogen: A rapid direct extraction method to measure microbial biomass nitrogen in soil. Soil Biol. Biochem. 1985, 17, 837–842. [Google Scholar] [CrossRef]
  51. Bossio, D.A.; Scow, K.M. Impacts of carbon and flooding on soil microbial communities: Phospholipid fatty acid profiles and substrate utilization patterns. Microb. Ecol. 1998, 35, 265–278. [Google Scholar] [CrossRef]
  52. Fang, X.; Zhou, G.Y.; Li, Y.L.; Liu, S.Z.; Chu, G.W.; Xu, Z.H.; Liu, J.X. Warming effects on biomass and composition of microbial communities and enzyme activities within soil aggregates in subtropical forest. Biol. Fertil. Soils 2015, 52, 353–365. [Google Scholar] [CrossRef]
  53. Zelles, L. Fatty acid patterns of phospholipids and lipopolysaccharides in the characterisation of microbial communities in soil: A review. Biol. Fertil. Soils 1999, 29, 111–129. [Google Scholar] [CrossRef]
  54. Frostegard, A.; Baath, E. The use of phospholipid fatty acid analysis to estimate bacterial and fungal biomass in soil. Biol. Fertil. Soils 1996, 22, 59–65. [Google Scholar] [CrossRef]
  55. Turpeinen, R.; Kairesalo, T.; Haggblom, M.M. Microbial community structure and activity in arsenic-, chromium- and copper-contaminated soils. FEMS Microbiol. Ecol. 2004, 47, 39–50. [Google Scholar] [CrossRef] [Green Version]
  56. Olsson, P.A. Signature fatty acids provide tools for determination of the distribution and interactions of mycorrhizal fungi in soil. FEMS Microbiol. Ecol. 1999, 29, 303–310. [Google Scholar] [CrossRef]
  57. Bell, C.W.; Fricks, B.E.; Rocca, J.D.; Steinweg, J.M.; McMahon, S.K.; Wallenstein, M.D. High-throughput Fluorometric Measurement of Potential Soil Extracellular Enzyme Activities. J. Vis. Exp. 2013. [Google Scholar] [CrossRef]
  58. Wang, C.; Lu, X.K.; Mori, T.; Mao, Q.G.; Zhou, K.J.; Zhou, G.Y.; Nie, Y.X.; Mo, J.M. Responses of soil microbial community to continuous experimental nitrogen additions for 13 years in a nitrogen-rich tropical forest. Soil Biol. Biochem. 2018, 121, 103–112. [Google Scholar] [CrossRef]
  59. Caldwell, B.A. Enzyme activities as a component of soil biodiversity: A review. Pedobiologia 2005, 49, 637–644. [Google Scholar] [CrossRef]
  60. Sinsabaugh, R.L. Enzymic analysis of microbial pattern and process. Biol. Fertil. Soils 1994, 17, 69–74. [Google Scholar] [CrossRef]
  61. Trasar-Cepeda, C.; Leiros, M.C.; Gil-Sotres, F. Hydrolytic enzyme activities in agricultural and forest soils. Some implications for their use as indicators of soil quality. Soil Biol. Biochem. 2008, 40, 2146–2155. [Google Scholar] [CrossRef] [Green Version]
  62. Wang, B.; Xue, S.; Liu, G.B.; Zhang, G.H.; Li, G.; Ren, Z.P. Changes in soil nutrient and enzyme activities under different vegetations in the Loess Plateau area, Northwest China. Catena 2012, 92, 186–195. [Google Scholar] [CrossRef]
  63. Zhang, Q.; Yang, J.J.; Koide, R.T.; Li, T.; Yang, H.S.; Chu, J.M. A meta-analysis of soil microbial biomass levels from established tree plantations over various land uses, climates and plant communities. Catena 2017, 150, 256–260. [Google Scholar] [CrossRef]
  64. Fierer, N.; Strickland, M.S.; Liptzin, D.; Bradford, M.A.; Cleveland, C.C. Global patterns in belowground communities. Ecol. Lett. 2009, 12, 1238–1249. [Google Scholar] [CrossRef]
  65. Allison, S.D.; Vitousek, P.M. Responses of extracellular enzymes to simple and complex nutrient inputs. Soil Biol. Biochem. 2005, 37, 937–944. [Google Scholar] [CrossRef]
  66. Jeddi, K.; Cortina, J.; Chaieb, M. Acacia salicina, Pinus halepensis and Eucalyptus occidentalis improve soil surface conditions in arid southern Tunisia. J. Arid Environ. 2009, 73, 1005–1013. [Google Scholar] [CrossRef]
  67. Korkanç, S.Y. Effects of afforestation on soil organic carbon and other soil properties. Catena 2014, 123, 62–69. [Google Scholar] [CrossRef]
  68. Yüksek, T.; Yüksek, F. The effects of restoration on soil properties in degraded land in the semi-arid region of Turkey. Catena 2011, 84, 47–53. [Google Scholar] [CrossRef]
  69. Robinson, N.; Harper, R.J.; Smettem, K.R.J. Soil water depletion by Eucalyptus spp. integrated into dryland agricultural systems. Plant Soil 2006, 286, 141–151. [Google Scholar] [CrossRef]
  70. Behera, N.; Sahani, U. Soil microbial biomass and activity in response to Eucalyptus plantation and natural regeneration on tropical soil. For. Ecol. Manag. 2003, 174, 1–11. [Google Scholar] [CrossRef]
  71. Ritz, K.; Young, I.M. Interactions between soil structure and fungi. Mycologist 2004, 18, 52–59. [Google Scholar] [CrossRef] [Green Version]
  72. De Menezes, A.B.; Richardson, A.E.; Thrall, P.H. Linking fungal-bacterial co-occurrences to soil ecosystem function. Curr. Opin. Microbiol. 2017, 37, 135–141. [Google Scholar] [CrossRef]
  73. Holland, E.A.; Coleman, D.C. Litter Placement Effects on Microbial and Organic Matter Dynamics in an Agroecosystem. Ecology 1987, 68, 425–433. [Google Scholar] [CrossRef]
  74. Hanson, C.A.; Allison, S.D.; Bradford, M.A.; Wallenstein, M.D.; Treseder, K.K. Fungal Taxa Target Different Carbon Sources in Forest Soil. Ecosystems 2008, 11, 1157–1167. [Google Scholar] [CrossRef]
  75. Schimel, J.P.; Schaeffer, S.M. Microbial control over carbon cycling in soil. Front. Microbiol. 2012, 3, 11. [Google Scholar] [CrossRef] [Green Version]
  76. Wan, X.H.; Huang, Z.Q.; He, Z.M.; Yu, Z.P.; Wang, M.H.; Davis, M.R.; Yang, Y.S. Soil C:N ratio is the major determinant of soil microbial community structure in subtropical coniferous and broadleaf forest plantations. Plant Soil 2015, 387, 103–116. [Google Scholar] [CrossRef]
  77. Ren, C.J.; Kang, D.; Wu, J.P.; Zhao, F.Z.; Yang, G.H.; Han, X.H.; Feng, Y.Z.; Ren, G.X. Temporal variation in soil enzyme activities after afforestation in the Loess Plateau, China. Geoderma 2016, 282, 103–111. [Google Scholar] [CrossRef]
  78. Moghimian, N.; Hosseini, S.M.; Kooch, Y.; Darki, B.Z. Impacts of changes in land use/cover on soil microbial and enzyme activities. Catena 2017, 157, 407–414. [Google Scholar] [CrossRef]
  79. Stock, S.C.; Köster, M.; Dippold, M.A.; Nájera, F.; Matus, F.; Merino, C.; Boy, J.; Spielvogel, S.; Gorbushina, A.; Kuzyakov, Y. Environmental drivers and stoichiometric constraints on enzyme activities in soils from rhizosphere to continental scale. Geoderma 2019, 337, 973–982. [Google Scholar] [CrossRef]
  80. Vitousek, P.M.; Porder, S.; Houlton, B.Z.; Chadwick, O.A. Terrestrial phosphorus limitation: Mechanisms, implications, and nitrogen–phosphorus interactions. Ecol. Appl. 2010, 20, 5–15. [Google Scholar] [CrossRef] [Green Version]
  81. Sinsabaugh, R.L.; Lauber, C.L.; Weintraub, M.N.; Ahmed, B.; Allison, S.D.; Crenshaw, C.; Contosta, A.R.; Cusack, D.; Frey, S.; Gallo, M.E. Stoichiometry of soil enzyme activity at global scale. Ecol. Lett. 2008, 11, 1252–1264. [Google Scholar] [CrossRef]
  82. Sinsabaugh, R.L.; Shah, J.J.F. Ecoenzymatic Stoichiometry and Ecological Theory. Annu. Rev. Ecol. Evol. Syst. 2012, 43, 313–343. [Google Scholar] [CrossRef] [Green Version]
  83. Deng, Q.; Zhang, D.Q.; Han, X.; Chu, G.W.; Zhang, Q.F.; Hui, D.F. Changing rainfall frequency rather than drought rapidly alters annual soil respiration in a tropical forest. Soil Biol. Biochem. 2018, 121, 8–15. [Google Scholar] [CrossRef]
  84. Zhao, Q.; Shen, W.J.; Chen, Q.; Helmisaari, H.S.; Sun, Q.Q.; Jian, S.G. Spring drying and intensified summer rainfall affected soil microbial community composition but not enzyme activity in a subtropical forest. Appl. Soi. Ecol. 2018, 130, 219–225. [Google Scholar] [CrossRef]
  85. Schimel, J.; Balser, T.C.; Wallenstein, M. Microbial Stress-Response Physiology and its Implications for Ecosystem Function. Ecology 2007, 88, 1386–1394. [Google Scholar] [CrossRef]
  86. Landesman, W.J.; Dighton, J. Response of soil microbial communities and the production of plant-available nitrogen to a two-year rainfall manipulation in the New Jersey Pinelands. Soil Biol. Biochem. 2010, 42, 1751–1758. [Google Scholar] [CrossRef]
Figure 1. Principal coordinates analysis (PCoA) ordination based on the phospholipid fatty acid (PLFA) data from the four research sites of two soil depths and over two seasons. The PCoA is separated by different sites. Different symbols represent different soil depths. Different colors in the points represent different seasons, and different colors in the shadows represent different sites. The percentage of the variation explained by the plotted principal coordinates is indicated on the axes. UF: nearby undisturbed forest; RSF: restored secondary forest; MEP: managed Eucalyptus plantation; BL: bare land.
Forests 10 01124 g001
Figure 2. Absolute enzyme activities at different soil depths among different research sites. (a) CBH: Cellobiohydrolase; (b) βG: β-1,4-glucosidase; (c) αG: α-1,4-glucosidase; (d) XYL: β-1,4-xylosidase; (e) NAG: β-1,4-N-acetyl-glucosaminnidase; (f) LAP: L-leucine aminopeptidase; (g) ACP: acid phosphatase; (h) PhOx: phenol oxidase; (i) Perox: peroxidase. Different lowercase letters indicate significant differences among research sites at the same depths (p < 0.05). UF: nearby undisturbed forest; RSF: restored secondary forest; MEP: managed Eucalyptus plantation; BL: bare land.
Forests 10 01124 g002
Figure 3. The ecoenzymatic stoichiometry in different research sites. (a) the ratio of C-cycling to N-cycling enzymes; (b) the ratio of C-cycling to P-cycling enzymes; (c) the ratio of N-cycling to P-cycling enzymes. βG: β-1,4-glucosidase; NAG: β-1,4-N-acetyl-glucosaminnidase; LAP: L-leucine aminopeptidase; ACP: acid phosphatase. Different lowercase letters indicate significant differences among research sites at the same depths (p < 0.05). UF: nearby undisturbed forest; RSF: restored secondary forest; MEP: managed Eucalyptus plantation; BL: bare land.
Forests 10 01124 g003
Figure 4. Specific enzyme activities (μmol g-1 C h-1) at 0–10 cm and 10–20 cm soil depths among the four research sites. Different lowercase letters indicate significant differences among research sites at the same depths (p < 0.05). CBH: Cellobiohydrolase; βG: β-1,4-glucosidase; αG: α-1,4-glucosidase; XYL: β-1,4-xylosidase; NAG: β-1,4-N-acetyl-glucosaminnidase; LAP: L-leucine aminopeptidase; ACP: acid phosphatase. UF: nearby undisturbed forest; RSF: restored secondary forest; MEP: managed Eucalyptus plantation; BL: bare land.
Forests 10 01124 g004
Table 1. Description of soil hydrolytic and oxidative enzymes investigated in this study.
Element CyclingEnzymeAbbr.FunctionSubstrate
C-cycling enzymeCellobiohydrolaseCBHCellulose degradation4-MUB-β-D-cellobioside
β-1,4-glucosidaseβGCellulose degradation4-MUB-β-D-glucoside
α-1,4-glucosidaseαGStarch and disaccharides degradation4-MUB-α-D-glucoside
β-1,4-xylosidaseXYLHemicellulose degradation4-MUB-β-D-xyloside
phenol oxidasePhOxPolyphenols degradation, such as ligninL-DOPA
peroxidasePeroxPolyphenols degradation, such as ligninL-DOPA
N-cycling enzymeβ-1,4-N-acetyl-glucosaminnidaseNAGChitin degradation4-MUB-N-acetyl-β-D-glucosaminide
L-leucine aminopeptidaseLAPCellulose degradationL-Leucine-T-amino-4-methylcoumarin
P-cycling enzymeAcid phosphataseACPOrganic P mineralization4-MUB-phosphate
L-DOPA: L-3,4-dihydroxyphenylalanine.
Table 2. Soil water content in the two seasons and total carbon (TC) and total nitrogen (TN) content in the wet season.
DepthResearch SiteSol Water Content (%)TC (g kg−1)TN (g kg−1)Soil C/N Ratio
Dry SeasonWet Season
0–10 cmUF19.42 ± 0.30 a21.00 ± 0.28 a27.08 ± 0.87 a2.12 ± 0.06 a12.80 ± 0.19 a
RSF16.40 ± 0.26 b19.75 ± 0.64 a29.02 ± 1.98 a2.10 ± 0.12 a13.77 ± 0.26 a
MEP7.97 ± 0.42 c8.88 ± 0.56 b11.93 ± 1.86 b0.87 ± 0.11 b13.53 ± 0.42 a
BL8.95 ± 0.39 c9.74 ± 0.19 b2.95 ± 0.28 c0.30 ± 0.04 c10.04 ± 0.49 b
p-value<0.001<0.001<0.001<0.001<0.001
10–20 cmUF18.18 ± 0.22 a19.93 ± 0.28 a20.32 ± 0.72 a1.67 ± 0.04 a12.18 ± 0.22 a
RSF16.10 ± 0.20 b18.58 ± 0.42 b14.85 ± 1.42 b1.18 ± 0.09 b12.46 ± 0.32 a
MEP9.88 ± 0.40 c9.66 ± 0.51 c8.45 ± 0.92 c0.73 ± 0.06 c11.45 ± 0.57 a
BL8.79 ± 0.27 d10.68 ± 0.23 c2.73 ± 0.30 d0.37 ± 0.03 d7.44 ± 0.51 b
p-value<0.001<0.001<0.001<0.001<0.001
Values are the means ± SE (n = 6). Different lowercase letters indicate significant difference among four research sites in the same season and at the same soil depth (p < 0.05). UF: nearby undisturbed forest; RSF: restored secondary forest; MEP: managed Eucalyptus plantation; BL: bare land. Dry season: November 2016; Wet season: June 2017.
Table 3. Mean values and standard errors of soil microbial biomass C (MBC) and N (MBN) among the four research sites in November 2017 (dry season) and June 2017 (wet season).
SeasonSiteMBCMBN
0–10 cm10–20 cm0–10 cm10–20 cm
Dry seasonUF358.47 ± 26.45 a255.84 ± 91.67 a80.92 ± 5.07 a40.27 ± 12.07 a
RSF273.98 ± 25.20 b80.43 ± 21.10 b58.86 ± 5.54 a23.93 ± 5.38 ab
MEP47.52 ± 16.12 c11.91 ± 5.47 b9.90 ± 3.33 b4.63 ± 2.16 b
BL0.37 ± 0.29 c2.79 ± 0.01 b1.00 ± 0.33 b1.35 ± 0.75 b
p-value<0.0010.047<0.0010.010
Wet seasonUF506.09 ± 36.51 a316.71 ± 19.99 a106.02 ± 7.63 a74.69 ± 4.08 a
RSF492.87 ± 20.34 a204.26 ± 20.61 b106.15 ± 5.17 a51.73 ± 3.55 b
MEP112.77 ± 29.82 b60.84 ± 17.15 c21.48 ± 5.92 b13.81 ± 2.77 c
BL6.39 ± 5.29 c10.32 ± 1.65 c3.44 ± 0.66 b4.94 ± 1.50 d
p-value<0.001<0.001<0.001<0.001
Values are the means ± SE (n = 6). Different lowercase letters indicate significant difference among four research sites in the same season and at the same soil depth (p < 0.05). UF: nearby undisturbed forest; RSF: restored secondary forest; MEP: managed Eucalyptus plantation; BL: bare land.
Table 4. Absolute abundance of phospholipid fatty acids (PLFAs) (nmol g−1 soil) and the ratios of fungi/bacteria (F/B) and Gram-positive/Gram-negative (G+/G−) bacteria in November 2016 (dry season) and June 2017 (wet season) among different research sites.
Soil DepthSiteThe Absolute Abundances of PLFAs (nmol g−1 soil)
BG+G−FTotal PLFAsF/BG+/G−
Dry season
0–10 cmUF28.16 (1.34) a22.53 (1.03) a4.25 (0.27) a5.91 (0.28) a44.51 (2.19) a0.21 (0.00) b5.33 (0.19)
RSF17.25 (2.05) b13.09 (1.61) b3.24 (0.33) b4.99 (0.54) a29.19 (3.45) b0.29 (0.00) b4.00 (0.12)
MEP7.26 (0.69) c5.54 (0.56) c1.32 (0.12) c1.74 (0.13) b11.60 (1.08) c0.25 (0.03) b4.20 (0.25)
BL0.25 (0.04) d0.18 (0.03) d0.02 (0.01) d0.14 (0.01) c0.41 (0.05) d0.63 (0.12) a4.53 (2.16)
p-value<0.001<0.001<0.001<0.001<0.001<0.0010.578
10–20 cmUF18.10 (1.32) a15.28 (1.03) a1.83 (0.39) a2.91 (0.13) a26.40 (2.39) a0.16 (0.01) b9.82 (1.76) a
RSF8.24 (1.55) b6.40 (1.31) b1.45 (0.19) a1.88 (0.32) b13.43 (2.59) b0.23 (0.01) b4.27 (0.45) b
MEP3.15 (0.22) c2.55 (0.19) c0.49 (0.05) b0.74 (0.12) c4.88 (0.36) c0.23 (0.02) b5.38 (0.50) ab
BL0.17 (0.02) d0.12 (0.01) d0.01 (0.01) c0.14 (0.03) d0.32 (0.05) d0.78 (0.09) a2.12 (1.32) c
p-value<0.001<0.001<0.001<0.001<0.001<0.0010.002
Wet season
0–10 cmUF27.66 (1.40) a21.78 (1.21) a4.52 (0.13) a6.59 (0.28) a44.99 (2.04) a0.24 (0.01) c4.80 (0.17) b
RSF22.83 (0.82) b16.81 (0.60) b4.81 (0.16) a7.22 (0.34) a39.62 (1.47) b0.32 (0.01) b3.49 (0.03) b
MEP6.55 (0.93) c5.14 (0.73) c1.08 (0.15) b1.42 (0.18) b10.34 (1.50) c 0.22 (0.01) c4.70 (0.12) b
BL0.22 (0.01) d0.15 (0.01) d0.02 (0.00) c0.12 (0.00) c0.69 (0.02) d0.56 (0.04) a9.84 (1.87) a
p-value<0.001<0.001<0.001<0.001<0.001<0.001<0.001
10–20 cmUF22.52 (1.76) a18.53 (1.47) a3.11 (0.28) a3.92 (0.36) a33.83 (2.64) a0.17 (0.01) c6.02 (0.27) ab
RSF13.36 (0.76) b9.65 (0.63) b3.07 (0.13) a3.61 (0.20) a22.22 (1.27) b0.27 (0.01) b3.14 (0.15) b
MEP4.43 (0.73) c3.48 (0.58) c0.78 (0.11) b0.92 (0.16) b7.00 (1.19) c0.21 (0.01) c4.43 (0.13) ab
BL0.19 (0.01) d0.14 (0.01) d0.01 (0.00) c0.09 (0.00) c0.16 (0.02) d0.47 (0.02) a11.52 (4.57) a
p-value<0.001<0.001<0.001<0.001<0.001<0.0010.081
Values are means with SE in parentheses. Different letters indicate significant differences at p < 0.05 level among different sites at the same depth, and no letters indicate no significant difference, respectively. UF: nearby undisturbed forest; RSF: restored secondary forest; MEP: managed Eucalyptus plantation; BL: bare land.
Table 5. The relative abundance of the individual PLFAs (mol %, the ratio of special PLFAs to total PLFAs) in November 2016 (dry season) and June 2017 (wet season) among different research sites.
Soil DepthSiteThe Relative Abundances PLFAs (mol %)
BG+G−FACTAMF
Dry season
0–10 cmUF60.30 (0.31) 50.66 (0.42) a9.53 (0.27) a13.29 (0.08) b18.74 (0.45) a4.67 (0.13) a
RSF59.09 (0.25) 44.74 (0.31) b11.22 (0.28) a17.19 (0.27) b19.18 (0.22) a4.55 (0.11) a
MEP62.50 (0.96) 47.62 (1.27) ab11.42 (0.40) a15.40 (1.54) b18.78 (0.78) a3.31 (0.32) b
BL59.21 (3.31) 45.12 (2.55) b4.06 (1.92) b36.17 (4.31) a4.62 (1.89) b0.00 (0.00) c
p-value0.2360.0380.003< 0.001< 0.001< 0.001
10–20 cmUF69.09 (1.75) a58.43 (1.62) a6.60 (0.91) b11.23 (0.63) c16.87 (1.69) a2.81 (0.71) ab
RSF61.59 (0.77) b47.10 (0.77) b11.55 (1.24) a14.43 (0.81) b19.95 (0.72) a4.03 (0.25) a
MEP64.79 (0.99) ab52.38 (1.39) ab9.97 (0.64) a14.83 (1.54) b17.65 (1.58) a2.72 (0.32) b
BL54.83 (3.65) c38.10 (3.48) c2.41 (1.49) c41.51 (2.41) a3.65 (2.39) b0.00 (0.00) c
p-value0.002<0.001<0.001<0.001<0.001<0.001
Wet season
0–10 cmUF61.42 (0.59) a48.29 (0.69) a10.10 (0.24) b14.72 (0.53) b18.99 (0.55) b 4.87 (0.25) a
RSF57.64 (0.19) b42.45 (0.19) b12.15 (0.11) a18.19 (0.27) a19.00 (0.18) b5.17 (0.15) a
MEP63.48 (0.22) a49.76 (0.28) a10.61 (0.26) b14.02 (0.61) b18.90 (0.57) b3.60 (0.30) b
BL31.37 (1.27) c 21.70 (1.45) c2.46 (0.29) c17.44 (0.58) a50.93 (1.24) a0.27 (0.27) c
p-value<0.001<0.001<0.001<0.001<0.001<0.001
10–20 cmUF66.59 (0.71) a54.82 (0.92) a9.16 (0.27) c11.56 (0.42) c17.91 (0.45) b3.95 (0.18) b
RSF60.13 (0.45) c43.33 (0.66) c13.92 (0.51) a16.33 (0.71) a18.87 (0.37) b4.68 (0.30) a
MEP63.67 (0.85) b49.97 (0.81) b11.32 (0.31) b13.13 (0.62) bc19.68 (0.67) b3.52 (0.06) b
BL31.13 (1.53) d23.33 (1.58) d1.21 (0.57) d14.43 (0.42) b54.44 (1.85) a0.00 (0.00) c
p-value<0.001<0.001<0.001<0.001<0.001<0.001
Values are means with SE in parentheses. The different lowercase letters indicate significant differences at p < 0.05 level among different sites at the same depth, and no letters indicate no significant difference, respectively. B: bacteria; G+: Gram-positive (G+) bacteria; G-: Gram-negative (G-) bacteria; F: fungi; ACT: actinomycetes; AMF: arbuscular mycorrhizal fungi. UF: nearby undisturbed forest; RSF: restored secondary forest; MEP: managed Eucalyptus plantation; BL: bare land.
Table 6. Statistical test of the effects of different research sites on absolute enzyme activities and ecoenzymatic stoichiometry at two soil depths based on one-factor AVOVA.
DepthCBHβGαGXYLNAGLAPACPPhOxPeroxβG/
(NAG+LAP)
βG/ACP(NAG+LAP)/
ACP
0–10 cm<0.001<0.001<0.001<0.001<0.001<0.001<0.001<0.001<0.001<0.001<0.001<0.001
10–20 cm<0.001<0.001<0.001<0.001<0.001<0.001<0.001<0.001<0.001<0.001<0.001<0.001

