Variations in the Compositions of Soil Bacterial and Fungal Communities Due to Microhabitat Effects Induced by Simulated Nitrogen Deposition of a Bamboo Forest in Wetland


Abstract
1. Introduction
2. Materials and Methods
2.1. Overview of the Study Area
2.2. Field Experiment and Soil Sampling
2.3. Measurement of Soil Microhabitat Properties
2.4. DNA Extraction, Polymerase Chain Reaction, and Illumina HiSeq Sequencing
2.5. Data Processing and Statistical Analysis
3. Results
3.1. Soil Microhabitats Affected by SND
3.2. Variations in the Structure and Composition of the Microbial Community under SND
3.3. Variations in Microbial Alpha Diversity under SND
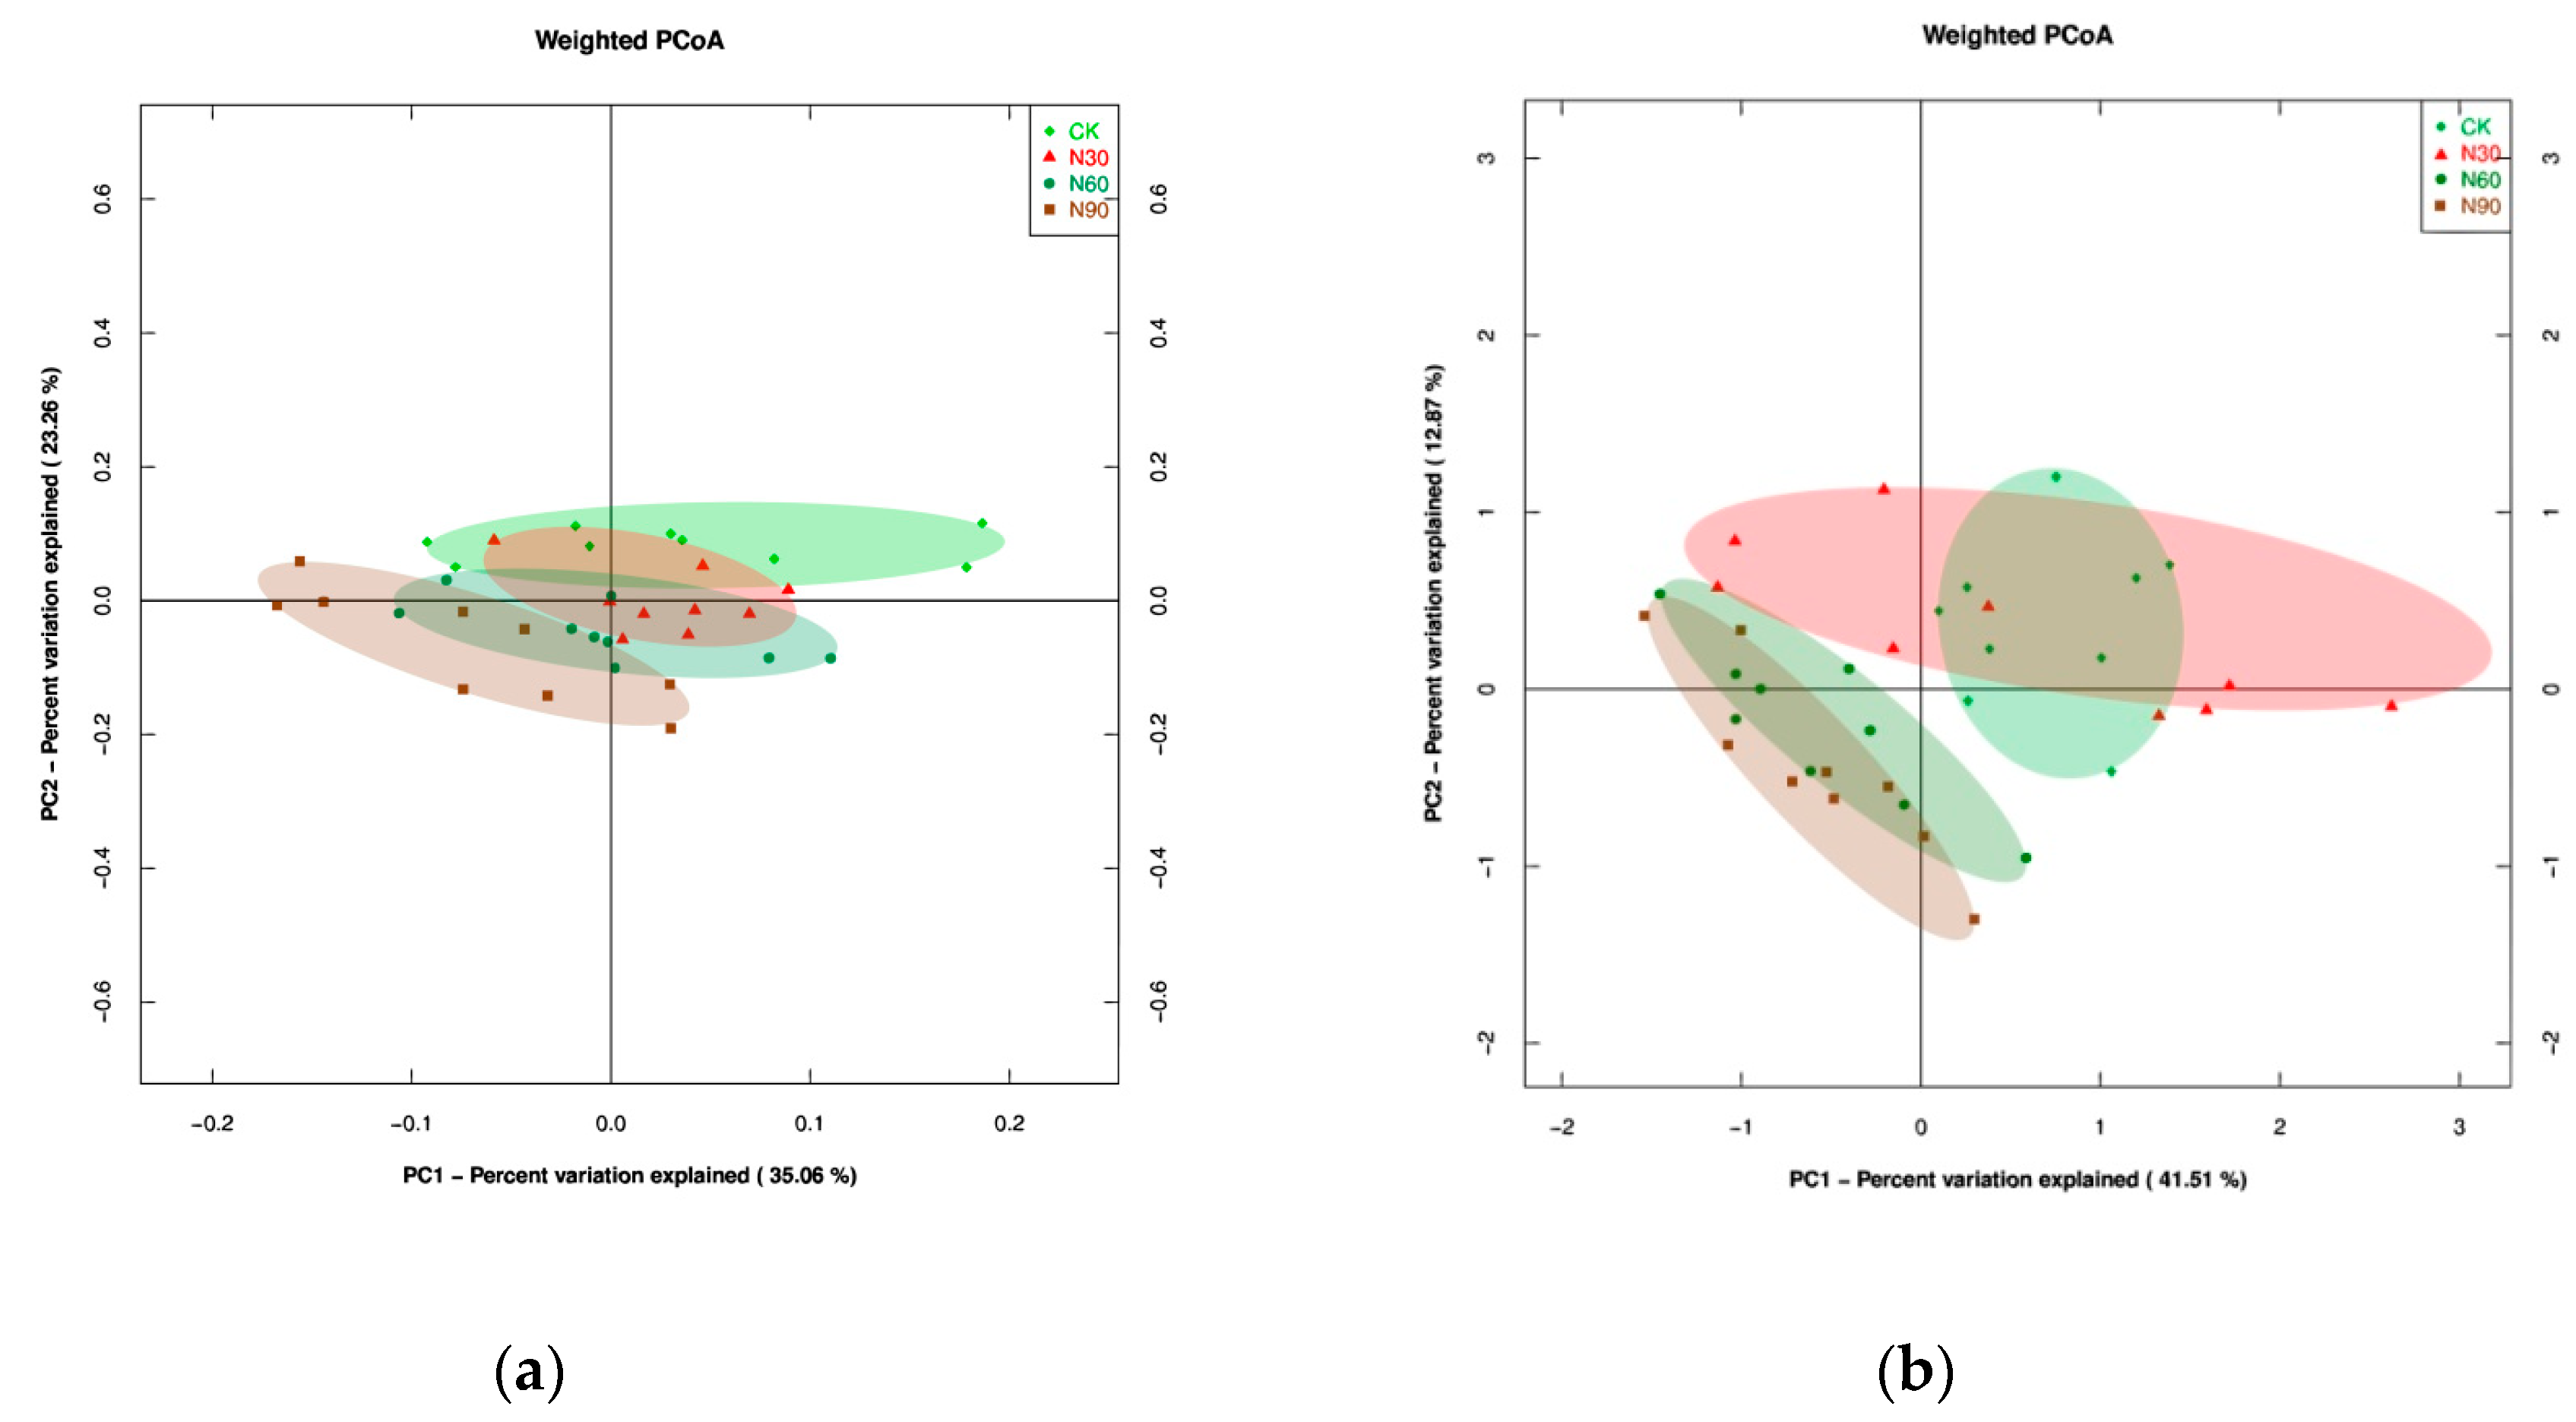
3.4. Characteristics of Microbial Beta-Diversity under SND
3.5. Relationship Between Soil Microhabitats and Microbial Compositions
4. Discussion
4.1. Main Characteristics of Soil Microhabitats
4.2. Microbial Community Composition and Structure
4.3. Main Characteristics of Microhabitat–Microbial Interactions under SND
5. Conclusions
Author Contributions
Funding
Conflicts of Interest
Abbreviations
| Simulated nitrogen deposition | SND |
| Control | CK |
| low N | N30 |
| medium N | N60 |
| high N | N90 |
| internal transcribed spacer | ITS |
| ribosomal RNA | rRNA |
| soil water content | SWC |
| soil specific gravity | SSG |
| specific surface area | SSA |
| observed species | OS |
| fungi/bacteria | F/B |
References
- Whigham, D.F.; Verhoeven, J.T.A.; Samarkin, V.; Megonigal, P.J. Responses of Avicennia germinans (Black Mangrove) and the soil microbial community to nitrogen addition in a hypersaline wetland. Estuaries Coasts 2009, 32, 926–936. [Google Scholar] [CrossRef]
- Wang, D.W.; Bai, J.H.; Wang, W.; Zhang, G.L.; Cui, B.S.; Liu, X.H.; Li, X.W. Comprehensive assessment of soil quality for different wetlands in a Chinese delta. Land. Degrad. Dev. 2018, 29, 3783–3794. [Google Scholar] [CrossRef]
- Hungate, B.A.; Dukes, J.S.; Shaw, M.R.; Luo, Y.; Field, C.B. Nitrogen and climate change. Science 2003, 302, 1512–1513. [Google Scholar] [CrossRef] [PubMed]
- Law, B. Nitrogen deposition and forest carbon. Nature 2013, 496, 307–308. [Google Scholar] [CrossRef] [PubMed]
- Galloway, J.N.; Townsend, A.R.; Erisman, J.W.; Bekunda, M.; Cai, Z.; Freney, J.R.; Martinelli, L.A.; Seitzinger, S.P.; Sutton, M.A. Transformation of the nitrogen cycle: Recent trends, questions, and potential solutions. Science 2008, 320, 889–892. [Google Scholar] [CrossRef]
- Zak, D.R.; Pregitzer, K.S.; Burton, A.J.; Edwards, L.P.; Kellner, H. Microbial responses to a changing environment: Implications for the future functioning of terrestrial ecosystems. Funct. Ecol. 2011, 4, 386–395. [Google Scholar] [CrossRef]
- Song, X.Z.; Zhou, G.M.; Gu, H.H.; Qi, L.H. Management practices amplify the effects of N deposition on leaf litter decomposition of the moso bamboo forest. Plant Soil 2015, 395, 391–400. [Google Scholar] [CrossRef]
- Neff, J.C.; Townsend, A.R.; Gleixnerk, G.; Lehman, S.J.; Turnbull, J.; Bowman, W.D. Variable effects of nitrogen additions on the stability and turnover of soil carbon. Nature 2002, 419, 915–917. [Google Scholar] [CrossRef]
- Shrestha, P.; Gautam, R.; Ashwath, N. Effects of agronomic treatments on functional diversity of soil microbial community and microbial activity in a revegetated coal mine spoil. Geoderma 2019, 338, 40–47. [Google Scholar] [CrossRef]
- Lopez-Lozano, N.E.; Carcaño-Montiel, M.G.; Bashan, Y. Using native trees and cacti to improve soil potential nitrogen fixation during long–term restoration of arid lands. Plant Soil 2016, 403, 317–329. [Google Scholar] [CrossRef]
- Tan, X.; Kan, L.; Su, Z.; Di, L.; Zhang, M. The composition and diversity of soil bacterial and fungal communities along an urban-to-rural gradient in South China. Forests 2019, 10, 797. [Google Scholar] [CrossRef]
- Li, W.C.; Sheng, H.Y.; Jiang, Y.P.; Wen, X. Soil CO2 flux and its influence factors of different bamboo plantations in the dike-pond ecosystem. Sci. Silvae Sin. 2018, 54, 13–22. [Google Scholar]
- Liu, W.X.; Jiang, L.; Hu, S.J.; Li, L.H.; Liu, L.L.; Wan, S.Q. Decoupling of soil microbes and plants with increasing anthropogenic nitrogen inputs in a temperate steppe. Soil Biol. Biochem. 2014, 72, 116–122. [Google Scholar] [CrossRef]
- Posada, R.H.; de Prager, M.S.; Heredia-Abarca, G.; Sieverding, E. Effects of soil physical and chemical parameters, and farm management practices on arbuscular mycorrhizal fungi communities and diversities in coffee plantations in Colombia and Mexico. Agrofor. Syst. 2018, 92, 555–574. [Google Scholar] [CrossRef]
- Li, Z.L.; Tian, D.S.; Wang, B.X.; Wang, J.S.; Wang, S.; Chen, H.Y.H.; Xu, X.F.; Wang, C.H.; He, N.P.; Niu, S.L. Microbes drive global soil nitrogen mineralization and availability. Glob. Chang. Biol. 2019, 25, 1078–1088. [Google Scholar] [CrossRef] [PubMed]
- Sukdeo, N.; Teen, E.; Rutherford, P.M.; Massicotte, H.B.; Egger, K.N. Selecting fungal disturbance indicators to compare forest soil profile reconstruction regimes. Ecol. Indic. 2018, 84, 662–682. [Google Scholar] [CrossRef]
- Manici, L.M.; Castellini, M.; Caputo, F. Soil–inhabiting fungi can integrate soil physical indicators in multivariate analysis of Mediterranean agroecosystem dominated by old olive groves. Ecol. Indic. 2019, 106, 105490. [Google Scholar] [CrossRef]
- Hemkemeyer, M.; Christensen, B.T.; Martens, R.; Tebbe, C.C. Soil particle size fractions harbour distinct microbial communities and differ in potential for microbial mineralisation of organic pollutants. Soil Biol. Biochem. 2015, 90, 255–265. [Google Scholar] [CrossRef]
- Coutinho, E.S.; Barbosa, M.; Beiroz, W.; Mescolotti, D.L.C.; Bonfim, J.A.; Berbara, R.L.L.; Fernandes, G.W. Soil constraints for arbuscular mycorrhizal fungi spore community in degraded sites of rupestrian grassland: Implications for restoration. Eur. J. Soil Biol. 2019, 90, 51–57. [Google Scholar] [CrossRef]
- Fox, A.; Ikoyi, I.; Torres-Sallan, G.; Lanigan, G.; Schmalenberger, A.; Wakelin, S.; Creamer, R. The influence of aggregate size fraction and horizon position on microbial community composition. Appl. Soil Ecol. 2018, 127, 19–29. [Google Scholar] [CrossRef]
- Shen, D.Y.; Ye, C.L.; Hu, Z.K.; Chen, X.Y.; Guo, H.; Li, J.Y.; Du, G.Z.; Adl, S.; Liu, M.Q. Increased chemical stability but decreased physical protection of soil organic carbon in response to nutrient amendment in a Tibetan alpine meadow. Soil Biol. Biochem. 2018, 126, 11–21. [Google Scholar] [CrossRef]
- Janssens, I.A.; Dieleman, W.; Luyssaert, S.; Subke, J.-A.; Reichstein, M.; Ceulemans, R.; Ciais, P.; Dolman, A.J.; Grace, J.; Matteucci, G.; et al. Reduction of forest soil respiration in response to nitrogen deposition. Nat. Geosci. 2010, 3, 315–322. [Google Scholar] [CrossRef]
- Marupakula., S.; Mahmood, S.; Jernberg, J.; Nallanchakravarthula, S.; Fahad, Z.A.; Finlay, R.D. Bacterial microbiomes of individual ectomycorrhizal Pinus sylvestris roots are shaped by soil horizon and differentially sensitive to nitrogen addition. Environ. Microbiol. 2017, 19, 4736–4753. [Google Scholar]
- Fisher, K.A.; Yarwood, S.A.; James, B.R. Soil urease activity and bacterial ureC gene copy numbers: Effect of pH. Geoderma 2017, 285, 1–8. [Google Scholar] [CrossRef]
- Oehl, F.; Laczko, E.; Oberholzer, H.-R.; Jansa, J.; Egli, S. Diversity and biogeography of arbuscular mycorrhizal fungi in agricultural soils. Biol. Fertil. Soils 2017, 53, 777–797. [Google Scholar] [CrossRef]
- Kou, L.; Zhang, X.Y.; Wang, H.M.; Yang, H.; Zhao, W.; Li, S.G. Nitrogen additions inhibit nitrification in acidic soils in a subtropical pine plantation: Effects of soil pH and compositional shifts in microbial groups. J. For. Res. 2019, 30, 669–678. [Google Scholar] [CrossRef]
- Huang, G.; Cao, Y.F.; Wang, B.; Li, Y. Effects of nitrogen addition on soil microbes and their implications for soil C emission in the Gurbantunggut Desert, center of the Eurasian Continent. Sci. Total Environ. 2015, 515–516, 215–224. [Google Scholar] [CrossRef]
- Neumann, D.; Heuer, A.; Hemkemeyer, M.; Martens, R.; Tebbe, C.C. Response of microbial communities to long–term fertilization depends on their microhabitat. FEMS Microbiol. Ecol. 2013, 86, 71–84. [Google Scholar] [CrossRef]
- Zhang, Q.; Liang, G.Q.; Guo, T.F.; He, P.; Wang, X.B.; Zhou, W. Evident variations of fungal and actinobacterial cellulolytic communities associated with different humified particle–size fractions in a long–term fertilizer experiment. Soil Biol. Biochem. 2017, 11, 13–31. [Google Scholar] [CrossRef]
- Sessitsch, A.; Weilharter, A.; Gerzabek, M.H.; Kirchmann, H.; Kandeler, E. Microbial population structures in soil particle size fractions of a long–term fertilizer field experiment. Appl. Environ. Microbiol. 2001, 67, 4215–4224. [Google Scholar] [CrossRef]
- Mummey, D.L.; Stahl, P.D. Analysis of soil whole- and inner-microaggregate bacterial communities. Microb. Ecol. 2004, 48, 41–50. [Google Scholar] [CrossRef] [PubMed]
- Poll, C.; Thiede, A.; Wermbter, N.; Sessitsch, A.; Kandeler, E. Micro–scale distribution of microorganisms and microbial enzyme activities in a soil with long–term organic amendment. Eur. J. Soil Sci. 2003, 54, 715–724. [Google Scholar] [CrossRef]
- Li, W.C.; Sheng, H.Y.; Zhong, Z.K.; Ding, B.Y. Seed banks characteristics according to different land use type of Xixi wetlands in Hangzhou. Sci. Silvae Sin. 2007, 43, 163–169. [Google Scholar]
- Cui, J.; Zhou, J.; Peng, Y.; He, Y.Q.; Yang, H.; Mao, J.D.; Zhang, M.L.; Wang, Y.H.; Wang, S.W. Atmospheric wet deposition of nitrogen and sulfur in the agroecosystem in developing and developed areas of Southeastern China. Atmos. Environ. 2014, 89, 102–108. [Google Scholar] [CrossRef]
- Klindworth, A.; Pruesse, E.; Schweer, T.; Peplies, J.; Quast, C.; Horn, M.; Glockner, F.O. Evaluation of general 16S ribosomal RNA gene PCR primers for classical and next-generation sequencing-based diversity studies. Nucleic Acids Res. 2012, 41, e1. [Google Scholar] [CrossRef]
- Tedersoo, L.; Lindahl, B. Fungal identification biases in microbiome projects. Environ. Microbiol. Rep. 2016, 8, 774–779. [Google Scholar] [CrossRef]
- Edgar, R.C. Search and clustering orders of magnitude faster than BLAST. Bioinformatics 2010, 26, 2460–2461. [Google Scholar] [CrossRef]
- Caporaso, J.G.; Kuczynski, J.; Stombaugh, J.; Bittinger, K.; Bushman, F.D.; Costello, E.K.; Fierer, N.; Pena, A.G.; Goodrich, J.K.; Gordon, J.I.; et al. QIIME allows analysis of high-throughput community sequencing data. Nature Methods 2010, 7, 335–336. [Google Scholar] [CrossRef]
- Tang, Q.Y.; Zhang, C.X. Data Processing System (DPS) software with experimental design, statistical analysis and data mining developed for use in entomological research. Insect Sci. 2013, 20, 254–260. [Google Scholar] [CrossRef]
- Oksanen, J.; Blanchet, F.G.; Kindt, R.; Legendre, P.; Minchin, P.R.; O’Hara, R. Vagan: Community Ecology Package. R Package Version 22-1. 2015. Available online: http://CRAN.R-project.org/package=vegan (accessed on 29 November 2019).
- Wickham, H. Ggplots2: Elegant Graphics for Data Analysis; Springer: New York, NY, USA, 2016. [Google Scholar]
- Field, A.; Miles, J.; Field, Z. Discovering Statistics Using R; Sage Publications: London, UK, 2012. [Google Scholar]
- Liu, J.; Wu, N.N.; Wang, H.; Sun, J.F.; Peng, B.; Jiang, P.; Bai, E. Nitrogen addition affects chemical compositions of plant tissues, litter and soil organic matter. Ecology 2016, 97, 1796–1806. [Google Scholar] [CrossRef]
- Li, C.H.; Ma, B.L.; Zhang, T.Q. Soil bulk density effects on soil microbial populations and enzyme activities during the growth of maize (Zea mays L.) planted in large pots under field exposure. Can. J. Plant Sci. 2002, 82, 147–154. [Google Scholar] [CrossRef]
- Kumaresan, D.; Stralis-Pavese, N.; Abell, G.C.J.; Bodrossy, L.; Murrell, J.C. Physical disturbance to ecological niches created by soil structure alters community composition of methanotrophsemi. Environ. Microbiol. Rep. 2011, 3, 613–621. [Google Scholar] [CrossRef]
- Lu, M.; Zhou, X.H.; Luo, Y.Q.; Yang, Y.H.; Fang, C.M.; Chen, J.K. Minor stimulation of soil carbon storage by nitrogen addition: A meta-analysis. Agric. Ecosyst. Environ. 2011, 140, 234–244. [Google Scholar] [CrossRef]
- Rousk, J.; Brookes, P.C.; Bååth, E. Fungal and bacterial growth responses to N fertilization and pH in the 150-Year ‘Park Grass’ UK grassland experiment. FEMS Microbiol. Ecol. 2011, 76, 89–99. [Google Scholar] [CrossRef] [PubMed]
- Wang, R.Z.; Filley, T.R.; Xu, Z.W.; Wang, X.; Li, M.H.; Zhang, Y.G.; Luo, W.T.; Jiang, Y. Coupled response of soil carbon and nitrogen pools and enzyme activities to nitrogen and water addition in a semi-arid grassland of Inner Mongolia. Plant Soil 2014, 381, 323–336. [Google Scholar] [CrossRef]
- Ma, S.Y.; Verheyen, K.; Props, R.; Wasof, S.; Vanhellemont, M.; Boeckx, P.; Boon, N.; de Frenne, P. Plant and soil microbe responses to light, warming and nitrogen addition in a temperate forest. Funct. Ecol. 2018, 32, 1293–1303. [Google Scholar] [CrossRef]
- van Diepen, L.T.; Lilleskov, E.A.; Pregitzer, K.S.; Miller, R.M. Simulated nitrogen deposition causes a decline of intra- and ex-traradical abundance of arbuscular mycorrhizal fungi and changes in microbial community structure in northern hard-wood forests. Ecosystems 2010, 13, 683–695. [Google Scholar] [CrossRef]
- Freitag, T.E.; Chang, L.; Clegg, C.D.; Prosser, J.I. Influence of inorganic nitrogen management regime on the diversity of nitrite-oxidizing bacteria in agricultural grassland soils. Appl. Environ. Microbiol. 2005, 71, 8323–8334. [Google Scholar] [CrossRef]
- Strickland, M.S.; Rousk, J. Considering fungal: Bacterial dominance in soils—Methods, controls, and ecosystem implications. Soil Biol. Biochem. 2010, 42, 1385–1395. [Google Scholar] [CrossRef]
- DeForest, J.L.; Zak, D.R.; Pregitzer, K.S.; Burton, A.J. Atmospheric nitrate deposition, microbial community composition, and enzyme activity in northern hardwood forests. Soil Sci. Soc. Am. J. 2004, 68, 132–138. [Google Scholar] [CrossRef]
- Blaško, R.; Högberg, P.; Bach, L.H.; Högberg, M.N. Relations among soil microbial community composition, nitrogen turnover, and tree growth in N-loaded and previously N-loaded boreal spruce forest. For. Ecol. Manag. 2013, 302, 319–328. [Google Scholar] [CrossRef]
- Demoling, F.; Nilsson, L.O.; Bfifith, E. Bacterial and fungal response to nitrogen fertilization in three coniferous forest soils. Soil Biol. Biochem. 2008, 40, 370–379. [Google Scholar] [CrossRef]
- Näther, A.; Foesel, B.U.; Naegele, V.; Wüst, P.K.; Weinert, J.; Bonkowski, M.; Alt, F.; Oelmann, Y.; Polle, A.; Lohaus, G.; et al. Environmental factors affect acidobacterial communities below the subgroup level in grassland and forest soils. Appl. Environ. Microbiol. 2012, 78, 7398–7406. [Google Scholar] [CrossRef] [PubMed]
- Mapelli, F.; Marasco, R.; Fusi, M.; Scaglia, B.; Tsiamis, G.; Rolli, E.; Fodelianakis, S.; Bourtzis, K.; Ventura, S.; Tambone, F.; et al. The stage of soil development modulates rhizosphere effect along a High Arctic desert chronosequence. ISME J. 2018, 12, 1188–1198. [Google Scholar] [CrossRef]
- Lauber, C.L.; Hamady, M.; Knight, R.; Fierer, N. Pyrosequencing-based assessment of soil ph as a predictor of soil bacterial community structure at the continental Scale. Appl. Environ. Microbiol. 2009, 75, 5111–5120. [Google Scholar] [CrossRef] [PubMed]
- Bååth, E.; Anderson, T.H. Comparison of soil fungal/bacterial ratios in a pH gradient using physiological and PLFA-based techniques. Soil Biol. Biochem. 2003, 35, 955–963. [Google Scholar] [CrossRef]
- Kabir, M.; Chotte, J.L.; Rahman, M.; Bally, R.; Jocteur-Monrozier, L. Distribution of soil fractions and location of soil bacteria in a vertisol under cultivation and perennial grass. Plant Soil 1994, 163, 243–255. [Google Scholar] [CrossRef]
- Treseder, K.K. A meta-analysis of mycorrhizal responses to nitrogen, phosphorus, and atmospheric CO2 in field studies. New Phytol. 2004, 164, 347–355. [Google Scholar] [CrossRef]
- Stevens, B.M.; Propster, J.; Wilson, G.W.T.; Abraham, A.; Ridenour, C.; Doughty, C.; Johnson, N.C. Mycorrhizal symbioses influence the trophic structure of the Serengeti. J. Ecol. 2018, 106, 536–546. [Google Scholar] [CrossRef]
- Hazard, C.; Gosling, P.; van der Gast, C.J.; Mitchell, D.T.; Doohan, F.M.; Bending, G.D. The role of local environment and geographical distance in determining community composition of arbuscular mycorrhizal fungi at the landscape scale. ISME J. 2013, 7, 498–508. [Google Scholar] [CrossRef]


| CK | N30 | N60 | N90 | |
|---|---|---|---|---|
| pH | 5.50 ± 0.16a | 5.43 ± 0.12a | 5.26 ± 0.12b | 5.14 ± 0.09b |
| Soil water content (wt.%) | 20.75 ± 1.55a | 19.89 ± 2.63a | 20.95 ± 2.11a | 21.95 ± 1.95a |
| Soil specific gravity | 2.47 ± 0.07a | 2.51 ± 0.09a | 2.54 ± 0.14a | 2.60 ± 0.27a |
| Bulk density (g·cm3) | 1.31 ± 0.19a | 1.35 ± 0.20a | 1.33 ± 0.15a | 1.26 ± 0.14a |
| Clay (<2 μm, %) | 2.29 ± 0.28a | 2.28 ± 0.18a | 2.47 ± 0.13ab | 2.51 ± 0.11b |
| Fine silt (2–20 μm, %) | 29.68 ± 3.94a | 30.04 ± 4.21a | 33.22 ± 2.55a | 31.01 ± 4.11a |
| Coarse silt (20–63 μm, %) | 53.34 ± 4.16a | 55.47 ± 2.52a | 56.07 ± 2.64a | 54.93 ± 1.53a |
| Sand (<63 μm, %) | 14.69 ± 4.40a | 12.21 ± 5.61ab | 8.24 ± 2.45b | 11.55 ± 3.01ab |
| Specific surface area (m²·kg) | 463.05 ± 30.42a | 468.39 ± 42.25ab | 512.63 ± 35.37b | 498.07 ± 58.09ab |
| Kingdom | Phylum | CK | N30 | N60 | N90 |
|---|---|---|---|---|---|
| Bacteria | Acidobacteria | 30.48 ± 5.65c | 31.46 ± 2.49bc | 33.78 ± 5.00b | 38.05 ± 6.49a |
| Proteobacteria | 16.78 ± 1.40a | 17.38 ± 2.18a | 18.29 ± 3.30a | 17.36 ± 3.28a | |
| Planctomycetes | 16.99 ± 3.19a | 14.28 ± 3.32b | 11.60 ± 2.07c | 11.20 ± 3.50c | |
| Bacteroidetes | 9.10 ± 2.24a | 8.81 ± 2.13a | 10.25 ± 3.75a | 8.71 ± 4.03a | |
| Verrucomicrobia | 5.02 ± 0.87c | 9.32 ± 1.98a | 9.03 ± 1.25a | 7.30 ± 1.71b | |
| Chloroflexi | 5.65 ± 1.02a | 5.55 ± 1.42a | 5.62 ± 2.41a | 5.65 ± 1.78a | |
| Actinobacteria | 1.88 ± 0.35a | 2.21 ± 0.71a | 2.20 ± 0.51a | 1.77 ± 0.46a | |
| Gemmatimonadetes | 1.47 ± 0.20a | 1.33 ± 0.40ab | 1.12 ± 0.41b | 1.02 ± 0.31b | |
| TM7 | 1.84 ± 0.30a | 0.73 ± 0.26b | 0.56 ± 0.15b | 0.62 ± 0.20b | |
| Nitrospirae | 1.63 ± 0.27b | 2.42 ± 0.91a | 1.78 ± 0.86b | 1.75 ± 0.75b | |
| Chlamydiae | 1.59 ± 0.72a | 1.24 ± 0.63a | 1.26 ± 0.34a | 1.30 ± 0.50a | |
| OD1 | 1.32 ± 0.57a | 0.38 ± 0.24b | 0.30 ± 0.14b | 0.22 ± 0.16b | |
| Fungi | Ascomycota | 28.36 ± 10.25a | 32.15 ± 9.87a | 27.93 ± 6.97a | 30.73 ± 6.11a |
| Basidiomycota | 8.13 ± 5.62b | 8.43 ± 7.58ab | 11.30 ± 7.58ab | 14.76 ± 7.58a | |
| Zygomycota | 10.70 ± 6.77a | 11.15 ± 7.75a | 3.14 ± 2.10b | 4.06 ± 2.25b | |
| Glomeromycota | 1.15 ± 1.32b | 2.81 ± 2.09a | 2.69 ± 1.53a | 3.34 ± 1.20a | |
| Chytridiomycota | 0.07 ± 0.06b | 0.05 ± 0.03b | 1.05 ± 0.47a | 0.61 ± 0.12a | |
| Unidentified | 49.90 ± 13.14a | 48.49 ± 13.71a | 54.46 ± 9.27a | 46.89 ± 7.19a |
| Kingdom | Index | CK | N30 | N60 | N90 |
|---|---|---|---|---|---|
| Bacteria | Chao1 | 3246.9 ± 583.4a | 3123.2 ± 249.4a | 2978.0 ± 271.4ab | 2597.4 ± 279.9b |
| Observed species | 1817.8 ± 216.1a | 1785.9 ± 114.6ab | 1699.2 ± 127.3ab | 1642.9 ± 290.4b | |
| Shannon | 9.41 ± 0.26a | 9.37 ± 0.20a | 9.22 ± 0.25ab | 9.04 ± 0.39b | |
| Simpson | 0.9963 ± 0.0007a | 0.9959 ± 0.0008a | 0.9954 ± 0.0010a | 0.9943 ± 0.0015b | |
| Fungi | Chao1 | 179.5 ± 20.7a | 180.4 ± 31.3a | 181.6 ± 26.7a | 170.4 ± 15.8a |
| Observed species | 131.7 ± 19.2a | 138.2 ± 23.1a | 146.8 ± 19.1a | 141.5 ± 11.0a | |
| Shannon | 4.58 ± 0.69b | 4.90 ± 0.63ab | 5.28 ± 0.50a | 5.31 ± 0.26a | |
| Simpson | 0.8835 ± 0.0758b | 0.9173 ± 0.0399ab | 0.9375 ± 0.0304a | 0.9397 ± 0.0171a | |
| F/B | 0.0690 ± 0.0097b | 0.0685 ± 0.0122b | 0.0797 ± 0.0120ab | 0.0830 ± 0.0116a |
| CK | N30 | N60 | N90 | ||||
|---|---|---|---|---|---|---|---|
| Phylum/class | N. clade | Phylum/class | N. clade | Phylum/class | N. clade | Phylum/class | N. clade |
| Proteobacteria | 22 | Proteobacteria | 13 | Proteobacteria | 12 | Proteobacteria | 13 |
| Chloroflexi | 10 | Acidobacteria | 8 | Acidobacteria | 7 | Acidobacteria | 12 |
| Planctomycetes | 10 | Chloroflexi | 5 | Bacteroidetes | 7 | Chloroflexi | 3 |
| Armatimonadetes | 9 | Verrucomicrobia | 5 | Fusobacteria | 7 | Spirochaetes | 3 |
| Bacteroidetes | 8 | Actinobacteria | 4 | Chloroflexi | 3 | Firmicutes | 2 |
| Verrucomicrobia | 6 | Nitrospirae | 4 | Firmicutes | 3 | Bacteroidetes | 2 |
| Spirochaetes | 6 | Planctomycetes | 3 | Nitrospirae | 2 | Actinobacteria | 2 |
| Tenericutes | 4 | Armatimonadetes | 2 | Planctomycetes | 1 | Armatimonadetes | 2 |
| OD1 | 4 | Firmicutes | 2 | Gemmatimonadetes | 1 | Verrucomicrobia | 2 |
| Elusimicrobia | 3 | Bacteroidetes | 1 | WS3 | 1 | ||
| Acidobacteria | 2 | Gemmatimonadetes | 1 | ||||
| Actinobacteria | 2 | ||||||
| WS6 | 2 | ||||||
| WS3 | 2 | ||||||
| BRC1 | 2 | ||||||
| Fibrobacteres | 2 | ||||||
| Gemmatimonadetes | 2 | ||||||
| GN02 | 2 | ||||||
| OP11 | 2 | ||||||
| TM7 | 2 | ||||||
| Firmicutes | 1 | ||||||
| Cyanobacteria | 1 | ||||||
| CK | N30 | N60 | N90 | ||||
|---|---|---|---|---|---|---|---|
| Phylum/class | N. clade | Phylum/class | N. clade | Phylum/class | N. clade | Phylum/class | N. clade |
| Ascomycota | 41 | Ascomycota | 21 | Ascomycota | 18 | Ascomycota | 69 |
| Basidiomycota | 15 | Basidiomycota | 7 | Basidiomycota | 8 | Basidiomycota | 14 |
| Chytridiomycota | 4 | Zygomycota | 4 | Glomeromycota | 5 | Glomeromycota | 6 |
| Glomeromycota | 7 | Zygomycota | 4 | ||||
| Zygomycota | 5 | ||||||
© 2019 by the authors. Licensee MDPI, Basel, Switzerland. This article is an open access article distributed under the terms and conditions of the Creative Commons Attribution (CC BY) license (http://creativecommons.org/licenses/by/4.0/).
Share and Cite
Li, W.; Sheng, H.; Ekawati, D.; Jiang, Y.; Yang, H. Variations in the Compositions of Soil Bacterial and Fungal Communities Due to Microhabitat Effects Induced by Simulated Nitrogen Deposition of a Bamboo Forest in Wetland. Forests 2019, 10, 1098. https://doi.org/10.3390/f10121098
Li W, Sheng H, Ekawati D, Jiang Y, Yang H. Variations in the Compositions of Soil Bacterial and Fungal Communities Due to Microhabitat Effects Induced by Simulated Nitrogen Deposition of a Bamboo Forest in Wetland. Forests. 2019; 10(12):1098. https://doi.org/10.3390/f10121098
Chicago/Turabian StyleLi, Weicheng, Haiyan Sheng, Desy Ekawati, Yueping Jiang, and Huimin Yang. 2019. "Variations in the Compositions of Soil Bacterial and Fungal Communities Due to Microhabitat Effects Induced by Simulated Nitrogen Deposition of a Bamboo Forest in Wetland" Forests 10, no. 12: 1098. https://doi.org/10.3390/f10121098
APA StyleLi, W., Sheng, H., Ekawati, D., Jiang, Y., & Yang, H. (2019). Variations in the Compositions of Soil Bacterial and Fungal Communities Due to Microhabitat Effects Induced by Simulated Nitrogen Deposition of a Bamboo Forest in Wetland. Forests, 10(12), 1098. https://doi.org/10.3390/f10121098