Article

Application of a Digital Filter Method to Separate Baseflow in the Small Watershed of Pengchongjian in Southern China

1
School of Land Resources and Environment, Jiangxi Agricultural University, Nanchang 330045, China
2
Key Laboratory of Poyang Lake Watershed Agricultural Resources and Ecology of Jiangxi Province, Nanchang 330045, China
*
Author to whom correspondence should be addressed.
Forests 2019, 10(12), 1065; https://doi.org/10.3390/f10121065
Submission received: 10 October 2019 / Revised: 17 November 2019 / Accepted: 19 November 2019 / Published: 22 November 2019
(This article belongs to the Section Forest Ecology and Management)

Abstract

:
Baseflow plays a crucial role in maintaining the stability of streamflows, especially in watersheds. To reveal the evolution of baseflow in watersheds in southern China, this study investigated the variation in baseflow across the small watershed of Pengchongjian in Jiangxi Province. A digital filter method was applied to separate baseflow from local daily streamflow records for 1983–2014 using different values of filtering parameter (β) and filtering times (T). The separation results were validated by the baseflow index (BFI) method to determine the optimal parameters. When β = 0.90 and T = 2, the baseflow separation results conformed to the actual field situation in the watershed. The average monthly baseflow increased at first and then decreased, being unevenly distribution within a year, whereas average monthly BFI followed the opposite trend. On the seasonal scale, baseflow was ranked as spring > summer > winter > autumn, and the BFI as winter > spring > autumn > summer. Both the annual baseflow and BFI decreased at a rate of 2.30 mm/year and 0.0005/year, respectively. When considered on the annual scale, the BFI was lower in the wet years and higher in the dry years compared with normal years, averaging 0.22 in the watershed for the 1983–2014 period. This study obtained key optimal parameters for baseflow separation and revealed baseflow variation in the Pengchongjian watershed. These results provide a useful reference for studying the patterns of baseflow evolution in watersheds in southern China.

Graphical Abstract

1. Introduction

Baseflow is an important component of streamflow, being the primary recharge of streamflow during the dry season; hence, baseflow plays a crucial role in maintaining the stability of streamflow [1,2]. Furthermore, baseflow is a vital part of groundwater resource assessment and watershed management [3], since variation in baseflow can serve as a reliable indicator of changes in groundwater level and quantity. Therefore, studying the regulation of baseflow variation has great significance for better understanding the characteristics of watershed water resources and realizing their sustainable utilization [4,5]. Because the accurate separation of baseflow from other forms of water movement is required to reveal its variation, baseflow separation has become a popular topic of research in hydrology [6,7,8].
Nowadays, various methods exist to derive baseflow separation, such as graphical analysis methods [9,10,11,12], water balance methods [13,14], chemical and isotopic methods [15,16], and numerical simulation methods. The last relies on a computer to process long-term series data automatically, and this approach is favored for its simple and convenient operation. Corresponding examples mainly include the digital filter [17,18,19], recursive digital filter [20], United Kingdom Institute of Hydrology (UKIH) [21,22,23], hydrograph separation program (HYSEP) [24], and streamflow partitioning method (PART) [25]. In particular, the digital filter method is objective and reproducible, and it has been widely used to separate baseflow [26,27]. Among such studies, however, the filtering parameter (β) and filtering times (T) selected in different watersheds are rarely the same [11,28,29], the β and T values directly affect the results of baseflow separation. Fortunately, the baseflow index (BFI) method provides a convenient and objective way to validate other baseflow separation methods [3,30,31,32]. For example, Santhi et al. [30] estimated the baseflow in hydrologic landscape regions of the United States by using a recursive digital filter and then validated their results by the BFI method. Lin et al. [33] calculated the baseflow of 13 main streams and 20 major tributaries in China’s Yellow River basin by combining the BFI and line separation methods, which effectively reduced the artificiality and randomness of line separation. Li et al. [34] used the BFI method to determine the parameters of digital filtering for baseflow separation in arid and semi-arid regions of China, finding optimal β and T values of 0.80 and 3, respectively. To date, many baseflow studies have been conducted worldwide. In China, such studies are mainly concentrated in its northern region [35,36,37,38,39], whereas in the southern region [40,41,42,43] the research on baseflow is relatively scarce. Therefore, conducting a baseflow study in southern China is necessary and timely.
To that end, this study investigated the variation in baseflow across the small watershed of Pengchongjian in southern China. A digital filter method was used to separate the baseflow, with the results validated by the BFI method to find the optimal parameters (β and T). On this basis, the intra- and inter-annual variations in the baseflow and BFI data were then analyzed. Our study have a great reference value for obtaining accurate baseflow separation in watersheds, in addition to revealing patterns in baseflow evolution in understudied southern China.

2. Materials and Methods

2.1. Study Area

The Pengchongjian watershed is located in Duchang County, Jiujiang City, in Jiangxi Province, China (29°31′44′′–29°32′56′′ N and 116°25′48′′–116°27′7′′ E; Figure 1).
The watershed covers a catchment area of 2.90 km2, part of the red soil region in southern China. The watershed is completely closed, being highly elevated in the northwest and low lying in the southeast, spanning an elevation of 80–560 m. The study area has a subtropical humid monsoon climate, with annual values of average precipitation, runoff, and temperature of 1560 mm, 748 mm, and 17.5 °C, respectively. Precipitation is the main recharge source of runoff. Intra-annual variation in the runoff and precipitation are generally consistent, both of which show an uneven distribution within the year.
No inhabitants live in the watershed, nor have any hydraulic projects or soil and water conservation projects been initiated there. Its main soil type is red soil characterized by acid, infertile, sticky, harden, and droughty properties. The major outcrop strata consist of epimetamorphic rock, granite, and limestone. In addition, the watershed sustains diverse vegetation types. The forest stands include 70% Cunninghamia lanceolata (Lamb.) Hook., 28% Quercus acutissima Carruth., and 2% Phyllostachys heterocycla (Carr.) Mitford cv. Pubescens.

2.2. Data Sources

In 1981, the Pengchongjian hydrological station(29°31′54′′ N, 116°27′1′′ E) was set up at the outlet of this small watershed by the Jiangxi Hydrological Bureau. Since then, the precipitation, streamflow, temperature, and evaporation in the watershed have been continuously observed. The data of our study were provided by this station.

2.3. Baseflow Separation by the BFI Method

The BFI method was proposed in 1980, by the Institute of Hydrology in the United Kingdom [44], and its calculation program developed by researchers from the US Geological Survey [45,46]. The hydrological year is divided into N-day time periods, and the minimum flow for each N-day period is determined. If the product of minimum flow and the turning point test factor (f = 0.9) for any period is less than the adjacent minima, this time point may be taken as the turning point; this step is repeated until all turning points are found. Then, straight lines are used to connect these turning points: the area beneath them is obtained as the estimate of the baseflow volume. The BFI is formally defined as the ratio of baseflow/total streamflow. According to Santhi et al. [30], the number of days (N) is generally set to 5 days or less. In our study, N was set to 2 days after repeated calculations, because this value accurately reflected the baseflow characteristics in the Pengchongjian watershed.

2.4. Baseflow Separation by the Digital Filter Method

Digital filtering is a method of separating surface runoff (i.e., high-frequency signals) and baseflow (i.e., low-frequency signals) from the daily streamflow records, according to a digital filter. Nathan and Mcmahon [11] were the first to apply this method to baseflow separation. Subsequently, Boughton [18] and Chapman and Maxwell [19] improved the digital filter method for better widespread applicability. The surface runoff and baseflow are calculated using Equations (1) and (2):
Q d t = β Q d ( t 1 ) + ( 1 + β ) 2 [ Q t Q ( t 1 ) ]
Q b t = Q t Q d t
where Q d t and Q d ( t 1 )   are the filtered surface runoff values at time steps t and t − 1, respectively; Q t and Q ( t 1 ) are the streamflow values at time steps t and t − 1, respectively; β is the filtering parameter, and Q b t is the baseflow.
The separation accuracy of the digital filter method can be improved via repeated filtering [5,11], however, after more than three such passes, the baseflow is no longer further attenuated [47]. Based on prior research (Table 1), β was set to 0.85, 0.90, 0.925, and 0.95. T was set to one pass (forward), two passes (forward–backward), and three passes (forward–backward–forward).

3. Results and Discussion

Based on the daily streamflow records for the Pengchongjian watershed, the study period 1983–2014 was divided into “wet” years (P ≤ 25%), “normal” years (25% < P ≤ 75%), and “dry” years (P > 75%) by using the P-III type distribution frequency curve. Then, 2003 (wet), 2006 (normal), and 2011 (dry) were selected as typical hydrological years for the baseflow separation.

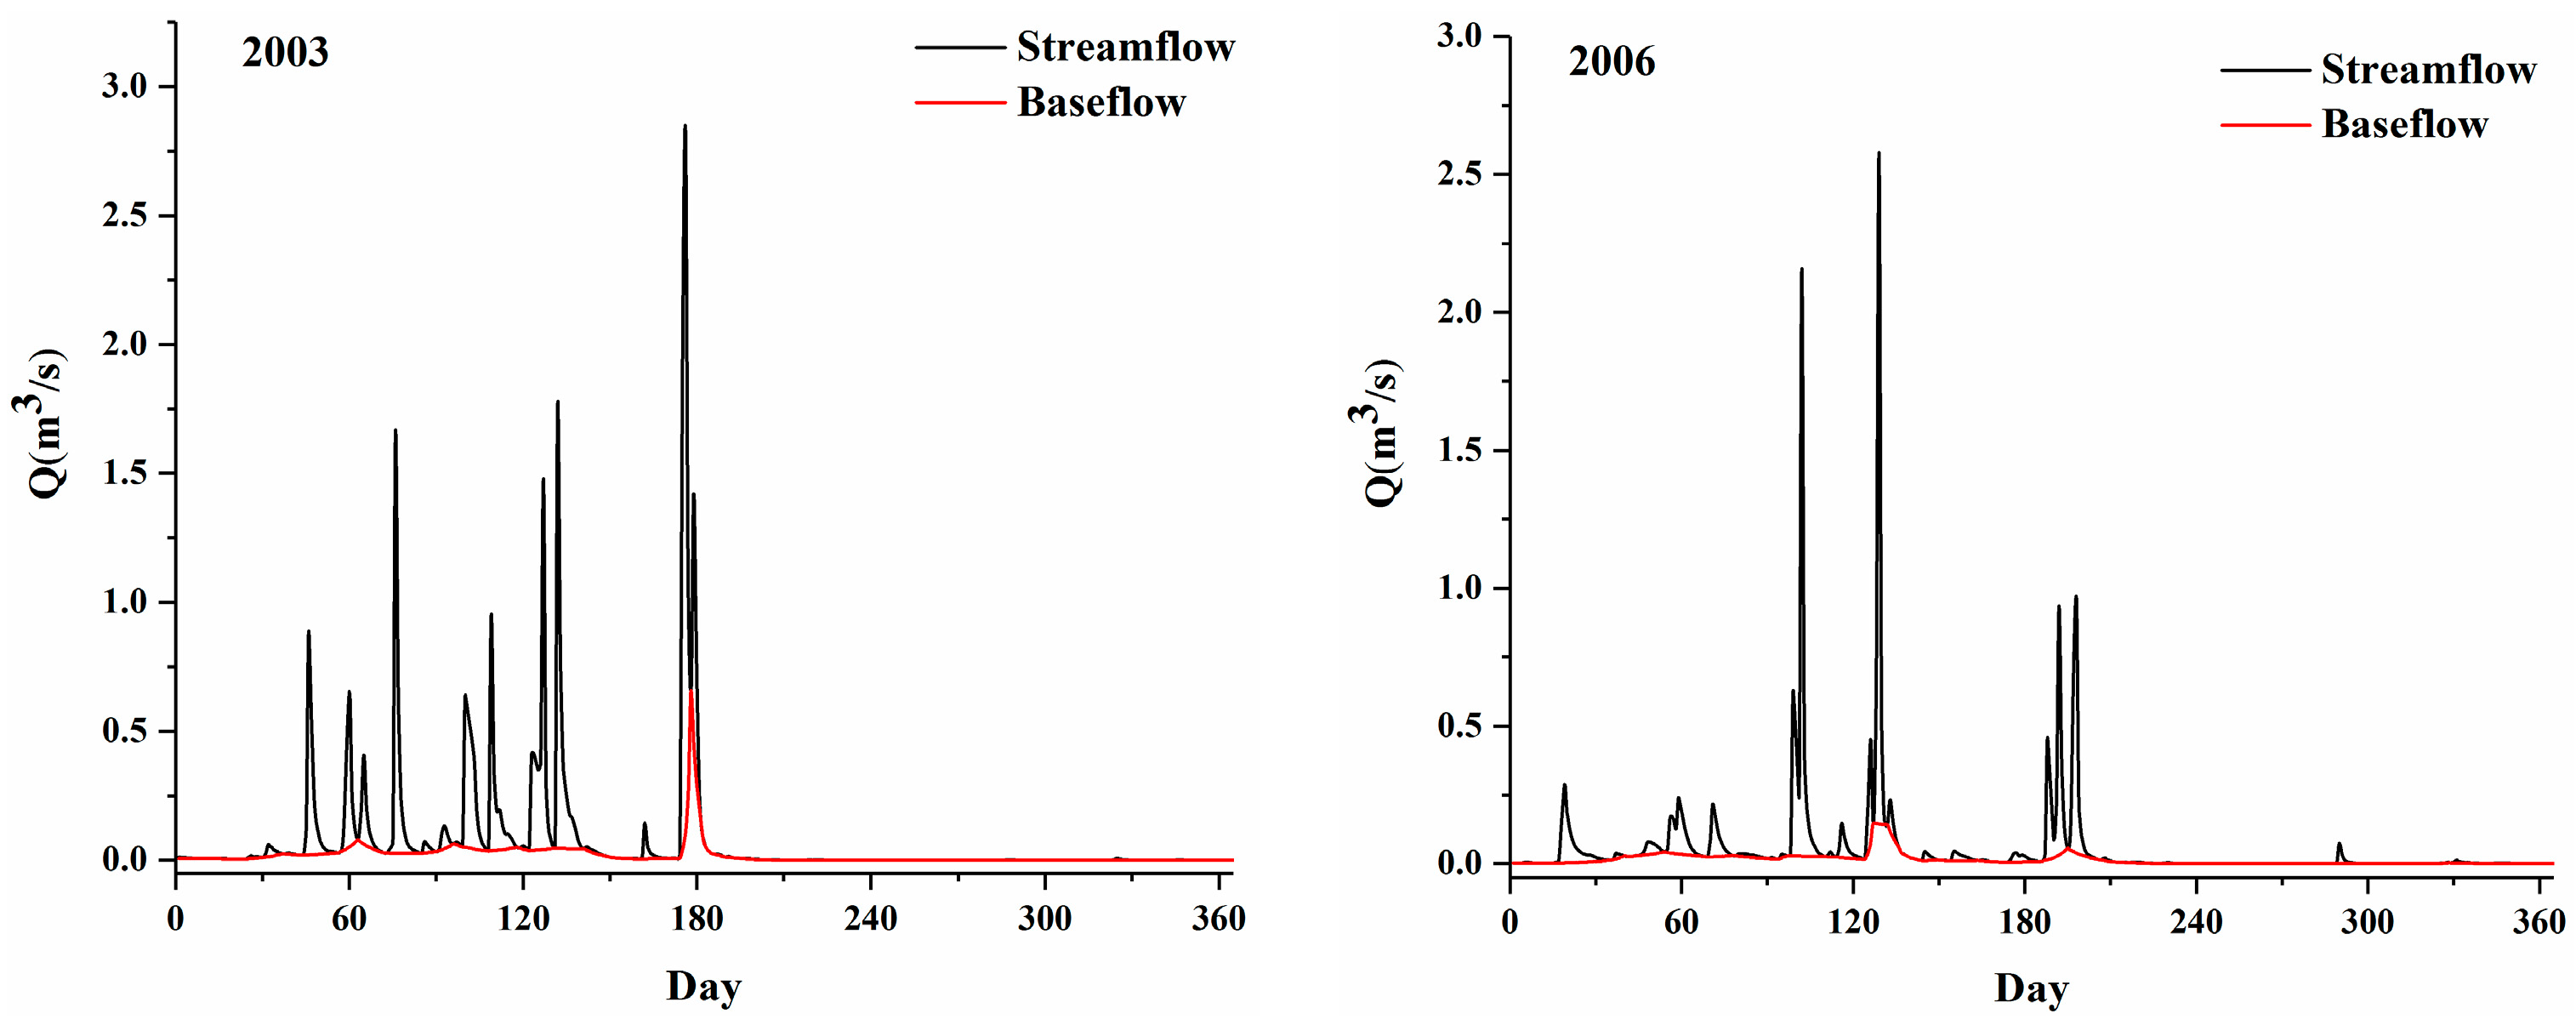
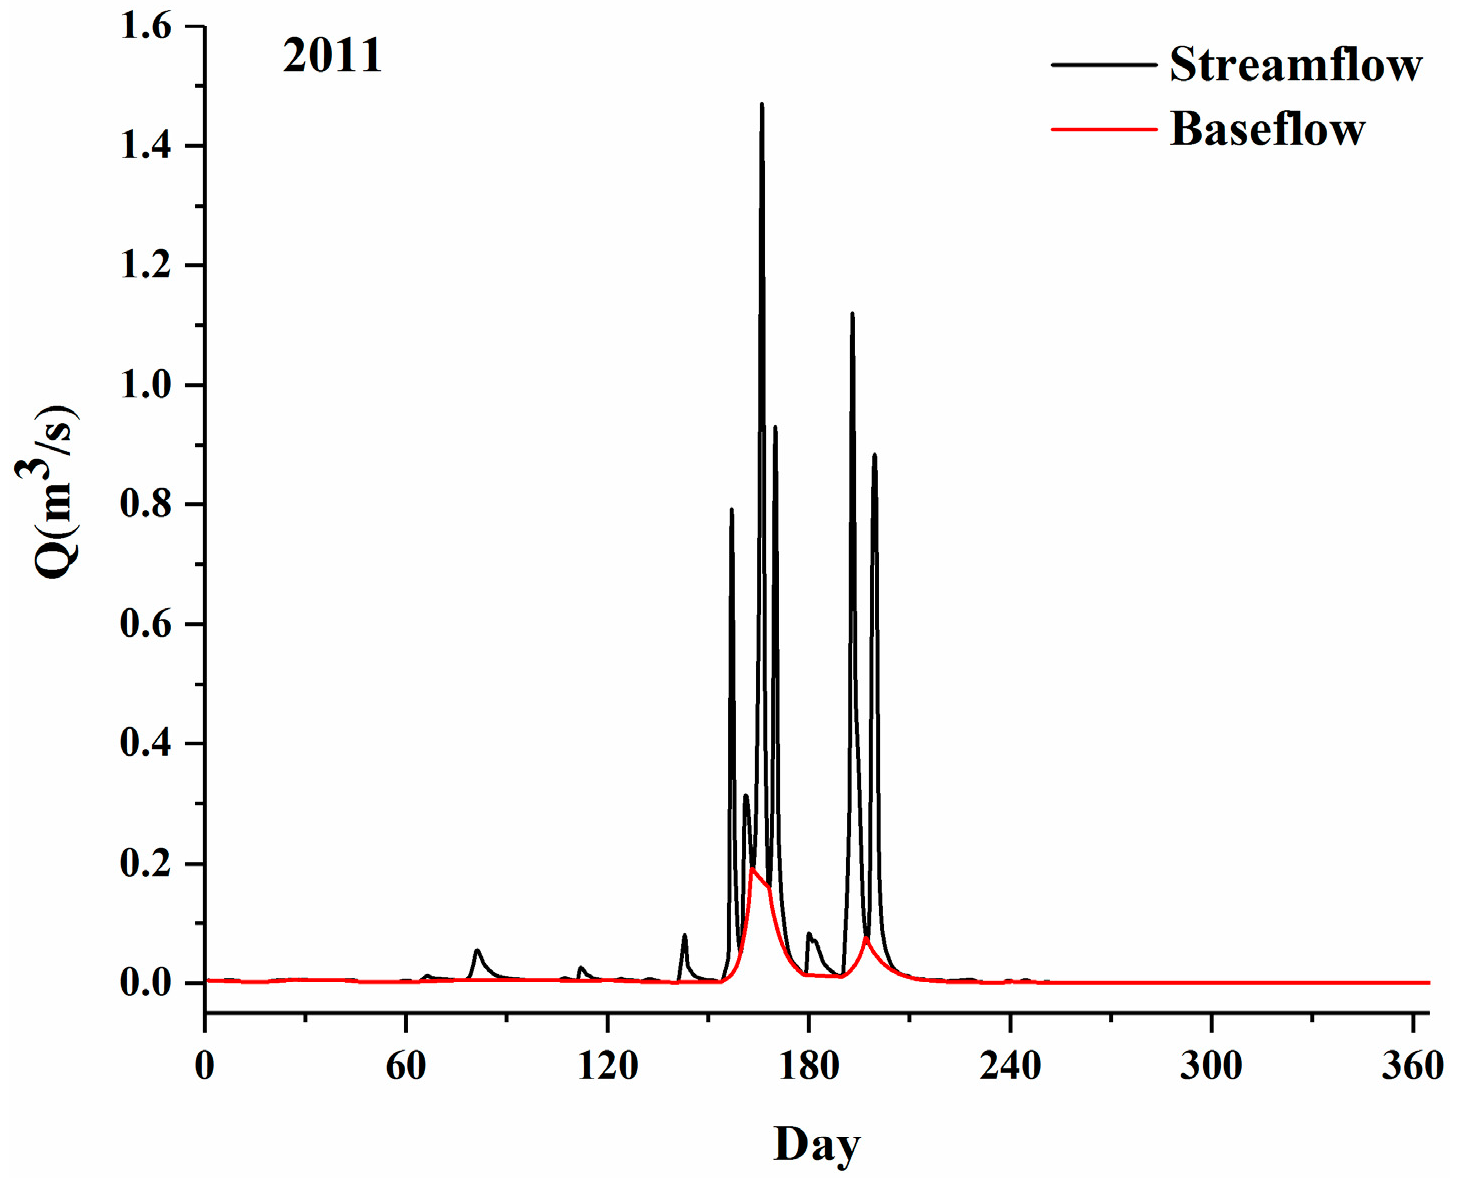
3.1. Baseflow Separation by the BFI Method

Based on the BFI method, annual streamflow and baseflow for the typical hydrological years were respectively 938.51 and 213.13 mm (2003), 630.75 and 154.70 mm (2006), and 387.70 and 101.49 mm (2011). Both parameters were ranked as wet year > normal year > dry year, which was consistent with the watershed’s variation in precipitation. The maximum monthly baseflow for the three years was 62.73, 48.69, and 60.41 mm, respectively, while the corresponding minimum monthly baseflow was stable (i.e., at 0.89 mm). The BFI values for the three years were 0.23, 0.25, and 0.26, respectively; i.e., wet year < normal year < dry year (Table 2).
Maximum daily streamflow values for 2003, 2006, and 2011 were 2.85, 2.58, and 1.47 m3/s, respectively (Figure 2). Streamflow varied drastically during the wet season yet leveled off in the dry season.
In terms of baseflow, irrespective of being a wet, normal, or dry year, its value was generally consistent with that of streamflow, although the range of its variation was much smaller than streamflow. For the dry season, the baseflow was stable and nearly coincided with the streamflow hydrograph. This confirmed that baseflow was the main source of streamflow during the dry season; hence it plays a critical role in maintaining the watershed’s streamflow stability [1,2].

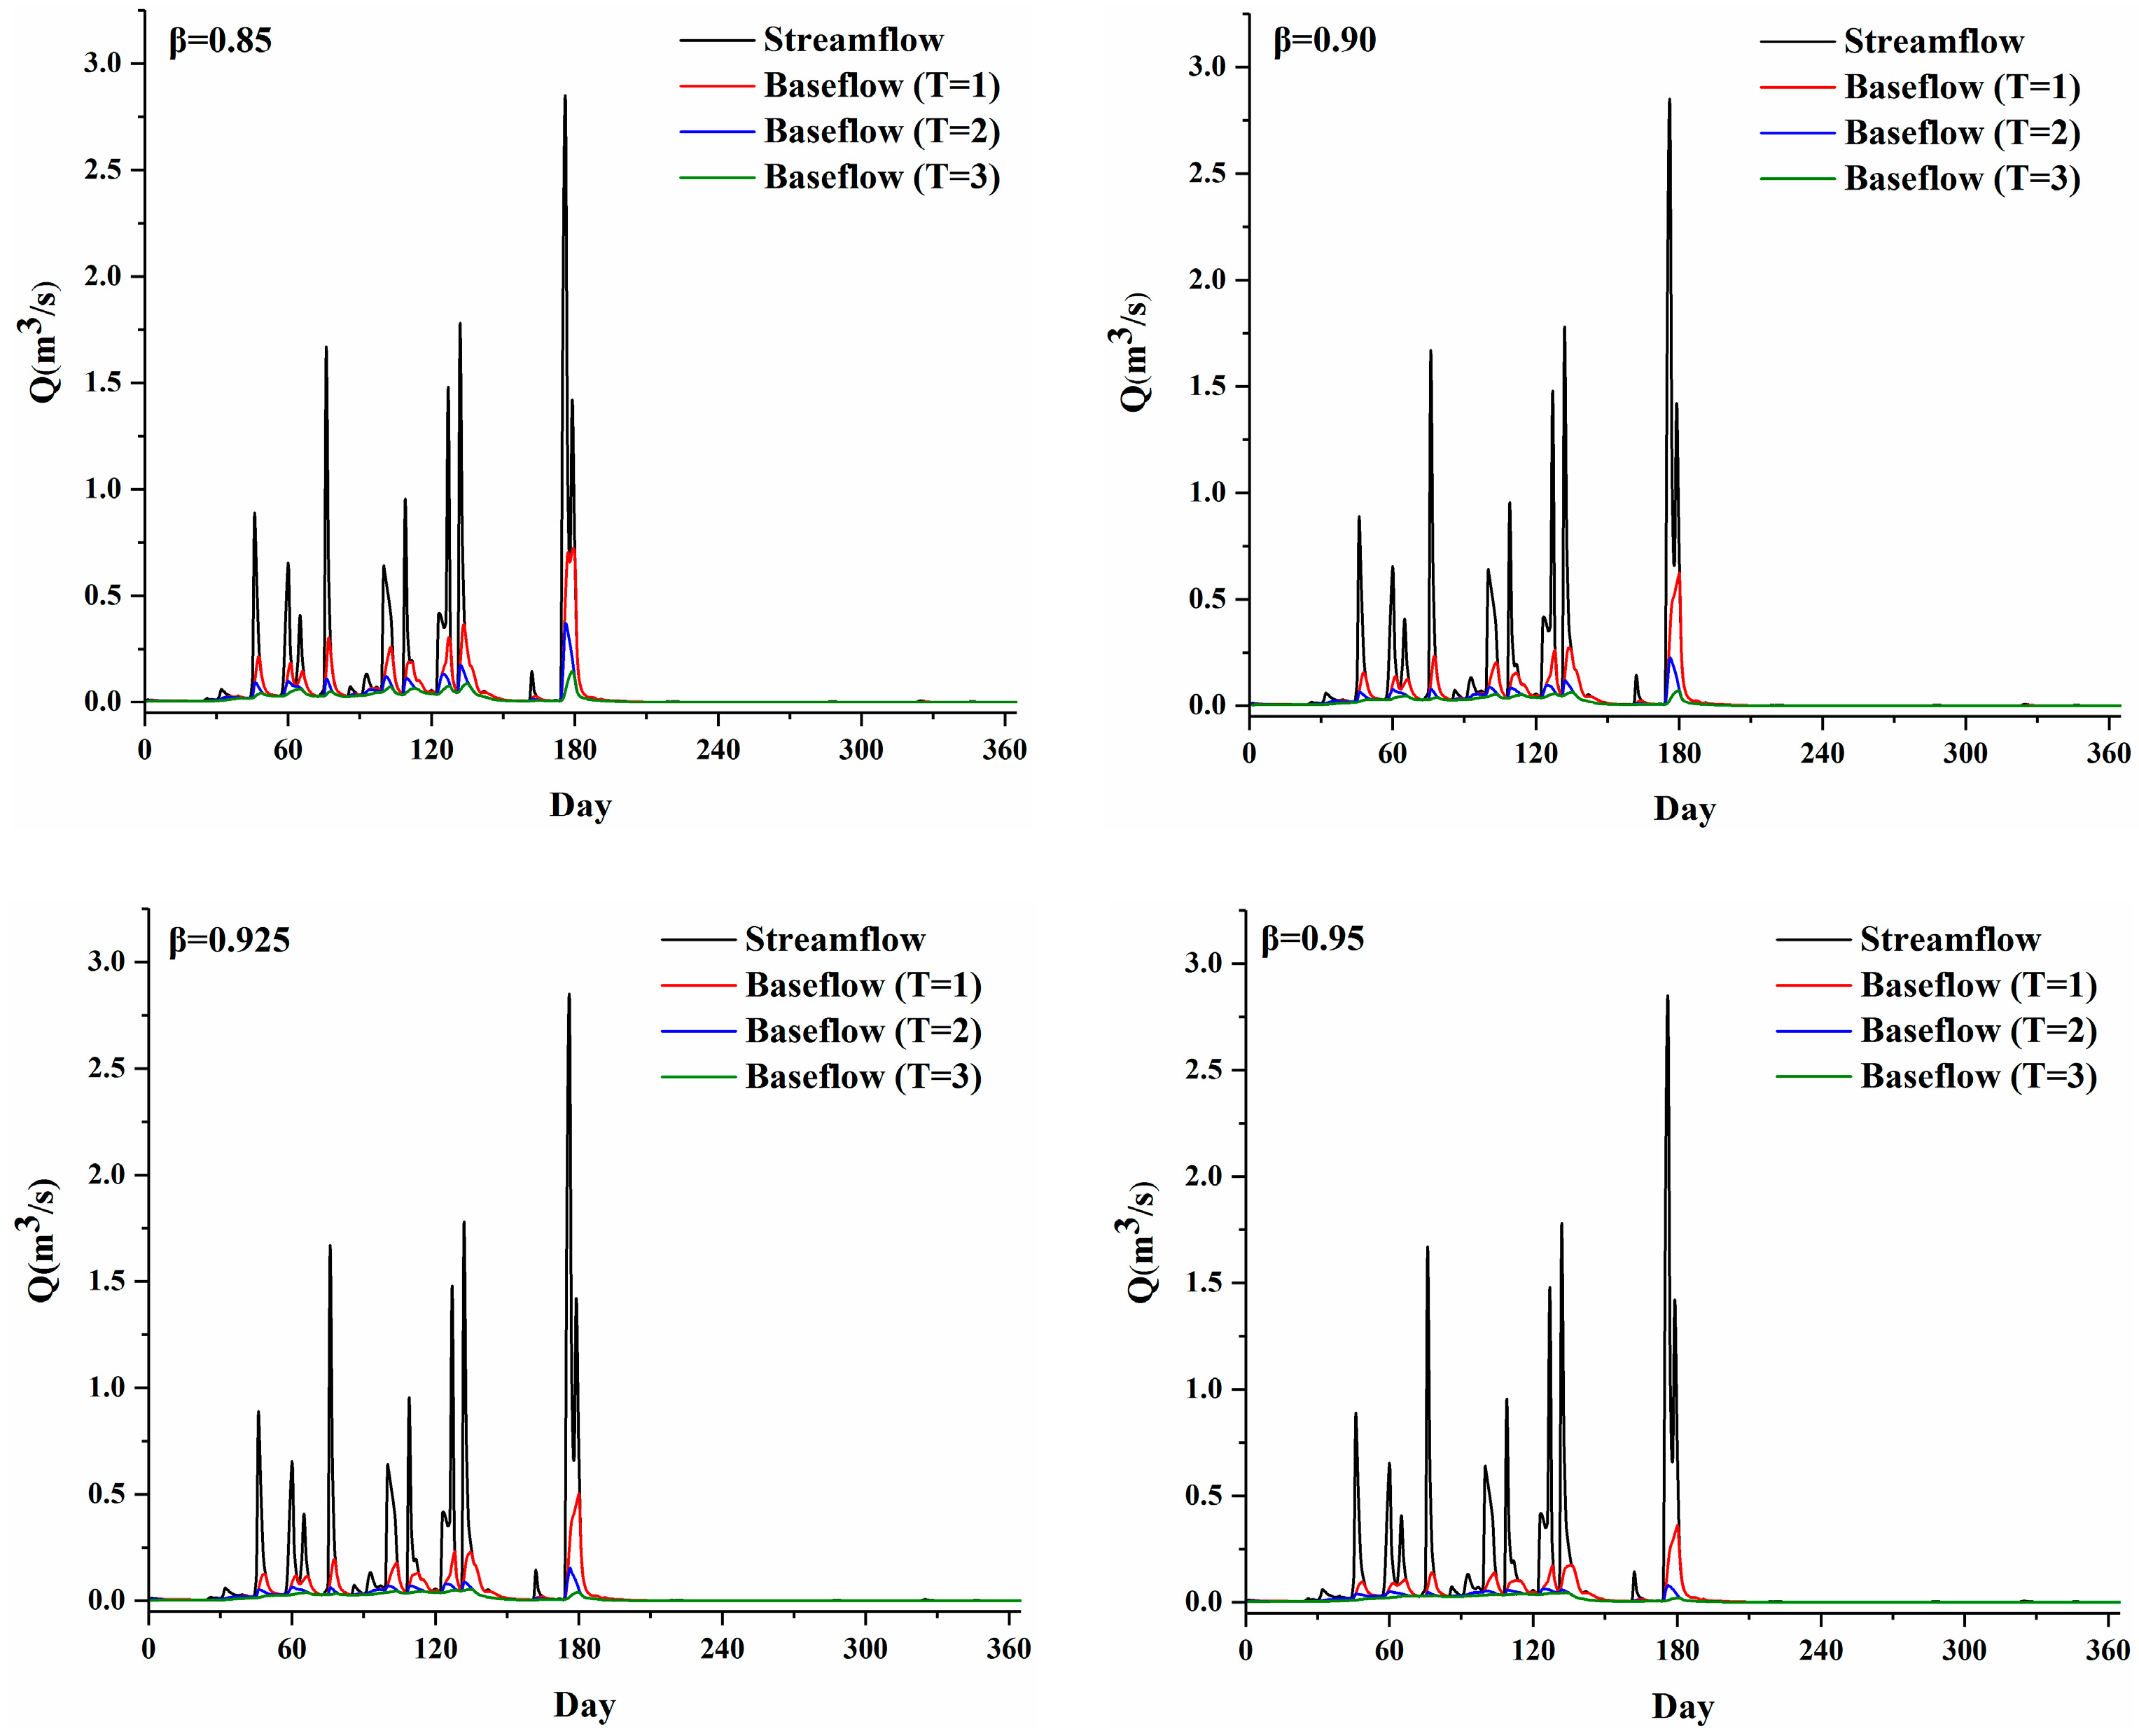
3.2. Baseflow Separation by the Digital Filter Method

Taking 2003 (a wet year) as an example, Figure 3 shows the effects of β and T on baseflow separation results from the digital filter method.
For the periods of 1–45 days and 200–365 days, streamflow occurred at a lower level throughout the year and the streamflow hydrograph fluctuated less. In these cases, the change in β and T values did not substantially affect the results of baseflow separation. But for 45–200 days, the streamflow hydrograph fluctuated considerably, whereas the baseflow decreased with an increasing β or T value. When β was held constant, the annual baseflow, maximum monthly baseflow, minimum monthly baseflow, BFI, and BFI attenuation rate all gradually decreased with an increasing T value. The corresponding BFI attenuation rates were 44.68% and 30.77% (β = 0.85); 47.50% and 28.57% (β = 0.90); 47.22% and 26.32% (β = 0.925); 48.39% and 25.00% (β = 0.95), respectively (Table 3).
When T was held constant, the annual baseflow, maximum monthly baseflow, minimum monthly baseflow, and BFI also gradually decreased with an increasing β value. However, the corresponding BFI attenuation rates were 14.89%, 10.00%, and 13.89% (T = 1); 19.23%, 9.52%, and 15.79% (T = 2); 16.67%, 6.67%, and 14.29% (T = 3), respectively (Table 4). Nathan et al. [11] showed that the β determines the process of baseline attenuation, while the T determines the smoothing of the baseflow hydrograph. Therefore, the inconsistency of BFI attenuation rate in our two cases may be related to the different mechanisms underpinning the influence of β and T on baseflow separation.

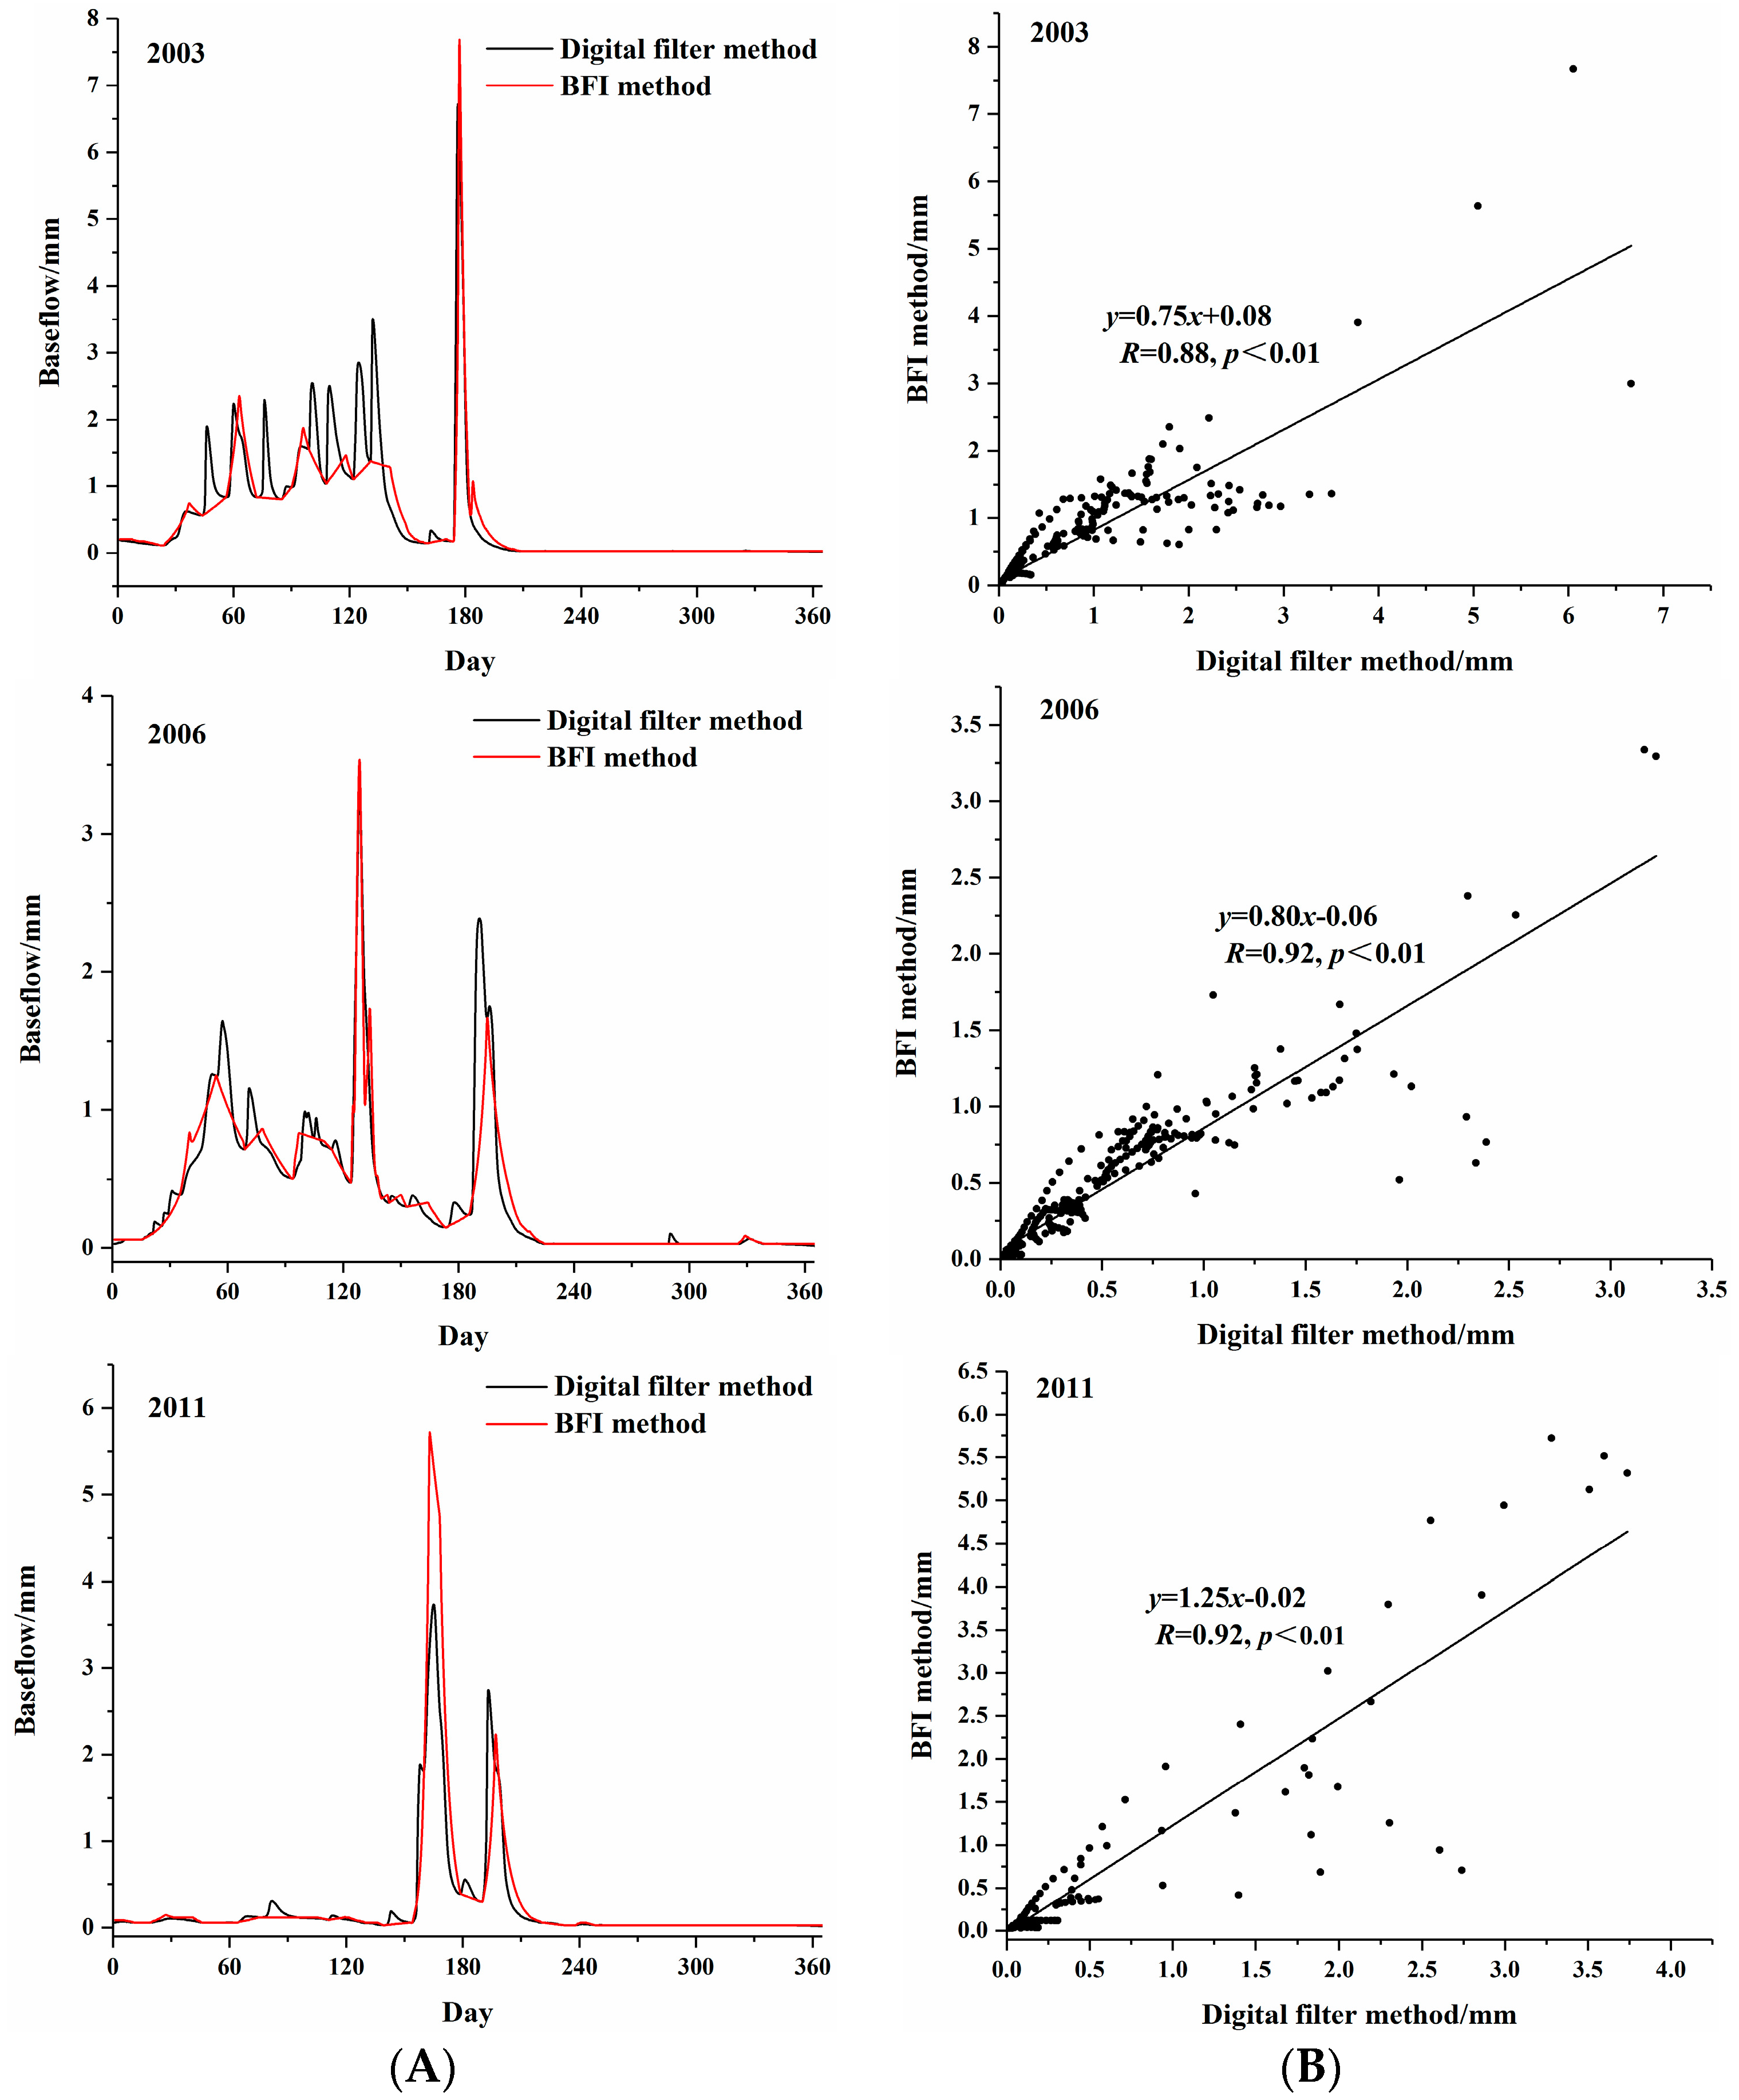
3.3. Comparisons of the Baseflow Separation Results Between Different Methods

The above results showed that as either β or T value was increased, the baseflow decreased. Yet, sometimes an equivalent effect of the different parameters on the baseflow was detected (Table 5). For example, the BFI value at β = 0.85, T = 3 was close to that obtained at β = 0.925, T = 2, whereas the separation result at β = 0.90, T = 3 was close to that found at β = 0.95, T = 2. Comparing the two methods’ results, the BFI value from the digital filter method using β = 0.90, T = 2 was closest to the result from the BFI method. In this case, the average annual BFI for the Pengchongjian watershed in 1983–2014 was 0.22, and thus closest to the 0.21 from the BFI method.
Therefore, β = 0.90 and T = 2 were tentatively identified as the optimal parameters for baseflow separation by the digital filter method. To further clarify the rationality of the selected optimal parameters, the baseflow separation results from the digital filter method (β = 0.90, T = 2) were validated by using the BFI method. Comparison of baseflow hydrographs between the two methods revealed their good consistency for the typical hydrological years. Especially during the dry season, these baseflow hydrographs were generally coincident (Figure 4A). Pearson’s correlation coefficients of baseflow between the two methods for 2003, 2006, and 2011 were 0.88, 0.92, and 0.92, respectively. And their p-values are far less than 0.01(Figure 4B). In addition, the Nash-Sutcliffe efficiency coefficient (NS) of baseflow between the two methods for 1983–2014 was 0.90 (close to 1.0), with a relative error (PBIAS) of –5.25% (|PBIAS| < 10%). In summary, β = 0.90 and T = 2 were determined to be optimal parameters for baseflow separation in the Pengchongjian watershed by using the digital filter method. These two optimal parameters differ from those reported for the Heihe River watershed [28], Xiangxi River watershed [49], and Juntanghu watershed [50]. The discrepancy in the parameters may be related to different environmental factors, such as precipitation, temperature, and soil type, across the studied watersheds (Table 6).

3.4. Intra- and Inter-Annual Variations in Baseflow

Based on the digital filter method (β = 0.90, T = 2), baseflow was separated from daily streamflow records of the Pengchongjian watershed for 1983–2014. Both the baseflow and BFI value per year were calculated, and their variation within or between years were then analyzed.

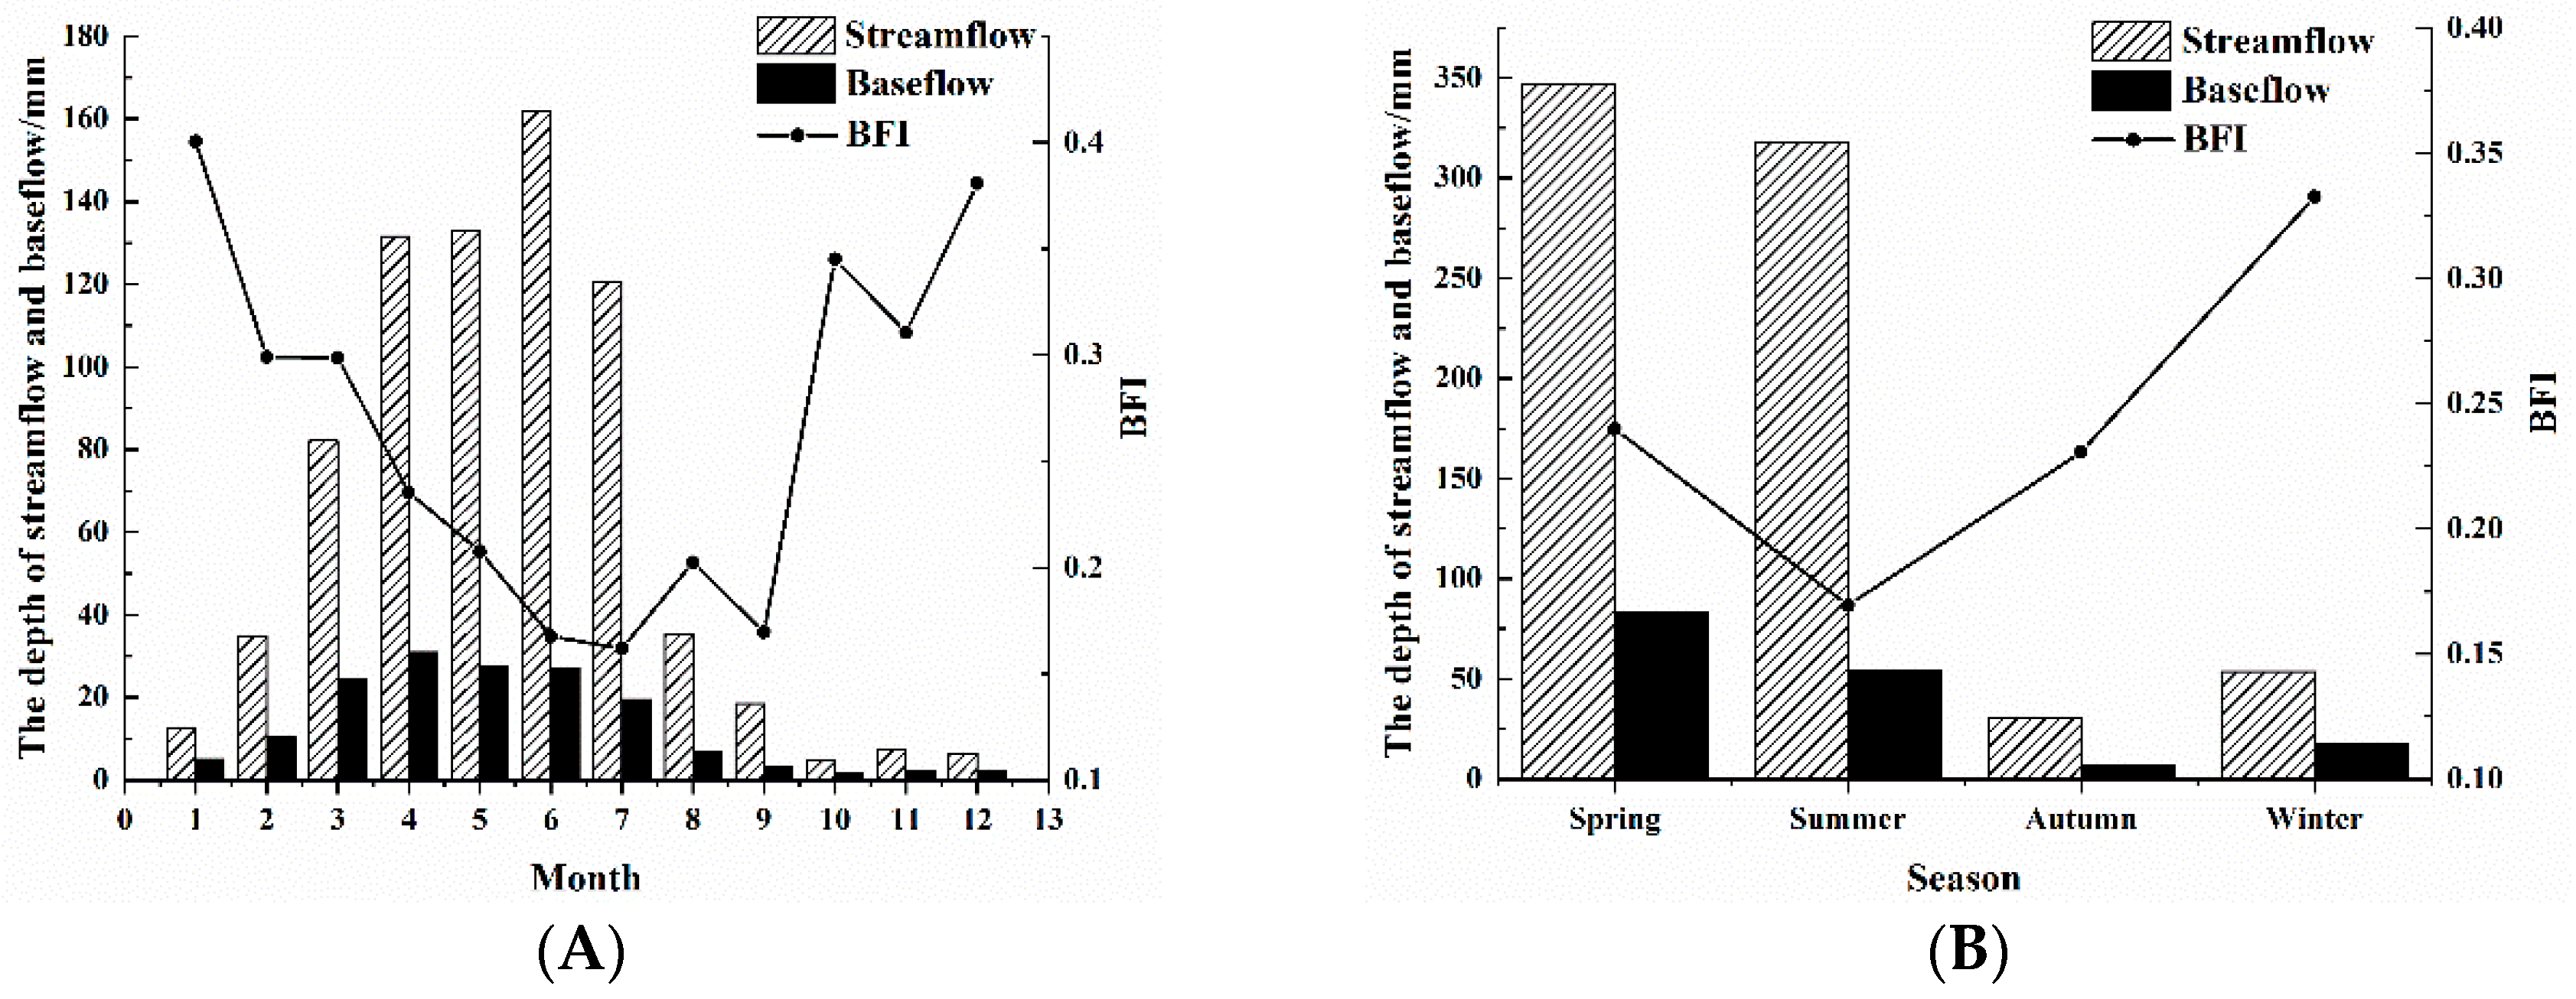
3.4.1. Monthly and Seasonal Variations in Baseflow

Monthly variation analysis (Figure 5A) revealed that average streamflow and baseflow increased and then decreased, with both characterized by uneven distributions in a given year. The streamflow was concentrated in March–July, when it accounted for 84.04% of the total streamflow in a year. The maximum and minimum streamflow occurred in June (161.76 mm) and October (4.77 mm), respectively. The baseflow was mainly concentrated in March–August, which represented 84.61% of the total baseflow in a year. The maximum and minimum baseflow occurred in April (30.96 mm) and October (1.65 mm), respectively. Conversely, the BFI decreased at first but then increased over time; maximum and minimum monthly BFI values occurred in January (0.40 mm) and July (0.16 mm), respectively.
On the seasonal scale (Figure 5B), average streamflow and baseflow were ranked as spring > summer > winter > autumn, a result consistent with the seasonal distribution of precipitation in the watershed. However, the trend in rank for BFI shifted to winter > spring > autumn > summer. The winter BFI value was the largest, indicating that winter’s baseflow contributed substantially to the streamflow, thus playing a key role in maintaining streamflow stability during the dry season in this watershed.

3.4.2. Inter-Annual Variation in Baseflow

Annual streamflow, baseflow, and BFI all decreased over time, at respective rates of 8.57 mm/year, 2.30 mm/year, and 0.0005/year and their p-values are far less than 0.01 (Figure 6). Maximum annual streamflow (1667.89 mm) and baseflow (305.85 mm) occurred in 1998 (wet year), corresponding to a BFI value of 0.18; minimum annual streamflow (273.98 mm) and baseflow (72.82 mm) occurred in 2007 (dry year), corresponding to a BFI value of 0.27. Annual BFI was lower in wet years and higher in dry years when compared with normal years.
For 1983–2014, the average annual BFI for the Pengchongjian watershed was 0.22, a value close to that of 0.24 for southern China [34]. However, our result is much lower than reported values from Caijiachuan watershed (0.68) in northern China [51] and the Heihe River watershed (0.53) in northwestern China [36]. Chen et al. [52] showed that the precipitation on the annual scale is inversely related to the BFI. Therefore, the BFI for the Pengchongjian watershed is expected to be smaller than for northern China, which may be related to great disparity in precipitation between the northern and southern regions. Nonetheless, a great number of studies have shown that the baseflow is affected by multiple factors, such as watershed area [53], geology [54], soil [55], vegetation [56], precipitation [57], temperature [58], and land use pattern [59]. These joint influencing factors are interrelated yet likely differ across watersheds. Even the same factors may vary in their influence on baseflow among watersheds, sometimes producing contradictory results [60]. Therefore, we must pursue further research to reveal the possible influencing factors and their relative contribution to baseflow variation in the Pengchongjian watershed.

4. Conclusions

This study applied a digital filter method to separate the baseflow in the small watershed of Pengchongjian in southern China over the past three decades. The separation results were validated by the BFI method to find the optimal β and T. On this basis, the intra- and inter-annual variations in the baseflow and BFI value were revealed. Three main conclusions were drawn:
(1)
β = 0.90 and T = 2 were the optimal parameters for baseflow separation by the digital filter method in the small watershed.
(2)
Average monthly baseflow increased initially but then decreased, having an uneven distribution in a given year, whereas average monthly BFI exhibited the opposite trend. On a seasonal scale, the baseflow peaked in the spring and lowest in the autumn, whereas the BFI was highest in the winter and lowest in the summer.
(3)
Annual baseflow and BFI underwent a decline from 1983 to 2014, equivalent to reduction rates of 2.30 mm/year and 0.0005/year, respectively. On the annual scale, the BFI was lower in a wet year and higher in a dry year compared with a normal year. The small watershed had an average BFI value for 1983–2014 of 0.22.
The results of this study are useful for separating the baseflow accurately in the Pengchongjian watershed, in addition to revealing its baseflow evolution. Nevertheless, our separation results may be inconsistent across watersheds, since there exist many baseflow separation methods and factors influencing the baseflow. Further studies in southern China are needed to achieve more robust baseflow separation in watersheds varying in size.

Author Contributions

Data curation, J.Y., F.S., K.Y., X.X. and G.L.; Project administration, S.L.; Writing—original draft, Z.L.

Funding

This research was funded by the Chinese Natural Science Foundation Program grant number (No. 31960331).

Acknowledgments

The authors are grateful for the support from Jiangxi Hydrological Bureau and the local government in Duchang County, Jiujiang. We also appreciate the reviewers for their helpful comments in polishing this article.

Conflicts of Interest

The authors declare no conflict of interest.

References

  1. Tallaksen, L.M. A review of baseflow recession analysis. J. Hydrol. 1995, 165, 349–370. [Google Scholar] [CrossRef]
  2. Fan, Y.; Li, H.; Miguez-Macho, G. Global patterns of groundwater table depth. Science 2013, 339, 940–943. [Google Scholar] [CrossRef] [PubMed]
  3. Eckhardt, K. A comparison of baseflow indices, which were calculated with seven different baseflow separation methods. J. Hydrol. 2008, 352, 168–173. [Google Scholar] [CrossRef]
  4. Spongberg, M.E. Spectral analysis of base flow separation with digital filters. Water Resour. Res. 2000, 36, 745–752. [Google Scholar] [CrossRef]
  5. Arnold, J.G.; Allen, P.M. Automated methods for estimating baseflow and ground water recharge from streamflow records. J. Am. Water Resour. Assoc. 1999, 35, 411–424. [Google Scholar] [CrossRef]
  6. Mei, Y.; Anagnostou, E.N. A hydrograph separation method based on information from rainfall and runoff records. J. Hydrol. 2015, 523, 636–649. [Google Scholar] [CrossRef]
  7. Buffam, I.; Galloway, J.N.; Blum, L.K.; Karen, J.M. A stormflow/baseflow comparison of dissolved organic matter concentrations and bioavailability in an Appalachian stream. Biogeochemistry 2001, 53, 269–306. [Google Scholar] [CrossRef]
  8. Lohmann, D.; Raschke, E.; Nijssen, B.; Lettenmaier, D.P. Regional scale hydrology: I. Formulation of the VIC-2L model coupled to a routing model. Hydrol. Sci. J. 1998, 43, 131–141. [Google Scholar] [CrossRef]
  9. Singh, K.P. Some Factors affecting baseflow. Water Resour. Res. 1968, 4, 985–999. [Google Scholar] [CrossRef]
  10. Nutbrown, D.A.; Downing, R.A. Normal-mode analysis of the structure of baseflow-recession curves. J. Hydrol. 1976, 30, 327–340. [Google Scholar] [CrossRef]
  11. Nathan, R.J.; Mcmahon, T.A. Evaluation of automated techniques for baseflow and recession analyses. Water Resour. Res. 1990, 26, 1465–1473. [Google Scholar] [CrossRef]
  12. Chen, L.Q.; Liu, C.M.; Li, F.D. Reviews on baseflow researches. Prog. Geogr. 2006, 25, 1–15. (In Chinese) [Google Scholar]
  13. Zhang, X.; Srinivasan, R.; Arnold, J.; Izaurralde, R.C.; Bosch, D. Simultaneous calibration of surface flow and baseflow simulations: A revisit of the SWAT model calibration framework. Hydrol. Process. 2011, 25, 2313–2320. [Google Scholar] [CrossRef]
  14. Wittenberg, H. Baseflow recession and recharge as nonlinear storage processes. Hydrol. Process. 2015, 13, 715–726. [Google Scholar] [CrossRef]
  15. Mcguire, K.J.; Weiler, M.; Mcdonnell, J.J. Integrating tracer experiments with modeling to assess runoff processes and water transit times. Adv. Water Resour. 2007, 30, 824–837. [Google Scholar] [CrossRef]
  16. Joshi, SK.; Rai, S.P.; Sinha, R.; Gupta, S.; Densmore, A.L.; Rawat, Y.S.; Shekhar, S. Tracing groundwater recharge sources in the northwestern Indian alluvial aquifer using water isotopes (δ18O, δ2H and 3H). J. Hydrol. 2018, 559, 835–847. [Google Scholar] [CrossRef]
  17. Lyne, V.; Hollick, M. Stochastic time-variable rainfall-runoff modeling. In Institute Engineers Australia National Conference; Institute of Engineers: Canberra, Australia, 1979; Volume 10, pp. 89–93. [Google Scholar]
  18. Boughton, W.C. A hydrograph-based model for estimating the water yield of ungauged catchments. In Institute Engineers Australia National Conference; Institute of Engineers: Canberra, Australia, 1993; Volume 14, pp. 317–324. [Google Scholar]
  19. Chapman, T.G.; Maxwell, A.I. Baseflow separation-comparison of numerical methods with tracer experiments. In Institute Engineers Australia National Conference; Institute of Engineers: Canberra, Australia, 1996; Volume 5, pp. 539–545. [Google Scholar]
  20. Eckhardt, K. How to construct recursive digital filters for baseflow separation. Hydrol. Process. 2005, 19, 507–515. [Google Scholar] [CrossRef]
  21. Wels, C.; Cornett, R.J.; Lazerte, B.D. Hydrograph separation: A comparison of geochemical and isotopic tracers. J. Hydrol. 1991, 122, 253–274. [Google Scholar] [CrossRef]
  22. Aksoy, H.; Unal, N.E.; Pektas, A.O. Smoothed minima baseflow separation tool for perennial and intermittent streams. Hydrol. Process. 2008, 22, 4467–4476. [Google Scholar] [CrossRef]
  23. Aksoy, H.; Kurt, I.; Eris, E. Filtered smoothed minima baseflow separation method. J. Hydrol. 2009, 372, 94–101. [Google Scholar] [CrossRef]
  24. Sloto, R.A.; Crouse, M.Y. HYSEP: A Computer Program for Streamflow Hydrograph Separation and Analysis; US Geological Survey Water-Resources Investigations Report; US Department of the Interior: Washington, DC, USA, 1996; pp. 96–4040.
  25. Rutledge, A.T. Computer Program for Describing the Recession of Ground-Water Discharge and for Estimating Mean Ground-Water Recharge and Discharge from Streamflow Records; US Geological Survey Water-Resources Investigations Report; US Department of the Interior: Washington, DC, USA, 1993; pp. 98–4148.
  26. Arnold, J.G.; Allen, P.M.; Muttiah, R.S.; Bernhardt, G. Automated base flow separation recession analysis techniques. Groundwater 1995, 33, 1010–1018. [Google Scholar] [CrossRef]
  27. Ladson, A.; Brown, R.; Neal, B.; Nathan, R. A standard approach to baseflow separation using the Lyne and Hollick filter. Aust. J. Water Res. 2013, 17, 25–34. [Google Scholar] [CrossRef]
  28. Zhao, W.; Li, Z.L.; Wang, Y.H. Separation and characteristics of base flow in the upper reaches of Heihe River Basin. South North Water Transf. Water Sci. Tech. 2016, 14, 26–31. (In Chinese) [Google Scholar]
  29. Wang, J.Z.; Liu, Z.H.; Tashpolat, T.; Zhang, W.N. Variation of the baseflow and its causes of Hutubi River. J. Desert Res. 2017, 37, 793–801. (In Chinese) [Google Scholar]
  30. Santhi, C.; Allen, P.M.; Muttiah, R.S.; Arnold, J.G.; Tuppad, P. Regional estimation of base flow for the conterminous United States by hydrologic landscape regions. J. Hydrol. 2008, 351, 139–153. [Google Scholar] [CrossRef]
  31. Longobardi, A.; Villani, P. Baseflow index regionalization analysis in a mediterranean area and data scarcity context: Role of the catchment permeability index. J. Hydrol. 2008, 355, 63–75. [Google Scholar] [CrossRef]
  32. Koskelo, A.I.; Fisher, T.R.; Utz, R.M.; Jordan, T.E. A new precipitation-based method of baseflow separation and event identification for small watersheds (<50 km2). J. Hydrol. 2012, 450–451, 267–278. [Google Scholar] [CrossRef]
  33. Lin, X.Y.; Liao, Z.S.; Qian, Y.P.; Su, X.S. Baseflow separation for groundwater study in the Yellow River Basin, China. J. Jilin Univ. Earth Sci. Ed. 2009, 39, 959–967. (In Chinese) [Google Scholar]
  34. Li, R.; Zhang, S.F. Comparative study on two automatic baseflow separation methods in the arid and semi-arid regions. Prog. Geogr. 2017, 36, 864–872. (In Chinese) [Google Scholar]
  35. Yang, Q.N.; Gao, H.D.; Li, Z.B.; Wang, J. Effects of land use change in watershed on base flow in arid area. Res. Soil Water Conserv. 2018, 25, 317–322. (In Chinese) [Google Scholar]
  36. Dang, S.Z.; Wang, Z.G.; Liu, C.M. Baseflow separation and its characteristics in the upper reaches of the Heihe River Basin. Resour. Sci. 2011, 33, 2232–2237. (In Chinese) [Google Scholar]
  37. Quan, J.; Ma, J.L. Baseflow separation and its characteristics analysis in Shiyang River Basin. Water Resour. Power 2010, 28, 15–17. (In Chinese) [Google Scholar]
  38. Hu, S.; Yang, D.D.; Wu, J.; Gao, Y.; Qiu, H.J.; Cao, M.M.; Song, J.X.; Wan, H.L. Spatiotemporal variation characteristics of baseflow in the Bahe River Basin based in digital filter method and SWAT model. Sci. Geogr. Sin. 2017, 37, 455–463. (In Chinese) [Google Scholar]
  39. Lei, Y.N.; Zhang, X.P.; Zhang, J.J.; Liu, E.J. Change trends and driving factors of base flow in Kuye River Catchment. Acta Ecol. Sin. 2013, 33, 1559–1568. (In Chinese) [Google Scholar]
  40. Liu, J.; Li, W.; Wang, Y.; Li, Q.Y.; Li, Y.; Wu, J.S. Effects of landscape pattern on hydrological processes in the central subtropical hilly agricultural catchments. J. Ecol. Rural Environ. 2016, 32, 424–431. (In Chinese) [Google Scholar]
  41. Li, Y.; Li, Y.; Li, X. Response of hydrological processes to land cover and climate changes in Songhuaba watershed, Southwest China. Hydrol. Process. 2010, 23, 1179–1191. [Google Scholar]
  42. Huang, G.R.; Chen, Y.Q. Review of some problems about low runoff. Water Resour. Power 2005, 23, 61–64. (In Chinese) [Google Scholar]
  43. Liu, Y.W. The Research of Response Between Land Use/Cover Change and Baseflow in Meijiang Basin Based on GIS; Jiangxi Normal University: Nanchang, China, 2007. (In Chinese) [Google Scholar]
  44. Institute of Hydrology. Low Flow Studies; Institute of Hydrology: Wallingford, UK, 1980. [Google Scholar]
  45. Wahl, K.L.; Wahl, T.L. Effects of regional ground water declines on streamflows in the Oklahoma Panhandle. In Proceedings of the Symposium on Water-Use Data for Water Resources Management, Tucson, AZ, USA, 28–31 August 1988; pp. 239–249. [Google Scholar]
  46. Wahl, K.L.; Wahl, T.L. Determining the flow of comal springs at New Braunfels, Texas. In Proceedings of the Texas Water ’95, San Antonio, TX, USA, 16–17 August 1995; pp. 77–86. [Google Scholar]
  47. Lin, K.R.; Chen, X.H.; Jiang, T.; Li, C.Q. Application and study on base flow separation using digital filters. Water Power 2008, 34, 28–30. (In Chinese) [Google Scholar]
  48. Mau, D.P.; Winter, T.C. Estimating ground-water recharge from streamflow hydrographs for a small mountain watershed in a temperate humid climate, New Hampshire, USA. Groundwater 1997, 35, 291–304. [Google Scholar] [CrossRef]
  49. Cui, Y.J.; Liu, D.F.; Song, L.X.; Xiao, S.B.; Chen, L. Application of digital filtering theory in baseflow separation in Xiangxi River Watershed of three gorges reservoir area. J. Chin. Hydrol. 2011, 31, 18–23. (In Chinese) [Google Scholar]
  50. Zhang, W.N.; Liu, Z.H.; Wang, R.J.; Hu, M.; Yao, J.Q. Application of digital filtering theory in baseflow separation of Juntanghu River Watershed in northern slope of the Tianshan Mountains. Arid Zone Res. 2015, 32, 35–39. (In Chinese) [Google Scholar]
  51. Guo, J.T.; Zhang, Z.Q.; Wang, S.P.; Zhang, J.J.; Strauss, P. Features of baseflow and its influencing factors for small watersheds in Loess Hilly and Gully Region. Bull. Soil Water Conserv. 2011, 31, 87–92. (In Chinese) [Google Scholar]
  52. Chen, L.Q.; Liu, C.M.; Hao, F.H.; Liu, J.Y.; Dai, D. Change of the baseflow and it′s impacting factors in the source regions of Yellow River. J. Glaciol. Geocryol. 2006, 8, 141–148. (In Chinese) [Google Scholar]
  53. Vogel, R.M.; Kroll, C.N. Regional geohydrologic-geomorphic relationships for the estimation of low-flow statistics. Water Resour. Res. 1992, 28, 2451–2458. [Google Scholar] [CrossRef]
  54. Mwakalila, S.; Feyen, J.; Wyseure, G. The influence of physical catchment properties on baseflow in semi-arid environments. J. Arid Environ. 2002, 52, 245–258. [Google Scholar] [CrossRef]
  55. Chaplot, V.; Walter, C.; Curmi, P.; Lagacherie, P.; King, D. Using the topography of the saprolite upper boundary to improve the spatial prediction of the soil hydromorphic index. Geoderma 2004, 123, 343–354. [Google Scholar] [CrossRef]
  56. Zomlot, Z.; Verbeiren, B.; Huysmans, M.; Batelaan, O. Spatial distribution of groundwater recharge and base flow: Assessment of controlling factors. J. Hydrol. 2015, 4, 349–368. [Google Scholar] [CrossRef]
  57. Ficklin, D.L.; Robeson, S.M.; Knouft, J.H. Impacts of recent climate change on trends in baseflow and stormflow in United States watersheds. Geophys. Res. Lett. 2016, 43, 5079–5088. [Google Scholar] [CrossRef]
  58. Xie, H.; Eheart, J.W.; An, H. Hydrologic and economic implications of climate change for typical river basins of the agricultural Midwestern United States. J. Water Resour. Plan. Manag. 2008, 134, 205–213. [Google Scholar] [CrossRef]
  59. Xu, X.; Scanlon, B.R.; Schilling, K.; Sun, A. Relative importance of climate and land surface changes on hydrologic changes in the US Midwest since the 1930s: Implications for biofuel production. J. Hydrol. 2013, 497, 110–120. [Google Scholar] [CrossRef]
  60. Price, K. Effects of watershed topography, soils, land use, and climate on baseflow hydrology in humid regions: A review. Prog. Phys. Geogr. 2011, 35, 465–492. [Google Scholar] [CrossRef]
Figure 1. Location of the Pengchongjian watershed in Jiangxi Province and distribution of the observation sites in the study area, southern China.
Forests 10 01065 g001
Figure 2. Streamflow and baseflow hydrographs for the Pengchongjian watershed in typical hydrological years from the BFI method.
Forests 10 01065 g002aForests 10 01065 g002b
Figure 3. Streamflow and baseflow hydrographs for the Pengchongjian watershed in 2003 from the digital filter method using different values of β and T.
Forests 10 01065 g003
Figure 4. Comparison of baseflow hydrographs (A) and correlation of baseflow (B) between different methods for the Pengchongjian watershed in typical hydrological years.
Forests 10 01065 g004
Figure 5. Monthly (A) and seasonal (B) variations in streamflow, baseflow, and baseflow index (BFI) for the Pengchongjian watershed during 1983–2014.
Forests 10 01065 g005
Figure 6. Inter-annual variations in streamflow, baseflow (A), and baseflow index (BFI, B) for the Pengchongjian watershed during 1983–2014.
Forests 10 01065 g006
Table 1. The filtering parameter (β) and filtering times (T) used for baseflow separation in different watersheds based on the digital filter method.
WatershedβTOptimal ParameterReference
186 catchments
(Southeastern Australia)
0.9 ,0.925, 0.953β = 0.925, T = 3Nathan and Mcmahon, [11]
Laoguanhe watershed
(China)
0.85, 0.90, 0.9251, 2, 3β = 0.85, T = 2Lin et al., [47]
New Hampshive watershed
(USA)
0.85, 0.9251, 2, 3β = 0.85, T = 2Mau and Winter, [48]
Xiangxihe watershed
(China)
0.80, 0.90, 0.925, 0.95, 0.9751, 2, 3β = 0.925, T = 3Cui et al., [49]
Juntanghu watershed
(China)
0.80, 0.85, 0.90, 0.925, 0.951, 2, 3β = 0.85, T = 3Zhang et al., [50]
Table 2. Baseflow separation results for the Pengchongjian watershed in typical hydrological years from the BFI method.
YearAnnual Streamflow (mm)Annual Baseflow (mm)Maximum Monthly Baseflow (mm)Minimum Monthly Baseflow (mm)BFI Value
2003 (wet)938.51213.1362.730.890.23
2006 (normal)630.75154.7048.690.890.25
2011(dry)387.70101.4960.410.890.26
Table 3. Baseflow separation results for Pengchongjian watershed in 2003 from the digital filter method using constant β and different T.
β0.850.900.9250.95
T123123123123
Annual baseflow/mm439.87245.63171.74381.55199.51142.18341.76174.33126.64291.96147.56109.76
Maximum monthly baseflow/mm114.1855.5542.2391.4648.2436.8680.8544.3634.1970.3439.3731.32
Minimum monthly baseflow/mm0.890.830.830.890.780.780.890.750.750.890.690.69
BFI0.470.260.180.400.210.150.360.190.140.310.160.12
BFI attenuation rate/%-44.68%30.77%-47.50%28.57%-47.22%26.32%-48.39%25.00%
Table 4. Baseflow separation results for the Pengchongjian watershed in 2003 from the digital filter method using constant T and different β.
T123
β0.850.900.9250.950.850.900.9250.950.850.900.9250.95
Annual baseflow/mm439.87381.55341.76291.96245.63199.51174.33147.56171.74142.18126.64109.76
Maximum monthly baseflow/mm114.1891.4680.8570.3455.5548.2444.3639.3742.2336.8634.1931.32
Minimum monthly baseflow/mm0.890.890.890.890.830.780.750.690.830.780.750.69
BFI0.470.400.360.310.260.210.190.160.180.150.140.12
BFI attenuation rate/%-14.89%10.00%13.89%-19.23%9.52%15.79%-16.67%6.67%14.29%
Table 5. Comparisons of baseflow index (BFI) values for the Pengchongjian watershed between different baseflow separation methods.
Digital Filter MethodBFI Method
β0.850.900.9250.95
T123123123123
20030.470.260.180.410.21 *0.150.360.190.140.310.160.120.23
20060.470.300.220.420.25 *0.180.380.220.160.330.190.140.25
20110.450.280.190.400.27 *0.150.370.190.120.320.160.100.26
* the results of the digital filter method are closest to the results from the BFI method.
Table 6. The environmental factors in several watersheds with different optimal parameters used for baseflow separation by the digital filter method.
CatchmentAnnual
Precipitation
Annual
Temperature
Soil TypesOptimal ParametersReference
The upper reaches of Heihe River watershed350 mm<2 °CCultivated loessial soils, dark loessial soilsβ = 0.95, T = 3Zhao et al. [28]
Xiangxihe watershed 850–1400 mm16.6 °CYellow-brown earths, limestone soils, purplish soilsβ = 0.925, T = 3Cui et al. [49]
Juntanghu River watershed200–300 mm26.6–37.8 °CCastanozems
brown pedocals, sierozems
β = 0.85, T = 3Zhang et al. [50]
Pengchongjian watershed1560 mm17.5 °CRed soilβ = 0.90, T = 2This study

