Article

DNA Methylation of Farnesyl Pyrophosphate Synthase, Squalene Synthase, and Squalene Epoxidase Gene Promoters and Effect on the Saponin Content of Eleutherococcus Senticosus

1
College of Life Sciences, North China University of Science and Technology, Tangshan 063210, China
2
College of Pharmacy, North China University of Science and Technology, Tangshan 063210, China
*
Authors to whom correspondence should be addressed.
Forests 2019, 10(12), 1053; https://doi.org/10.3390/f10121053
Submission received: 17 August 2019 / Revised: 4 November 2019 / Accepted: 16 November 2019 / Published: 20 November 2019

Abstract

:
Eleutherococcus senticosus (Ruper. et Maxim.) Maxim is a traditional Chinese medicine. The saponin components of E. senticosus have several biological effects, including reduction of blood lipids; protection against liver, heart, and vascular disease; and antitumor activity. The DNA methylation of E. senticosus farnesyl pyrophosphate synthase (FPS), squalene synthase (SS), and squalene epoxidase (SE) gene promoters and the mechanism of the influence of these enzymes on saponin synthesis and accumulation in E. senticosus were explored using bisulfite sequencing technology, real-time PCR, the vanillin-concentrated sulfuric acid chromogenic method, and LC-MS. There are 19 DNA methylation sites and 8 methylation types in the FPS gene. The SS gene has nine DNA methylation sites and two DNA methylation types. The SE gene has 16 DNA methylation sites and 7 methylation types. The total saponin content in the high and low DNA methylation groups were 1.07 ± 0.12 and 2.92 ± 0.32 mg/g, respectively. Statistical analysis indicated that the gene expression of the FPS, SS, and SE genes was significantly positively correlated with the saponin content (p < 0.05), and that the methylation ratio was significantly negatively correlated with the saponin content (p < 0.01), while the expression of the SS and SE genes was significantly positively correlated (p < 0.01). A total of 488 metabolites were detected from E. senticosus and 100 different metabolites were screened out by extensive targeted metabolomics. The amount of most metabolites related to the mevalonate pathway was higher in the low DNA methylation group than in the high DNA methylation group. It was demonstrated that there are DNA methylation sites in the promoter regions of the FPS, SS, and SE genes of E. senticosus, and DNA methylation in this region could significantly inhibit synthesis in the mevalonate pathway, thus reducing the content of the final product E. senticosus saponin.

1. Introduction

Eleutherococcus senticosus (Ruper. et Maxim.) Maxim is a traditional Chinese medicine, which has the effect of tranquilizing the mind, invigorating the spleen, invigorating qi, tonifying the kidney, and an anti-fatigue effect [1]. Pharmacological studies have shown that E. senticosus has anti-oxidative, sedative, hypnotic, hypoglycemic, and antitumor effects. E. senticosus contains coumarins, lignins, triterpenoid saponins, phenols, flavonoids, and other secondary metabolites [2]. To date, 43 saponins have been isolated from E. senticosus, of which the oleanane triterpenoid saponin is one of the main active components [3]. However, the molecular mechanisms for the formation of the difference in its content are still unclear. The biological formation of triterpene saponins is an extremely complicated process. The only way to generate the various types of triterpene compounds is from isoprene, step by step through the mevalonate pathway [4]. In this process, many enzymes are involved in the catalysis, including farnesyl pyrophosphate synthase (FPS), which catalyzes the synthesis of farnesyl diphosphate (FPP) [5] and squalene synthase (SS) [6], which also catalyzes the synthesis of the first precursor of sterol and triterpene compounds, catalyzing the production of two molecules of FPP. Squalene epoxidase (SE), which catalyzes the oxidation of squalene to 2, 3-oxysqualene [7], is recognized as one of the three key cascade enzymes in the biosynthesis of triterpenoid saponins [8].
DNA methylation is a common form of epigenetic regulation. There are three types of DNA methylation sites in higher plants, CG, CHG, and CHH, most of which occur in symmetric sequence CG and repeat sequences [9]. DNA methylation analysis of Arabidopsis thaliana and other model species showed that DNA methylation of functional gene promoters could significantly inhibit gene expression [10]. However, there have been no reports on the effects of the DNA methylation of the gene promoters of key enzymes on the synthesis of pharmaceutical ingredients. Therefore, the analysis of the DNA methylation of the FPS, SS, and SE gene promoters of E. senticosus is of interest to investigate the mechanism of the formation of the different medicinal components in E. senticosus.

2. Materials and Methods

2.1. Extraction of DNA and Total RNA from E. Senticosus and Synthesis of cDNA

Two-year-old E. senticosus plants (n = 100) with similar growth status and similar growth potential were randomly selected and grown under the same conditions for 4 months, then the total RNA and DNA was extracted with a RNA PreP Pure plant kit and plant genomic DNA kit (TIANGEN Biotech Co., Ltd., Beijing, China).
Reverse transcription of the total RNA to obtain cDNA was performed using a RevertAidTM First Strand cDNA Synthesis Kit (TIANGEN Biotech Co., Ltd., Beijing, China).

2.2. Prediction of CpG Islands, and DNA Methylation Site Analysis of the FPS, SS, and SE Promoters of E. Senticosus

Functional analysis of the obtained promoter sequences of E. senticosus FPS, SS, and SE, was performed using PlantCare online software [11]. The promoter sequences of FPS, SS, and SE genes were predicted by EMBOSS [12] and LILAB [13] for CpG islands, and primers for PCR amplification after bisulfite treatment were designed according to the results (Table 1).
Following the manufacturer’s instructions for the operation of the DNA bisulfite conversion kit, the DNA extracted from the E. senticosus sample was subjected to bisulfite treatment, and the treated DNA was subjected to PCR amplification using a methylation-specific PCR kit and the primers given in Table 1.
After the PCR product obtained above was verified by agarose gel electrophoresis, it was recovered using an agarose gel DNA recovery kit and cloned into a PGM-T vector, and transformed into Escherichia coli TOP10. Finally, three successfully transformed strains were selected and submitted to Beijing Ruibo Xingke Co., Ltd., Beijing, China for sequencing. Then, we tested 25 samples for each type we needed.

2.3. Analysis of FPS, SS, and SE Gene Expression of E. Senticosus

According to the cDNA sequences of FPS, SS, SE, and the internal reference actin gene of E. senticosus, real-time PCR amplification primers were designed using prime premier 6 software (Table 1) [14]. Abiprism 7900 HT (Applied Biosystems, Foster City CA 94404, America) was used for the real-time PCR reaction. The total system was 10 μL, 2× Talent qPCR premix 5.0 μL (TIANGEN Biotech Co., Ltd., Beijing, China), 0.3 μL of forward primer (primer concentration 15 μM), 0.3 μL of reverse primer, 0.5 μL of E. senticosus DNA template (concentration 50 ng/μL), 50 × ROX Reference Dye 1 μL, and RNase-Free H2O 2.9 μL. Reaction conditions were pre-denaturation at 95 °C for 3 min; denaturation at 95 °C for 5 s; annealing at 55 °C for 10 s; extension at 72 °C for 15 s; and completion after 40 cycles. The quantitative results for the actin, FPS, SS, and SE genes of each sample (25 samples of each type) were calculated by SDS2.4 software (ABI 7900HT, Applied Biosystems, Foster City, CA 94404, America). After the total RNA sample addition error of each sample was obtained from the quantitative results for actin, the corrected result was obtained by dividing the quantitative results of the FPS, SS, and SE genes by the total RNA sample addition error.

2.4. Determination of Total Saponin in E. Senticosus and Correlation Analysis

In total, 0.5 mL of 8% vanillin-ethanol solution was added according to the method of [15], and shaken well with 5 mL of 72% sulfuric acid solution. This was heated in a constant temperature water bath at 60 °C for 10 min, then cooled in an ice bath for 15 min, using the solvent as a control to obtain a blank control. The absorbance at 534 nm was determined for the different DNA methylation sites of E. senticosus (25 samples of each type) by the vanillin-concentrated sulfuric acid chromogenic method. The content of total saponin was calculated using the regression equation y = 4.601 × −0.008, R2 = 0.999. SPSS 17.0 software was used to analyze the correlation between the total saponin content of DNA-methylated E. senticosus and the expression of FPS, SS, and SE genes.

2.5. Preparation and Extraction of E. Senticosus Samples for Metabolite Analysis

The plants were screened according to the degree of DNA methylation, and three plants were identified with high DNA methylation (methylation ratio: 2.88%) and three plants with low DNA methylation (methylation ratio: 1.64%). After freeze drying, the leaves were ground to powder, and 100 mg of the powder was dissolved in 1.0 mL of 70% aqueous methanol solution and extracted overnight at 4 °C. After centrifugation at 10,000× g for 10 min, the supernatant was filtered through a microporous membrane (0.22 μm) for LC-MS analysis.

2.6. UPLC Conditions

The UPLC conditions were a mobile phase, the aqueous phase was ultrapure water (0.04% acetic acid) and the organic phase was acetonitrile (0.04% acetic acid); elution gradient, 0 min water/acetonitrile (95:5 v/v), 11.0 min 5:95 v/v, 12.0 min 5:95 v/v, 12.1 min 95:5 v/v, 15.0 min 95:5 v/v; the flow rate was 0.4 mL/min; column temperature 40 °C; and the injection volume was 2 μL.

2.7. ESI-Q TRAP-MS/MS

An API 6500 QTRAP (SCIEX, Framingha, MA 01701, America) LC-MS/MS system, equipped with an ESI Turbo ion spray interface was used, with the conditions: Temperature 500 °C; mass spectrum voltage 5500 V; curtain gas 25 psi; and collision-induced ionization (parameter set to high). Instrument tuning and quality calibration were performed with a 10 μmol/L polypropylene glycol solution in QQQ mode and 100 μmol/L polypropylene glycol solution in LIT mode, respectively. A QQQ scan was obtained in the multiple reaction monitoring (MRM) experiment with the collision gas (nitrogen) set to 5 psi. Declustering potential (DP) and collision energy (CE) for individual MRM conversions were completed through further DP and CE optimization. A set of specific MRM transitions for each period was monitored based on the metabolites eluted during this period.

2.8. Metabolome Data Analysis

The software Analyst 1.6.3 [16] was used to process the LC-MS detection data; metabolite annotations in the samples were analyzed based on a self-built database and the metabolite information public database. Using principal component analysis, orthogonal partial least squares analysis was used to perform pattern recognition analysis and screen differential metabolites. The identified differential metabolites were input into the KEGG (Kyoto Encyclopedia of Genes and Genomes) database [17] to construct and analyze the metabolic pathways.

3. Results

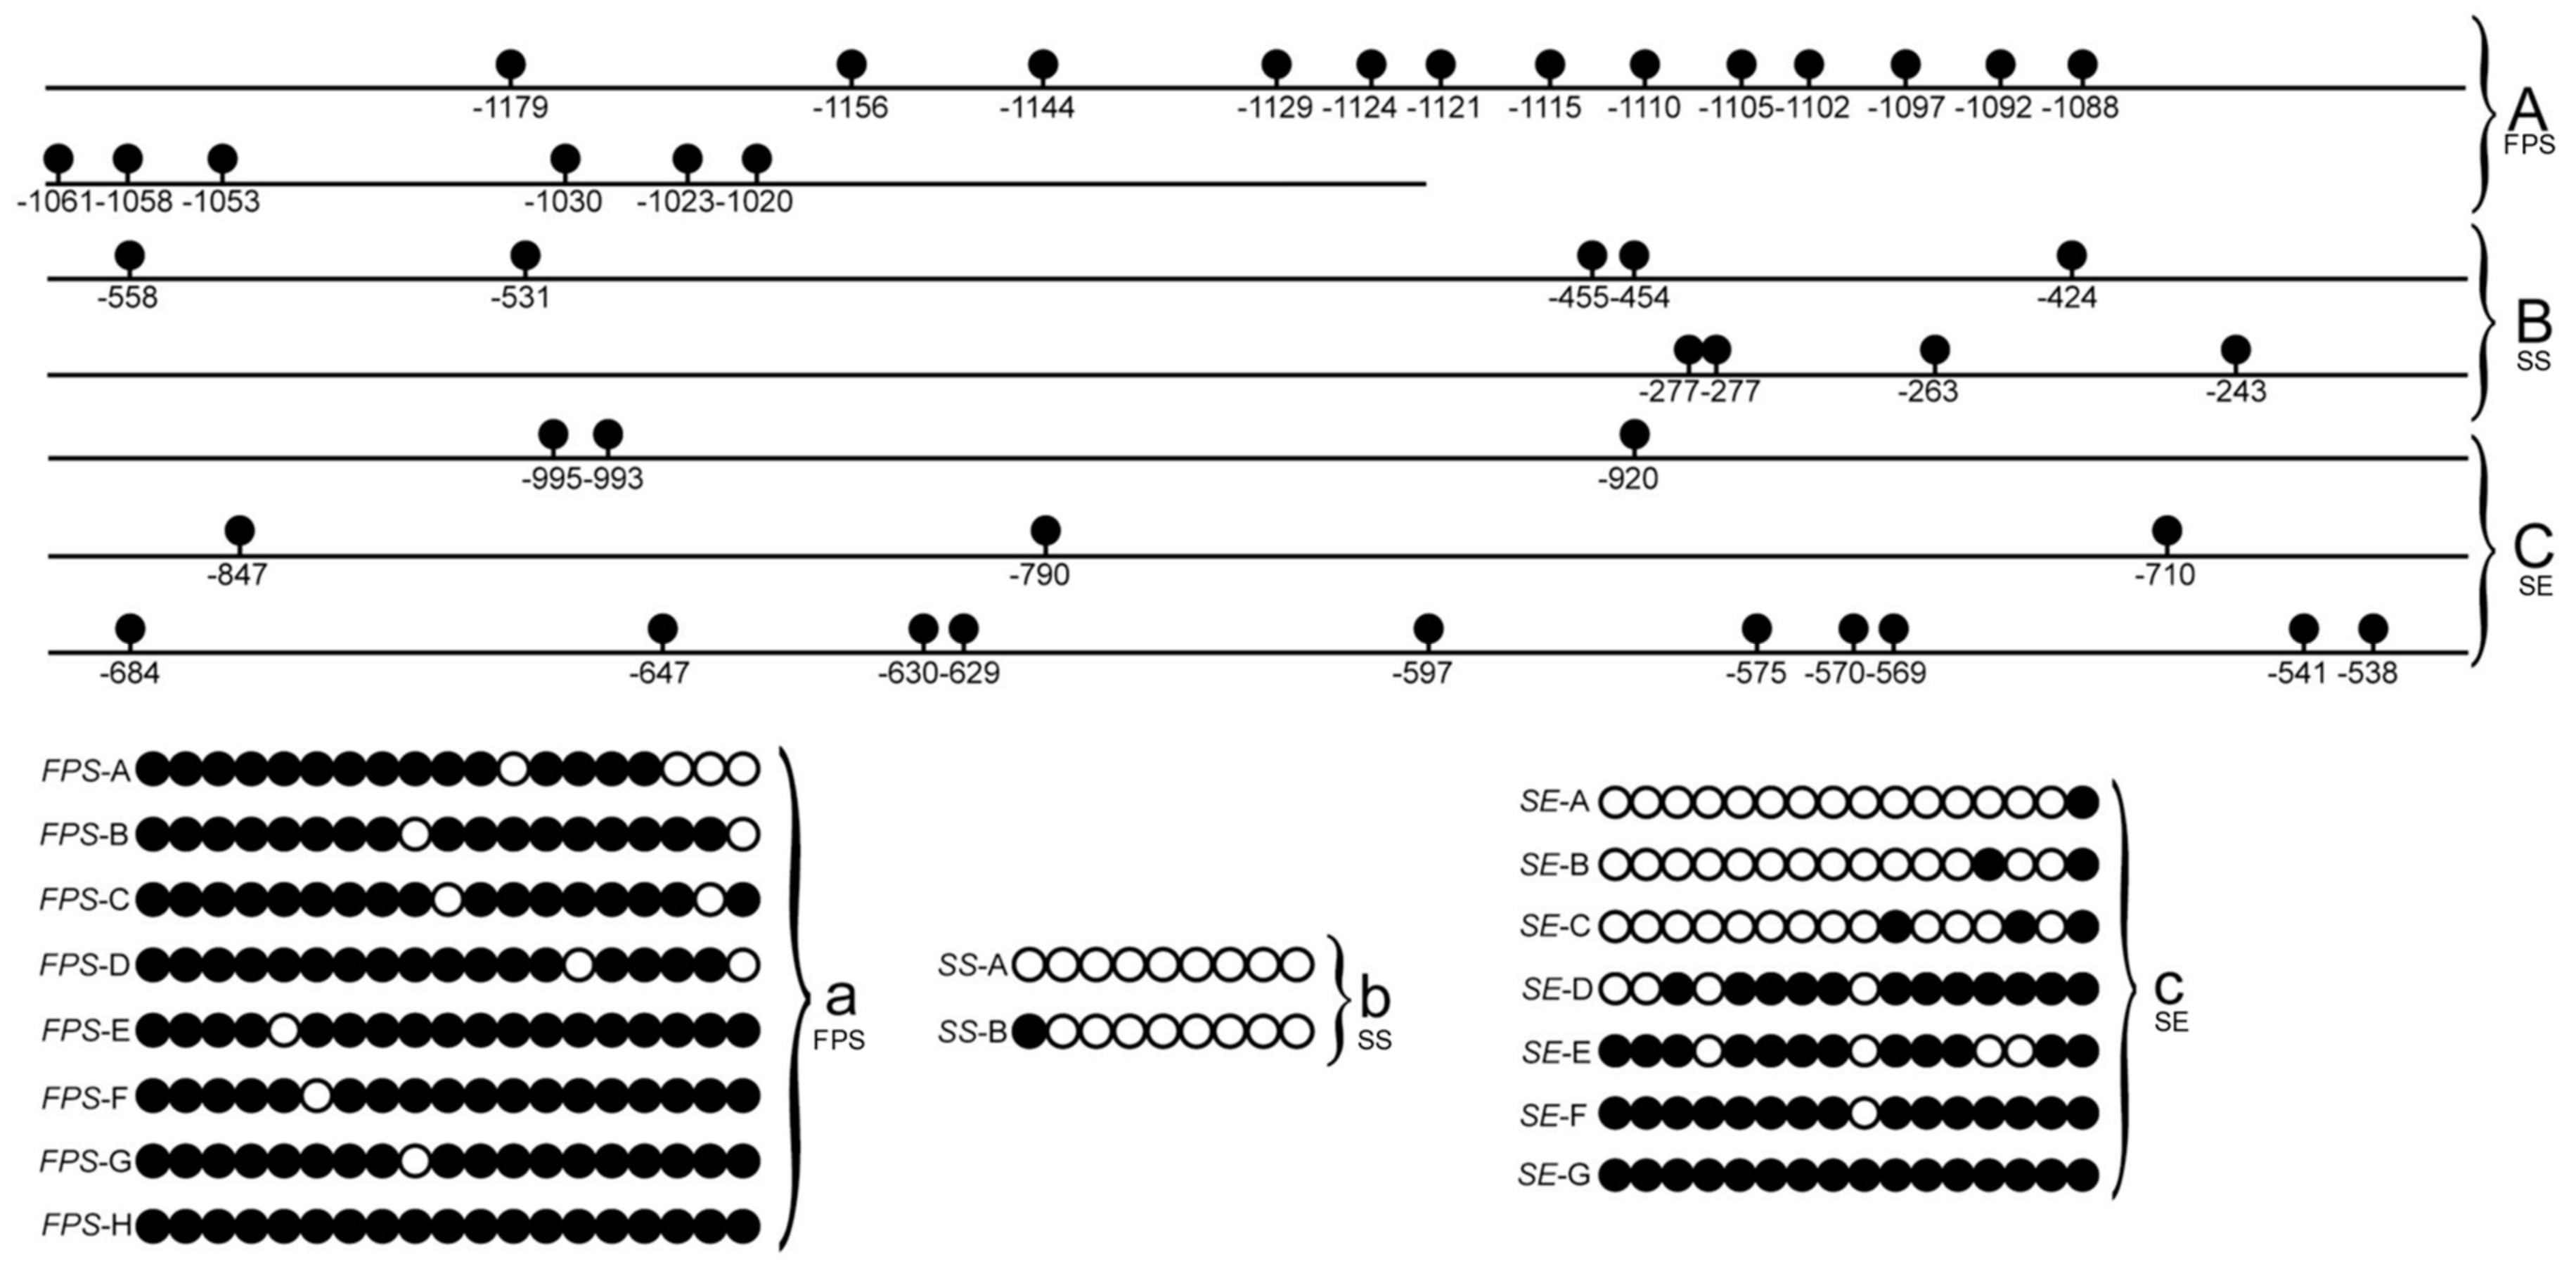
3.1. DNA Methylation Site Analysis of FPS, SS, and SE Gene Promoters of E. Senticosus

BIQ Analyzer 2.0 software [18] was used to compare the DNA sequencing results of bisulfite-treated E. senticosus FPS, SS, and SE gene promoters with the untreated DNA sequences. There were 19 DNA methylation sites in the analyzed region of the E. senticosus FPS gene promoter (Figure 1A), and the DNA methylation rate of cytosine (C) was between 2.68% and 3.40%. Cytosine molecules located at −1053, −1058, −1061, −1092, −1105, −1110, −1129, −1144, −1156, and −1179 were methylated in all the samples. There were eight types of FPS gene promoter DNA methylation sites detected in the sample No. FPS-A-FPS-H (Figure 1a) and there were nine DNA methylation sites in the analyzed region of the E. senticosus SS gene promoter (Figure 1B). The overall DNA methylation rate of cytosine was between 0% and 0.27%, and DNA methylation only occurred at cytosine at position −558. There were 2 types of DNA methylation sites of the SS gene promoter in the E. senticosus sample No. SS-A-SS-B (Figure 1b), and there were 16 DNA methylation sites in the region analyzed by the SE gene promoter of E. senticosus (Figure 1C). The DNA methylation rate of cytosine as a whole was between 0.35% and 5.61%, and the cytosine at position −538 was methylated in all the samples. There were seven types of SE gene promoter DNA methylation sites detected in the E. senticosus sample No. SE-A-SE-G (Figure 1c). The results obtained for the DNA methylation sites of the FPS, SS, and SE gene promoters of E. senticosus were combined with an analysis of the action elements of PlantCARE on the obtained FPS, SS, and SE gene promoter sequences. It was found that cytosine methylated at position −1129 of the FPS gene promoter region was located in the CCC CCG segment, a GC-motif, which participates in the enhancer-like element involvement in oxidative-specific induction. The methylated cytosine at position 558 of the SS gene promoter was located in the CGTGG segment, which is Unnamed_1. The methylated cytosine at position 847 of the SE gene promoter was located in the ACGTG section, which is an abscisic acid responsive element (ABRE) that regulates and controls A. thaliana cis-acting element involvement in abscisic acid responsiveness, and is also a cis-acting regulatory element in the light-responsive G-box element in the TACGTG section. The methylated cytosine at position −684 was a TGACG motif and CGTCA motif participating in a cis-acting regulation element involved in MeJA (methyl jasmonate) responsiveness.

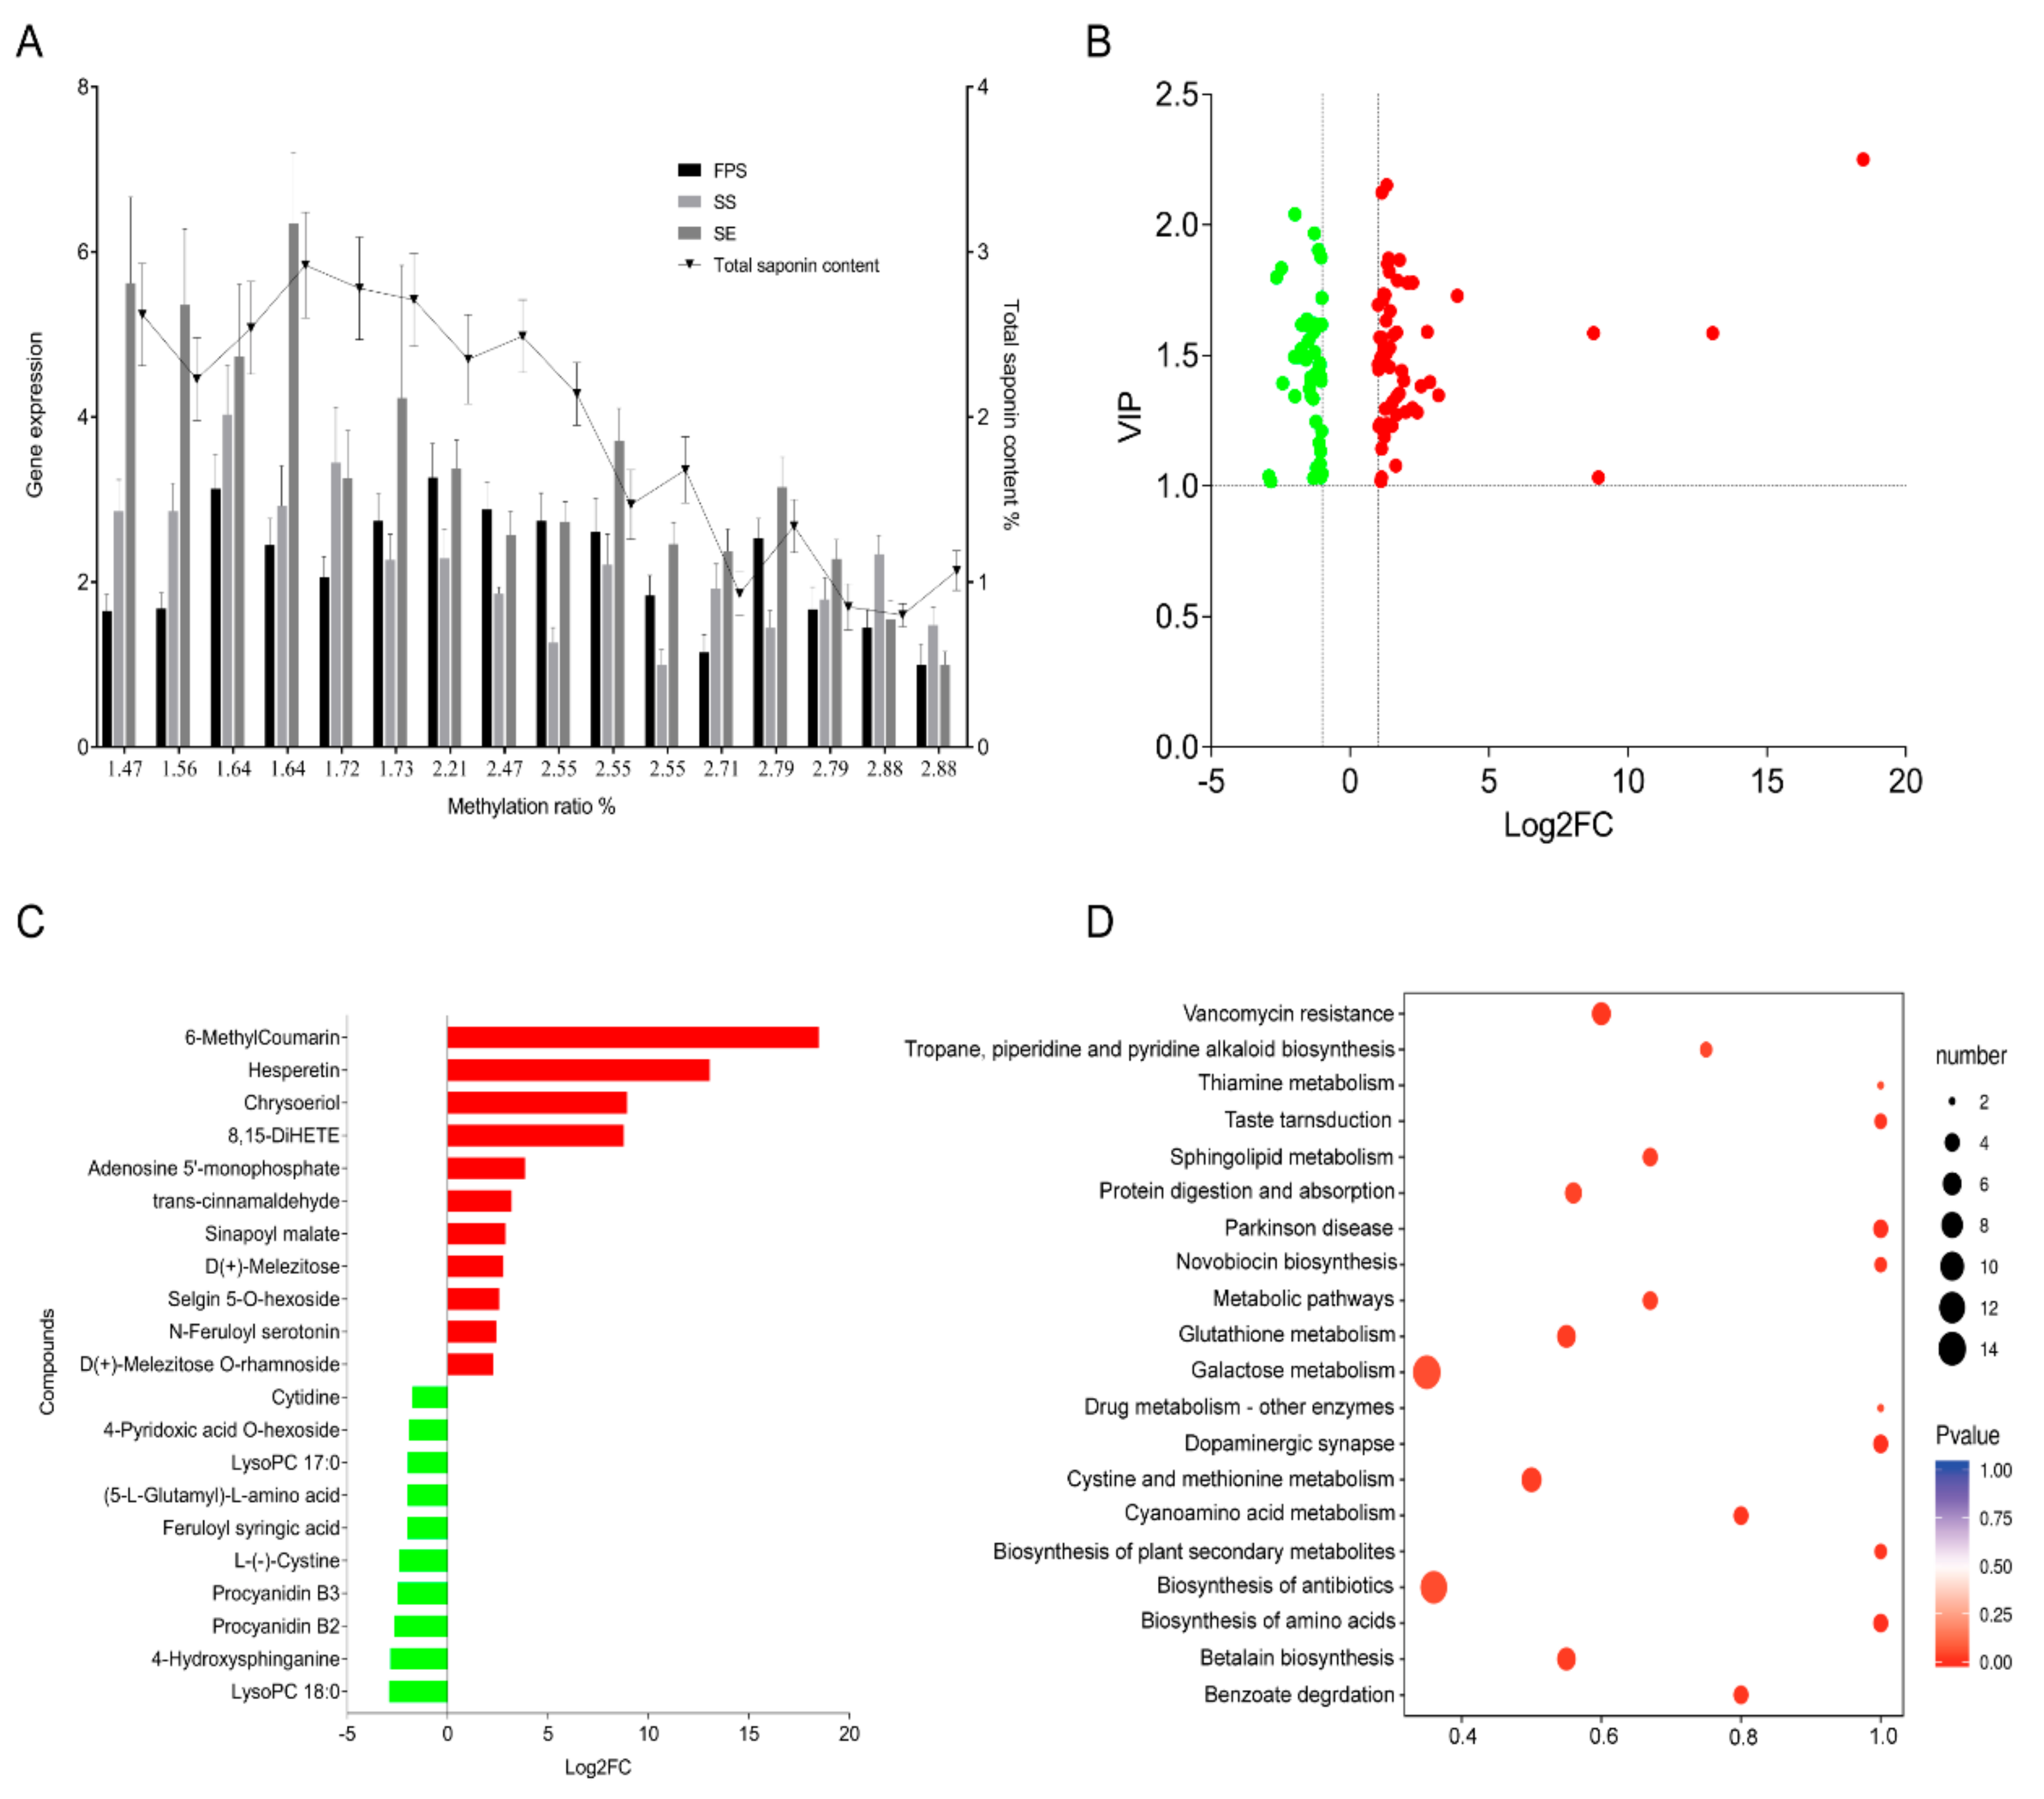
3.2. Effect of the DNA Methylation of FPS, SS, and SE Promoters of E. Senticosus on the Gene Expression and Saponin Content

Through statistical analysis of the correlation between the DNA methylation ratio, saponin content, and FPS, SS, and SE gene expression (Figure 2A), it was found that the expression of FPS, SS, and SE genes was positively correlated with saponin content (p < 0.05), and the overall DNA methylation ratio of the three gene promoter regions was negatively correlated with saponin content (p < 0.01). The total saponin content of the three high DNA methylation groups (1.07 ± 0.12 mg/g) was significantly lower than that of the three low DNA methylation groups (2.92 ± 0.32 mg/g, p < 0.05) as measured by the vanillin-concentrated sulfuric acid color development method. The expression of FPS, SS, and SE genes in E. senticosus had a significant positive correlation only between the SS and SE genes (p < 0.01). There was no correlation between the FPS gene expression of E. senticosus and the DNA methylation ratio of the FPS gene promoter. The DNA methylation ratio of the E. senticosus SS gene promoter was significantly negatively correlated with SS gene expression (p < 0.01). The DNA methylation ratio of the SE gene promoter of E. senticosus was significantly negatively correlated with SE gene expression (p < 0.01).

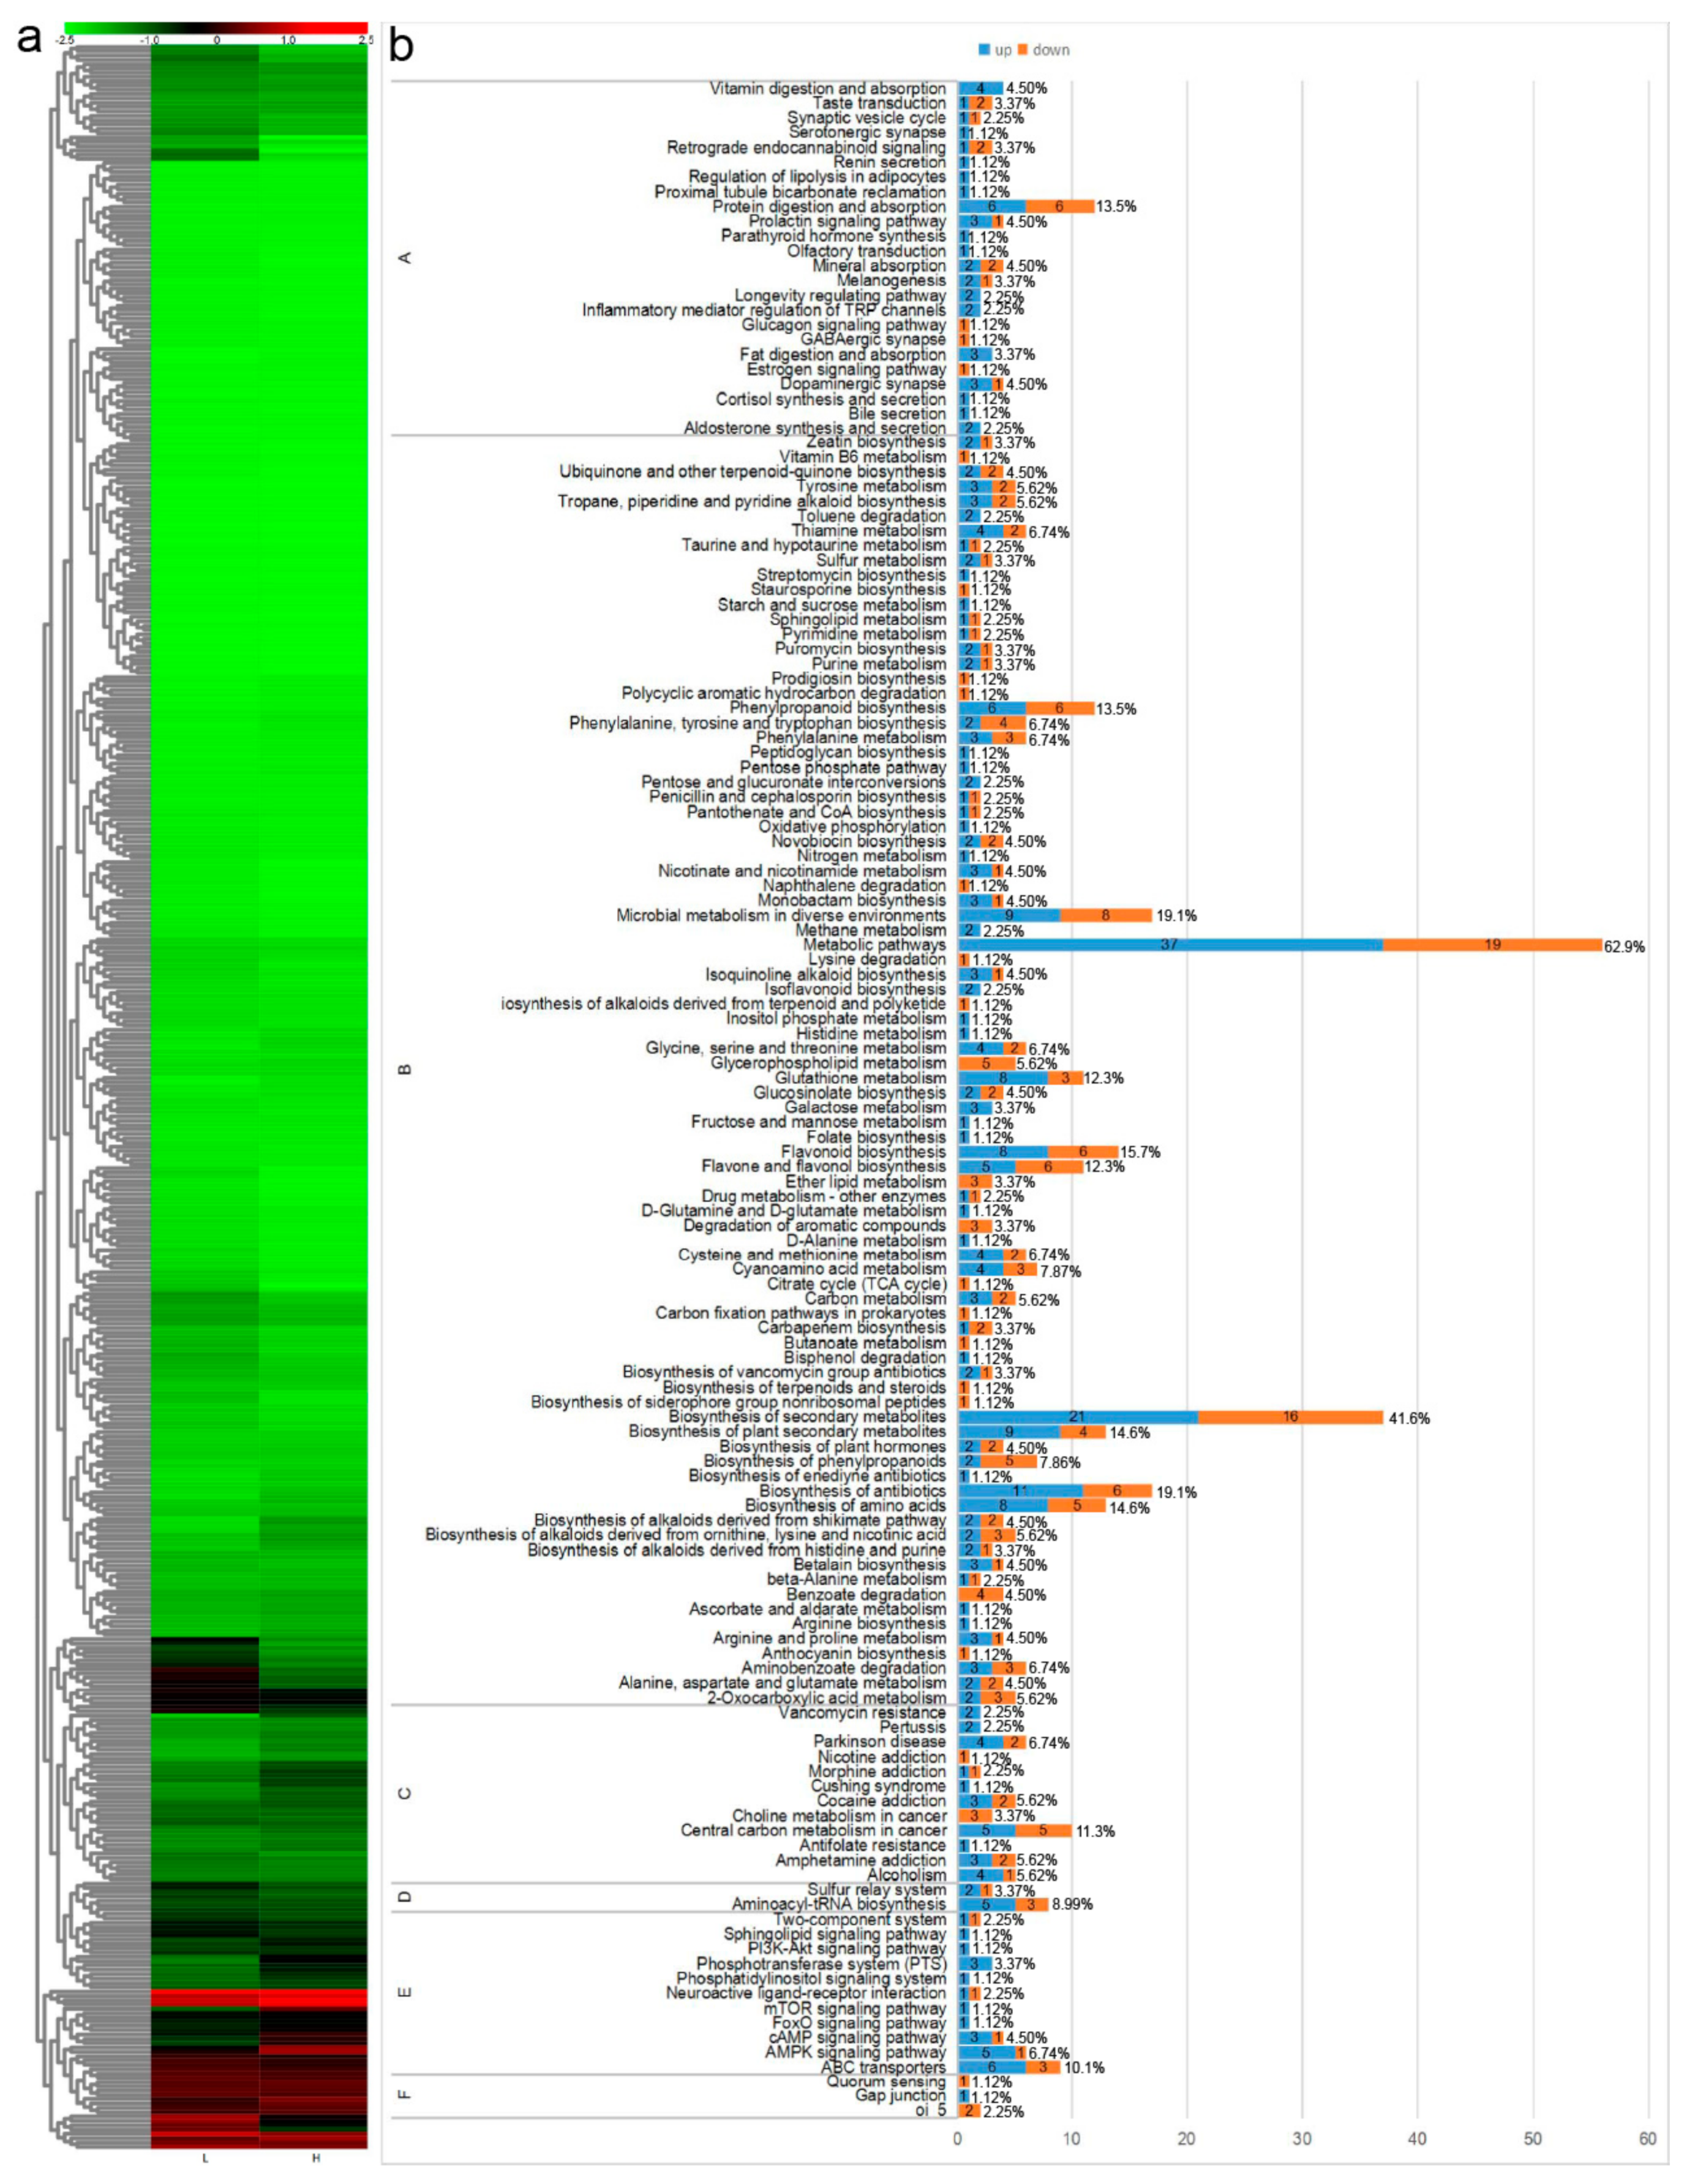
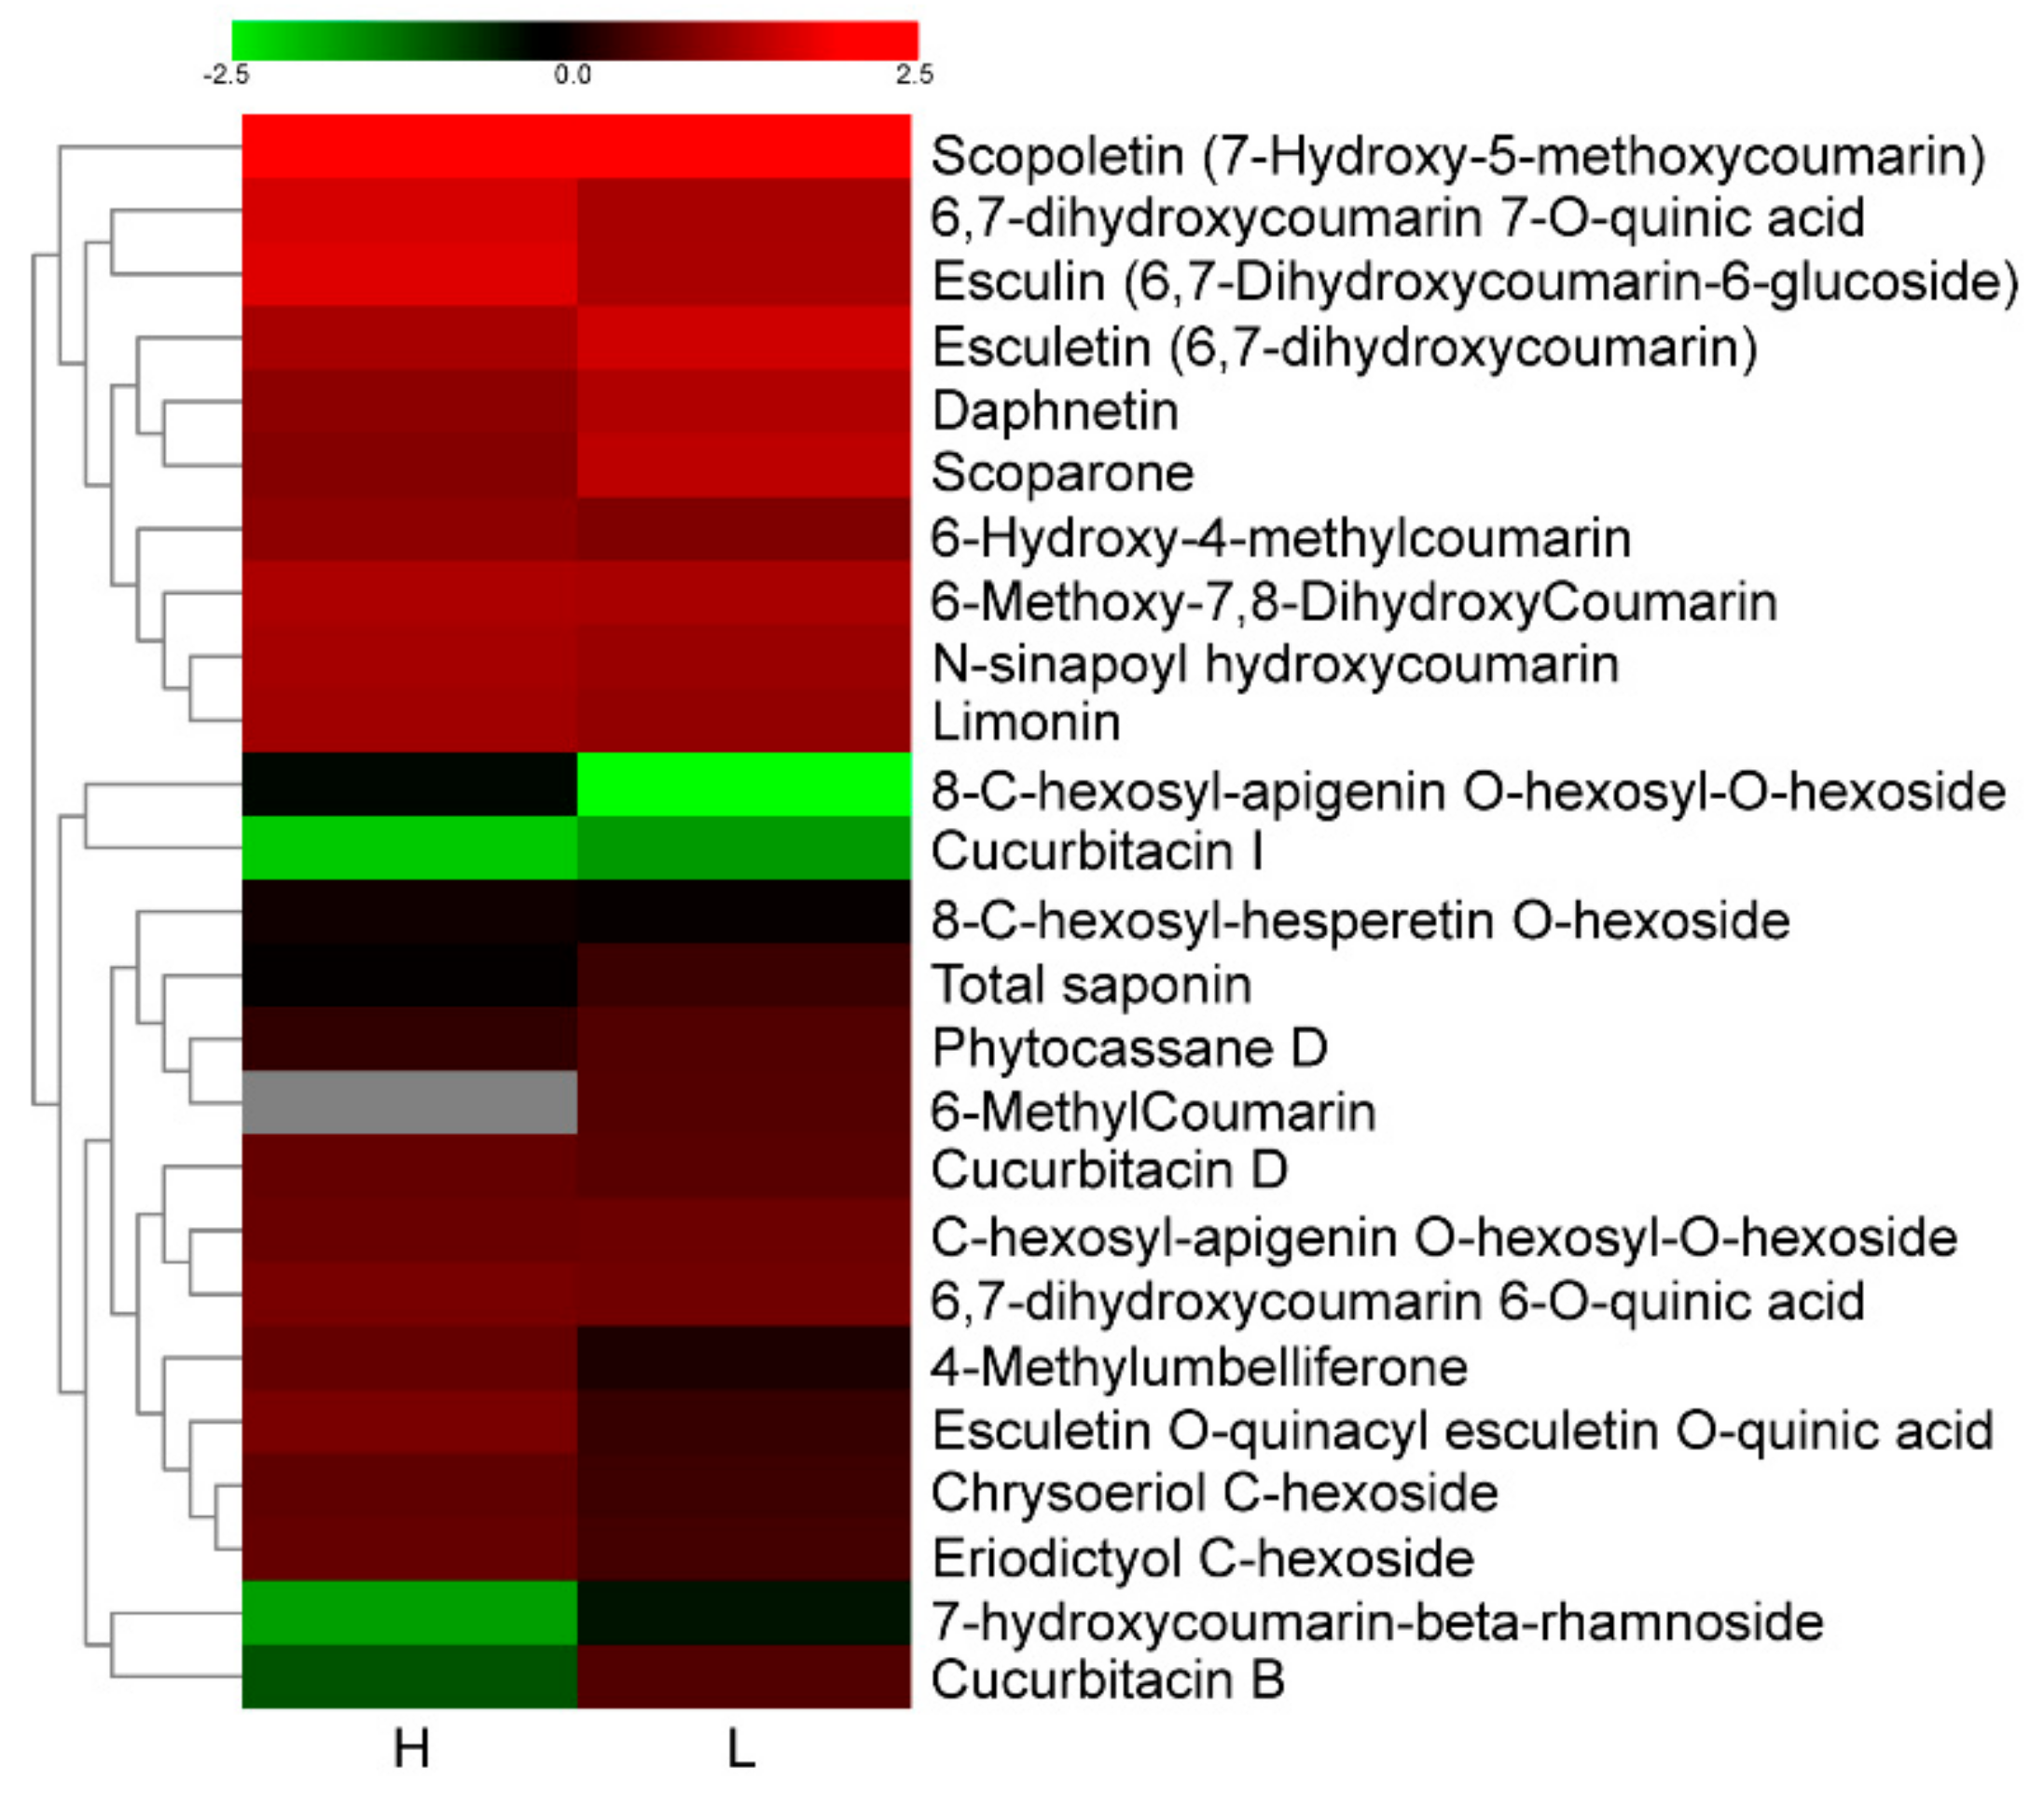
3.3. Screening of Differential Metabolites in the Leaves of E. Senticosus

In total, 488 different metabolites were detected by LC-MS in the leaves of E. senticosus. The amounts of metabolites were normalized and plotted as a cluster heat map (Figure 3a). The types of metabolites detected in each sample were the same. Among the 488 metabolites detected, flavonoid compounds accounted for the largest proportion, followed by lipids, amino acids and derivatives, and organic acids and derivatives.
Multivariate statistical variable importance in project (VIP) values (VIP > 1), single-dimensional statistics (p < 0.05), and fold change were used to screen differential metabolites. The difference multiples were transformed by Log2FC, and VIP > 1, p < 0.05, Log2FC were selected. Metabolites with Log2FC ≥ 2 or Log2FC ≤ 0.5 are differential metabolites. The differences in the expression levels of metabolites between the two groups of samples are shown using a volcano plot (Figure 2B). In total, 100 different differential metabolites were screened, and in the low DNA methylation group, 56 and 44 differential metabolites were significantly upregulated and downregulated, respectively, compared with the high DNA methylation group. The metabolites with differential folds ranked in the top 20 (up- and downregulated) were also listed by comparing the fold-multiplier maps (Figure 2C), and the differentially expressed metabolites were found to be upregulated. It was mainly secondary metabolites, such as coumarin, coumarin derivatives, and flavonoids. The maximum upregulation of 18.47 was observed for 6-methylcoumarin, a metabolite related to the mevalonate pathway. For 6-methylcoumarin, there was a significant upregulation of the prime, demonstrating a negative correlation between the methylation ratio and the saponin content.
Differential metabolites interact in organisms to form different pathways. The KEGG database was used for the annotation of differential metabolites. The classification chart is shown in Figure 3b. A total of 89 different metabolites were annotated in 140 metabolic pathways. Figure 3b shows that some metabolites participated in multiple metabolic pathways. The proportion of 140 metabolism pathways is the highest, with p < 0.01 as the threshold to screen for significantly enriched pathways. Figure 2D indicates that the metabolites that were enriched were mainly involved in the biosynthesis of plant secondary metabolites, flavonoid biosynthesis, isoquinoline alkaloid biosynthesis, and biosynthesis of vancomycin group antibiotics.
Because FPS, SS, and SE are the key enzymes in the biosynthesis of E. senticosus saponins via the mevalonate pathway, we compared 488 tested compounds with the triterpenoid saponin synthesis pathway in the KEGG database, and screened 25 species related to triterpenoids and mapped them into heat maps (Figure 4). The amounts of the metabolic products in the low DNA methylation group were found to be higher compared with the high DNA methylation group, except for eight compounds, including limonin, which were found in significantly lower amounts than in the high DNA methylation group.
Flavonoids are an important type of metabolite in plants, and there are many kinds of flavonoids. The KEGG database contains common types of flavonoids, but many modified substances are not found in the KEGG database at present. On the basis of metabolome analysis and existing data, three metabolic pathways for flavonoids were constructed, and the KEGG database was supplemented with these.

4. Discussion

DNA methylation, as a major epigenetic modification, can affect the expression of plant functional genes [19]. Previous reports have found that DNA methylation participates in the secondary metabolic process of regulating plant carotenoid synthesis and degradation [20]. In Ling ling Dou et al.’s study of Gossypium hirsutum L., DNA methylation levels were found to affect the expression of many genes and some related biochemical pathways, especially those that regulate secondary metabolic processes [21]. Long jiang Yu et al. analyzed the whole genome methylation of Mandya chinensis and found that the overall level of DNA methylation was significantly negatively correlated with paclitaxel content [22]. In a study of Epichloe festuca and Lolium perenne, it was found that the methylation of H3K9 and H3K27 was an important indicator of the symbiotic-specific expression of alkaloid bioprotective metabolites, and the symbiotic interaction between the symbiont and its host [23].
The promoter region of a gene is important for gene transcription regulation. When DNA in the promoter region of a plant functional gene is methylated, transcription factors can be prevented from binding to the methylated region of the promoter, thus gene transcription is inhibited, leading to the reduction or silencing of gene expression. Therefore, DNA methylation is an effective mechanism for plant transcription regulation [23,24]. A clear understanding of the level and type of methylation in the DNA promoter region is useful to understand the regulation mechanism of functional gene expression in medicinal plants and the formation mechanism of quality differences in medicinal plants [25,26]. Lonicera japonica, the source plant of the traditional Chinese medicine honeysuckle, and L. japonica var. Chinensis, a variety produced by natural mutagenesis, had identical amino acid sequences of the key enzymes involved in the synthesis of chlorogenic acid, the main medicinal component, but the amounts of gene expression and chlorogenic acid produced were significantly different between the two species [27]. The results of analysis of the DNA methylation of specific genes showed that the degree of DNA methylation of the promoter −109 to −279 bp region in the flanking region of the phenylalanine ammonia-lyase2 gene of L. maackii was higher than that of L. maackii, and the degree of DNA methylation of the CG site was significantly different between the two [28]. In the present study, we conducted DNA methylation analysis of the key enzymes FPS upstream −972 to −1249 bp, SS upstream −207 to −606 bp, and SE upstream −515 to −1062 bp, and found that the FPS cytosines at −1053, −1058, −1061, −1092, −1105, −1110, −1129, −1144, −1156, −1179, and −538 of the SE gene were methylated in all the samples and do not participate in the regulation of gene expression [29,30], so were regarded as DNA methylation nonspecific sites of gene promoters. The SS cytosine at −558 and cytosines at positions −684 and −847 of the SE gene were specific sites involved in the regulation of gene expression that need further research. The correlation analysis of the DNA methylation status, gene expression, and saponin content of FPS, SS, and SE gene promoters indicated that the saponin content and gene expression of E. senticosus were regulated by the DNA methylation of the FPS, SS, and SE gene promoters. This is in contrast to the results for L. japonica and L. japonica var. Chinensis [27], Panax ginseng [31], and Taxus media [21]. These results indicate that DNA methylation in the promoter region of the genes for key enzymes is an important factor in the differences in the quality and gene expression of key enzymes in medicinal plants.
The total amount of saponin and the amount of 6-methyl coumarin, which is involved in the mevalonate pathway, showed significant upregulation, and the content of metabolites related to mevalonate pathway in the E. senticosus low DNA methylation group was higher than that of the high DNA methylation group, which confirmed the negative correlation between the DNA methylation ratio and the E. senticosus saponin content, and the negative correlation between the FPS, SS, and SE gene expression levels, at the metabolic level. Three metabolic pathways of flavonoids were constructed, and these were used to supplement the KEGG database to provide a reference for subsequent research on key metabolites, functions of key genes in metabolic pathways, and the biosynthesis of main metabolites.

5. Conclusions

In this study, the FPS gene promoter region of E. senticosus was found to have 19 methylation sites and 8 methylation types determined by bisulfite sequencing technology. The promoter region of the SS gene has nine methylation sites and two methylation types. There are 16 methylation sites and 7 methylation types in the promoter region of the SE gene. Combined with the expression levels of different methylation types, their total saponin content, and extensive targeted metabonomics technology, it was confirmed that DNA methylation in this region can significantly inhibit the synthesis of the mevalonate pathway, thus reducing the content of the final product, E. senticosus saponin. It is of great significance to reveal the mechanism of the formation of the content difference of E. senticosus.

Author Contributions

Y.L. and Z.X. conceived and designed the experiments; Z.W. and Y.Z. performed the experiments; M.C., L.L. and H.G. analyzed the data; Z.W. and Z.X. wrote the paper.

Funding

This work was primarily supported by the national natural science foundation of China (31570683). Other support includes Hebei education department sponsors scientific research projects (ZD2019075) and science fund for cultivating of north china university of science and technology (SP201508).

Conflicts of Interest

The authors declare no conflict of interest.

References

  1. The State Pharmacopoeia Commission of P.R. China. Pharmacopoeia of the People’s Republic of China; China Medical Science Press: Beijing, China, 2015; pp. 5–6. [Google Scholar]
  2. Huang, L.; Zhao, H.; Huang, B.; Zheng, C.; Peng, W.; Qin, L. Acanthopanax senticosus: Review of botany, chemistry and pharmacology. Pharmazie 2011, 66, 83–97. [Google Scholar] [PubMed]
  3. Murthy, H.N.; Kim, Y.S.; Georgiev, M.I.; Peak, K.Y. Biotechnological production of eleutherosides: Current state and perspectives. Appl. Microbiol. Biotechnol. 2014, 98, 7319–7329. [Google Scholar] [CrossRef] [PubMed]
  4. Jung, J.D.; Park, H.W.; Hahn, Y.; Hur, C.G.; In, D.S.; Chung, H.J.; Liu, J.R.; Choi, D.W. Discovery of genes for ginsenoside biosynthesis by analysis of ginseng expressed sequence tags. Plant Cell Rep. 2003, 22, 224–230. [Google Scholar] [CrossRef] [PubMed]
  5. SzkoPińska, A.; Płochocka, D. Farnesyl diphosphate synthase; regulation of product specificity. Acta Biochim. Pol. 2005, 52, 45–55. [Google Scholar] [PubMed]
  6. Abe, I.; Rohmer, M.; Prestwich, G.D. Enzymatic cyclization of squalene and oxidosqualene to sterols and triterpenes. Chem. Rev. 1993, 93, 2189–2206. [Google Scholar] [CrossRef]
  7. Hwang, H.S.; Lee, H.; Choi, Y.E. Transcriptomic analysis of Siberian ginseng (Eleutherococcus senticosus) to discover genes involved in saponin biosynthesis. BMC Genom. 2015, 16, 180. [Google Scholar] [CrossRef]
  8. HaralamPidis, K.; Trojanowska, M.; Osbourn, A.E. Biosynthesis of triterpenoid saponins in plants. Adv. Biochem. Eng. Biotechnol. 2002, 75, 31–49. [Google Scholar]
  9. Pikaard, C.S.; Mittelsten Scheid, O. Epigenetic regulation in plants. Cold Spring Harb. Perspect. Biol. 2014, 6, a109315. [Google Scholar] [CrossRef]
  10. Nguyen, T.P.; Kyung, A.L.; Su, J.J.; Jung, K.C.; Young, H.K.; Jong, S.K. Capillary electrophoretic method for the determination of diterpenoid isomers in Acanthopanax species. J. Pharm. Biomed. Anal. 2006, 40, 56–61. [Google Scholar]
  11. PlantCARE, a Database of Plant Promoters and their Cis-Acting Regulatory Elements. Available online: http://bioinformatics.psb.ugent.be/webtools/plantcare/html/ (accessed on 20 November 2019).
  12. EMBOSS Programs < EMBL-EBI. Available online: https://www.ebi.ac.uk/Tools/emboss/ (accessed on 20 November 2019).
  13. MethPrimer-Design MSP/BSP Primers and Predict CpG Islands—Li Lab, PUMCH. Available online: http://www.urogene.org/cgi-bin/methprimer/methprimer.cgi (accessed on 20 November 2019).
  14. Singh, V.K.; Mangalam, A.K.; Dwivedi, S.; Naik, S. Primer premier: Program for design of degenerate primers from a protein sequence. Biotechniques 1998, 24, 318–319. [Google Scholar] [CrossRef]
  15. Naydenov, M.; Baev, V.; Apostolova, E.; Gospodinova, N.; Sablok, G.; Gozmanova, M.; Yahubyan, G. High-temperature effect on genes engaged in DNA methylation and affected by DNA methylation in Arabidopsis. Plant Physiol. Biochem. 2015, 87, 102–108. [Google Scholar] [CrossRef] [PubMed]
  16. Fraga, C.G.; Clowers, B.H.; Moore, R.J.; Zink, E.M. Signature-discovery approach for sample matching of a nerve-agent precursor using liquid chromatography-mass spectrometry, XCMS, and chemometrics. Anal. Chem. 2010, 82, 4165–4173. [Google Scholar] [CrossRef] [PubMed]
  17. Kanehisa, M.; Susumu, G. KEGG: Kyoto encyclopedia of genes and genomes. Nucleic Acids Res. 2000, 28, 27–30. [Google Scholar] [CrossRef] [PubMed]
  18. Arango, J.; Beltrán, J.; Nuñez, J.; Chavarriaga, P. Evidence of epigenetic mechanisms affecting carotenoids. Subcell. Biochem. 2016, 79, 295–307. [Google Scholar] [PubMed]
  19. Curradi, M.; Izzo, A.; Badaracco, G.; Landsberger, N. Molecular mechanisms of gene silencing mediated by DNA methylation. Mol. Cell. Biol. 2002, 22, 3157–3173. [Google Scholar] [CrossRef]
  20. Chujo, T.; Scott, B. Histone H3K9 and H3K27 methylation regulates fungal alkaloid biosynthesis in a fungal endophyte-plant symbiosis. Mol. Microbiol. 2014, 92, 413–434. [Google Scholar] [CrossRef]
  21. Li, L.Q.; Li, X.L.; Fu, C.H.; Zhao, C.F.; Yu, L.J. Sustainable use of Taxus media cell cultures through minimal growth conservation and manipulation of genome methylation. Process Biochem. 2013, 48, 525–531. [Google Scholar] [CrossRef]
  22. Dou, L.; Jia, X.; Wei, H.; Fan, S.; Wang, H.; Guo, Y.; Duan, S.; Pang, C.; Yu, S. Global analysis of DNA methylation in young (J1) and senescent (J2) Gossypium hirsutum L. cotyledons byMeDIP-Seq. PLoS ONE 2017, 12, e0179141. [Google Scholar] [CrossRef]
  23. Chan, S.W.; Henderson, I.R.; Jacobsen, S.E. Gardening the genome: DNA methylation in Arabidopsis thaliana. Nat. Rev. Genet. 2005, 6, 351–360. [Google Scholar] [CrossRef]
  24. Kuo, T.C.; Chen, C.H.; Chen, S.H.; Chun, M.J.; Huang, L.C.; Lin, C.Y.; Chen, C.Y.; Lo, H.F.; Jeng, S.T.; Chen, L.F. The effect of red light and far-red light conditions on secondary metabolism in Agarwood. BMC Plant Biol. 2015, 15, 139. [Google Scholar] [CrossRef]
  25. Da, K.; Nowak, J.; Flinn, B. Potato cytosine methylation and gene expression changes induced by a beneficial bacterial endophyte, Burkholderia phytofirmans strain PsJN. Plant Physiol. Biochem. 2012, 50, 24–34. [Google Scholar] [CrossRef] [PubMed]
  26. Wang, M.; Qin, L.; Xie, C.; Li, W.; Yuan, J.; Kong, L.; Yu, W.; Xia, G.; Liu, S. Induced and constitutive DNA methylation in a salinity-tolerant wheat introgression line. Plant Cell Physiol. 2014, 55, 1354–1365. [Google Scholar] [CrossRef] [PubMed]
  27. Yuan, Y.; Wang, Z.; Jiang, C.; Wang, X.; Huang, L. Exploiting genes and functional diversity of chlorogenic acid and luteolin biosyntheses in Lonicera japonica and their substitutes. Gene 2014, 534, 408–416. [Google Scholar] [CrossRef] [PubMed]
  28. Zha, L.; Liu, S.; Liu, J.; Jiang, C.; Yu, S.; Yuan, Y.; Yang, J.; Wang, Y.; Huang, L. DNA methylation influences chlorogenic acid biosynthesis in Lonicera japonica by mediating LjbZIP8 to regulate phenylalanine ammonia-lyase 2 expression. Front. Plant Sci. 2017, 8, 1178. [Google Scholar] [CrossRef]
  29. Kim, J.; Kim, J.H.; Richards, E.J.; Chung, K.M.; Woo, H.R. Arabidopsis VIM proteins regulate epigenetic silencing by modulating DNA methylation and histone modification in cooperation with MET1. Mol. Plant 2014, 7, 1470–1485. [Google Scholar] [CrossRef]
  30. Kuhlmann, M.; Finke, A.; Mascher, M.; Mette, M.F. DNA methylation maintenance consolidates RNA-directed DNA methylation and transcriptional gene silencing over generations in Arabidopsis thaliana. Plant J. 2014, 80, 269–281. [Google Scholar] [CrossRef]
  31. Ngezahayo, F.; Wang, X.L.; Yu, X.M.; Jiang, L.L.; Chu, Y.J.; Shen, B.H.; Yan, Z.K.; Liu, B. Habitat-induced reciprocal transformation in the root phenotype of Oriental ginseng is associated with alteration in DNA methylation. Chin. Sci. Bull. 2011, 56, 1685–1690. [Google Scholar] [CrossRef] [Green Version]
Figure 1. Distribution diagram and map of the types of methylation sites of the promoters of E. senticosus FPS, SS, and SE genes. Black circles correspond to methylated CpG inislands. Filled (black) circles correspond to methylated C molecules, unfilled (white) circles correspond to unmethylated C molecules. (A): Schematic diagram of DNA methylation site of FPS gene; (B): Schematic diagram of DNA methylation site of SS gene; (C): Schematic diagram of DNA methylation site of SE gene; (a): Schematic diagram of DNA methylation type of FPS gene; (b): SS Schematic diagram of the type of DNA methylation; (c): Schematic diagram of the methylation type of SE gene DNA.
Forests 10 01053 g001
Figure 2. (A), Effect of the methylation of E. senticosus FPS, SS, and SE DNA on the DNA expression level and saponin content. (B), Volcano diagram of the metabolites with different metabonomic characteristics in E. senticosus high and low DNA methylation groups. Green represents downregulated differentially expressed metabolites, and red represents upregulated differentially expressed metabolites. (C), Histogram of significant differences in metabolite difference multiplicity between the metabolite groups in the E. senticosus high and low DNA methylation groups (p < 0.01). Green represents downregulated differentially expressed metabolites, and red represents upregulated differentially expressed metabolites. (D), Enrichment diagram of KEGG, showing metabolites with different metabonomic characteristics in the E. senticosus high and low DNA methylation groups. The abscissa indicates the rich factor corresponding to each channel, the ordinate indicates the channel name, and the color of the point indicates the p-value: the redder, the greater the enrichment. The size of the dot represents the number of enriched differential metabolites.
Forests 10 01053 g002
Figure 3. (a), Cluster diagram of the metabolite components of the E. senticosus high and low DNA methylation groups. The ordinate represents the metabolite components, and the abscissa represents different samples. Red represents a relative increase in metabolites, and green represents a decrease in the relative amounts. (b), KEGG classification diagram of the metabonomic characteristics of metabolites with significant differences between the E. senticosus high and low DNA methylation groups. The ordinate is the name of the KEGG metabolic pathway, and the abscissa is the number of metabolites annotated to the pathway, and the proportion of that number to the total number of metabolites annotated is given in brackets. A is organismal systems, B is metabolism, C is human diseases, D is genetic information processing, E is environmental information processing, F is cell processes.
Forests 10 01053 g003
Figure 4. Cluster diagram of mevalonate pathway metabolic components and total saponins in high and low DNA methylation sample groups. The ordinate represents metabolite components, and the abscissa represents different samples. Red represents a relative increase in metabolites, and green represents a decrease in relative amounts.
Forests 10 01053 g004
Table 1. DNA methylation site analysis and real-time fluorescence quantitative PCR primers of the farnesyl diphosphate (FPS), squalene synthase (SS), and squalene epoxidase (SE) promoters of Eleutherococcus senticosus.
Primer NameSequence (5′–3′)UseExpected Amplification Length
CFPSJqs5AAAACTCAGATCTGGTCAAAAAGGGPrimers for PCR amplification of FPS in unsulfite treated samples277 bp
CFPSJqx5CCTGGAAACCAAGCACCAAATGCA
CFPSJhs5AAAATTTAGATTTGGTTAAAAAGGGPrimers for PCR amplification of FPS in sulfite treated samples
CFPSJhx5CCTAAAAACCAAACACCAAATACA
CSSJqs5AAAAAACTTAAAAATGTGAGCCAACAGPrimers for PCR amplification of unsulfite treated sample SS309 bp
CSSJqx5GAATGAAAATGGAGCAGCAATTTGT
CSSJhs5AAAAAATTTAAAAATGTGAGTTAATAGPrimers for PCR amplification of bisulfite treated sample SS
CSSJhx5AAATAAAAATAAAACAACAATTTAT
CSEJqsGGGGTTGTTCCAGATCTGGAATACTAPrimers for PCR amplification of unsulfite treated sample SE547 bp
CSEJqxCAGCCACCAGAGCCACAGAATTCCG
CSEJhsGGGGTTGTTTTAGATTTGGAATATTAPrimers for PCR amplification of sulfite treated sample SE
CSEJhxAACCACCAAAACCACAAAATTCCG
ActrtFGCAAGAGCTTGAAACAGCAAAGPrimers for amplification of actin128 bp
AcrrtRTCAAAGATGGCTGGAAAAGGA
FPSrtFTCTCTCCCTCTTTCCCTCCTCTPrimers for amplifying FPS Gene132 bp
FPSrtRATCGCTCATTCTGGCTGGTT
SSrtFTCACGACTAGATGGACAAGCAAAPrimers for amplifying SS143 bp
SSrtRGCCAATAACAAGAGCAGGAATG
SErtFTAAAGTCGGAAGGAGTTCGPrimers for amplification of SE82 bp
SErtRCTTAGTGAATGAATGGGAGG

