Abstract
DNA methylation is one of the best-studied epigenetic modifications involved in many biological processes. However, little is known about the epigenetic mechanism for flower color chimera of Prunus mume (Japanese apricot, mei). Using bisulfate sequencing and RNA sequencing, we analyzed the white (FBW) and red (FBR) petals collected from an individual tree of Japanese apricot cv. ‘Fuban Tiaozhi’ mei to reveal the different changes in methylation patterns associated with gene expression leading to significant difference in anthocyanins accumulation of FBW (0.012 ± 0.005 mg/g) and FBR (0.078 ± 0.013 mg/g). It was found that gene expression levels were positively correlated with DNA methylation levels within gene-bodies of FBW and FBR genomes; however, negative correlations between gene expression and DNA methylation levels were detected within promoter domains. In general, the methylation level within methylome of FBW was higher; and in total, 4,618 differentially methylated regions (DMRs) and 1,212 differentially expressed genes (DEGs) were detected from FBW vs. FBR. We also identified 82 DMR-associated DEGs, and 13 of them, including PmBAHD, PmCYP450, and PmABC, were playing critical roles in phenylalanine metabolism pathway, glycosyltransferase activity, and ABC transporter. The evidence exhibited DNA methylation may regulate gene expression resulting in flower color chimera of Japanese apricot.
1. Introduction
Prunus mume Sieb. et Zucc. (Japanese apricot, mei), being one of the traditional ornamental plants, has been domesticated for more than 3000 years in China [1,2]. The woody plant with great cultural and economic value is well known for its colorful flowers with their unique fragrance, the traits of which are the important breeding objectives for genetic improvement [2]. In the 1940s, breeders discovered varieties of flower color chimera with high ornamental and commercial value. During the past 70 years, at least five new cultivars of Japanese apricot with chimeric flowers for modern landscaping application were released through selective breeding; however, there has been little exploration into the formation mechanism of the flower color chimera.
At the cytological level, plant chimera organism is believed to be the result of the heterogeneous primordial cells proliferating mechanically in the shoot apical meristem [3]. In other word, the cell lines maintaining their genetic integrity are joined; however, their genetic materials do not mix, which was examined with high-throughput sequencing techniques [4,5,6]. The plant having two main genetic origins in a crucial component of a pigmentation biosynthesis pathway will generate somatic cell lineages that contain different pigments that can be directly visualized, such as secondary metabolites of flavonoids, carotenoids, and betalains [7,8,9,10].
Previous researches have revealed that anthocyanins, one class of flavonoids, are the main pigments contributing to the display of flower coloration [11,12,13,14,15]. The anthocyanins are derived from a general phenylpropanoid metabolic pathway through a series of enzymatic reactions, and most enzymes involved have been identified in various plant species [16,17,18,19]. It is also demonstrated that the anthocyanin biosynthetic pathway is highly conserved and at least two types of well-explored genes participate in the process: structural and regulatory genes [18,19]. The structural genes, mainly including cinnamate-4-hydroxylase (C4H), 4-coumaric acid CoA ligase (4CL), chalcone synthase (CHS), chalconeisomerase (CHI), flavanone-3-hydroxylase (F3H), dihydroflavonolreductase (DFR), leucoanthocyanindioxygenase/anthocyanidin synthase (LDOX/ANS), and UDP-glucose: flavonoid-3-O-glucosyltransferase (UFGT), encode the enzymes that directly take part in the formation of anthocyanins [20,21,22,23,24,25,26]; and the regulatory genes encode transcription factors (TFs) of myeloblastosis (MYB), basic helix-loop-helix (bHLH), and WD40, which regulate the transcription of structural genes [16,27,28,29]. Other factors, such as transport proteins, plant hormones, and vascular pH, are also affecting the coloration for anthocyanins [30,31,32,33]. And recently, epigenetic modification has been introduced to reveal genetic variation in the regulation of the anthocyanins biosynthetic pathway [34,35,36,37].
DNA methylation, one of the best-studied epigenetic modifications, plays a key role in regulating eukaryotic growth and development processes involving gene expression regulation [38,39,40], genetic imprinting [41], tissue differentiation [42,43], transposon silencing [44], genomic stability maintenance and environmental adaptation [45,46,47], and so forth. The modification also leads to morphological abnormalities variation in plants, such as hypomethylated promoters of A1, DFR-B, and OgCHS genes driving brick-red pelargonidin pigmentation of flower petals of Oncidium [35], and cytosine methylation enrichment in promoter regions of MYB10 and MdGST genes are closely associated with red- and green-skinned fruits of apple and pear cultivars [32,36,37,48,49,50,51]. Herein, we discuss the molecular mechanism for chimeric flower petals and gene expression of P. mume cv. ‘Fuban Tiaozhi’ (Figure 1a) by using transcriptome sequencing (RNA-seq) and single-base-resolution methylome detection, known as whole-genome bisulfate sequencing (WGBS, BS-seq). The result provides new genome wide evidences for understanding the epigenetic regulatory mechanism underling the flower chimeric trait.
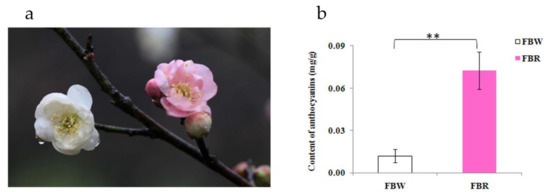
Figure 1.
Color characteristic and anthocyanins content in white (FBW) and red (FBR) petals of Japanese apricot cv. ‘Fuban Tiaozhi’ mei. (a) Samples of FBW (left) and FBR (right) were harvested from flowers that were beginning to bloom. (b) Anthocyanins contents (fresh weight) and significant difference (**, p = 0.002) between FBW and FBR. The x- and y-axes indicate samples and content, respectively.
2. Materials and Methods
2.1. Plant Materials
In the present study, both white petals (FBW) and red petals (FBR) were collected from one tree of ‘Fuban Tiaozhi’ mei, planted in Jiufeng Forest Farm of Beijing Forestry University, Haidian, Beijing, when the flowers were ready to bloom (Figure 1a). Then, the FBW, and FBR samples were frozen in liquid nitrogen immediately and stored at −80 °C.
2.2. Anthocyanin Determination
Part of each sample was finely ground, and 0.1 g powdered material was transferred to a calibration test tube (20 mL) containing 10 mL methanol with 1% HCl. The mixtures were vortexed for 1 min, and then the pigments were ultrasonically extracted by using a KQ 2200B ultrasonic cleaner (Kunshan, Jiangsu, China) at 4 °C for 15 min under dark condition. Then, the mixtures were centrifuged for 10 min at 12,000 rpm and 4 °C, and the supernatants were collected and stored at the refrigerator overnight at −20 °C. After filtration through 0.22 μm nylon membranes, the extracting solution was analyzed using a UV-visible spectrophotometer (UV-2450, Shimadzu Corporation, Tokyo, Japan). The anthocyanins concentrations were estimated according to the absorbance value and the coefficient of regression acquired by standard scale measurements [33]. The experiment was repeated biologically three times.
2.3. DNA Extraction and BS-Seq
Genomic DNA of FBW and FBR petals was extracted using a DNeasy Plant Mini kit (QiaGen, Shanghai, China), respectively. The degradation and contamination of the genomic DNA was monitored on 0.1% agarose gels, using a NanoPhotometer spectrophotometer (Implen, Calabasas, CA, USA) and a Qubit DNA Assay kit on a Qubit 2.0 fluorometer (Life Technologies, Carlsbad, CA, USA). Then, the DNA was mechanically fragmented in a Covaris S220 ultrasonicator, and the fragments were subjected to end reparation, adenylation, and methyl-treated adapter ligation. Next, the nonmethylated cytosines were transformed into uracil using an EZ DNA Methylation-Gold kit (Zymo Research). Utilizing the DNA fragments as templates, PCR amplification was carried out, and the products forming a sequencing library were quantified, and the insert size was assayed. The sequencing process was performed on the Hiseq 2500 (Illumina) platform to generate raw reads that were preprocessed with Trimmomatic v0.36 software and FastQC analysis [52]. Finally, the clean reads were obtained for subsequent analysis.
2.4. Sequence Mapping and Differentially Methylated Regions (DMRs) Detection
The clean reads were aligned to the reference genome of P. mume [53,54,55]. And the sequencing depth and coverage were estimated according to duplicates that aligned to a unique genomic region [54,55]. The non-conversion rate (r) of bisulfate treatment was defined as a rate of the number of sequenced cytosines at all cytosine reference positions divided by the number in the lambda genome. We also defined mC and C as numbers of methylcytosine and cytosine, respectively. Then, the methylation level was calculated by an equation described as ML(mC) = reads(mC)/(reads(mC) + reads(C)). Meanwhile, the parameter ML(mC) was corrected to ML(corrected) as ML(corrected) = (ML(mC) − r)/(1 − r) [56]. The mCG, mCHG, and mCHH contexts (methylcytosine occurs at CG, CHG, and CHH regions, respectively) and their densities, and distributions in each chromosome were analyzed using previous methods, respectively [39,45,57,58]. Between samples, the global methylation levels and distributions were also tested [42]. And DMRs and differentially methylated loci were identified by using a DSS software [59,60,61].
2.5. Functional Annotation of DMR-Related Genes
The GOseq R soft package was used for Gene Ontology (GO) enrichment analysis of DMR-related genes that were aligned with GO Ontology (p-value < 0.05) [62]. While the Kyoto Encyclopedia of Genes and Genomes (KEGG) analysis was used to explore pathways of DMR-associated genes [63]. We also used KOBAS software to test DMR-related genes’ statistical enrichment in the KEGG pathways [64].
2.6. RNA Isolation and Sequencing
The FBW and FBR materials were processed for RNA extraction using an RNeasy Plant Mini kit (QiaGen), respectively. RNA quality and quantity were determined using 1% agarose gels and a NanoPhotometer spectrophotometer (Implen, Calabasas, CA, USA), respectively. Also, an RNA Nano 6000 Assay kit of the Bioanalyzer 2100 system (Agilent, Carpinteria, CA, USA) was used to assess the RNA integrity. A total amount of 3 µg RNA was used as the input material for sequencing library construction. By using a NEBNext Ultra RNA Library Prep Kit for Illumina (NEB, Ipswich, MA, USA), first- and second-strand cDNA synthesis was generated, and the fragments were purified using an AgencourtAMPure XP system (Beckman Coulter, Brea, CA, USA). Then, the purified fragments were subjected to 3′-end adenylation and the addition of a poly-A tail and a NEBNext adapter. The libraries and 150–200 bp cDNA fragments were selected and assessed by the Bioanalyzer 2100 system. The libraries were sequenced on an IlluminaHiSeq system to generate 125-bp/150-bp paired-end reads (clean bases > 6 Gb).
2.7. Mapping and Differentially Expressed Genes (DEGs) Analysis
When we obtained the sequencing raw data, each sequenced read was processed through in-house perl scripts and subjected to quality control and low-quality removal processes in order to get the clean read that was mapped to the reference genome of P. mume using the HISAT2.0.4 software (http://ccb.jhu.edu/software/hisat2/index.shtml) [65]. Cufflinks v2.1.1 was then used to assemble and identify known and novel transcripts; and HTSeq v0.6.1 (−m union) (https://htseq.readthedocs.io/en/release_0.9.1/) was used to estimate gene expression levels [66]. DEGSeq v1.12.0 R software package (http://bioinfo.au.tsinghua.edu.cn/software/degseq/) was used for DEGs analysis on the basis of Poisson distribution (Kij ~ P(μij)) with a significant threshold p-value < 0.005 and |log2foldchang| > 1 [67]. Next, the significant DEGs were subjected to GO [62] and KEGG [64] annotation processes.
2.8. Methylation Modification of Gene Expression
In this section, we explore the relationship between cytosine methylation and gene expression level according to methylomes and transcriptomes. The correlation between methylation level and gene expression was progressively analyzed on the four steps below: firstly, we mapped the gene methylation level and gene expression densities onto each of the chromosomes of P. mume and investigated the methylation levels at different regions (promoter, gene-body region, 2 kb upstream and downstream regions, transcription start site, and transcription end site) that affected genes expression [47,55,68]; secondly, we identified DEGs (including promoters, and 2 kb upstream and downstream regions of gene-body) that modified with CG, CHG, and CHH methylation patterns according to the methods described by Ng et al. [69] and Zhou et al. [70]; thirdly, the expression levels for DMR-related genes (including CG, CHG, CHH patterns) were detected [71,72]; and at last, we identified the set of DMR-related genes that overlapped with DEGs that had been subjected to GO and KEGG enrichment.
3. Results
3.1. Content of Anthocyanins
As shown in Figure 1b, the anthocyanins content in white petals of ‘Fuban Tiaozhi’ mei (FBW; 0.012 ± 0.005 mg/g, fresh weight) was less than anthocyanins content in red petals of ‘Fuban Tiaozhi’ mei (FBR; 0.078 ± 0.013 mg/g, fresh weight). And it indicated that the anthocyanins were the main pigment observed directly by the eyes in petals of ‘Fuban Tiaozhi’ mei.
3.2. DNA Methylation Landscape in Japanese Apricot cv. ‘Fuban Tiaozhi’ Mei
In total, 12.48 and 12.40 Gb clean bases were produced within sequenced genomes of FBW and FBR, respectively. It was estimated that approximately 25 million clean reads (~59%) of each methylome could be mapped to the reference genome (Supplementary Table S1). It also revealed that the maximum coverage was displayed at a sequencing depth of approximately 25× to 30× of the reference genome (Figure 2a). Within methylomes of FBW and FBR, 12.88–13.36% of cytosine sites (C sites) were methylated, including three patterns revealed by mCG (35.43–35.61%), mCHG (19.25–19.26%), and mCHH (8.65–9.30%) contexts (Table 1). Meanwhile, it was shown that chromosome Pm3 was highly methylated (Figure 2b). Among the total mC sites, the relative proportions of mCG, mCHG, and mCHH contexts were 26.83–27.97%, 20.41–21.06%, and 50.86–52.74%, respectively (Figure 2c). Simultaneously, there existed a tendency toward mCG and mCHG contexts with high methylation levels (70–100%); however, mCHH context performed the opposite trend, with low methylation level (0–30%) taking up a large proportion (Figure 2d). As shown in Figure 3a,b, the DNA methylation (divided into mCG, mCHG, and mCHH contexts) density and level of ‘Fuban Tiaozhi’ mei within each chromosome were consistent with the distribution of low-gene-density areas.
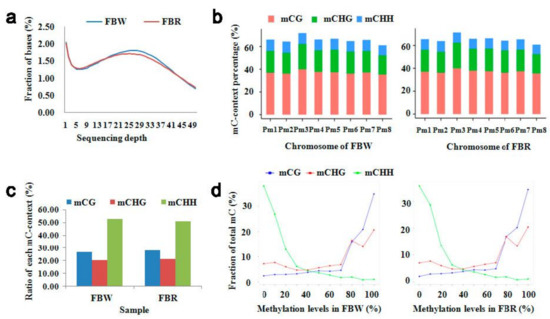
Figure 2.
Detection of sequencing coverage depth and DNA methylation levels of white (FBW) and red (FBR) petals of Japanese apricot cv. ‘Fuban Tiaozhi’ mei. (a) Distribution of genome coverage depth. The x- and y-axes indicate sequencing depth, and the ratio of the corresponding nucleotide sites at the sequencing depth to the whole genome, respectively. (b) The percentage of methylated C context (mC context) to total number of each type of C context within chromosomes of the FBW (left) and FBR (right) samples. The x- and y-axes indicate chromosome and mC context percentage, respectively. (c) The percentage of each type of the mC context to the total mC sites. The x- and y-axes indicate petal tissue samples and percentage, respectively. (d) Distribution of mC context level of each sequenced sample (FBW, left; FBR, right). The x-axis indicates DNA methylation level. The y-axis indicates the fraction of total mC sites calculated within bins of 10%.

Table 1.
DNA methylation levels of C context in whole genome of the two samples.
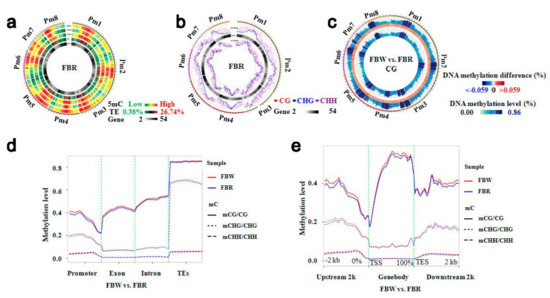
Figure 3.
Distribution of DNA methylation density and level within chromosomes of white (FBW) and red (FBR) petals of Japanese apricot cv. ‘Fuban Tiaozhi’ mei, and analysis on their differential DNA methylation level. (a) Circos plots of DNA methylation density within chromosomes of FBR. The track order (from outside to inside) is as follows: (1–3) DNA methylation density by sequence contexts (mCG, mCHG, and mCHH, respectively); (4) transposable element (TE) density; (5) gene density; (b) Distribution of DNA methylation level within chromosomes of FBR. The track order (from outside to inside) is as follows: (1) methylation level; (2) heat map of gene density; (3) density of mC context; (c) Heat maps of differential mCG context DNA methylation levels between the two samples. The track order (from outside to inside) is as follows: methylation level of FBW, heat map of difference significant of methylation level, and methylation level of FBR; (d) The difference of DNA methylation level distribution within gene functional regions. The x- and y-axes indicate gene functional domains and DNA methylation levels, respectively; (e) The difference of DNA methylation level distribution within gene-body, and its 2 kb up- and down-stream regions (TSS, transcriptional start site; TES, transcriptional end site). The x- and y-axes indicate gene functional domains and DNA methylation levels, respectively.
3.3. Difference in DNA Methylation Level between the Two Methylomes
The status and level can vary among different genomes, although the distributions of DNA methylation density and level showed similarly tendencies within corresponding chromosomes of FBW and FBR. We first calculated that the methylation levels of CG (2.43–86.26%), CHG (1.42–60.32%), and CHH (0.48–4.81%) sites within genome of FBW were different from methylation levels of CG (1.95–86.21%), CHG (1.15–59.57%), and CHH (0.39–4.46%) sites within genome of FBR. Additionally, variation in the majority of mCG, mCHG, and mCHH contexts with strongly methylated regions occurred similarly at paired chromosomal positions (Figure 3c). Then, we analyzed that gene functional regions were differentially methylated and TEs domains presented high methylation levels. The mCHG and mCHH levels showed low methylation levels within exon and intron domains; however, CG sites were highly methylated within exon and intron regions. In the promoter region, mCG and mCHG displayed a declining trend (Figure 3d). The mCG context displayed an upward tendency within gene-body domains compared with 2 kb up- and down-streams within transcribed regions, but mCHG and mCHH contexts showed the opposite trend (Figure 3e). In general, the methylation levels were higher within methylome of FBW (Figure 3d,e).
3.4. DMR-Related Genes Participate in Color Regulation Pathway
We detected 4,618 DMRs within the two methylomes in order to find DMR-related genes that take part in flower color regulation. The CG-DMRs were methylated with levels between 1.59% and 97.92%, and averaged at 49.49% and 48.22% within FBW and FBR samples, respectively. CHG-DMRs were averaged at 39.31% and 39.13% within genomes of FBW and FBR, respectively. DNA methylation levels of both of CG- and CHG-DMRs were well-distributed approximately. However, the majority of CHH-DMRs were distributed with low methylation levels (Figure 4a). Heat maps and circos plots (Figure 4b,c) showed wide variations between methylomes of FBW and FBR, respectively. Simultaneously, we annotated the DMRs within gene functional regions that presented the minority of DMRs were distributed in the TSS (transcriptional start site) and TES (transcriptional end site) areas. For the CG-DMRs, the hypermethylated ones were less than the hypomethylated (FBW vs. FBR) ones within promoter and exon domains; while the hypermethylated CHG-DMRs were larger than the hypomethylated CHG-DMRs. Obviously, the DMRs displayed more hypermethylated CHH contexts than that of hypomethylated ones all through the gene function regions (Figure 4d).
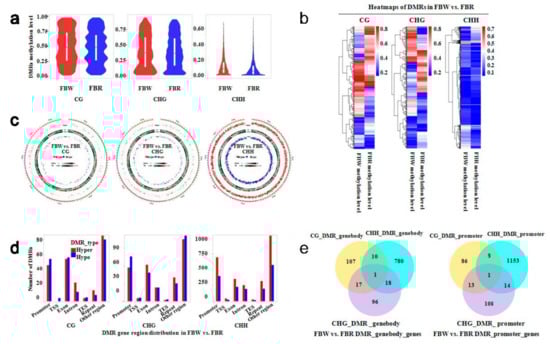
Figure 4.
DNA methylation level, distribution, and annotation of differentially methylated regions (DMRs) of white (FBW) and red (FBR) petals of Japanese apricot cv. ‘Fuban Tiaozhi’ mei. CG, CHG, and CHH indicate CG-, CHG-, and CHH-DMRs, respectively. (a) Violin box plot of DNA methylation level of CG- (left), CHG- (middle), and CHH- (right) DMRs, respectively; (b) Heat maps of DNA methylation levels of DMRs; (c) Circos plots of significance difference of CG- (left), CHG- (middle) and CHH- (right) DMRs on each chromosome of FBW and FBR. Track order (outside to inside) is as follows: scatter plot of significance level of hypermethylated DMRs (Hyper), transposable element density (TE), gene density (Gene), and scatter plot of significance level of hypomethylated DMRs (Hypo); (d) Distribution of CG- (left), CHG- (middle) and CHH-(right) DMRs within gene functional regions. TSS, transcriptional start site; TES, transcriptional end site; (e) Venn diagrams of predicted genes linked with CG-, CHG-, and CHH-DMRs. “DMR_genebody_genes” (left) and “DMR_promoter_genes” (right) indicate predicted genes anchored within gene-body and promoter regions, respectively.
Next, we revealed that 1,029 and 1,383 genes were associated with DMRs within the functional regions of gene-bodies and promoters, respectively. In detail, CG-, CHG-, and CHH-DMRs (hypermethylated, 618; hypomethylated, 433) anchored the gene-body domains of 135, 132, and 809 genes, respectively. And CG-, CHG-, and CHH-DMRs (hypermethylated, 867; hypomethylated, 540) anchored the promoters of 108, 136, and 1,176 genes, respectively (Figure 4e). These genes, with various biological functions (Figures S1 and S2), can play important roles in flower color regulation of FBW and FBR samples, revealed by ways of GO and KEGG enrichment (Figure 5, Figures S1 and S2). Remarkably, some crucial DMR-related genes were enriched in the pathways of phenylalanine, tyrosine, and tryptophan biosynthesis (ko pmum00400), phenylalanine metabolism (ko pmum00360), phenylpropanoid biosynthesis (ko pmum00940), flavonoid biosynthesis (ko pmum00941), and biosynthesis of secondary metabolites (ko pmum01110).
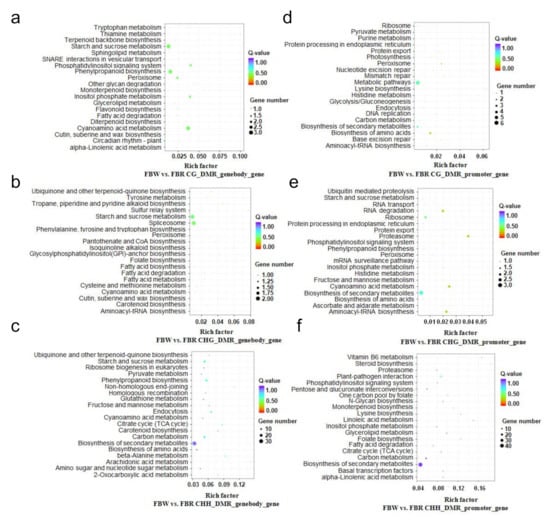
Figure 5.
Kyoto Encyclopedia of Genes and Genomes (KEGG) pathway enrichment of differentially methylated region (DMR)-related genes within white (FBW) and red (FBR) petals genomes of Japanese apricot cv. ‘Fuban Tiaozhi’ mei. KEGG pathway enrichment of DMR-related genes that were anchored within gene-body regions, CG_ (a), CHG_ (b), and CHH_ (c) DMR_genebody_genes refer to CG-, CHG-, and CHH-DMR-related genes anchored within gene-body domains, respectively; KEGG pathway enrichment of DMR-related genes that were anchored within promoter regions, CG_ (d), CHG_ (e), and CHH_ (f) DMR_promoter_genes refer to CG-, CHG-, and CHH-DMR-related genes anchored within promoter domains, respectively.
3.5. DEGs Predicted by Comparative Transcriptomics Analysis
On the basis of the RNA sequencing, 52.79 and 56.32 million clean reads were generated for FBW and FBR (Table 2), respectively. In transcriptome of FBW, 90.5%, 0.9%, and 8.6% of the clean reads were mapped to the exon, intron, and intergenic areas, respectively. In comparison, 88.3%, 1.2%, and 10.4% of the clean reads were annotated within exon, intron, and intergenic domains of FBR transcriptome (Figure 6a). The numbers of clean reads aligned to “+” and “−“ strands of the reference genome were approximately equal (Figure 6b, Table 2). It was calculated that the gene expression level of FBR was significant higher than the expression level of FBW genes (p = 0.027; Figure 6c). Selected by DEGseqv1.12.0 package, 1,212 DEGs (up-regulated, 704; down-regulated, 508) presenting differentially expressed patterns (Figure 6d,e) were detected from FBW vs. FBR. According to GO enrichment (p < 0.05), these up- and down-regulated genes were enriched into 162 and 133 GO terms, respectively (Supplementary Figure S3). We also used KEGG pathway analysis to reveal further biological functions of the DEGs, with those that presented 54 and 4 up-regulated DEGs taking part in biosynthesis of secondary metabolites (ko pmum01110) and ABC transporters (ko pmum02010) pathways, respectively. Interestingly, 4 and 38 down-regulated DEGs were found in flavonoid biosynthesis (ko pmum00941) and biosynthesis of secondary metabolites (ko pmum01110) pathways, respectively (Figure 7).
Table 2.
Statistics of transcriptome sequencing data and mapping to the reference genome of Prunus mume.
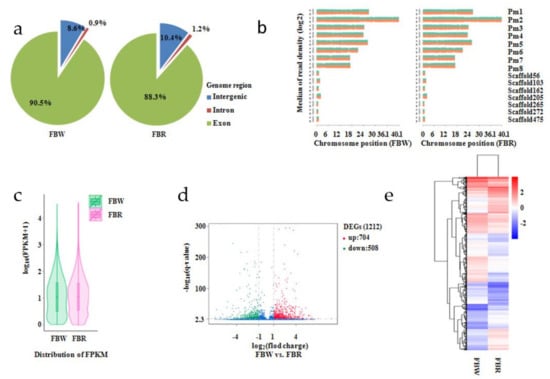
Figure 6.
Analysis on transcriptomes of white (FBW) and red (FBR) petals of Japanese apricot cv. ‘Fuban Tiaozhi’ mei. (a) Distribution of the clean reads aligned to the reference genome regions; (b) density distribution of the total mapped clean reads from each sample of FBW (left) and FBR (right). The x- and y-axes indicate chromosome position and clean reads density, respectively; (c) violin plots of gene expression level of the samples; (d) detection of differentially expressed genes (DEGs) within FBW vs. FBR. The x-axis represents the fold change variation of the expression of genes within FBW vs. FBR. The y-axisindicates the statistical significance; (e) clustering analysis on DEGs.
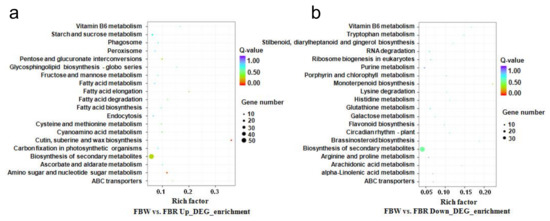
Figure 7.
Kyoto Encyclopedia of Genes and Genomes (KEGG) pathway enrichment of up-regulated (a) and down-regulated (b) differentially expressed genes (DEGs) between white (FBW) and red (FBR) petals. Up_DEG_enrichment and Down_DEG_enrichment indicate up-regulated and down-regulated DEGs, respectively.
3.6. Correlation Between DNA Methylation and Gene Expression Levels
In order to explore the relationship between gene expression and DNA methylation levels, the Pearson correlation test (2-tailed) was performed. It was found that the gene expression levels were positively correlated with DNA methylation levels (p < 0.001) in FBW (r = 0.062) and FBR (r = 0.099) genomes within gene-body regions. However, negative correlations between gene expression and DNA methylation levels (p < 0.001) of FBW (r = −0.137) and FBR (r = −0.118) were detected within promoter domains (Figure 8a). In the purpose of understanding the relationship between gene expression and mC contexts in detail within gene-body and its 2 kb up- and down-stream areas, we detected the distribution of the gene expression levels that divided into four groups (high level, medium level, low level, and none expressed). The cytosine sites were lacking DNA methylation at TSS and TES sites. In gene-body regions, the mCG/CG levels were increasing, and the none-expressed genes were methylated with low mCG/CG levels. However, the methylation levels of mCHG and mCHH contexts were decreased in gene-body domains of all of the none-expressed and expressed genes. Simultaneously, these none-expressed genes along with highly mCHG/CHG and mCHH/CHH methylated levels were presented. In the 2 kb up- or down-stream of the gene-body areas, high methylation levels were detected at CG and CHG sites of the none-expressed genes. Therefore, gene expression levels were positively correlated with mCG/CG levels, but they were negatively correlated with mCHG/CHG and mCHH/CHH levels. And within mCHG context, none-expressed genes always displayed highly methylated. We could also observe that the distributions of gene expression levels within mC contexts presented the similar tendencies of FBW vs. FBR (Figure 8b). On the other hand, we also detected the frequency distribution of genes with different methylation levels in gene-body and promoter areas classified into six groups that were projected into a coordinate system of gene expression level (x-coordinate) and frequency (y-coordinate). At low expression levels estimated as log2(FPKM + 1) <1, more genes lacked DNA methylation within gene-bodies, but more genes rich in DNA methylation within promoters were detected. However, when the threshold value setting was 2 < log2(FPKM+1) < 8, more and minority genes were highly methylated within gene-bodies and promoters, respectively (Figure 8c). Thus, it suggested that genes rich in mCG sites within gene-bodies and genes lacking methylation within promoters were highly expressed in whole genomes of FBW and FBR.
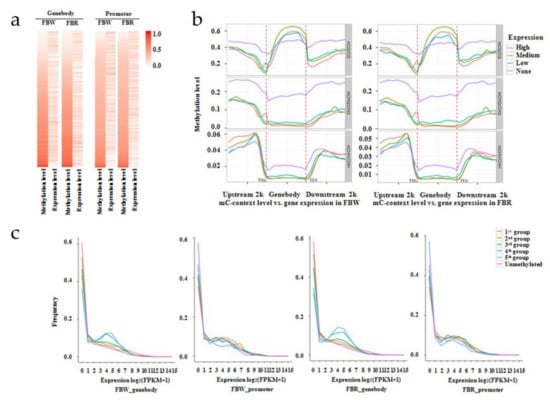
Figure 8.
Relationship between gene expressions and DNA methylation levels within genomes of white (FBW) and red (FBR) petals of Japanese apricot cv. ‘Fuban Tiaozhi’ mei. (a) Heat maps to display gene expression and DNA methylation level in whole genome of each sample. “Genebody” and “promoter” indicate that genes were anchored within gene-body (left) and promoter (right) regions by mC context, respectively; (b) distributions of methylation levels within gene-bodies and their 2 kb up- and down-stream regions. Gene expression levels were classified into four groups: none expression (purple; FPKM < 1); low expression (blue; 1 ≤ FPKM < FPKM_25%); medium expression (green; FPKM_25% ≤ FPKM < FPKM_75%); and high expression (red; FPKM ≥ FPKM_75%). FPKM stands for fragments per kilobase of exon per million fragments mapped, and FPKM_25% and FPKM_75% refer to values at the boundary of 25th and 75th percentiles of expression levels, respectively. Next, the different gene regions (gene-body and 2 kb up- and down-stream) were divided into 50 bins, and the methylation levels of each bin were averaged. The x- and y-axes represent gene-body regions and DNA methylation levels by mCG, mCHG, and mCHH contexts, respectively; TSS, transcription start site; TES, transcription end site; (c) Frequencies of expressed genes that anchored by mC sites within gene-body and promoter domains of each sample. DNA methylation levels were grouped into six sections: group 1 (red; 0 < methylation level < level_20%); group 2 (yellow-green; level_20% ≤ methylation level < level_40%); group 3 (green; level_40% ≤ methylation level < level_60%); group 4 (turquoise; level_60% ≤ methylation level < level_80%); group 5 (blue; methylation level ≥ level_80%), and unmethylated group (purple; methylation level = 0). Level_20%, _40%, _60%, and _80% represent values at the boundaries of 20th, 40th, 60th, and 80th percentiles of methylation levels. The x- and y-axes represent gene expression levels and gene frequencies, respectively.
3.7. DMR-Associated DEGs Took Part in Anthocyanin Formation
We also detected the methylation status of the DEGs, and it showed that the mCG, mCHG, and mCHH densities and mCG/CG, mCHG/CHG, and mCHH/CHH levels presented similar distribution tendencies. The decreasing mCG densities and mCG/CG levels within DEG’s promoters were the least among the three functional regions (p < 0.001) at CG sites; however, the densities and levels were the richest of DNA methylation (p < 0.001) at both the CHG and CHH site in promoter areas. Unexpectedly, information was obtained that the methylation densities and levels of DEGs between FBW and FBR were not significantly different; however, the down-regulated DEGs were higher methylated than up-regulated DEGs (p ≤ 0.010) within each functional region, except for the CG context within exon region (Figure 9a,b). It suggested that the expression of DEGs was affected by DNA methylation. We then detected the DMR-associated DEGs to investigate the patterns of the DEGs regulated by cytosine methylation.
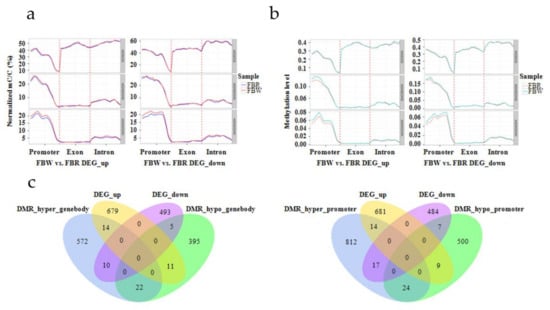
Figure 9.
The distribution of DNA methylation density and level of differentially expressed genes (DEGs), and detection of differentially methylated region (DMR)-associated DEGs within white (FBW) vs. red (FBR) petal genomes of Japanese apricot cv. ‘Fuban Tiaozhi’ mei. DEG_up and DEG_down indicate up-regulated and down-regulated genes of FBW vs. FBR, respectively. (a) Distribution of DNA methylation density of CG, CHG, and CHH sites within DEGs’ functional regions. The x- and y-axes indicate gene functional regions and menthylation density, respectively; (b) distribution of DNA methylation level of CG, CHG, and CHH sites within DEGs’ functional regions. The x- and y-axes indicate gene functional regions and menthylation level, respectively; (c) Venn plots of DMR-related DEGs. “DMR_hyper_genebody” and “DMR_hypo_genebody” represent DMRs were hypermethylated and hypomethylated within gene-body regions of DEGs of FBW vs. FBR (left), respectively. “DMR_hyper_promoter” and “DMR_hypo_promoter” represent DMRs were hypermethylated and hypomethylated within promoter regions of DEGs of FBW vs. FBR (right), respectively.
In total, 82 DMR-associated DEGs (44 up-regulated and 38 down-regulated, FBW vs. FBR) undergoing annotation were obtained, and 40 and 47 of them were anchored within gene-body and promoter domains by DMRs, respectively (Figure 9c). It was identified that 14 up-regulated and 10 down-regulated DEGs were hypermethylated, and 11 up-regulated and 5 down-regulated DEGs were hypomethylated within gene-bodies, respectively (Figure 9c, Supplementary Table S2). Similarly, 14 promoter hypermethylated and 9 promoter hypomethylated DMR-related genes were associated with up-regulated DEGs, as well as 17 and 7 down-regulated DEGs were performed hypermethylation and hypomethylation within promoters, respectively (Figure 9c, Supplementary Table S3). After functional annotation, we identified that 13 putative hyper- or hypomethylated DEGs at CHH sites within gene-bodies (Supplementary Table S2) and promoters (Supplementary Table S3) were playing critical roles in phenylalanine metabolism pathway (Pm009966, Pm011003, Pm011258, Pm017164, Pm019289, Pm020893, and Pm025210), glycosyltransferase activity (Pm000414, Pm001802, Pm004453, Pm020721, and Pm027780), and ABC transporter (Pm013365).
4. Discussion
Flower color is an important quality character for ornamental plants, and the uncommon color individuals are favored. Therefore, ‘Fuban Tiaozhi’ mei, an attractive cultivar, can produce one tree with both red and white petals and has been widely applied in landscape architecture. Recently, people considered that the chimeric color petals are induced by diverse anthocyanin contents and differentially expressed genes [9,10]. And cytosine methylation is also associated with the coloration of flower petal, fruit skin, and so forth, by regulating gene expression [34,35,36,37]. However, little is known about the epigenetic mechanism regulating flower color chimera of ‘Fuban Tiaozhi’ mei. The present research shed light on the relationship between methylcytosine and gene expression that takes part in the pathway of anthocyanins, the concentrations of which were significantly different between white and red petals.
Phenotype is determined by gene expression, and previous studies showed that structural and transcription factor genes control the plant coloration. Provably, anthocyanins start from the phenylpropanoid biosynthetic pathway when the phenylalanine ammonia lyase (PAL) catalyzes phenylalanine into cinnamic acid, and 4-coumaroyl CoA ligase (4CL) activates 4-coumaric acid into 4-coumaroyl-CoA [10,17]. Then, the flavonoids metabolites come around, and the branch pathway is regulated by a series of enzymes including CHS, CHI, F3H, and DFR [17,21,22,23,24]. ANS, involved downstream of the flavonoids-branched pathway, is one key enzyme to transform leucoanthocyanidin to colored anthocyanidin before the final glycosylation steps controlled by UFGT [10,25,26]. For instance, in Petunia hybrida with bicolored flowers, enhancement of CHS expression induces blue or red coloration, respectively, in blue–white or red–white sectors of variegated flowers [8,73]. By using RNA sequencing method, it has demonstrated that the different expression of CHS, CHI, F3H, DFR, LDOX, ANS, and/or UF3GT genes taking part in the anthocyanin biosynthetic pathway was responsible for purple flesh coloration in a Dioscoreaalata cultivar, bicolored petals in lily, and variegated petals in ‘Fuban Tiaozhi’ mei [10,74,75]. Meanwhile, the expression of regulatory genes MYB, bHLH, and WD40 were significantly correlated with anthocyanin content in black carrot taproot [19]. In our work, we also found putative genes including PmCHS, PmANS, and PmUFGT, and so forth showed obvious consistency with the changing pattern of anthocyanin. These up- and down-regulated DEGs take part in flavonoid biosynthesis (ko pmum00941) and biosynthesis of secondary metabolites (ko pmum01110). The evidence suggested a possible mechanism that genes within FBW and FBR petals were differently expressed, resulting in color chimera flowers of Japanese apricot.
According to previous research, the gene expression is also regulated by epigenetic modifications results in variations; and DNA methylation is one of the best-studied modifications and closely interwoven with the process of endogenous gene transcription [12]. By using the single-base resolution technique, we studied the landscape of the methylomes of ‘Fuban Tiaozhi’ mei. In general, the high methyl-cytosine density and level within each chromosome had adistribution consistent with that of low-gene-density areas. And mCG context played an upward tendency within gene-body domains, but mCHG and mCHH contexts showed the opposite trend. Similarly, Zhang et al. [76] described that body-methylated genes were constitutively expressed at a higher level, whereas promoter-methylated genes tend to be expressed in a tissue-specific manner. We also determined that methylcytosine levels were positively correlated with gene expression within gene-body regions, but negative correlations were detected within promoter domains. The result is consistent with the finding that genes methylated in transcribed regions are highly expressed and constitutively active in A. thaliana [76] and the fact that mCG methylation is often linked to increased gene expression [77,78,79].
Further than that, we investigated the relationship between methylcytosine and gene expression level, and DMR-related genes including DEGs within FBW vs. FBR. It was found that the methylation levels were higher within methylome of FBW containing a lower level of anthocyanin. And 4,618 DMRs were associated with 1,029 and 1,383 genes within the functional regions of gene-bodies and promoters, respectively. In total, 82 DMR-associated DEGs (44 up-regulated, 38 down-regulated) were detected and annotated, such as down-regulated genes PmBAHD (Pm011003) and PmCYP450 (Pm025210), and PmABC (Pm013365) were enriched in phenylalanine metabolism pathway and ABC transporter, respectively. Cytochrome P450, which the flavonoid 3′-hydroxylase (F3′H) and flavonoid 3′,5′-hydroxylase (F3′5′H) belong to, determining the hydroxylation pattern of the B-ring is considered to play a key role in flavonoid biosynthesis and anthocyanins compounds essentially [7,80,81,82,83]. ABC transporter was determined to take part in membrane transport of flavonoid [84,85] and anthocyanin pigment [86,87]. Our research suggested these genes could be regulated by methylcytosine modification, though little knowledge was explored. Previously, the demethylation of the 5′-upstream promoter region of OgCHS generated mosaic red anthocyanin in lip crests, sepals, and petals of yellow flowers of Oncidium ’Gower Ramsey’ [35]. And MYB, bHLH74 genes with demethylation are associated with the formation of red-skinned pears and apples by inhibiting anthocyanin synthesis [36,37,49]. Thus, the evidence suggested that DNA methylation levels regulated key genes participating in anthocyanins biosynthesis, leading to flower color chimera of ‘Fuban Tiaozhi’ mei.
5. Conclusions
In present work, we shed light on the regulatory mechanism for flower color chimera of ornamental tree Japanese apricot by using single-base resolution methylome detection (BS-seq) and transcriptome sequencing (RNA-seq) methods. In phenotype, the white and red petals from an individual tree resulted from the significant difference in anthocyanins accumulation. According to RNA-seq, we found DEGs taking part in flavonoid biosynthesis, secondary metabolites, and ABC transporters pathways. It was also revealed that the DEGs displayed various DNA methylation statuses, and down-regulated DEGs were higher methylated than up-regulated DEGs, in general. Furthermore, we detected DMR-related genes associated with DEGs, such as PmBAHD, PmCYP450, and PmABC, contributed to anthocyanins accumulation. The evidence suggested that genome DNA methylation associated with DEGs regulated bicolor flowers of ‘Fuban Tiaozhi’ mei. These findings will enhance our understanding of epigenetics in flower color regulation and be beneficial to molecular-assisted selection (MAS) for ornamental plants.
Supplementary Materials
Supplementary materials can be found at https://www.mdpi.com/1999-4907/11/1/90/s1. Figure S1: Gene Ontology (GO) functional enrichment of differentially methylated regions (DMRs)-related genes, methylated within gene-body domains, of white (FBW) vs. red (FBR) petals of Japanese apricot cv. ‘Fuban Tiaozhi’ mei. CG_DMR_genebody_gene, CHG_DMR_genebody_gene, and CHH_DMR_genebody_gene indicate that the CG-, CHG-, CHH-DMR-related genes were methylated within gene-body regions, respectively. Figure S2: Gene Ontology (GO) functional enrichment of differentially methylated region (DMRs)-related genes, methylated within promoter domains, of white (FBW) vs. red (FBR) petals of Japanese apricot cv. ‘Fuban Tiaozhi’ mei. CG_DMR_promoter_gene, CHG_DMR_promoter_gene, and CHH_DMR_promoter_gene indicate that the CG-, CHG-, CHH-DMR-related genes were methylated within promoter regions, respectively. Figure S3: Gene Ontology (GO) functional enrichment of differentially expressed genes (DEGs) from comparative genome analysis of white (FBW) vs. red (FBR) petals of Japanese apricot cv. ‘Fuban Tiaozhi’ mei. Up_DEG_gene (left) and Down_DEG_gene (right) indicate up- and down-regulated DEGs, respectively. Table S1: Statistics of BS-sequencing and mapping data for each sample. Table S2: Functional annotation of DMR-related-DEGs anchored within gene-body domains. Table S3: Functional annotation of DMR-related-DEGs anchored within promoter domains.
Sequencing Data
All of the BS-seq and RNA-seq data were submitted to NCBI (https://www.ncbi.nlm.nih.gov/) with an accession number PRJNA597717.
Author Contributions
K.M. conceived the conception and design of this study; L.J. performed the experiment and wrote the first draft of the manuscript; K.M. and M.Z. provided suggestions and revised the manuscript. All authors have read and agreed to the published version of the manuscript.
Funding
This study was funded by the program for Science and Technology of Beijing (No. Z181100002418006), the National Natural Science Foundation of China (No. 31501787), and Special Fund for Beijing Common Construction Project.
Acknowledgments
The authors thank Zhenyou Wang of Jiufeng Forest Farm of Beijing Forestry University, Beijing, China, for the assistance of plant materials collection.
Conflicts of Interest
The authors declare no conflict of interest.
References
- Zhang, Q.; Chen, W.; Sun, L.; Zhao, F.; Huang, B.; Yang, W.; Tao, Y.; Wang, J.; Yuan, Z.; Fan, G.; et al. The genome of Prunus mume. Nat. Commun. 2012, 3, 1318. [Google Scholar] [CrossRef]
- Chen, J. Chinese Mei Flowers; Hainan Publishing House: Haikou, China, 1996; Volume 1, pp. 12–58. (In Chinese) [Google Scholar]
- Marcotrigiano, M. Chimeras and variegation: Patterns of deceit. Hortscience 1997, 32, 773–784. [Google Scholar] [CrossRef]
- Stegemann, S.; Bock, R. Exchange of genetic material between cells in plant tissue grafts. Science 2009, 324, 649–651. [Google Scholar] [CrossRef]
- Frank, M.H.; Chitwood, D.H. Plant chimeras: The good, the bad, and the ‘Bizzaria’. Dev. Biol. 2016, 419, 41–53. [Google Scholar] [CrossRef]
- Filippis, I.; Lopez-Cobollo, R.; Abbott, J.; Butcher, S.; Bishop, G.J. Using a periclinal chimera to unravel layer-specific gene expression in plants. Plant J. 2013, 75, 1039–1049. [Google Scholar] [CrossRef]
- Suzuki, M.; Miyahara, T.; Tokumoto, H.; Hakamatsuka, T.; Goda, Y.; Ozeki, Y.; Nobuhiro Sasaki, N. Transposon-mediated mutation of CYP76AD3 affects betalain synthesis and produces variegated flowers in four o’clock (Mirabilis jalapa). J. Plant Physiol. 2014, 171, 1586–1590. [Google Scholar] [CrossRef]
- Wang, C.; Chin, Y.; Lin, C.; Chen, P.; To, K. Transforming the snapdragon aurone biosynthetic genes into petunia alters coloration patterns in transgenic flowers. Adv. Biosci. Biotechnol. 2015, 6, 702–722. [Google Scholar] [CrossRef]
- Zhou, H.; Lin-Wang, K.; Wang, H.; Gu, C.; Dare, A.P.; Epley, R.V.; He, H.; Allan, A.C.; Han, Y. Molecular genetics of blood-fleshed peach reveals activation of anthocyanin biosynthesis by NAC transcription factors. Plant J. 2015, 82, 105–121. [Google Scholar] [CrossRef]
- Wu, X.; Gong, Q.; Ni, X.; Zhou, Y.; Gao, Z. UFGT: The key enzyme associated with the petals variegation in Japanese apricot. Front. Plant Sci. 2017, 8, 108. [Google Scholar] [CrossRef]
- Kroon, J.; Souer, E.; De Graaff, A.; Xue, Y.; Mol, J.; Koes, R. Cloning and structural analysis of the anthocyanin pigmentation locus Rt of Petunia hybrida: Characterization of insertion sequences in two mutant alleles. Plant J. 1994, 5, 69–80. [Google Scholar] [CrossRef]
- Ronchi, A.; Petroni, K.; Tonelli, C. The reduced expression of endogenous duplications (REED) in the maize R gene family is mediated by DNA methylation. EMBO J. 1995, 14, 5318–5328. [Google Scholar] [CrossRef]
- Fujiwara, H.; Tanaka, Y.; Fukui, Y.; Nakao, M.; Ashikari, T.; Kusumi, T. Anthocyanin 5-aromatic acyltransferase from Gentianatriflora: Purification, characterization and its role in anthocyanin biosynthesis. Eur. J. Biochem. 1997, 249, 45–51. [Google Scholar] [CrossRef]
- Yoshida, K.; Toyama, Y.; Kameda, K.; Kondo, T. Contribution of each caffeoyl residue of the pigment molecule of gentiodelphin to blue color development. Phytochemistry 2000, 54, 85–92. [Google Scholar] [CrossRef]
- Yabuya, T.; Yamaguchi, M.; Fukui, Y.; Katoh, K.; Imayama, T.; Ino, I. Characterization of anthocyanin p-coumaroyltransferase in flowers of Iris ensata. Plant Sci. 2001, 160, 499–503. [Google Scholar] [CrossRef]
- Albert, N.W.; Davies, K.M.; Lewis, D.H.; Zhang, H.; Montefiori, M.; Brendolise, C.; Boase, M.R.; Ngo, H.; Jameson, P.E.; Schwinn, K.E. A conserved network of transcriptional activators and repressors regulates anthocyanin pigmentation in eudicots. Plant Cell 2014, 26, 962–980. [Google Scholar] [CrossRef]
- Li, H.; Liu, J.; Pei, T.; Bai, Z.; Han, R.; Liang, Z. Overexpression of smANS enhances anthocyanin accumulation and alters phenolic acids content in Salvia miltiorrhiza and Salvia miltiorrhiza Bge f. alba plantlets. Int. J. Mol. Sci. 2019, 20, 2225. [Google Scholar] [CrossRef]
- Bruce, W.; Folkerts, O.; Garnaat, C.W.; Crasta, O.; Roth, B.; Bowen, B. Expression profiling of the maize flavonoid pathway genes controlled by estradiol-inducible transcription factors CRC and P. Plant Cell 2000, 12, 65–80. [Google Scholar] [CrossRef]
- Kodama, M.; Brinchpedersen, H.; Sharma, S.; Holme, I.B.; Joernsgaard, B.; Dzhanfezova, T.; Amby, D.B.; Vieira, F.G.; Liu, S.; Gilbert, M.T. Identification of transcription factor genes involved in anthocyanin biosynthesis in carrot (Daucuscarota L.) using RNA-seq. BMC Genom. 2018, 19, 811. [Google Scholar] [CrossRef]
- Holton, T.A.; Cornish, E.C. Genetics and biochemistry of anthocyanin biosynthesis. Plant Cell 1995, 7, 1071–1083. [Google Scholar] [CrossRef]
- Tanaka, Y.; Sasaki, N.; Ohmiya, A. Biosynthesis of plant pigments: Anthocyanins, betalains and carotenoids. Plant J. 2008, 54, 733–749. [Google Scholar] [CrossRef]
- Tanaka, Y.; Brugliera, F.; Chandler, S. Recent progress of flower colour modification by biotechnology. Int. J. Mol. Sci. 2009, 10, 5350–5369. [Google Scholar] [CrossRef]
- Tanaka, Y.; Brugliera, F.; Kalc, G.; Senior, M.; Dyson, B.; Nakamura, N.; Katsumoto, Y.; Chandler, S. Flower color modification by engineering of the flavonoid biosynthetic pathway: Practical perspectives. Biosci. Biotechnol. Biochem. 2010, 74, 1760–1769. [Google Scholar] [CrossRef]
- Chen, S.; Li, C.; Zhu, X.; Deng, Y.; Sun, W.; Wang, L.; Chen, F.; Zhang, Z. The identification of flavonoids and the expression of genes of anthocyanin biosynthesis in the chrysanthemum flowers. Biol. Plant. 2012, 56, 458–464. [Google Scholar] [CrossRef]
- Zhao, Z.; Hu, G.; Hu, F.; Wang, H.; Yang, Z.; Lai, B. The UDP glucose: Flavonoid-3-O-glucosyltransferase (UFGT) gene regulates anthocyanin biosynthesis in litchi (Litchi chinesis Sonn.) during fruit coloration. Mol. Biol. Rep. 2012, 39, 6409–6415. [Google Scholar] [CrossRef]
- Zhao, Q.; He, F.; Reeves, M.J.; Pan, Q.; Duan, C.; Wang, J. Expression of structural genes related to anthocyanin biosynthesis of Vitis amurensis. J. For. Res. 2016, 27, 647–657. [Google Scholar] [CrossRef]
- Spelt, C.; Quattrocchio, F.; Mol, J.N.; Koes, R. Anthocyanin1 of petunia encodes a basic helix-loop-helix protein that directly activates transcription of structural anthocyanin genes. Plant Cell 2000, 12, 1619–1631. [Google Scholar] [CrossRef]
- Qi, T.; Song, S.; Ren, Q.; Wu, D.; Huang, H.; Chen, Y.; Fan, M.; Peng, W.; Ren, C.; Xie, D. The Jasmonate-ZIM-Domain proteins interact with the WD-Repeat/bHLH/MYB complexes to regulate jasmonate-mediated anthocyanin accumulation and trichome initiation in Arabidopsis thaliana. Plant Cell 2011, 23, 1795–1814. [Google Scholar] [CrossRef]
- Han, Y.; Yu, J.; Zhao, T.; Cheng, T.; Wang, J.; Yang, W.; Pan, H.; Zhang, Q. Dissecting the genome-wide evolution and function of R2R3-MYB transcription factor family in Rosa chinensis. Genes 2019, 10, 823. [Google Scholar] [CrossRef]
- Yamaguchi, T.; Fukada-Tanaka, S.; Inagaki, Y.; Saito, N.; Yonekura-Sakakibara, K.; Tanaka, Y.; Kusumi, T.; Iida, S. Genes en-coding the vacuolar Na+/H+exchanger and flower coloration. Plant Cell Physiol. 2001, 42, 451–461. [Google Scholar] [CrossRef]
- Jaakola, L. New insights into the regulation of anthocyanin biosynthesis in fruits. Trends Plant Sci. 2013, 18, 477–483. [Google Scholar] [CrossRef]
- Cheng, J.; Liao, L.; Zhou, H.; Gu, C.; Wang, L.; Han, Y. A small indel mutation in an anthocyanin transporter causes variegated colouration of peach flowers. J. Exp. Bot. 2015, 66, 7227–7239. [Google Scholar] [CrossRef]
- Li, W.; Mao, J.; Yang, S.; Guo, Z.; Ma, Z.; Dawuda, M.; Zuo, C.; Chu, M.; Hong, B. Anthocyanin accumulation correlates with hormones in the fruit skin of ‘Red Delicious’ and its four generation bud sport mutants. BMC Plant Biol. 2018, 18, 363. [Google Scholar] [CrossRef]
- Iida, S.; Morita, Y.; Choi, J.; Park, K.; Hoshino, A. Genetics and epigenetics in flower pigmentation associated with transposable elements in morning glories. Adv. Biophys. 2004, 38, 141–159. [Google Scholar] [CrossRef]
- Liu, X.; Chuang, Y.; Chiou, C.; Chin, D.; Shen, F.; Yeh, K. Methylation effect on chalcone synthase gene expression determines anthocyanin pigmentation in floral tissues of two Oncidium orchid cultivars. Planta 2012, 236, 401–409. [Google Scholar] [CrossRef]
- Bai, S.; Tuan, P.; Saito, T.; Honda, C.; Hatsuyama, Y.; Ito, A.; Moriguchi, T. Epigenetic regulation of MdMYB1 is associated with paper bagging-induced red pigmentation of apples. Planta 2016, 244, 573–586. [Google Scholar] [CrossRef]
- Li, W.; Ning, G.; Mao, J.; Guo, Z.; Zhou, Q.; Chen, B. Whole-genome DNA methylation patterns and complex associations with gene expression associated with anthocyanin biosynthesis in apple fruit skin. Planta 2019, 250, 1833–1847. [Google Scholar] [CrossRef]
- Cubas, P.; Vincent, C.; Coen, E. An epigenetic mutation responsible for natural variation in floral symmetry. Nature 1999, 401, 157–161. [Google Scholar] [CrossRef]
- Zhong, S.; Fei, Z.; Chen, Y.; Zheng, Y.; Huang, M.; Vrebalov, J.; Mcquinn, R.; Gapper, N.E.; Liu, B.; Xiang, J.; et al. Single-base resolution methylomes of tomato fruit development reveal epigenome modifications associated with ripening. Nat. Biotechnol. 2013, 31, 154–159. [Google Scholar] [CrossRef]
- Bocchini, M.; Galla, G.; Pupilli, F. The vesicle trafficking regulator PN_SCD1 is demethylated and overexpressed in florets of apomictic Paspalum notatum genotypes. Sci. Rep. 2018, 8, 3030. [Google Scholar] [CrossRef]
- Jaenisch, R.; Bird, A. Epigenetic regulation of gene expression: How the genome integrates intrinsic and environmental signals. Nat. Genet. 2003, 33, 245–254. [Google Scholar] [CrossRef]
- Song, Q.; Lu, X.; Li, Q.; Chen, H.; Hu, X.; Ma, B.; Zhang, W.; Chen, S.; Zhang, J. Genome-wide analysis of DNA methylation in soybean. Mol. Plant 2013, 6, 1961–1974. [Google Scholar] [CrossRef]
- Bouyer, D.; Kramdi, A.; Kassam, M.; Heese, M.; Schnittger, A.; Roudier, F.; Colot, V. DNA methylation dynamics during early plant life. Genome Biol. 2017, 18, 179. [Google Scholar] [CrossRef]
- Rudenko, G.N.; Ono, A.; Walbot, V. Initiation of silencing of maize MuDR/Mu transposable elements. Plant J. 2003, 33, 1013–1025. [Google Scholar] [CrossRef]
- Chan, S.W.; Henderson, I.R.; Jacobsen, S.E. Gardening the genome: DNA methylation in Arabidopsis thaliana. Nat. Rev. Genet. 2005, 6, 351–360. [Google Scholar] [CrossRef]
- Bräutigam, K.; Vining, K.J.; Lafon-Placette, C.; Fossdal, C.G.; Mirouze, M.; Marcos, J.G.; Fluch, S.; Fraga, M.F.; Guevara, M.Á.; Abarca, D. Epigenetic regulation of adaptive responses of forest tree species to the environment. Ecol. Evol. 2013, 3, 399–415. [Google Scholar] [CrossRef]
- Xu, J.; Zhou, S.; Gong, X.; Song, Y.; Van Nocker, S.; Ma, F.; Guan, Q.; Guan, Q. Single-basemethylome analysis reveals dynamic epigenomic differences associated with water deficit in apple. Plant Biotechnol. J. 2018, 16, 672–687. [Google Scholar] [CrossRef]
- Telias, A.; Linwang, K.; Stevenson, D.E.; Cooney, J.M.; Hellens, R.P.; Allan, A.C.; Hoover, E.; Bradeen, J.M. Apple skin patterning is associated with differential expression of MYB10. BMC Plant Biol. 2011, 11, 93. [Google Scholar] [CrossRef]
- Wang, Z.; Meng, D.; Wang, A.; Li, T.; Jiang, S.; Cong, P.; Li, T. The methylation of the PcMYB10 promoter is associated with green-skinned sport in Max red bartlett pear. Plant Physiol. 2013, 162, 885–896. [Google Scholar] [CrossRef]
- Qian, M.; Sun, Y.; Allan, A.C.; Teng, Y.; Zhang, D. The red sport of ‘Zaosu’ pear and its red-striped pigmentation pattern are associated with demethylation of the PyMYB10 promoter. Phytochemistry 2014, 107, 16–23. [Google Scholar] [CrossRef]
- EI-Sharkawy, I.; Liang, D.; Xu, K. Transcriptome analysis of an apple (Malus × domestica) yellow fruit somatic mutation identifies a gene network module highly associated with anthocyanin and epigenetic regulation. J. Exp. Bot. 2015, 66, 7359–7376. [Google Scholar] [CrossRef]
- Meissner, A.; Mikkelsen, T.S.; Gu, H.; Wernig, M.; Hanna, J.; Sivachenko, A.; Zhang, X.; Bernstein, B.E.; Nusbaum, C.; Jaffe, D.B.; et al. Genome-scale DNA methylation maps of pluripotent and differentiated cells. Nature 2008, 454, 766–770. [Google Scholar] [CrossRef]
- Langmead, B.; Salzberg, S.L. Fast gapped-read alignment with Bowtie 2. Nat. Methods 2012, 9, 357–359. [Google Scholar] [CrossRef]
- Krueger, F.; Andrews, S. Bismark: A flexible aligner and methylation caller for Bisulfite-Seq applications. Bioinformatics 2011, 27, 1571–1572. [Google Scholar] [CrossRef]
- Wang, L.; Zhang, J.; Duan, J.; Gao, X.; Zhu, W.; Lu, X.; Yang, L.; Zhang, J.; Li, G.; Ci, W.; et al. Programming and inheritance of parental DNA methylomes in mammals. Cell 2014, 157, 979–991. [Google Scholar] [CrossRef]
- Lister, R.; Mukamel, E.A.; Nery, J.R.; Urich, M.A.; Puddifoot, C.A.; Johnson, N.D.; Lucero, J.; Huang, Y.; Dwork, A.J.; Schultz, M.D.; et al. Global epigenomic reconfiguration during mammalian brain development. Science 2013, 341, 1237905. [Google Scholar] [CrossRef]
- Krzywinski, M.; Schein, J.E.; Birol, I.; Connors, J.M.; Gascoyne, R.D.; Horsman, D.; Jones, S.J.M.; Marra, M.A. Circos: An information aesthetic for comparative genomics. Genome Res. 2009, 19, 1639–1645. [Google Scholar] [CrossRef]
- Lister, R.; Pelizzola, M.; Dowen, R.H.; Hawkins, R.D.; Hon, G.; Tontifilippini, J.; Nery, J.R.; Lee, L.K.; Ye, Z.; Ngo, Q.; et al. Human DNA methylomes at base resolution show widespread epigenomic differences. Nature 2009, 462, 315–322. [Google Scholar] [CrossRef]
- Feng, H.; Conneely, K.N.; Wu, H.A. Bayesian hierarchical model to detect differentially methylated loci from single nucleotide resolution sequencing data. Nucleic Acids Res. 2014, 42, e69. [Google Scholar] [CrossRef]
- Wu, H.; Xu, T.; Feng, H.; Chen, L.; Li, B.; Yao, B.; Qin, Z.; Jin, P.; Conneely, K.N. Detection of differentially methylated regions from whole-genome bisulfite sequencing data without replicates. Nucleic Acids Res. 2015, 43, e141. [Google Scholar] [CrossRef]
- Park, Y.; Wu, H. Differential methylation analysis for BS-seq data under general experimental design. Bioinformatics 2016, 32, 1446–1453. [Google Scholar] [CrossRef]
- Young, M.D.; Wakefield, M.J.; Smyth, G.K.; Oshlack, A. Gene ontology analysis for RNA-seq: Accounting for selection bias. Genome Biol. 2010, 11, 1–12. [Google Scholar] [CrossRef] [PubMed]
- Kanehisa, M.; Araki, M.; Goto, S.; Hattori, M.; Hirakawa, M.; Itoh, M.; Katayama, T.; Kawashima, S.; Okuda, S.; Tokimatsu, T.; et al. KEGG for linking genomes to life and the environment. Nucleic Acids Res. 2007, 36, 480–484. [Google Scholar] [CrossRef] [PubMed]
- Mao, X.; Cai, T.; Olyarchuk, J.G.; Wei, L. Automated genome annotation and pathway identification using the KEGG Orthology (KO) as a controlled vocabulary. Bioinformatics 2005, 21, 3787–3793. [Google Scholar] [CrossRef]
- Kim, D.; Langmead, B.; Salzberg, S.L. HISAT: A fast spliced aligner with low memory requirements. Nat. Methods 2015, 12, 357–360. [Google Scholar] [CrossRef] [PubMed]
- Trapnell, C.; Williams, B.A.; Pertea, G.; Mortazavi, A.; Kwan, G.; Van Baren, M.J.; Salzberg, S.L.; Wold, B.J.; Pachter, L. Transcript assembly and quantification by RNA-seq reveals unannotated transcripts and isoform switching during cell differentiation. Nat. Biotechnol. 2010, 28, 511–515. [Google Scholar] [CrossRef] [PubMed]
- Wang, L.; Feng, Z.; Wang, X.; Wang, X.W.; Zhang, X. DEGseq: An R package for identifying differentially expressed genes from RNA-seq data. Bioinformatics 2010, 26, 136–138. [Google Scholar] [CrossRef]
- Wang, M.; Yuan, D.; Tu, L.; Gao, W.; He, Y.; Hu, H.; Wang, P.; Liu, N.; Lindsey, K.; Zhang, X. Long noncoding RNAs and their proposed functions in fibre development of cotton (Gossypium spp.). N. Phytol. 2015, 207, 1181–1197. [Google Scholar] [CrossRef]
- Ng, C.W.; Yildirim, F.; Yap, Y.S.; Dalin, S.; Matthews, B.J.; Velez, P.J.; Labadorf, A.; Housman, D.E.; Fraenkel, E. Extensive changes in DNA methylation are associated with expression of mutant huntingtin. Proc. Natl. Acad. Sci. USA 2013, 110, 2354–2359. [Google Scholar] [CrossRef]
- Zhou, H.; Zhang, F.; Ma, Z.; Huang, H.; Jiang, L.; Cai, T.; Zhu, J.; Zhang, C.; He, X. Folate polyglutamylation is involved in chromatin silencing by maintaining global DNA methylation and histone H3K9 dimethylation in Arabidopsis. Plant Cell 2013, 25, 2545–2559. [Google Scholar] [CrossRef]
- Yang, I.V.; Pedersen, B.S.; Rabinovich, E.I.; Hennessy, C.E.; Davidson, E.J.; Murphy, E.; Guardela, B.J.; Tedrow, J.; Zhang, Y.Z.; Singh, M.K.; et al. Relationship of DNA methylation and gene expression in idiopathic pulmonary fibrosis. Am. J. Respir. Crit. Care 2014, 190, 1263–1272. [Google Scholar] [CrossRef]
- Kretzmer, H.; Bernhart, S.H.; Wang, W.; Haake, A.; Weniger, M.A.; Bergmann, A.K.; Betts, M.J.; Carrillodesantapau, E.; Doose, G.; Gutwein, J.; et al. DNA methylome analysis in Burkitt and follicular lymphomas identifies differentially methylated regions linked to somatic mutation and transcriptional control. Nat. Genet. 2015, 47, 1316–1325. [Google Scholar] [CrossRef] [PubMed]
- Koseki, M.; Goto, K.; Masuta, C.; Kanazawa, A. The star-type color pattern in Petunia hybrida ’Red Star’ plowers is induced by sequence-specific degradation of Chalcone Synthase RNA. Plant Cell Physiol. 2005, 46, 1879–1883. [Google Scholar] [CrossRef] [PubMed]
- Wu, Z.; Jiang, W.; Mantri, N.; Bao, X.; Chen, S.; Tao, Z. Transciptome analysis reveals flavonoid biosynthesis regulation and simple sequence repeats in yam (Dioscorea alata L.) tubers. BMC Genom. 2015, 16, 346. [Google Scholar] [CrossRef] [PubMed]
- Suzuki, K.; Suzuki, T.; Nakatsuka, T.; Dohra, H.; Yamagishi, M.; Matsuyama, K.; Matsuura, H. RNA-seq-based evaluation of bicolor tepal pigmentation in Asiatic hybrid lilies (Lilium spp.). BMC Genom. 2016, 17, 611. [Google Scholar] [CrossRef] [PubMed]
- Zhang, X.; Yazaki, J.; Sundaresan, A.; Cokus, S.J.; Chan, S.W.L.; Chen, H.; Henderson, I.R.; Shinn, P.; Pellegrini, M.; Jacobsen, S. Genome-wide high-resolution mapping and functional analysis of DNA methylation in Arabidopsis. Cell 2006, 126, 1189–1201. [Google Scholar] [CrossRef] [PubMed]
- Kim, K.D.; Baidouri, M.E.; Abernathy, B.; Iwataotsubo, A.; Chavarro, C.; Gonzales, M.; Libault, M.; Grimwood, J.; Jackson, S.A. A comparative epigenomic analysis of polyploidy-derived genes in soybean and common bean. Plant Physiol. 2015, 168, 1433–1447. [Google Scholar] [CrossRef] [PubMed]
- Miura, A.; Nakamura, M.; Inagaki, S.; Kobayashi, A.; Saze, H.; Kakutani, T. An ArabidopsisjmjC domain protein protects transcribed genes from DNA methylation at CHG sites. EMBO J. 2009, 28, 1078–1086. [Google Scholar] [CrossRef]
- Wang, J.; Marowsky, N.C.; Fan, C. Divergence of gene body DNA methylation and evolution of plant duplicate genes. PLoS ONE 2014, 9, e110357. [Google Scholar] [CrossRef]
- Ueyama, Y.; Suzuki, K.I.; Fukuchi-Mizutani, M.; Fukui, Y.; Miyazaki, K.; Ohkawa, H.; Kusumi, T.; Tanaka, Y. Molecular and biochemical characterization of torenia flavonoid 3′-hydroxylase and flavone synthase II and modification of flower color by modulating expression of these genes. Plant Sci. 2002, 163, 253–263. [Google Scholar] [CrossRef]
- Martens, S.; Forkmann, G.; Britsch, L.; Wellmann, F.; Matern, U.; Lukacin, R. Divergent evolution of flavonoid 2-oxoglutarate-dependent dioxygenases in parsley. FEBS Lett. 2003, 544, 93–98. [Google Scholar] [CrossRef]
- Tanaka, Y. Flower color and cytochromes P450. Phytochem. Rev. 2006, 5, 283–291. [Google Scholar] [CrossRef]
- Tanaka, Y.; Brugliera, F. Flower colour and cytochromes P450. Philos. Trans. R. Soc. B Biol. Sci. 2013, 368, 20120432. [Google Scholar] [CrossRef] [PubMed]
- Sugiyama, A.; Shitan, N.; Yazaki, K. Involvement of a soybean ATP-Binding Cassette-type transporter in the secretion of genistein, a signal flavonoid in Legume-Rhizobium symbiosis. Plant Physiol. 2007, 144, 2000–2008. [Google Scholar] [CrossRef] [PubMed]
- Zhao, J.; Dixon, R.A. The “ins” and “outs” of flavonoid transport. Trends Plant Sci. 2012, 15, 72–80. [Google Scholar] [CrossRef] [PubMed]
- Marrs, K.A.; Alfenito, M.R.; Lloyd, A.M.; Walbot, V. A glutathione S-transferase involved in vacuolar transfer encoded by the maize gene Bronze-2. Nature 1995, 375, 397–400. [Google Scholar] [CrossRef] [PubMed]
- Goodman, C.D.; Casati, P.; Walbot, V. A multidrug resistance-associated protein involved in anthocyanin transport in Zea mays. Plant Cell 2004, 16, 1812–1826. [Google Scholar] [CrossRef] [PubMed]
© 2020 by the authors. Licensee MDPI, Basel, Switzerland. This article is an open access article distributed under the terms and conditions of the Creative Commons Attribution (CC BY) license (http://creativecommons.org/licenses/by/4.0/).