Abstract
We explored the relationship between tree growth, water use, and related hydraulic traits in Populus deltoides Bartr. ex Marsh.and hybrid clones, to examine potential trade-offs between growth and water use efficiency. Nine genotypes, six P. deltoides and three hybrid clones, that represented genotypes with high (Group H), intermediate (Group I), and low (Group L) growth performance were selected for study, based on year-two standing stem biomass in a replicated field trial. In year four, tree growth, transpiration (Et), canopy stomatal conductance (Gs), whole-tree hydraulic conductance (Gp), and carbon isotope discrimination (Δ13C) were measured. Tree sap flux was measured continuously using thermal dissipation probes. We hypothesized that Group H genotypes would have increased growth efficiency (GE), increased water use efficiency of production (WUEp, woody biomass growth/Et), lower Δ13C, and greater Gp than slower growing genotypes. Tree GE increased with relative growth rate (RGR), and mean GE in Group H was significantly greater than L, but not I. Tree WUEp ranged between 1.7 and 3.9 kg biomass m3 H2O−1, which increased with RGR. At similar levels of Et, WUEp was significantly greater in Group H (2.45 ± 0.20 kg m−3), compared to I (2.03 ± 0.18 kg m−3) or L (1.72 ± 0.23 kg m−3). Leaf and wood Δ13C scaled positively with stem biomass growth but was not correlated with WUEp. However, at a similar biomass increment, clones in Group H and I had significantly lower leaf Δ13C than Group L. Similarly, Group H clones had a significantly lower wood Δ13C than Group L, supporting our hypothesis of increased WUE in larger trees. Tree physiological and hydraulic traits partially explain differences in WUEp and Δ13C, and suggest that clone selection and management activities that increase tree biomass production will likely increase tree and stand WUE. However, more research is needed to discern the underlying hydraulic mechanisms responsible for the higher WUE exhibited by large trees and distinct clones.
1. Introduction
Poplar (Populus spp.) and their hybrids, grown as short-rotation woody crops (SRWC), have multiple industrial applications, that provide solid wood products, veneer, pulp and paper, excelsior, chemicals, and feedstocks, for cellulosic energy and the biofuels industry [1,2]. The productive and economic potential of short-rotation poplar are directly tied to their use of site resources (nutrients and water) and tolerance to changes in climate, such as multi-year droughts, increased vapor pressure deficits, tropical storms, and extended periods of heat or cold [3]. These systems will likely be located on marginal lands, unsuitable for agriculture; however, low site quality, combined with high establishment and maintenance costs, may limit profitability on these sites [4]. Due to rapid growth and high transpiration rates, short rotation poplars have high water use [5,6,7,8], and seasonal water deficits can strongly limit poplar productivity and yield [9,10,11]. Successful commercial production relies greatly on water availability [12,13] and selection of suitable genotypes for site conditions [14]. Potential tradeoffs between productivity and water use in short-rotation poplar are critical to understand, considering that management of these systems may need to account for multiple ecosystem services (e.g., biomass, water yield, waste management, carbon sequestration) [15,16].
An understanding of the physiological mechanisms that regulate tree growth and water use is important when predicting which poplar genotypes will maximize biomass production and water use efficiency. The plant hydraulic and carbon assimilation systems are intimately coordinated, such that carbon gain (photosynthesis) and growth are directly tied to the efficiency of the xylem to transport water [17,18] and high whole-plant hydraulic conductance (or low resistance) is thought necessary for high productivity in forest trees [19,20]. Water use efficiency (WUE), relates to the amount of water used to produce a unit of biomass, or a unit of fixed carbon, during photosynthesis. It is a key trait, linking the carbon and water cycles [3], and is a useful metric for studying the relationship between productivity, water use, and other ecosystem services [13,21]. Tree WUE can be assessed at different spatial and temporal scales using several different methods. Leaf-level WUE is often measured via gas exchange, as the ratio of photosynthesis (A) and stomatal conductance (gs), and reflects intrinsic WUE (iWUE = A/gs) [22]. Leaf (or wood) stable carbon isotope abundance (δ13C) or discrimination (Δ13C) can be used as a proxy for iWUE, as it reflects a long-term or time-integrated ratio of A/gs during the tissue development [23]. Tissue Δ13C has been used extensively to assess genetic variation in iWUE in poplars [13,24,25,26,27,28,29]. Whole-tree or stand water use efficiency can be defined in terms of growth, as biomass produced per unit time (day, month year), per unit water consumed or transpired, and is referred to as the WUE of production (WUEp; e.g., kg biomass m3 H2O−1) [22].
A robust relationship between WUE and tree growth would be useful for genotype selection and tree breeding [13,26,30]. Poplar spp. and their hybrids vary widely in growth and WUE [31], and utilize different structural and physiological adaptations to cope with limited water resources, particularly in areas prone to seasonal fluctuations in soil water availability [13,26,32,33,34]. For example, Shulte and Hinckley [35] found that P. deltoides was sensitive to drought, closing stomata with declining leaf water potential, in contrast to P. trichocarpa Torr. & A.Gray ex. Hook., which maintained high stomatal conductance at low leaf water potentials. The work of Braatne et al. [5] further showed that P. trichocarpa x deltoides F1 hybrids carried more leaf area, were more sensitive to soil moisture deficits, and had greater survival under drought than their parental genotypes. Others have also found different water use strategies among closely related poplar species [36,37], populations [25], and hybrid crosses [34] growing in the same environment. Generally, there is a strong positive relationship between growth and water use, wherein fast growth is associated with high water use [38]. However, the link between productivity and WUE is unclear [39] and often contradictory [40]. This variation may be the result of the approach used to measure WUE (i.e., iWUE, Δ13C, WUEp) and to the type of plant material under study (leaves, wood, or whole-tree) [28]. Because of the inherent link between A and gs, high iWUE is often associated with low transpiration and low productivity [41,42]. On the other hand, high productivity can result in increased WUE [39]. The work of Binkley et al. [43] proposed that resource use efficiency (water, light, or nutrients) is positively correlated with the magnitude of the resource used and that, as tree and stand growth increases, there is generally an increase in WUEp [44].Poplar genotypes that are efficient in balancing water use and carbon gain, based on physiological traits associated with growth and WUE, would be useful for cultivating poplar in areas with low or variable water availability [5,26,45]. A mechanistic understanding of the variation in water relations, and their relationship to growth among poplar clones and hybrids, would help managers choose appropriate genotypes for cultivation, and aid in deployment decisions.
In the southeastern United States, P. deltoides and their hybrids are promising SRWC [46]. Successful deployment requires that genotypes be properly matched to site conditions [47,48]. Furthermore, adapting Populus culture to marginal sites, e.g., upland sites with seasonal soil water deficits, is important, to expand poplar as a SRWC in the region [49]. Understanding the physiological mechanisms that regulate water use and growth is critical for predicting which poplar genotypes will maximize biomass production and WUE under variable environmental conditions. In this study, we explored the relationship between individual tree water use, WUEp, Δ13C, hydraulic architecture, and growth, in four-year-old clones of P. deltoides and hybrids (P. deltoides × P. maximowiczii A. Henry and P. trichocarpa × P. deltoides), to assess and quantify trade-offs between tree growth, WUE, and the hydraulic efficiency in transporting water. The clones varied widely in growth performance. We hypothesized that faster growing genotypes would have greater growth efficiency, greater WUEp, lower Δ13C, and greater whole-tree hydraulic conductance. We further examined relationships between physiological and hydraulic traits, to better understand the regulation of tree water use, WUEp, Δ13C, and limitations to tree growth.
2. Materials and Methods
2.1. Site Description
The study site was located at North Carolina State University’s Horticultural Field Laboratory (HLF) in Raleigh, NC (35.79°N, 78.70°W). Site elevation is 143 m. The climate is humid subtropical, with a mean annual temperature of 16 °C and precipitation of 1180 mm. The soil was a Cecil series (Fine, kaolinitic, thermic Typic Kanhapludults) with a gravely sandy loam surface (Natural Resource Conservation Service, https://websoilsurvey.nrcs.usda.gov/app/WebSoilSurvey.aspx). The site was prepared by shallow soil ripping to 20 cm and applying 18.3 mL per hectare of pre-emergent herbicide (Oust®). Planting took place in March 2014. In April 2015, triple superphosphate (TSP) (0–45–0) was added to the soil. Glyphosate was applied to reduce unwanted vegetation, and insecticide (Sevin®) was sprayed to control cottonwood leaf beetles in May and July 2015.
2.2. Experimental Design
The study site was part of a larger study, designed to determine the feasibility of Populus as a short-rotation woody crop for bioenergy production in the Southeastern United States [50] (The Integrated Biomass Supply System Partnership, Agriculture and Food Research Initiative Competitive Grant no. 2011-68005-30410 from the USDA National Institute of Food and Agriculture.). The larger study contained 52 clones (ArborGen Inc. Summerville, South Carolina, USA) from three species combinations, consisting of P. deltoides, P. trichocarpa, and P.s maximowiczii; 43 were from P. deltoides × P. deltoides (DD) crosses, six from P. trichocarpa × P. deltoides (TD), and three from P. deltoides × P. maximowiczii (DM). The study design was a randomized complete-block, with eight blocks and one ramet of each clone in a block. Non-rooted, 33–38 cm cuttings were planted at a spacing of 1.52 × 1.52 m (4,328 trees ha−1). A single border row of P. deltoides was planted around the perimeter of the site.
2.3. Clone Selection for Water Use Study
For this study, nine clones were selected from the original 52, in three or four of the eight blocks. In order to cover the range of productivity, clones were chosen based on mean stem biomass after the second growing season [51] and represented three productivity groups: high, Group H (>90th percentile, clones DM8019, TD185, DD116), intermediate, Group I (45–55th percentile, clones DD428, DD109, DD115), and low, Group L (<10th percentile, clones DD224, TD187, DD402) (Table 1). Thirty-two trees were measured, as this was the maximum number of sensors the sap flux measurement system would allow (Table 1). During the fourth growing season, tree sap flux density and growth were measured over a 146 day period between June 1 (DOY 152) and October 25 (DOY 298) 2015.

Table 1.
Tree biomass and canopy structural characteristics for nine Populus clones. Stem, foliage, and root biomass were estimated using stand specific allometric equations 1. Initial stem biomass is for DOY 152 and stem growth and relative growth rate (RGR) are biomass accumulation over the 146 day study period. Foliage, root biomass, SLA, tree leaf area (Al), sapwood area (As), Al:As, the ratio of Al to root biomass (Al:Root), and the hydraulic allometry index (AH) were estimated for tree diameter in late June. Growth efficiency (GE) is the ratio of stem growth and tree leaf area. Data are lsmeans (standard error). Genetic crosses are DD: P. deltoides × P. deltoides, DM: P. deltoides × P. maximowiczii, and TD: P. trichocarpa × P. deltoides. Cells with no shading, light shading, or dark shading, represent genotypes with high (H), intermediate (I), and low (L) growth potential, respectively.
2.4. Tree Sap Flow and Transpiration
Tree sap flow was measured continuously using a Dynamax FLGS-TDP XM 1000 Sap Flow Velocity System (Dynamax, Inc., Houston, TX, USA (the use of trade or firm names in this publication is for reader information and does not imply endorsement by the U.S. Department of Agriculture of any product or service)). One 30 mm thermal dissipation probe (TDP30; Dynamax, Inc., Houston, TX, USA) was installed, with needles five cm apart vertically in stem sapwood 30 cm above ground line, on the northern aspect of each tree. The top needle was a heat dissipation sensor powered by a constant 0.2 W of power. Probes were wrapped with Reflextex thermal insulation to reduce thermal gradients. Temperature data were collected every 30 s, and 15 min averages recorded using a (CR1000 data logger; Campbell Scientific, Inc., Logan, UT, USA), in conjunction with an AM 16/32 Multiplexer (Campbell Scientific, Inc., Logan, UT, USA). Sap flux density (Fd, g m−2 s−1) was empirically estimated, following Granier [52]. Additional measurements recorded by the data logger included photosynthetically active radiation (PAR, LI–190s, Licor, Lincoln, NE, USA), relative humidity (Vaisala HMP-60, Vantaa, Finland), air temperature, and soil volumetric water content in the top 30 cm (VWC, m3 m−3, CS–616 Campbell Scientific, Logan, UT, USA). Daily rainfall was recorded at a nearby weather station (Reedy Creek Field Laboratory, North Carolina State Climate Office). Vapor pressure deficit (D, kPa) was calculated from air temperature and air humidity following Jones [53]. Soil relative extractable water (REW, %) was calculated as: REW = (VWC−VWCmin)/(VWCmax−VWCmin), where VWCmin and VCWmax are the minimum and maximum values of VWC measured during the study.
Tree transpiration (Et,tree) was calculated as the product of sap flux density (Fd) and sapwood area (As), and expressed in L tree−1 or m3 H2O tree−1, depending on the interval of the measurement. In order to calculate As at the probe location, the diameter at DBH was taken every two weeks and related to diameter at the location of the probe, measured at the beginning and end of the study (4.57 + 1.12 × DBH; R2 = 0.95, n = 32). Sapwood area was linearly correlated with stem diameter (As = 4.886 − 0.011 × DBH + 0.007 × DBH2; R2 = 0.98, n = 6). We assumed uniform sap flux across the sapwood [54]. Other studies have found little or no reduction in sapwood conductivity or Fd with sapwood depth for small (<4.0 cm radius) P. deltoides trees [55,56]. Transpiration per unit leaf area (El, mmol m−2 leaf area s−1) was estimated as the product of Et,tree (kg tree−1) and ratio of sapwood area to leaf area (As:Al).
2.5. Canopy Stomatal Conductance and Specific Hydraulic Conductance
Canopy stomatal conductance (Gs, mmol m−2 leaf area s−1) was calculated from El and D as:
where λ is the latent heat of vaporization of water (2465 J g−1), γ is the psychrometric constant (65.5 Pa K−1), ρ is the density of air (1225 g m−3), cp is the specific heat of air (1.01 J g−1 K−1). Values were converted from m s−1 to mmol m−2 s−1, following Nobel [57]. We followed the approach of Oren et al. [58] to analyze the sensitivity of Gs to D. Hourly Gs were fitted to the model:
where Gref is reference Gs at D = 1 kPa and –dGs/dlnD is the slope or sensitivity to D. Hourly values of Gs under high light (PAR > 600 µmol m−2 s−1) [54] and D > 0.6 kPa were used to minimize error in Gs measurement at low D [59].
Gs = (λ × El × γ)/(ρ × cp × D)
Gs = Gref × –dGs/dlnD
Leaf water potential was measured with a pressure chamber (PMS Instrument Corp., Corvallis, OR) on leaves collected from the upper third of the canopy at predawn (Ψpd, before 0600 h) and at midday (Ψmd, 1200–1400 h). The difference between Ψpd and Ψmd (Ψdiff) was used as a proxy for the gradient in Ψ from soil to leaf. Whole-tree hydraulic conductance normalized to sapwood area (Gp, mol m−2 s−1 MPa−1) was calculated for each tree as the quotient of Fd and Ψdiff, corrected for the gravitational effects on Ψ with tree height [60,61,62].
2.6. Biometrics
Aboveground wood, foliage, and root biomass were determined from stand-specific allometric equations. Three to four trees of the same genotypes (35 trees) in the four remaining blocks were harvested in June 2016. Trees were cut 10 cm from the ground. Total height (m), diameter (cm) at 0.1 m and breast height (1.37 m, DBH), and crown length (m) were measured. Crowns were divided into thirds based on crown length. Coarse roots (>2 mm diameter) were measured in a subset of trees (n = 18). Roots were extracted using shovels, pruners, and a small excavator in a meter square area centered on the stem. Foliage, branches, stems, and roots were dried at 60 °C until at a constant dry weight. There were no significant clone effects on stem, foliage, or root allometry, thus general equations were developed for aboveground wood biomass (stem + branch): ln(wood biomass, kg) = 4.617 + 2.122 × ln(DBH) (n = 35, R2 = 0.92, MSE = 0.136, p < 0.001), foliage biomass: ln(foliage biomass, kg) = 3.847 + 1.706 × ln(DBH) (n = 35, R2 = 0.58, MSE = 0.309, p < 0.001), and root biomass: ln(root, kg) = 3.639 + 1.744 × ln(DBH) (n = 18, R2 = 0.74, MSE = 0.230, p < 0.001). Specific leaf area (SLA, cm2 g−1) was determined for two fully expanded leaves sampled from each crown third. The average SLA was used to estimate tree leaf area (Al, m2), Al:As, Al:Root, and the hydraulic allometry index (AH, As divided by the product of Al and stem height). Wood biomass growth was estimated as the difference between wood biomass at the beginning and end of the study. Relative growth rate (RGR, g g−1 day−1) was estimated as the increase in biomass per unit biomass already present per unit of time. Growth efficiency (GE) and water use efficiency of production (WUEp) were estimated as the ratio of wood biomass growth and tree leaf area (kg biomass m−2) and Et,tree (kg biomass m3 H2O), respectively. Leaf N concentration (mmol m−2) was determined with a Carlo-Erba analyzer (Model NA 1500, Fison instruments, Danvers, MA).
2.7. Isotope-Wood and Foliar δ13C
A long-term integrated estimate of WUE (iWUE) was made, based on leaf and wood carbon isotope composition. The relative abundance of wood and leaf 13C to 12C (δ13C) composition was measured on harvested trees in June 2016. Stem disks were collected at 1.37 m and foliage was sampled at mid-canopy. Tissue was dried at 60 °C for 72 h and ground. Ground samples were analyzed by the Duke Environmental Stable Isotope Laboratory (Nicholas School of the Environment, Division of Earth and Ocean Sciences, Durham, North Carolina, USA). Carbon isotope discrimination was calculated as Δ13C = (δ13Cair − δ13Cplant)/(1 + δ13Cplant), where δ13Cair = −8‰.
2.8. Statistical Analysis
Analysis of variance and covariance were used to analyze the effect of Clone or Group (H, I, L) (separate models) on stem biomass growth, GE, Et,tree, El, Gs, Gp, WUEp, and Δ13C. One tree (DD224), had a faulty sap flux probe and was dropped from analyses involving sap flux data. Time series measurements were analyzed by repeated measures ANOVA (PROC MIXED, SAS Inc., Cary, NC). A first-order autoregressive covariance structure (AR(1)) was selected based on AIC fit statistics. Block was considered a random factor and, depending on the model, Clone or Group, was a fixed factor. For response variables, treatments differences in LSMEANs were evaluated with Tukey’s test. Where appropriate, initial DBH or stem biomass was used as a covariate in the ANCOVA to compensate for differences in tree size on traits. Linear regression was used to examine the relationship between GE and WUEp and RGR and the sensitivity of Gs to D. Group or Taxon (DD, DM, TD) effects on the slope and intercept were examined using full and reduced models [63] and treatment effects were tested using contrasts and a Bonferroni corrected alpha level.
3. Results
3.1. Environmental Conditions
Mean daily temperature was 24.6 °C, with a maximum and minimum temperature of 36.9 °C and 6.5 °C, respectively (Figure 1). Temperatures over the 146 day study period (DOY 152–298) were relatively constant, until after DOY 260, when temperatures began to decrease. Mean daily D ranged from near 0 kpa to 1.8 kpa; however, maximum daily D often exceeded 3 kpa during the summer months (Figure 1b). Soil VWC averaged 0.27 m3 m−3 and ranged from 0.22 to 0.40 m3 m−3 (Figure 1c). Precipitation over the study period was 810 mm, and rainfall events exceeding 10 mm day−1 occurred every 7–14 days, except for a dry period between DOY 222 and 245, that received only 8 mm of rain (Figure 1c).
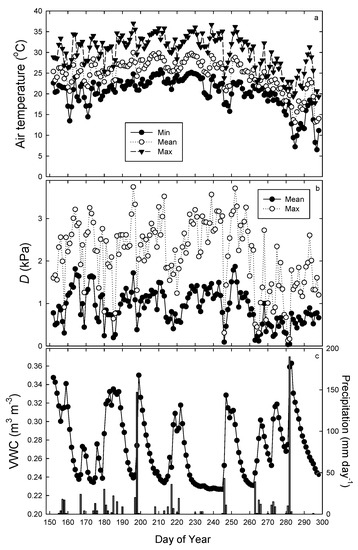
Figure 1.
Mean, minimum, and maximum daily air temperature (a), mean and maximum daily vapor pressure deficit (D, kPa) (b), and daily mean volumetric water content (VWC) and precipitation (c) during the study period.
3.2. Growth
Average DBH at the beginning of the study ranged from 4.5 to 7.8 cm (Table 1). Group H had significantly greater mean values for stem (4.32 ± 0.38 kg tree−1), foliage (1.30 ± 0.09 kg tree−1), and root biomass (1.18 ± 0.09) than Group I (stem: 2.94 ± 0.36; foliage: 0.95 ± 0.09; root: 0.85± 0.08 kg tree−1) and Group L (stem: 2.13 ± 0.45; foliage: 0.71 ± 0.10; root: 0.63 ± 0.10 kg tree−1). There were significant Clone and Group differences in structural traits. Group I had significantly lower SLA, Al:As, Al:Root than Group H or Group L, due to greater SLA of the TD hybrids in Groups H (TD185) and L (TD187). Stem biomass increment over the study period was greater in larger clones; however, there was no significant Clone or Group effect on the relative growth rate (RGR, g kg−1 day−1).
There were significant clone differences in growth efficiency (GE = stem biomass growth/tree leaf area). Averaged across Groups, Group H and I had higher GE, 0.090 ± 0.006 kg tree m−2 and 0.086 ± 0.006 kg tree m−2, respectively, than Group L (0.063 ± 0.007 kg tree m−2) (p = 0.031). Growth efficiency increased with RGR (Figure 2a). There was no significant Group x RGR interaction, although, at a similar RGR, TD clones had a significantly lower GE than the DM and DD clones.
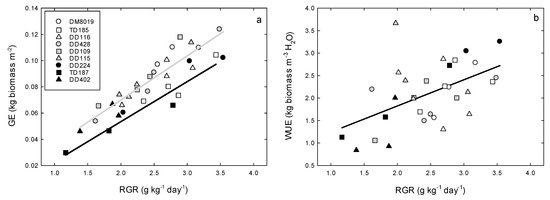
Figure 2.
Relationships between (a) stem growth efficiency (GE) and (b) water use efficiency of production (WUEp) and average relative growth rate (RGR) of biomass growth over the 146 day study period in P. deltoides (DD), P. trichocarpa x deltoides (TD), and P. deltoides x maximowiczii (DM) clones. Open, light shaded, and dark shade symbols represent high (Group H), intermediate (Group I), and low (Group L) productivity genotypes, respectively. In panel a, the grey line is the regression for DM and DD clones and the black is for TD clones.
3.3. Tree Water Use and WUEp
Daily Et,tree ranged from <1.0 to >20.0 L day−1 (Figure S1). Averaged over the study period, Group H had significantly greater Et,tree (6.00 ± 0.60 L day−1) than Group I (3.43 ± 0.60 L day−1) or Group L (2.57 ± 0.61 L day−1) (p < 0.001) (Figure 3). Total Et,tree over the study period was strongly correlated with stem biomass growth (Figure 4a), although there were no significant Group effects on this relationship. Tree WUEp, calculated by dividing stem biomass growth with total Et,tree, increased with RGR (Figure 2b). There were significant clone differences in WUEp (p = 0.031), however, there were no discernible patterns among Groups (p = 0.746) (Figure 4b). Clones with the highest (Clone DD224) and lowest (Clone DD402) WUEp were in Group L. Interestingly, WUEp was negatively correlated with total Et,tree (p = 0.003, Figure 5). While there was no significant Group effect on the slope of this relationship, Group H had a greater intercept than Group L (p = 0.032). Accounting for differences in Group Et,tree, WUEp was 2.45 ± 0.20, 2.03 ± 0.18, and 1.72 ± 0.23 kg m−3 H2O for Group H, I, and L, respectively.
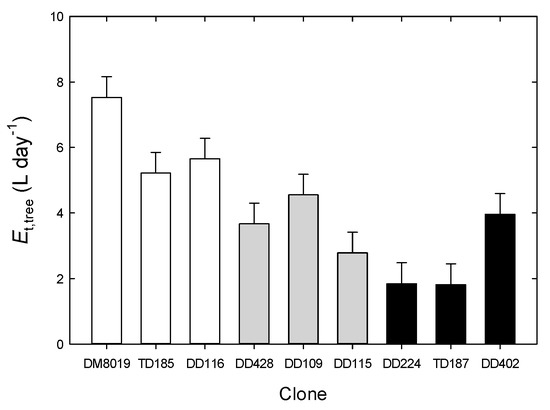
Figure 3.
Daily tree water use (Et,tree, L day−1) in P. deltoides (DD), P. trichocarpa × deltoides (TD), and P. deltoides × maximowiczii (DM) clones. Data are lsmeans and standard error. Open, light shaded, and dark shade bars represent high (Group H), intermediate (Group I), and low (Group L) productivity genotypes, respectively.
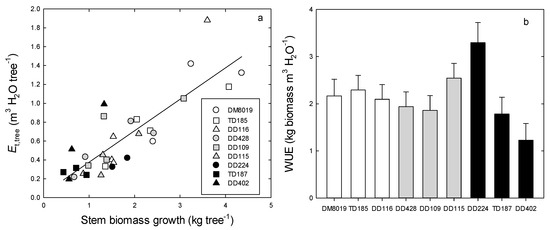
Figure 4.
Relationship between total tree water use (Et,tree, m3 H2O tree−1) and stem biomass growth (a) and the mean (lsmeans ± SE) water use efficiency of production (WUEp) (b) in P. deltoides (DD), P. trichocarpa x deltoides (TD), and P. deltoides x maximowiczii (DM) clones. Open, light shaded, and dark shade bars represent high (Group H), intermediate (Group I), and low (Group L) productivity genotypes, respectively.
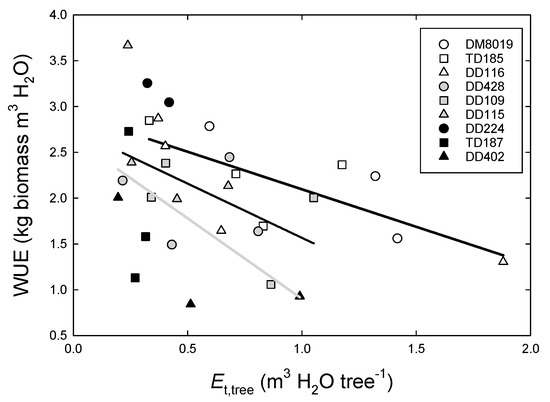
Figure 5.
Relationship between water use efficiency of production (WUEp) and total tree water use (Et,tree, m3 H2O tree−1) over the 146 day study period in P. deltoides (DD), P. trichocarpa × deltoides (TD), and P. deltoides × maximowiczii (DM) clones. Open, light shaded, and dark shaded symbols, and heavy black, light black, and grey lines represent high (Group H), intermediate (Group I), and low (Group L) productivity genotypes, respectively.
3.4. Canopy Stomatal Conductance and Hydraulic Conductance
Because canopy leaf senescence began in mid to late September and compromised allometric estimates of tree leaf area, canopy stomatal conductance (Gs) calculations were confined to the period between DOY 152 and 255, when tree canopies were still intact. Average daily Gs (PAR > 800 μmol m−2 s−1) varied with Clones (p < 0.001) and Groups (p < 0.001). Mean Gs was 29.01 ± 1.07 mmol m−2 s−1 in Group H (Figure S2a), compared to 27.12 ± 1.10 and 24.14 ± 1.09 mmol m−2 s−1 in Groups I and L, respectively (Figure S2b,c).
Canopy stomatal conductance decreased with REW (Figure 6). The relationship between relative Gs (relative Gs = Gs/Gs,max, where Gs,max is the maximum daily Gs measured during the study) and REW was best described using a three parameter logistic model: y = c/(1 + a × exp(-b × REW)), where y = relative Gs(%). There was no significant effect of Clone or Group on the individual parameters (c = 0.493, a = 4.754, and b = -18.7422; R2 = 0.54). In general, Gs was not responsive to soil moisture when REW > 0.30, but began to decline at values between 0.25 and 0.30, and was linear when REW < 0.20. However, the REW at the inflection point (Gs = c/2, REW = ln(a)/b), which describes the shape of the curve, was significantly higher in Group H (0.097) than in Group L (0.066) (p = 0.004), and marginally higher than Group I (0.078) (p = 0.058) (SE = 0.007), indicating that Gs began to decline at a higher REW in larger trees. In addition, the TD clones had a significantly higher REW at the inflection point (0.11) than the DD and DM (0.072) (SE = 0.019, p = 0.005) clones, indicating that the TD clones had greater sensitivity to declining REW (data not shown).
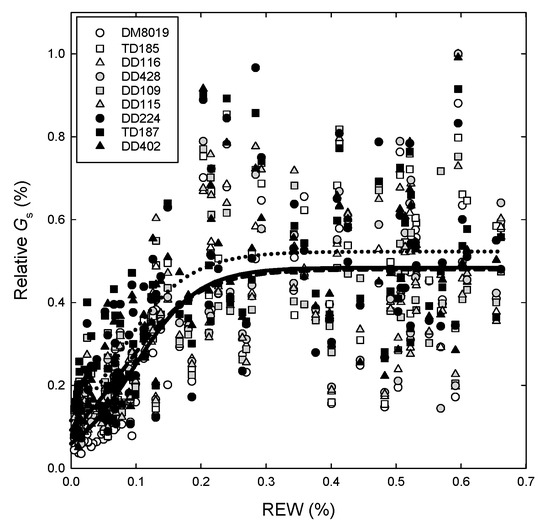
Figure 6.
The relationship between normalized canopy conductance (Gs,%), relative to maximum Gs, measured during a 102 day period (DOY 153–255), and relative extractable water (REW) in P. deltoides (DD), P. trichocarpa × deltoides (TD), and P. deltoides × maximowiczii (DM) clones. Open, light shaded, and dark shaded symbols represent high (Group H), intermediate (Group I), and low (Group L) productivity genotypes, respectively. Solid, dashed and dotted lines represent regression fits for the logistic model y = c/(1+a × exp(−b × REW) for Group H, I, and L, respectively.
Average daily Gs (PAR > 800) was partitioned into dry (REW < 0.20) and wet (REW > 0.30) periods, to examine the sensitivity of Gs to D (Equation (2)). The model was fit to each tree, where the sample size was 969 and 654 observations per tree, for dry and wet periods, respectively. Slopes were significant in all cases (p < 0.001) and R2 ranged from 0.25 to 0.79. Soil moisture had a strong effect on Gref (Gs at D = 1 kPa) and the response of Gs to D (–dGs/dlnD) (Table S1). Sensitivity to D increased under wet conditions. The relationship between –dGs/dlnD and Gref was examined to determine if Gs sensitivity to D varied with Gref. Averaged across Groups, there was a strong relationship between –dGs/dlnD and Gref (slope = 0.63, R2 = 0.96). However, regression lines differed significantly when growth classes were assessed separately (p = 0.004), Group L had a significantly lower slope (0.54) than Group H (0.66, p = 0.007) and Group I (0.64, p = 0.002) (Figure 7) indicative of a lower stomatal sensitivity to D in slower growing trees. In addition, the TD clones had a greater, although not significant, slope (0.70) than the DD and DM (0.62, p = 0.129), possibly indicating greater stomatal sensitivity to D (data not shown).
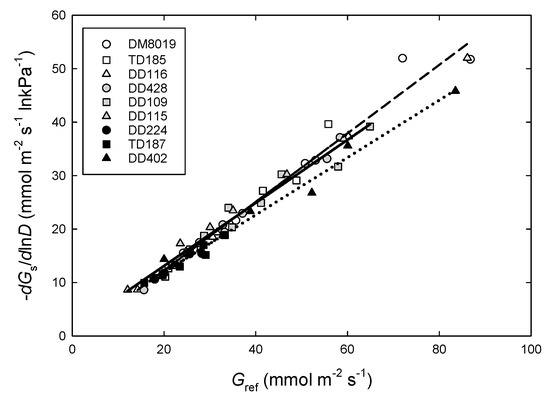
Figure 7.
Relationship between the sensitivity of canopy stomatal conductance (Gs) to vapor pressure deficit (D) (-dGs/dlnD) and Gs at D = 1 kPa (Gref) at high PAR (PAR > 800 μmol m−2 s−1) in P. deltoides (DD), P. trichocarpa × deltoides (TD), and P. deltoides × maximowiczii (DM) clones. Open symbols and dashed line, light shaded symbols and solid line, and dark shaded symbols and dotted line represent high (Group H), intermediate (Group I), and low (Group L) productivity genotypes, respectively.
Whole-tree sapwood-specific (Gp) hydraulic conductance was calculated for each tree on two days that differed in soil VWC. The first day (DOY 242) was near the end of a dry period, when soil VWC had been <0.25 m3 m−3 (REW < 0.14) for the previous 15 days, and the second day (DOY 251) was after several precipitation events increased VWC > 0.30 m3 m−3 (REW > 0.42) (Figure 1c). Mean predawn leaf water potential (Ψpd) was significantly lower on the dry day (−0.58 ± 0.04 MPa) than on the wet day (−0.29 ± 0.04 MPa), whereas midday leaf water potential (Ψmd) was lower on the wet day (−1.84 ± 0.13 MPa) than on the dry day (−1.52 ± 0.13 MPa). There were no significant Clone (p = 0.451, data not shown) or Group effects with REW for either Ψpd or Ψmd (Table 2), however, there was a tendency for Group L to have a lower Ψdiff (Ψdiff = Ψpd − Ψmd; 1.07 ± 0.16 MPa) than Group H (1.35 ± 0.15 MPa) or Group I (1.37 ± 0.15 MPa). Because of the lower Ψdiff, smaller trees had higher Gp (Table 2). Group L had significantly greater Gp (1.66 ± 0.22 mol m−2 s−1 MPa−1) than Group H (0.87 ± 0.19 mol m−2 s−1 MPa−1, p = 0.026) and I (0.97 ± 0.18 mol m−2 s−1 MPa−1, p = 0.052). Soil REW had no effect on Gp (i.e., no Day effect). Tree WUEp decreased with increasing Gp (Figure 8, y = 2.858 × e(−0.312X), R2 = 0.41, p = 0.001).
Table 2.
Tree leaf water potential (Ψ) and whole-plant hydraulic conductance (Gp), measured under wet (REW > 0.30) and dry (REW < 0.20) soil conditions. Leaf water potential was measured at predawn (Ψpd) and at midday (Ψmd) (Ψdiff = Ψpd − Ψmd). Data are lsmeans (SE) for clones within Group with high (H), intermediate (I), and low (L) growth potential. Probability values are for Group and Day, and interaction effects.
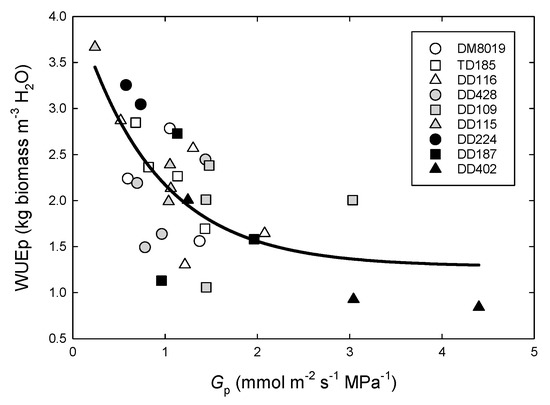
Figure 8.
Water use efficiency of production (WUEp) as a function of whole-tree hydraulic conductance (Gp) in P. deltoides (DD), P. trichocarpa x deltoides (TD), and P. deltoides x maximowiczii (DM) clones. Open symbols, light shaded symbols, and dark shaded symbols, represent high (Group H), intermediate (Group I), and low (Group L) productivity genotypes, respectively.
3.5. Stable Isotopes
There was a significant Clone and Group effect on leaf and wood Δ13C (Table 3). Group I had a significantly lower leaf Δ13C (21.16 ± 0.34) than Group H (22.10 ± 0.34, p = 0.045) and Group L (22.26 ± 0.34, p = 0.011). In contrast, Group H had a significant lower wood Δ13C (21.49 ± 0.18) than Group L (22.31 ± 0.18) (p = 0.003). Leaf Δ13C was positively correlated with stem biomass growth and the relationship was significantly different between Groups (Figure 9) (note that plot averages are used as biomass growth, and δ13C measurements were made on different trees). Group L had a more positive Δ13C than Group I or H at a similar level of stem biomass growth. A similar, but less robust, relationship was observed between wood Δ13C and stem growth (data not shown). Lower values of Δ13C are associated with greater iWUE. There was no significant correlation between leaf (p = 0.259) or wood (p = 0.320) Δ13C and WUEp (data not shown).
Table 3.
Lsmeans (SE) and probability values for foliar and wood Δ13C for nine Populus clones. Genetic crosses are DD: P. deltoides × P. deltoides, DM: P. deltoides × P. maximowiczii, and TD: P. trichocarpa × P. deltoides. Cells with no shading, light shading, or dark shading represent genotypes with high (H), intermediate (I), and low (L) growth potential, respectively.
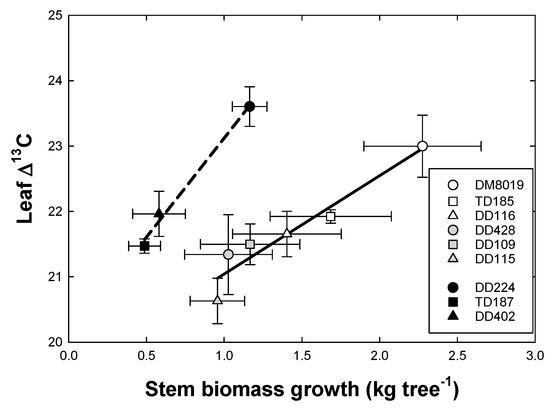
Figure 9.
Relationship between leaf carbon isotope discrimination (Δ13C) and water use efficiency of production (WUEp) and stem biomass growth in P. deltoides (DD), P. trichocarpa × deltoides (TD), and P. deltoides × maximowiczii (DM) clones. Open, light shaded, and dark shaded symbols represent high (Group H), intermediate (Group I), and low (Group L) productivity genotypes, respectively. Each point is the mean of three or four or trees.
4. Discussion
We found that growth efficiency (GE) and water use efficiency of production (WUEp) were positively correlated with growth. We further observed that, despite higher Et,tree, larger clones had greater GE, and had greater WUEp and lower Δ13C (greater iWUE) than smaller clones. Tree GE (kg biomass m−2) increased with relative growth rate, and there was significant variation in GE related to tree size, where average GE for Group H was greater than for Group L. The robustness of the analyses of GE and WUEp depends, in part, on the degree to which allometric regressions accurately predict component biomass. We were unable to detect clone-specific differences in allometric relationships, mainly due to the small sample size (n = three or four per clone). However, the generalized equation for aboveground wood biomass was strong, lending confidence in estimates of wood biomass, biomass growth, and WUEp. In contrast, there was considerable variation in foliage biomass among harvested trees, possibly due to loss of foliage during harvesting. This led to a much less robust allometric relationship for foliage biomass, which leads to uncertainty in estimates of Al, Al:As, and GE. Nevertheless, the positive relationship with RGR suggests that larger, faster growing trees have greater GE. Other studies have observed strong correlations between stem growth and leaf area of several poplar species and hybrids [24,26,45,64,65,66,67]. For example, increased growth of P. deltoides, compared to P. deltoides × P. nigra hybrids, was attributed to a 32–120% increase in GE [68]. Total Et,tree was strongly correlated with stem biomass growth, and the WUEp ranged between 1.2 and 3.3 kg m−3 H2O. Tree WUEp increased with relative growth rate, indicating faster growing trees used water more efficiently. These results support our hypotheses that GE and WUEp are positively correlated with growth. The positive relationship between GE and WUEp and growth is linked to increased light and nutrient use efficiencies in larger trees [44] and a shift in carbon allocation to wood production, at the expense of belowground components [69,70,71].
The cause of variation in WUEp among Groups was less clear. Most of the variation in WUEp was observed in Group L, which had clones with the highest (DD224) and lowest (DD402) WUEp. Tree WUEp decreased with total tree water use (Figure 5), however, this relationship differed among Groups, such that, for a similar level of tree water use, larger clones (Group H) had a higher WUEp than Group I and L. A positive relationship between growth and WUEp has been reported for individual seedlings and trees, and at the stand-level. The work of Rasheed et al. [72] observed a strong positive relationship between seedling transpiration efficiency and biomass accumulation in P deltoides x nigra. Growth was positively correlated with WUEp in six Eucalyptus grandis clones, but only under well-watered conditions [73]. The work of Forrester et al. [74] observed a strong relationship between Et and stem growth in Eucalyptus nitens, wherein the slope of the relationship increased with increased Et, indicating that larger trees with higher Et had significantly greater WUEp. The work of Stape et al. [75] found that WUEp increased with increased water use in an irrigated Eucalypus grandis × urophylla plantation. In Eucalyptus saligna plantations, Binkley et al. [76] reported that the largest 25% of trees accounted for half of stand water use and 60% of stand growth, reflecting greater WUE in larger trees. These studies, as well as this study, suffer from the confounding of genotype and tree, thus, lower WUE in slow growing trees may be due to inferior genetic growth potential. The work of Otto et al. [77] recognized this problem, and examined within clone variations of growth and WUE in Eucalyptus grandis × urophylla stands. They found that, across sites, dominant trees used water more efficiently than suppressed ones.
The relationship between WUE and growth, assessed by means of leaf and wood Δ13C, largely corroborated Clone and Group differences in growth-based WUEp. There was a strong positive correlation between leaf Δ13C and stem biomass growth, however, this relationship varied with Group (Figure 9 and Table 3), such that Group L had a greater leaf Δ13C (lower iWUE) for a given amount of stem growth than Groups H and I. Genotypic variation in Δ13C can be due to differences in photosynthesis (A) or stomatal conductance (gs), or both; consequently, plant growth may be positively or negatively correlated with Δ13C, depending on how A and gs affect the ratio of leaf internal to atmospheric (CO2) (Ci/Ca) [23,78]. If A affects Ci/Ca more than gs, then Δ13C should scale negatively to growth, and growth would be associated with high iWUE, whereas, if gs has dominant control over Ci/Ca, then Δ13C should relate positively to growth, and fast growth would relate to low iWUE [79]. Our results suggest that, within Groups, differences in Δ13C were largely a function of gs, but differences in Δ13C among Groups were less clear. Lower Δ13C in wood and foliage, after accounting for Group difference in stem growth, indicate that iWUE were largely sink-driven and the larger, more productive clones were more efficient in water use. This could occur if larger clones in Group H and I had greater photosynthetic capacity and higher A/gs [23]. Several studies have reported a strong correlation between photosynthetic capacity and foliar nitrogen in Populus [65,80,81]. We observed a weak, but significant, negative relationship between Δ13C and leaf nitrogen content (mmol N m−2) (R2 = 0.22; p = 0.004), suggesting that lower Δ13C were largely driven by A [82].
Variation in the relationship between Δ13C and growth has been reported for several tree species, families, and clones and including Populus. The work of Monclus et al. [30] observed, among 33 P. deltoides × trichocarpa genotypes, that Δ13C correlated negatively with growth, and that the most productive genotypes were the most water use efficient. A negative relationship was also observed in clones of Populus × euroamericana [28,83] and in hybrid P. deltoides × nigra [72]. A similar negative relationship was observed for Salix species [84,85] and several coniferous species [86]. In contrast, Δ13C scaled positively with growth in P. deltoides × P. nigra [45], P. davidiana [25] and some Eucalyptus species [87,88], suggesting that high productivity is achieved at the expense of water use (i.e., low WUEi). Others have found a poor or no correlation between Δ13C and growth in Poplar sp. and hybrids [27,89,90].
While both WUEp and Δ13C indicated that the more productive clones used water more efficiently, there was no clear relationship between the two indices of WUE. Others have found a poor or non-existent relationship between tissue Δ13C and WUEp [21,41,73,91], although, a strong negative relationship between WUEp and Δ13C was observed in seedlings of Larix occidentalis [92] and P. euroamericana [28]. These contrasting results suggest that the relation between Δ13C and WUEp may change when scaling from leaf to whole plant. Clone differences in mesophyll conductance, tissue respiration, water loss through non-photosynthetic processes, carbon allocation and leaf area can affect the plant carbon and water balance independently of A and gs, causing a decoupling of Δ13C and WUEp. Because of this, Seibt [93] concluded that Δ13C measurements might not be a useful predictor of WUEp. Clearly, a better understanding of the relationship between Δ13C and growth and WUEp is needed if Δ13C is to be a useful metric to estimate tree-level WUE.
Clone variation in WUEp and Δ13C was linked to increased stomatal sensitivity to D and REW and decreased whole-tree hydraulic conductance (Gp). Canopy Gs was relatively insensitive to changes in soil moisture, until a threshold REW was reached, after which trees responded by closing stomata reducing Et. The threshold appears to be between 20% and 25% REW (Figure 6), below which trees had tight control over water use. Clones in Groups H and I tended to reduce Gs sooner, as REW declined, than smaller clones in Group L, that is, less productive clones had a higher relative Gs at lower REW than more productive clones. The slower response to decreasing REW in Group L was reflected in a different stomatal sensitivity to D. Averaged across all Groups, there was a strong relationship between –dGs/dlnD and Gref (slope = 0.63), which is close to the theoretical 0.6 predicted for isohydric plants that regulate leaf water potential above a species-specific threshold [58]. However, when analyzed separately, Group L had a significantly lower slope (0.54). Deviation from the theoretical 0.6*Gref could be due to Group L having less stomatal control over leaf Ψ. This fits with Group L being less sensitive to REW. Across genotypes, WUEp was negatively correlated with Gp, indicating a trade-off between water transport efficiency and WUEp (Figure 8). This finding is the opposite of our hypothesis, and contrary to the theory that that high whole-plant hydraulic is necessary for high productivity in forest trees [19]. The reduction in AH in larger clones seems to be responsible for the decrease in Gp. The work of Fichot et al. [94] observed a negative relationship between whole-plant hydraulic conductance and relative growth rate in P. deltoides × P. nigra hybrids, possibly due to genotypic variation in xylem anatomy (vessel diameter and frequency) [95]. Trees display homeostatic adjustment of hydraulic properties in relation to growing conditions and climate, to avoid damaging leaf water potential [96]. This could include a reduction in Al:As, increased Gp, or decreased Gs. We observed only small differences in Al:As with tree size, thus, greater stomatal sensitivity to D was necessary to maintain leaf water potential in large trees. Increased stomatal sensitivity to D, with a decrease in Gp, is consistent with homeostasis of leaf water potential in isohydric plants [58].
There are other possible causes for variation in WUEp and Δ13C among Clones and Groups, related to differences in tree size and stand structure. The work of Binkley et al. [76] proposed that, following stand closure, competition among trees for resources intensifies, and that dominant trees would have better access to resources (light, nutrients, moisture), use more of those resources, and therefore have a higher resource use efficiency than suppressed trees. It has also been observed that the maintenance respiration cost relative to photosynthesis is greater in suppressed trees [97]. Consequently, the observed genotypic variation in GE and WUEp may simply be due to competition and stand structure.
The relationship between Gref and –dGs/dlnD (Figure 7) assumes a strong coupling between the canopy and atmosphere [58]. Group H and I represented dominant and co-dominant trees, whose canopies were likely well coupled with the atmosphere. In contrast, the canopies of suppressed trees in Group L may be less coupled with the atmosphere, creating a higher ratio between boundary layer conductance and gs and less sensitivity to changes in D [98]. Suppressed trees also may have assimilated respired CO2 (depleted in 13C) within the canopy. A high boundary layer resistance, and the use of respired CO2, could have lowered δ13C (higher Δ13C) [99]. Hydraulic architecture can have a strong effect on gs, Ci/Ca, and leaf Δ13C [100]. Increased hydraulic resistance, with an increased xylem flow-path length, in taller trees [101], and reduced water supply to the canopy, should decrease gs relative to A and, therefore, result in lower Δ13C [100,102]. Our results showed that the larger clones in Group H and I had lower Gp and lower leaf and wood Δ13C; however, the mean difference in height between Group H and I was small (1.3 m) and was not a significant covariate explaining Clone or Group variation in Δ13C or WUEp. It is unclear if we would have observed similar GE, WUEp, and Δ13C if the clones were open-grown, where competition for light and soil resources is minimized. Nevertheless, these results highlight the importance of understanding the effect of tree size on physiological and hydraulic characteristics that determine water use and water use efficiency. A better understanding of tree-level physiology, and hydraulic characteristics and variation with tree size and growth rate, will facilitate scaling between small and large trees at the stand scale [103,104].
We observed a few differences in hydraulic traits and physiology that were related to the taxon of the clones. The TD clones (TD187 and TD185) had significantly greater SLA, Al:As, and Al:Root, and lower AH (Table 1) than the DD or DM clones. These attributes contributed to a lower GE and an increased sensitivity to soil water deficits, decreasing relative Gs at a higher REW. Interestingly, when –dGs/dlnD was assessed as a function of Gref, the TD clones had greater, although not significant, slope (0.70) than the DD and DM clones (0.62), suggesting greater stomatal sensitivity to D, although there were no significant differences in Gp. High SLA, along with increased Gs sensitivity to D and low Gp, would facilitate greater stomatal control of water loss [105]. The greater stomatal control of water loss of TD clones suggests that they may be more suitable for drier sites, although growth performance may be limited [5].
5. Conclusions
We found genotypic variability in the relationship between tree productivity, GE, WUEp, and Δ13C, among clones of P. deltoides and hybrids, when grown under field conditions. Larger clones generally had higher GE and Et,tree, and used more water than smaller clones. While there was no clear relationship between WUEp and Δ13C, both indices indicated that more productive clones used water more efficiently. The positive relationship between WUEp, growth, and the lower leaf and wood Δ13C in faster growing clones suggest that WUE is controlled primarily by photosynthesis, rather than stomatal conductance. Our data reflect tree-level responses and do not reflect how stand-level responses may differ; however, tree-level physiological responses provide fundamental information about species-level and stand-level responses. Nevertheless, these results suggest the stand management activities and clone selection that focus on tree growth will likely result in increased WUE. For sites with seasonally variable soil moisture conditions, selecting clones with high productive capacity is probably a better strategy than selection based on WUE, although increased productivity may also increase drought risk. The focus should be on the tradeoff between production and risk of plantation failure from drought. Continued research of the varied stomatal regulation strategy for growth and WUE should prove beneficial.
Supplementary Materials
The following are available online at https://www.mdpi.com/1999-4907/10/11/993/s1, Figure S1: Seasonal patterns of tree transpiration; Figure S2: Seasonal patterns of canopy stomatal conductance, Table S1: Parameter estimates for canopy stomatal conductance response to vapor pressure deficit (D).
Author Contributions
Conceptualization, C.A.M.; methodology, C.A.M. and J.B.; formal analysis, C.A.M.; resources, E.G.N.; data curation, C.A.M. and J.B.; writing—original draft preparation, C.A.M. and J.B.; writing—review and editing, R.C., S.B.G., D.W.H. and E.G.N.
Funding
The Southeast Partnership for Integrated Biomass Supply Systems (IBSS) (USDA NIFA Grant Award # 2011-68005-30410) supplied funding for establishment of the experiment and sap flux equipment. The USDA Forest Service paid salary support for Chris A. Maier and Joel Burley, sample analyses, and cost of site maintenance.
Acknowledgments
The authors would like to thank Bradley Holland and Nathan Thomas at the North Carolina State University Horticultural Field Laboratory for access to the study site and for background information on the NCSU IBSS poplar study. We would also like to thank US Forest Service personnel Daniel McInnis, Pete Anderson, Robert Eaton, Tom Christensen, Hei-Kyung Hooke, and Karen Sarsony for technical assistance in the field and laboratory. The senior author also thanks Lisa Samuelson and Dana Nelson for a pre-submission review. This article was written and prepared in part by U.S. Government employees on official time, and the textual content is therefore in the public domain and not subject to copyright.
Conflicts of Interest
The authors declare no conflict of interest.
References
- Perlack, R.D.E.; Laurence, M.; Anthony, F.T., Jr.; Matt, H.L.; Craig, C.B.; Mark, E.D.; Robin, L.G.; Lynn, L.W.; Jacob, M.W.; Anna, M.S.; et al. U.S. Billion-Ton Update: Biomass Supply for a Bioenergy and Bioproducts Industry; U.S. Department of Energy, Oak Ridge National Laboratory: Oak Ridge, TN, USA, 2011; p. 227. [Google Scholar]
- Vance, E.; Loehle, C.; Wigley, T.; Weatherford, P. Scientific Basis for Sustainable Management of Eucalyptus and Populus as Short-Rotation Woody Crops in the U.S. Forests 2014, 5, 901–918. [Google Scholar] [CrossRef]
- King, J.S.; Ceulemans, R.; Albaugh, J.M.; Dillen, S.Y.; Domec, J.-C.; Fichot, R.; Fischer, M.; Leggett, Z.; Sucre, E.; Trnka, M.; et al. The Challenge of Lignocellulosic Bioenergy in a Water-Limited World. BioScience 2013, 63, 102–117. [Google Scholar] [CrossRef]
- Ghezehei, S.B.; Nichols, E.G.; Maier, C.A.; Hazel, D.W. Adaptability of Populus to Physiography and Growing Conditions in the Southeastern USA. Forests 2019, 10, 118. [Google Scholar] [CrossRef]
- Braatne, J.H.; Hinckley, T.M.; Stettler, R.F. Influence of soil water on the physiological and morphological components of plant water balance in Populus trichocarpa, Populus deltoides and their F1 hybrids. Tree Physiol. 1992, 11, 325–339. [Google Scholar] [CrossRef] [PubMed]
- Kim, H.-S.; Oren, R.; Hinckley, T.M. Actual and potential transpiration and carbon assimilation in an irrigated poplar plantation. Tree Physiol. 2008, 28, 559–577. [Google Scholar] [CrossRef] [PubMed]
- Jassal, R.S.; Black, T.A.; Arevalo, C.; Jones, H.; Bhatti, J.S.; Sidders, D. Carbon sequestration and water use of a young hybrid poplar plantation in north-central Alberta. Biomass Bioenergy 2013, 56, 323–333. [Google Scholar] [CrossRef]
- Navarro, A.; Facciotto, G.; Campi, P.; Mastrorilli, M. Physiological adaptations of five poplar genotypes grown under SRC in the semi-arid Mediterranean environment. Trees 2014, 28, 983–994. [Google Scholar] [CrossRef]
- Hinckley, T.M.; Brooks, J.R.; Čermák, J.; Ceulemans, R.; Kučera, J.; Meinzer, F.C.; Roberts, D.A. Water flux in a hybrid poplar stand. Tree Physiol. 1994, 14, 1005–1018. [Google Scholar] [CrossRef]
- Tschaplinski, T.J.; Tuskan, G.A.; Gunderson, C.A. Water-stress tolerance of black and eastern cottonwood clones and four hybrid progeny. I. Growth, water relations, and gas exchange. Can. J. For. Res. 1994, 24, 364–371. [Google Scholar] [CrossRef]
- Bréda, N.; Huc, R.; Granier, A.; Dreyer, E. Temperate forest trees and stands under severe drought: A review of ecophysiological responses, adaptation processs and long-term consequences. Ann. Forst Sci. 2006, 63, 625–644. [Google Scholar] [CrossRef]
- Ceulemans, R.; Deraedt, W. Production physiology and growth potential of poplars under short-rotation forestry culture. For. Ecol. Manag. 1999, 121, 9–23. [Google Scholar] [CrossRef]
- Monclus, R.; Dreyer, E.; Villar, M.; Delmotte, F.M.; Delay, D.; Petit, J.-M.; Barbaroux, C.; Le Thiec, D.; Bréchet, C.; Brignolas, F. Impact of drought on productivity and water use efficiency in 29 genotypes of Populus deltoides × Populus nigra. New Phytol. 2006, 169, 765–777. [Google Scholar] [CrossRef] [PubMed]
- Ghezehei, S.B.; Nichols, E.G.; Hazel, D.W. Early Clonal Survival and Growth of Poplars Grown on North Carolina Piedmont and Mountain Marginal Lands. BioEnergy Res. 2016, 9, 548–558. [Google Scholar] [CrossRef]
- Isebrands, J.G.; Richardson, J. Poplars and Willows: Trees for Society and the Environment; CABI: Oxford, UK, 2014. [Google Scholar]
- Zalesny, R.S.; Headlee, W.L.; Gopalakrishnan, G.; Bauer, E.O.; Hall, R.B.; Hazel, D.W.; Isebrands, J.G.; Licht, L.A.; Negri, M.C.; Nichols, E.G.; et al. Ecosystem services of poplar at long-term phytoremediation sites in the Midwest and Southeast, United States. Wiley Interdiscip. Rev. Energy Environ. 2019, 8, e349. [Google Scholar] [CrossRef]
- Hubbard, R.M.; Ryan, M.G.; Stiller, V. Stomatal conductance and photosynthesis vary linearly with plant hydraulic conductance in ponderosa pine. Plant Cell Environ. 2001, 24, 113–121. [Google Scholar] [CrossRef]
- Brodribb, T.J.; McAdam, S.A.M.; Jordan, G.J.; Feild, T.S. Evolution of stomatal responsiveness to CO2 and optimization of water-use efficiency among land plants. New Phytol. 2009, 183, 839–847. [Google Scholar] [CrossRef]
- Tyree, M.T. Hydraulic limits on tree performance: Transpiration, carbon gain and growth of trees. Trees 2003, 17, 95–100. [Google Scholar] [CrossRef]
- Whitehead, D.; Beadle, C.L. Physiological regulation of productivity and water use in Eucalptus: A review. For. Ecol. Manag. 2004, 193, 113–140. [Google Scholar] [CrossRef]
- McCarthy, H.R.; Pataki, D.E.; Jenerette, G.D. Plant water-use efficiency as a metric of urban ecosystem services. Ecol. Appl. 2011, 21, 3115–3127. [Google Scholar] [CrossRef]
- Lambers, H.; Chapin, F.S.; Pons, T.L. Plant Physiological Ecology; Springer: New York, NY, USA, 2008. [Google Scholar]
- Farquhar, G.D.; Hubick, K.T.; Condon, A.G.; Richards, R.A. Carbon Isotope Fractionation and Plant Water-Use Efficiency. In Stable Isotopes in Ecological Research; Rundel, P.W., Ehleringer, J.R., Nagy, K.A., Eds.; Springer: New York, NY, USA, 1989; pp. 21–40. [Google Scholar] [CrossRef]
- Rae, A.M.; Robinson, K.M.; Street, N.R.; Taylor, G. Morphological and physiological traits influencing biomass productivity in short-rotation coppice poplar. Can. J. For. Res. 2004, 34, 1488–1498. [Google Scholar] [CrossRef]
- Zhang, X.; Zang, R.; Li, C. Population differences in physiological and morphological adaptations of Populus davidiana seedlings in response to progressive drought stress. Plant Sci. 2004, 166, 791–797. [Google Scholar] [CrossRef]
- Marron, N.; Villar, M.; Dreyer, E.; Delay, D.; Boudouresque, E.; Petit, J.-M.; Delmotte, F.M.; Guehl, J.-M.; Brignolas, F. Diversity of leaf traits related to productivity in 31 Populus deltoides × Populus nigra clones. Tree Physiol. 2005, 25, 425–435. [Google Scholar] [CrossRef] [PubMed]
- Dillen, S.Y.; Marron, N.; Koch, B.; Ceulemans, R. Genetic Variation of Stomatal Traits and Carbon Isotope Discrimination in Two Hybrid Poplar Families (Populus deltoides ‘S9-2’ × P. nigra ‘Ghoy’ and P. deltoides ‘S9-2’ × P. trichocarpa ‘V24’). Ann. Bot. 2008, 102, 399–407. [Google Scholar] [CrossRef] [PubMed]
- Ripullone, F.; Lauteri, M.; Grassi, G.; Amato, M.; Borghetti, M. Variation in nitrogen supply changes water-use efficiency of Pseudotsuga menziesii and Populus x euroamericana; a comparison of three approaches to determine water-use efficiency. Tree Physiol. 2004, 24, 671–679. [Google Scholar] [CrossRef] [PubMed]
- Bonhomme, L.; Barbaroux, C.; Monclus, R.; Morabito, D.; Berthelot, A.; Villar, M.; Dreyer, E.; Brignolas, F. Genetic variation in productivity, leaf traits and carbon isotope discrimination in hybrid poplars cultivated on contrasting sites. Ann. For. Sci. 2008, 65, 503. [Google Scholar] [CrossRef]
- Monclus, R.; Villar, M.; Barbaroux, C.; Bastien, C.; Fichot, R.; Delmotte, F.M.; Delay, D.; Petit, J.M.; Bréchet, C.; Dreyer, E.; et al. Productivity, water-use efficiency and tolerance to moderate water deficit correlate in 33 poplar genotypes from a Populus deltoides × Populus trichocarpa F1 progeny. Tree Physiol. 2009, 29, 1329–1339. [Google Scholar] [CrossRef]
- Fischer, M.; Fichot, R.; Albaugh, J.M.; Ceulemans, R.; Domec, J.C.; Trnka, M.; King, J.S. Populus and Salix grown in a short-rotation coppice for bioenergy: Ecophysiology, aboveground productivity, and stand-level water use efficiency. In Sustainable Biofuels, an Ecological Assessment of the Future Energy; Ajay, K.B., Zenone, T., Chen, J., Eds.; HEP deGruyter: Berlin, Germany, 2015; pp. 155–194. [Google Scholar]
- Silim, S.; Nash, R.; Reynard, D.; White, B.; Schroeder, W. Leaf gas exchange and water potential responses to drought in nine poplar (Populus spp.) clones with contrasting drought tolerance. Trees 2009, 23, 959–969. [Google Scholar] [CrossRef]
- Arango-Velez, A.; Zwiazek, J.J.; Thomas, B.R.; Tyree, M.T. Stomatal factors and vulnerability of stem xylem to cavitation in poplars. Physiol. Plant. 2011, 143, 154–165. [Google Scholar] [CrossRef] [PubMed]
- Attia, Z.; Domec, J.-C.; Oren, R.; Way, D.A.; Moshelion, M. Growth and physiological responses of isohydric and anisohydric poplars to drought. J. Exp. Bot. 2015. [Google Scholar] [CrossRef]
- Schulte, P.J.; Hinckley, T.M.; Stettler, R.F. Stomatal responses of Populus to leaf water potential. Can. J. Bot. 1987, 65, 255–260. [Google Scholar] [CrossRef]
- Yin, C.; Wang, X.; Duan, B.; Luo, J.; Li, C. Early growth, dry matter allocation and water use efficiency of two sympatric Populus species as affected by water stress. Environ. Exp. Bot. 2005, 53, 315–322. [Google Scholar] [CrossRef]
- Pointeau, V.M.; Guy, R.D. Comparative resource-use efficiencies and growth of Populus trichocarpa and Populus balsamifera under glasshouse conditions. Botany 2014, 92, 443–451. [Google Scholar] [CrossRef]
- Schimel, D.S.; Braswell, B.H.; McKeown, R.; Ojima, D.S.; Parton, W.J.; Pulliam, W. Climate and nitrogen controls on the geography and timescales of terrestrial biogeochemical cycling. Glob. Biogeochem. Cycles 1996, 10, 677–692. [Google Scholar] [CrossRef]
- Chaves, M.M.; Osorio, M.J.; Pereira, J.S. Water use efficiency and photosynthesis. In Water Use Efficiency in Plant Biology; Bacon, M.A., Ed.; Blackwell Publishing: Oxford, UK, 2004; pp. 42–74. [Google Scholar]
- Fardusi, M.J.; Ferrio, J.P.; Comas, C.; Voltas, J.; de Dios, V.R.; Serrano, L. Intra-specific association between carbon isotope composition and productivity in woody plants: A meta-analysis. Plant Sci. 2016, 251, 110–118. [Google Scholar] [CrossRef] [PubMed]
- Condon, A.G.; Richards, R.A.; Rebetzke, G.J.; Farquhar, G.D. Breeding for high water-use efficiency. J. Exp. Bot. 2004, 55, 2447–2460. [Google Scholar] [CrossRef]
- Sinclair, T.R. Is transpiration efficiency a viable plant trait in breeding for crop improvement? Funct. Plant Biol. 2012, 39, 359–365. [Google Scholar] [CrossRef]
- Binkley, D.; Stape, J.L.; Ryan, M.G. Thinking about efficiency of resource use in forests. For. Ecol. Manag. 2004, 193, 5–16. [Google Scholar] [CrossRef]
- Binkley, D. Understanding the Role of Resource Use Efficiency in Determining the Growth of Trees and Forests. In Forests in Development: A Vital Balance; Schlichter, T., Montes, L., Eds.; Springer: Dordrecht, The Netherlands, 2012; pp. 13–26. [Google Scholar] [CrossRef]
- Monclus, R.; Dreyer, E.; Delmotte, F.M.; Villar, M.; Delay, D.; Boudouresque, E.; Petit, J.-M.; Marron, N.; Bréchet, C.; Brignolas, F. Productivity, leaf traits and carbon isotope discrimination in 29 Populus deltoides × P. nigra clones. New Phytol. 2005, 167, 53–62. [Google Scholar] [CrossRef]
- Shifflett, S.D.; Hazel, D.W.; Frederick, D.J.; Nichols, E.G. Species Trials of Short Rotation Woody Crops on Two Wastewater Application Sites in North Carolina, USA. BioEnergy Res. 2014, 7, 157–173. [Google Scholar] [CrossRef]
- Coyle, D.R.; Coleman, M.D.; Durant, J.A.; Newman, L.A. Survival and growth of 31 Populus clones in South Carolina. Biomass Bioenergy 2006, 30, 750–758. [Google Scholar] [CrossRef]
- Zalesny, R.S.; Hall, R.B.; Zalesny, J.A.; McMahon, B.G.; Berguson, W.E.; Stanosz, G.R. Biomass and Genotype × Environment Interactions of Populus Energy Crops in the Midwestern United States. BioEnergy Res. 2009, 2, 106–122. [Google Scholar] [CrossRef]
- Ghezehei, S.B.; Shifflett, S.D.; Hazel, D.W.; Nichols, E.G. SRWC bioenergy productivity and economic feasibility on marginal lands. J. Environ. Manag. 2015, 160, 57–66. [Google Scholar] [CrossRef] [PubMed]
- Thomas, N.G. Growth and Leaf Area Dynamics of Short-Rotation Populus Genotypes; North Carolina State University: Raleigh, NC, USA, 2016. [Google Scholar]
- Albaugh, T.J.; Albaugh, J.M.; Fox, T.R.; Allen, H.L.; Rubilar, R.A.; Trichet, P.; Loustau, D.; Linder, S. Tamm Review: Light use efficiency and carbon storage in nutrient and water experiments on major forest plantation species. For. Ecol. Manag. 2016, 376, 333–342. [Google Scholar] [CrossRef]
- Granier, A. Une nouvelle methode pour la measure du flux de seve brute dans le tronc des arbres. Ann. For. Sci. 1985, 42, 193–200. [Google Scholar] [CrossRef]
- Jones, H.G. Plants and Microclimate; Cambridge University Press: Oxford, UK, 1986. [Google Scholar]
- Samuelson, L.J.; Stokes, T.A.; Coleman, M.D. Influence of irrigation and fertilization on transpiration and hydraulic properties of Populus deltoides. Tree Physiol. 2007, 27, 765–774. [Google Scholar] [CrossRef] [PubMed]
- Edwards, W.R.N.; Booker, R.E. Radial Variation in the Axial Conductivity of Populus and its Significance in Heat Pulse Velocity Measurement. J. Exp. Bot. 1984, 35, 551–561. [Google Scholar] [CrossRef]
- Lambs, L.; Muller, É. Sap flow and water transfer in the Garonne River riparian woodland, France: First results on poplar and willow. Ann. For. Sci. 2002, 59, 301–315. [Google Scholar] [CrossRef]
- Nobel, P.S. Physicochemical & Environmental Plant Physiology; Academic Press: San Diego, CA, USA, 1999. [Google Scholar]
- Oren, R.; Sperry, J.S.; Katul, G.G.; Pataki, D.E.; Ewers, B.E.; Phillips, N.; Schafer, K.V.R. Survey and synthesis of intra- and interspecific variation in stomatal sensitivity to vapour pressure deficit. Plant Cell Environ. 1999, 22, 1515–1526. [Google Scholar] [CrossRef]
- Ewers, B.E.; Oren, R. Analyses of assumptions and errors in the calculation of stomatal conductance from sap flux measurments. Tree Physiol. 2000, 20, 579–589. [Google Scholar] [CrossRef]
- Wullschleger, S.D.; Meinzer, F.C.; Vertessy, R.A. A review of whole-plant water use studies in tree. Tree Physiol. 1998, 18, 499–512. [Google Scholar] [CrossRef]
- Meinzer, F.C.; Goldstein, G.; Jackson, P.; Holbrook, N.M.; Gutiérrez, M.V.; Cavelier, J. Environmental and physiological regulation of transpiration in tropical forest gap species: The influence of boundary layer and hydraulic properties. Oecologia 1995, 101, 514–522. [Google Scholar] [CrossRef] [PubMed]
- Franks, P.J. Stomatal control and hydraulic conductance, with special reference to tall trees. Tree Physiol. 2004, 24, 865–878. [Google Scholar] [CrossRef] [PubMed]
- Zarnoch, S.J. Testing Hypotheses for Differences Between Linear Regression Lines; SRS–17; USDA Forest Service, Southern Research Station: Asheville, NC, USA, 2009. [Google Scholar]
- Cannell, M.G.R.; Sheppard, L.J.; Milne, R. Light Use Efficiency and Woody Biomass Production of Poplar and Willow. Forestry 1988, 61, 125–136. [Google Scholar] [CrossRef]
- Curtis, P.S.; Vogel, C.S.; Wang, X.; Pregitzer, K.S.; Zak, D.R.; Lussenhop, J.; Kubiske, M.; Teeri, J.A. Gas exchange, leaf nitrogen, and growth efficiency of Populus tremuloides in a CO2-enriched atmosphere. Ecol. Appl. 2000, 10, 3–17. [Google Scholar]
- Pellis, A.; Laureysens, I.; Ceulemans, R. Growth and production of a short rotation coppice culture of poplar I. Clonal differences in leaf characteristics in relation to biomass production. Biomass Bioenergy 2004, 27, 9–19. [Google Scholar] [CrossRef]
- Broeckx, L.; Vanbeveren, S.; Verlinden, M.; Ceulemans, R. First vs. second rotation of a poplar short rotation coppice: Leaf area development, light interception and radiation use efficiency. iForest—Biogeosci. For. 2015, 8, 565–573. [Google Scholar] [CrossRef]
- Dowell, R.C.; Gibbins, D.; Rhoads, J.L.; Pallardy, S.G. Biomass production physiology and soil carbon dynamics in short-rotation-grown Populus deltoides and P. deltoides × P. nigra hybrids. For. Ecol. Manag. 2009, 257, 134–142. [Google Scholar] [CrossRef]
- Albaugh, T.J.; Allen, H.L.; Dougherty, P.M.; Johnsen, K.H. Long term growth responses of loblolly pine to optimal nutrient and water resource availability. For. Ecol. Manag. 2004, 192, 3–19. [Google Scholar] [CrossRef]
- Stape, J.L.; Binkley, D.; Ryan, M.G. Production and carbon allocation in clonal Eucalyptus plantation with water and nutrient manipulations. For. Ecol. Manag. 2008, 255, 920–930. [Google Scholar] [CrossRef]
- Ryan, M.G.; Stape, J.L.; Binkley, D.; Fonseca, S.; Loos, R.A.; Takahashi, E.N.; Silva, C.R.; Hakamada, R.E.; Ferreira, J.M.; Lima, A.M.N.; et al. Factors controlling Eucalyptus productivity: How water availability and stand structure alter production and carbon allocation. For. Ecol. Manag. 2010, 259, 1695–1703. [Google Scholar] [CrossRef]
- Rasheed, F.; Dreyer, E.; Richard, B.; Brignolis, F.; Montpied, P.; Thiec, D.L. Genotype differences in 13C discrimination between atmospheric and leaf matter match differences in transpiration efficiency at leaf and whole-plant levels in hybrid Populus deltoides x nigra. Plant Cell Environ. 2013, 36, 87–102. [Google Scholar] [CrossRef] [PubMed]
- Le Roux, D.; Stock, W.D.; Bond, W.J.; Maphanga, D. Dry mass allocation, water use efficiency and δ13C in clones of Eucalyptus grandis, E. grandis × camaldulensis and E. grandis × nitens grown under two irrigation regimes. Tree Physiol. 1996, 16, 497–502. [Google Scholar] [CrossRef] [PubMed][Green Version]
- Forrester, D.I.; Collopy, J.J.; Beadle, C.L.; Warren, C.R.; Baker, T.G. Effect of thinning, pruning and nitrogen fertilizer application on transpiration, photosynthesis and water-use effliciency in a young Eucalyptus nitens plantation. For. Ecol. Manag. 2012, 266, 286–300. [Google Scholar] [CrossRef]
- Stape, J.L.; Binkley, D.; Ryan, M.G. Eucalyptus production and the supply, use and efficiency of use of water, light and nitrogen across a geographic gradient in Brazil. For. Ecol. Manag. 2004, 193, 17–31. [Google Scholar] [CrossRef]
- Binkley, D.; Stape, J.L.; Ryan, M.G.; Barnard, H.R.; Fownes, J. Age-related decline in forest ecosystem growth: An individual-tree, stand structure hypothesis. Ecosystems 2002, 5, 58–67. [Google Scholar] [CrossRef]
- Otto, M.S.G.; Hubbard, R.M.; Binkley, D.; Stape, J.L. Dominant clonal Eucalyptus grandis x urophylla trees use water more efficiently. For. Ecol. Manag. 2014, 328, 117–121. [Google Scholar] [CrossRef]
- Donovan, L.A.; Ehleringer, J.R. Carbon isotope discrimination, water-use efficiency, growth, and mortality in a natural shrub population. Oecologia 1994, 100, 347–354. [Google Scholar] [CrossRef]
- Flanagan, L.B.; Johnsen, K.H. Genetic variation in carbon isotope discrimination and its relationship to growth under field conditions in full-sib families of Picea mariana. Can. J. For. Res. 1995, 25, 39–47. [Google Scholar] [CrossRef]
- Coleman, M.D.; Dickson, R.E.; Isebrands, J.G. Growth and physiology of aspen supplied with different fertilizer addition rates. Physiol. Plant. 1998, 103, 513–526. [Google Scholar] [CrossRef]
- Casella, E.; Ceulemans, R. Spatial distribution of leaf morphological and physiological characteristics in relation to local radiation regime within the canopies of 3-year-old Populus clones in coppice culture. Tree Physiol. 2002, 22, 1277–1288. [Google Scholar] [CrossRef][Green Version]
- Sparks, J.P.; Ehleringer, J.R. Leaf carbon isotope discrimination and nitrogen content for riparian trees along elevational transects. Oecologia 1997, 109, 362–367. [Google Scholar] [CrossRef] [PubMed]
- Voltas, J.; Serrano, L.; Hernández, M.; Pemán, J. Carbon Isotope Discrimination, Gas Exchange and Stem Growth of Four Euramerican Hybrid Poplars under Different Watering Regimes. New For. 2006, 31, 435–451. [Google Scholar] [CrossRef]
- Schifman, L.A.; Stella, J.C.; Volk, T.A.; Teece, M.A. Carbon isotope variation in shrub willow (Salix spp.) ring-wood as an indicator of long-term water status, growth and survival. Biomass Bioenergy 2012, 36, 316–326. [Google Scholar] [CrossRef]
- Toillon, J.; Rollin, B.; Dallé, E.; Feinard-Duranceau, M.; Bastien, J.-C.; Brignolas, F.; Marron, N. Variability and plasticity of productivity, water-use efficiency, and nitrogen exportation rate in Salix short rotation coppice. Biomass Bioenergy 2013, 56, 392–404. [Google Scholar] [CrossRef]
- Sun, Z.J.; Livingston, N.J.; Guy, R.D.; Ethier, G.J. Stable carbon isotopes as indicators of increased water use efficiecny and productivity in white spruce (Picea glauca (Moench) Voss) seedlings. Plant Cell Environ. 1996, 19, 887–894. [Google Scholar] [CrossRef]
- Bond, W.J.; Stock, W.D. Preliminary Assessment of the Grading of Eucalyptus Clones Using Carbon Isotope Discrimination. S. Afr. For. J. 1990, 154, 51–55. [Google Scholar] [CrossRef]
- Pita, P.; Soria, F.; Cañas, I.; Toval, G.; Pardos, J.A. Carbon isotope discrimination and its relationship to drought resistance under field conditions in genotypes of Eucalyptus globulus Labill. For. Ecol. Manag. 2001, 141, 211–221. [Google Scholar] [CrossRef]
- Chamaillard, S.; Fichot, R.; Vincent-Barbaroux, C.; Bastien, C.; Depierreux, C.; Dreyer, E.; Villar, M.; Brignolas, F. Variations in bulk leaf carbon isotope discrimination, growth and related leaf traits among three Populus nigra L. populations. Tree Physiol. 2011, 31, 1076–1087. [Google Scholar] [CrossRef]
- Verlinden, M.S.; Fichot, R.; Broeckx, L.S.; Vanholme, B.; Boerjan, W.; Ceulemans, R. Carbon isotope compositions (δ13C) of leaf, wood and holocellulose differ among genotypes of poplar and between previous land uses in a short-rotation biomass plantation. Plant Cell Environ. 2015, 38, 144–156. [Google Scholar] [CrossRef]
- Cernusak, L.A.; Aranda, J.; Marshall, J.D.; Winter, K. Large variation in whole-plant water-use efficiency among tropical tree species. New Phytol. 2007, 173, 294–305. [Google Scholar] [CrossRef]
- Zhang, J.; Marshall, J.D. Population differences in water-use efficiency of well-watered and water-stressed western larch seedlings. Can. J. For. Res. 1994, 24, 92–99. [Google Scholar] [CrossRef]
- Seibt, U.; Rajabi, A.; Griffiths, H.; Berry, J.A. Carbon isotopes and water use efficiency: Sense and sensitivity. Oecologia 2008, 155, 441. [Google Scholar] [CrossRef] [PubMed]
- Fichot, R.; Barigah, T.S.; Chamaillard, S.; Le Thiec, D.; Laurans, F.; Cochard, H.; Brignolas, F. Common trade-offs between xylem resistance to cavitation and other physiological traits do not hold among unrelated Populus deltoides × Populus nigra hybrids. Plant Cell Environ. 2010, 33, 1553–1568. [Google Scholar] [CrossRef] [PubMed]
- Fichot, R.; Laurans, F.; Monclus, R.; Moreau, A.; Pilate, G.; Brignolas, F. Xylem anatomy correlates with gas exchange, water-use efficiency and growth performance under contrasting water regimes: Evidence from Populus deltoides × Populus nigra hybrids. Tree Physiol. 2009, 29, 1537–1549. [Google Scholar] [CrossRef] [PubMed]
- Whitehead, D. Regulation of stomatal conductance and transpiration in forest canopies. Tree Physiol. 1998, 18, 633–644. [Google Scholar] [CrossRef]
- O’Grady, A.P.; Worledge, D.; Wilkinson, A.; Battaglia, M. Photosynthesis and respiration decline with light intensity in dominant and suppressed Eucalyptus globulus canopies. Funct. Plant Biol. 2008, 35, 439–447. [Google Scholar] [CrossRef]
- Wullschleger, S.D.; Wilson, K.B.; Hanson, P.J. Environmental control of whole-plant transpiration, canopy conductance and estimates of the decoupling coefficient for large red maple trees. Agric. For. Meteorol. 2000, 104, 157–168. [Google Scholar] [CrossRef]
- Broadmeadow, M.S.J.; Griffiths, H. 8—Carbon Isotope Discrimination and the Coupling of CO2 Fluxes within Forest Canopies. In Stable Isotopes and Plant Carbon-Water Relations; Ehleringer, J.R., Hall, A.E., Farquhar, G.D., Eds.; Academic Press: San Diego, CA, USA, 1993; pp. 109–129. [Google Scholar] [CrossRef]
- Hubbard, R.M.; Bond, B.J.; Ryan, M.G. Evidence that hydraulic conductance limits photosynthesis in old Pinus ponderosa trees. Tree Physiol. 1999, 19, 165–172. [Google Scholar] [CrossRef]
- Williams, M.; Bond, B.J.; Ryan, M.G. Evaluating different soil and plant hydraulic constraints on tree function using a model and sap flow data from ponderosa pine. Plant Cell Environ. 2001, 24, 679–690. [Google Scholar] [CrossRef]
- Samuelson, L.J.; McLemore, P.C.; Somers, G.L. Relationship between foliar d13C and hydraulic pathway length in Pinus palustris. For. Sci. 2003, 49, 790–798. [Google Scholar]
- Forrester, D.I. Transpiration and water-use efficiency in mixed-species forests versus monocultures: Effects of tree size, stand density and season. Tree Physiol. 2015, 35, 289–304. [Google Scholar] [CrossRef] [PubMed]
- Bloemen, J.; Fichot, R.; Horemans, J.A.; Broeckx, L.S.; Verlinden, M.S.; Zenone, T.; Ceulemans, R. Water use of a multigenotype poplar short-rotation coppice from tree to stand scale. GCB Bioenergy 2017, 9, 370–384. [Google Scholar] [CrossRef] [PubMed]
- Mencuccini, M. The ecological significance of long-distance water transport: Short-term regulation, long-term acclimation and the hydraulic costs of stature across plant life forms. Plant Cell Environ. 2003, 26, 163–182. [Google Scholar] [CrossRef]
© 2019 by the authors. Licensee MDPI, Basel, Switzerland. This article is an open access article distributed under the terms and conditions of the Creative Commons Attribution (CC BY) license (http://creativecommons.org/licenses/by/4.0/).