Article

Species Association of the Dominant Tree Species in an Old-Growth Forest and Implications for Enrichment Planting for the Restoration of Natural Degraded Forest in Subtropical China

1
Research Center of Forest Management Engineering of National Forestry and Grassland Administration, Beijing Forestry University, Beijing 100083, China
2
State Key Laboratory of Vegetation and Environmental Change, Institute of Botany, Chinese Academy of Sciences, Beijing 100083, China
3
Department of Forestry and Natural Resources, Purdue University, 175 West State St, West Lafayette, IN 47906, USA
*
Author to whom correspondence should be addressed.
Forests 2019, 10(11), 957; https://doi.org/10.3390/f10110957
Submission received: 18 September 2019 / Revised: 16 October 2019 / Accepted: 23 October 2019 / Published: 26 October 2019
(This article belongs to the Special Issue Ecological Silviculture Based on Natural Models of Forest Development)

Abstract

:
Subtropical natural forests are unique due to their ecological and economic functions. However, most of these forests are highly degraded, which impairs the ability to provide ecological and economic benefits. Enrichment planting is an important approach to restore natural degraded forests. Species arrangement is of great importance to inform enrichment planting. Species association refers to the interrelationship of different species occupying a habitat and is a static description of the organic connection formed by the interaction of species. Species association, therefore, provides a scientific basis for species arrangement in enrichment planting. Additionally, because an old-growth forest is a climax community that has attained great age without significant disturbance, the species association in an old-growth forest can provide valuable information on the reference conditions for forest management. In this study, the species association between dominant tree species (including saplings and adult trees) was investigated in an old-growth forest in the Gutianshan National Nature Reserve in Zhejiang province in subtropical China. The objective of the study was to inform species arrangement for enrichment planting. The result showed that the overall species association exhibited a significant net positive association, indicating a dynamic balance of stable structure and species composition in the old-growth forest. Additionally, the pairwise species association was examined using the χ2 test, the Dice index, and Spearman’s rank correlation coefficient; significant positive and negative pairwise species associations were detected. Based on the species association and the light requirements of the tree species, an optimal species arrangement was determined to support enrichment planting for restoring natural degraded forests. It is expected that the results of this study will contribute to the restoration of natural degraded forests in subtropical China.

1. Introduction

China has 84.91 million ha of subtropical natural forests with a total volume of 66.79 hundred million m3 [1]. Subtropical natural forests have unique ecological functions related to soil and water conservation, biodiversity conservation, and water and air purification, e.g., high biodiversity, complex structure, and high productivity [2,3,4]. However, in the past, because of long-term extensive anthropogenic disturbances, subtropical natural forests suffered great degradation and the quality and function of the forests are extremely poor [5,6]. For example, the total stand volume of subtropical natural forests in Zhejiang province is only 54.87 m3 per hectare [1]. Many authors documented that natural degraded forests exhibit poor performance in terms of carbon sequestration, biodiversity conservation, and water conservation [7,8,9]. In addition, due to forest fragmentation, the seed dispersal mechanism is not functioning properly, resulting in a lack of natural regeneration of high-value and late–successional tree species [10,11,12]. Therefore, subtropical natural degraded forests do not meet the increasing demand for ecological and economic benefits [5,13,14].
In order to restore these natural degraded forests, China imposed a complete cessation of commercial logging in natural forests in 2015 [15]. Unlike the Natural Forest Protection Program (NFPP) proposed in 2000, which strictly prohibited any management activities, this new ban encourages positive management to improve forest quality [16]. Actually, the NFPP has been criticized for its disproportionate and conservative protection [17]. Unlike the NFPP, this new ban stresses that the prohibition of commercial logging does not ban all logging or all other management activity but encourages scientific management including logging to restore degraded forests. Many authors have proven that low-quality forests can be converted into high-value forests with diverse structures, functions, and products through sustainable management [18,19,20]. A notable example is the significant improvement in forest quality through conversion in Switzerland, where a control method was implemented, e.g., the stand volume increased by 122 m3 ha–1 as a result of continuous management over 111 years [21]. Therefore, in this context, it is urgent to restore subtropical natural degraded forest through scientific management.
Enrichment planting is an important approach to restore natural degraded forests, especially when natural regeneration is insufficient. For enrichment plantings, species arrangement needs to be determined in advance [22,23]. Tree species arrangement can be determined by analyzing species associations [23,24,25,26]. Species association is defined as the interrelationship of different species in the spatial distribution and is a static description of the organic connection formed by the interaction of species in different habitats [27,28]. Species association has been extensively examined with respect to its mechanism [29,30,31,32]. For instance, Chai et al. [26] examined the species association of the dominant tree species in old-growth forests to explore the biological mechanism of species interaction. However, from a practical point of view, species association has been rarely investigated with the objective of informing forest management. Additionally, most of the current research has only concentrated on the species association between adult tree species pairs. However, except Paluch and Bartkowicz [33], species associations between saplings and adult trees and among saplings have been rarely examined although this is of great importance to inform enrichment plantings.
An old-growth forest is a climax community that has attained great age without significant disturbance [34,35]. Therefore, old-growth forests can provide valuable information on reference conditions for forest management [26,36,37]. Many authors have stated that the formulation of forest management strategies should be based on the conditions of old-growth forests [34,37].
The objective of this study is to explore the overall species association and intra- and interspecific associations among saplings and adult trees; based on the species association and light requirements of the tree species, we propose an optimal species arrangement between the saplings and adult trees to support enrichment planting for restoring natural degraded forests.

2. Materials and Methods
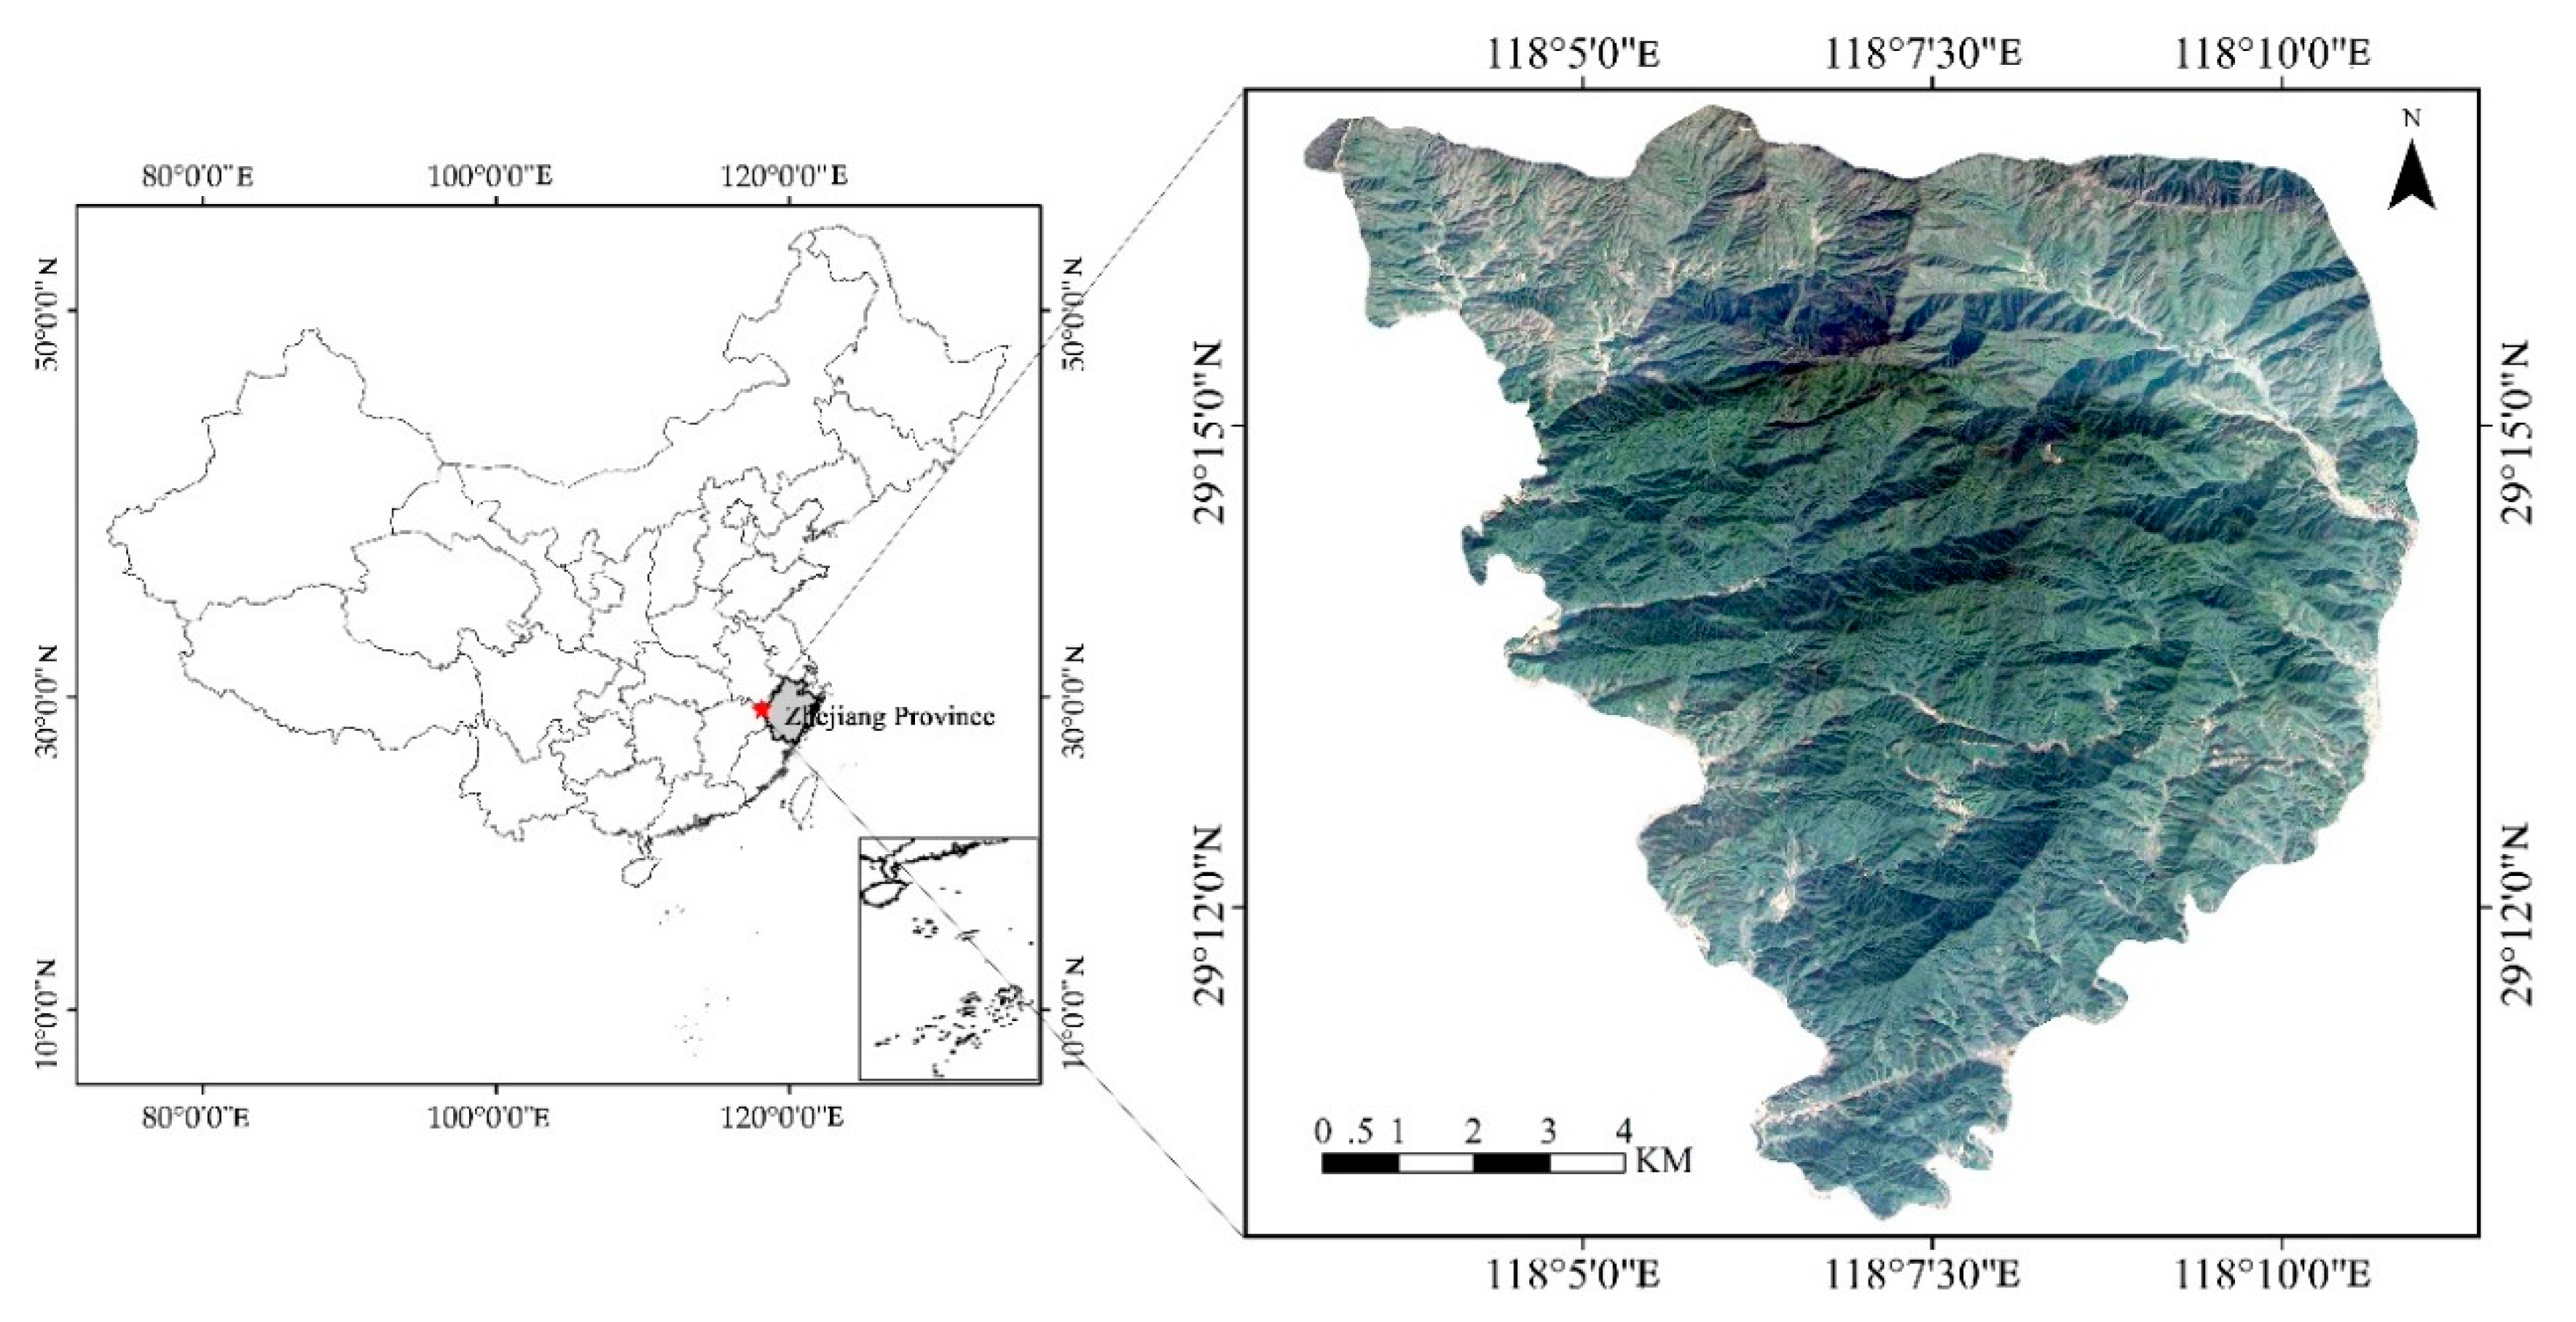
2.1. Study Area

The study area is located in the Gutianshan National Nature Reserve in Kaihua County, Zhejiang province (118°03′49″–118°11′12″ E, 29°10′19″–29°17′41.4″ N) (Figure 1). The reserve covers 8107 ha and the topography is characterized by mountains with steep slopes. Red soil, yellow–red soil, red–yellow soil, and bog soil are the common soil types in this region [38]. The region is located in the middle subtropical monsoon climate zone with a mean annual precipitation of 1963.7 mm, mean annual temperature of 15.3 °C, mean hottest month temperature of 28.9 °C, mean coldest month temperature of 4.1 °C, mean sunshine of 1747.5 h, and 250-d frost-free season every year [39]. The natural zonal vegetation in this area is subtropical evergreen broad-leaved forest dominated by Castanopsis spp., Cyclobalanopsis spp., and Schima superba [38,40,41].

2.2. Plot Establishment and Data Collection

In 2009, three 1 ha plots (100 m × 100 m) were established in an old-growth forest in the Gutianshan National Nature Reserve. This old-growth forest has a stand age of more than 100 years and is located in the core area of the Gutianshan National Nature Reserve. Historically, there was almost no anthropogenic disturbance to this old-growth forest due to its extremely remote location. Therefore, it represents the climax forest community in this area. Each 1 ha plot was further divided into one hundred 10 m × 10 m subplots, in which all individual trees with diameter at breast height (DBH) greater than 1 cm were identified to the species level and the DBH, survival status, and location were also recorded. The plots were re-measured every five years; this study was based on the latest measurement data in 2014. Following Zhao et al. [23], the trees were categorized into saplings (S) (DBH < 5.0 cm and H ≥ 1.3 m) and adult trees (U) (DBH ≥ 5.0 cm and H ≥ 1.3 m).

2.3. Importance Value

The importance value (IV) is a comprehensive evaluation index used to indicate the relative importance of a species in a forest community; the larger the IV of the species, the greater the dominance in the plot is [42,43,44]. The IV was calculated as follows:
IV = ( R e l a t i v e   d o m i n a n c e + R e l a t i v e   a b u n d a n c e + R e l a t i v e   f r e q u e n c y ) × 100 / 3
R e l a t i v e   d o m i n a n c e = d i i = 1 S d i
R e l a t i v e   a b u n d a n c e = n i i = 1 S n i
R e l a t i v e   f r e q u e n c y = f i i = 1 S f i
where S is the total number of species, di is the basal area of the ith species, ni represents the number of individuals of the ith species, and fi denotes the number of quadrats in which the ith species occurred.

2.4. Overall Species Association

The variance ratio (VR) test, which is based on species presence or absence, has been used to examine the overall association [45,46]. The VR was calculated using the following formula [45]:
VR = S T 2 σ T 2 = 1 N · j = 1 N ( T j t ) 2 i = 1 S n i N · ( 1 n i N )
where S is the total number of species, N represents the total number of quadrats, Tj is the number of species in the jth quadrats, ni denotes the number of quadrats in which the ith species occurred, and t is the average number of species in the quadrats.
If there is no overall association, the expected value of VR is 1. If VR < 1, the species exhibits a net negative association; conversely, a net positive association is observed [47]. Furthermore, we computed the statistic W = N × VR to test whether the deviations of the VR from 1 were significant. If there is no significant overall species association, there is a 95% probability that W lies between the limits given by the χ2 distribution: χ20.05 ≤ W ≤ χ20.95 [47].

2.5. Pairwise Species Association

If the VR test indicated a significant overall species association, the pairwise species association was investigated. In this study, we used the χ2 statistics, Spearman’s rank correlation coefficient (SRCC), and the Dice index (DI) to measure the species association between all possible dominant species pairs.

2.5.1. The χ2 Test

The χ2 statistic, which is based on a 2 × 2 contingency table, is normally used to qualitatively measure the species association [48]. However, biased estimation of the χ2 test statistic may occur if a cell in the 2 × 2 contingency table has an expected frequency of less than 1 or if more than two of the cells have expected frequencies of less than 5 [49]. A corrected χ2 test (Yates’s correction) was, therefore, employed in this study to determine the species association. The corrected χ2 statistic is calculated as follows:
χ 2 = N ( | a d b c | N 2 ) 2 ( a + b ) ( c + d ) ( a + c ) ( b + d )
When χ2 < 3.841, the species are independent of each other and no association is detected; when 3.841 ≤ χ2 < 6.635, there is a significant association between the species; when χ2 ≥ 6.635, there is a highly significant association between the species [50]. When ad – bc > 0, the association is positive and when ad – bc < 0, the association is negative.

2.5.2. Dice Index (Di)

Since the χ2 test only provides a qualitative determination of species associations, the degree of species association for each species pair cannot be quantitatively described [47,51]. The DI is, therefore, used to quantitatively represent the degree of association. The DI was calculated with the following equation:
DI = 2 a 2 a + b + c
The range of DI is (0, 1). When DI is equal to 0, there is no association, indicating that the species pairs are completely independent of each other and they may not appear in the same quadrat. In contrast, when DI is close to 1, the species pairs have the highest probability to appear in the same quadrat.
In Equations (3) and (4), N is the total number of quadrats, a is the number of quadrats with both species, b denotes the number of quadrats in which only species A occurs, c represents the number of quadrats in which only species B occurs, and d is the number of quadrats with neither species A nor species B.

2.5.3. Spearman’s Rank Correlation Coefficient (SRCC)

The χ2 test and DI use binary data to investigate species association and inevitably, some information is lost, e.g., species abundance [47]. In contrast, the SRCC, which uses the rank of the data, is a nonparametric technique for evaluating the degree of linear association or correlation between independent variables. The SRCC does not only provide information on species association but also on species covariance [52], which represents an improvement over species association [53]. The SRCC is defined as follows [54]:
r ( i , k ) = 1 6 j = 1 n ( x i j x i ¯ ) 2 ( x k j x k ¯ ) 2 N 3 N
where r (i, k) is the Spearman’s rank correlation coefficient, N is the total number of quadrats, xij is the rank of species i in quadrat j, and xkj is the rank of species k in quadrat j.
In this study, R software [55] was employ for statistical analysis. The χ2 statistics, SRCC, and DI were derived using the R package “spaa” [56], “plyr” [57], and ”corrplot” [58].

3. Results

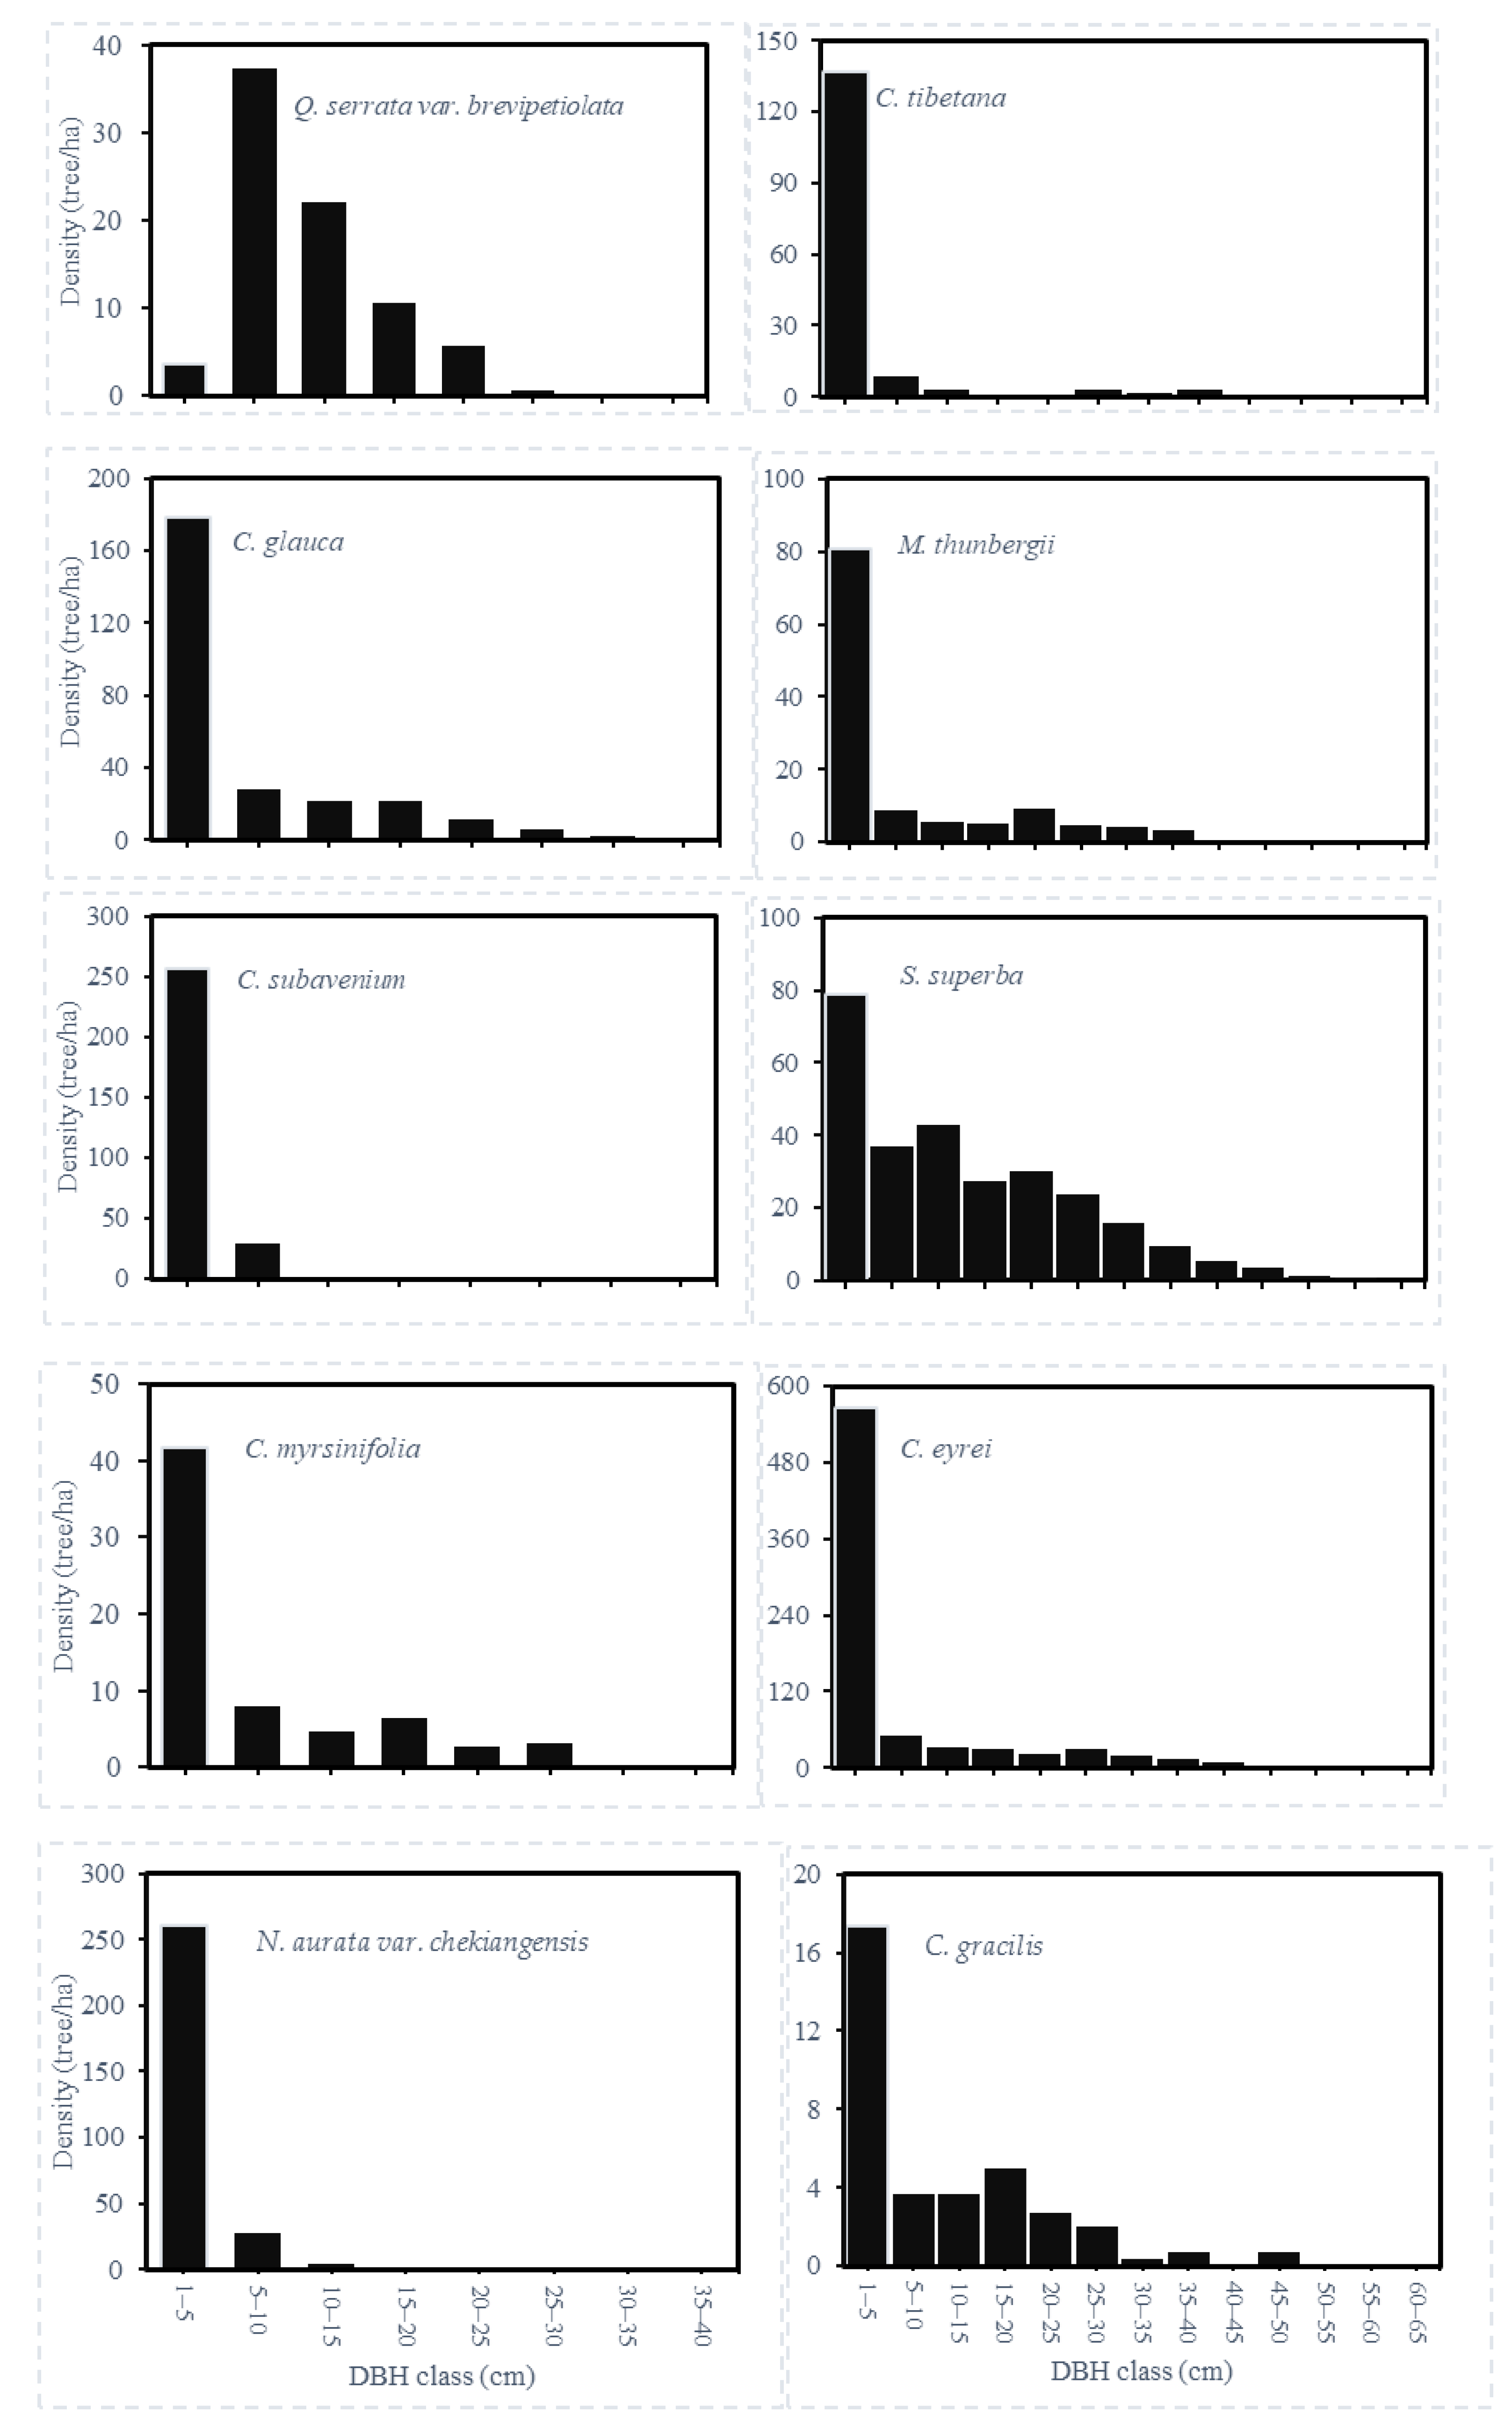
3.1. Species Composition and Stand Structure

In the sample plots, a total of 59 tree species (DBH ≥ 5.0 cm) with a density of 925 trees ha−1, mean DBH of 17.2 cm, and mean basal area of 0.0321 m2, were identified in the old-growth forest. Since the IVs of some species were extremely small, we only list the top ten dominant tree species, which accounted for 76.45% of the total important value (Table 1). C. eyrei had the largest IV (23.34) followed by S. superba (20.24); their IVs were significantly higher than those of the other tree species. Additionally, the light requirement and descriptive statistics of the top ten dominant tree species are also provided in Table 1.
For each dominant tree species, we grouped the trees into 5-cm diameter classes to determine the distribution (Figure 2). Most of the dominant species showed reverse J-shaped curves. The tree species with DBH larger than 50 cm included C. eyrei (62.0 cm), S. superba (55.9 cm), M. thunbergii (53.0 cm), and C. tibetana (51.8 cm), though the individual trees in the DBH class larger than 50 cm are not visible in Figure 2 due to their small number.

3.2. Overall Associations of Dominant Species

The overall species association between all possible dominant species pairs was measured by the VR test. The results indicated an overall net positive species association (VR = 1.35 > 1). The W statistics was equal to 406.37, which fell outside the confidence interval, i.e., χ20.05 ≤ W ≤ χ20.9520.95 (300) = 260.88, χ20.05 (300) = 341.40) and confirmed the significance of the species association.

3.3. Pairwise Species Associations of Dominant Species

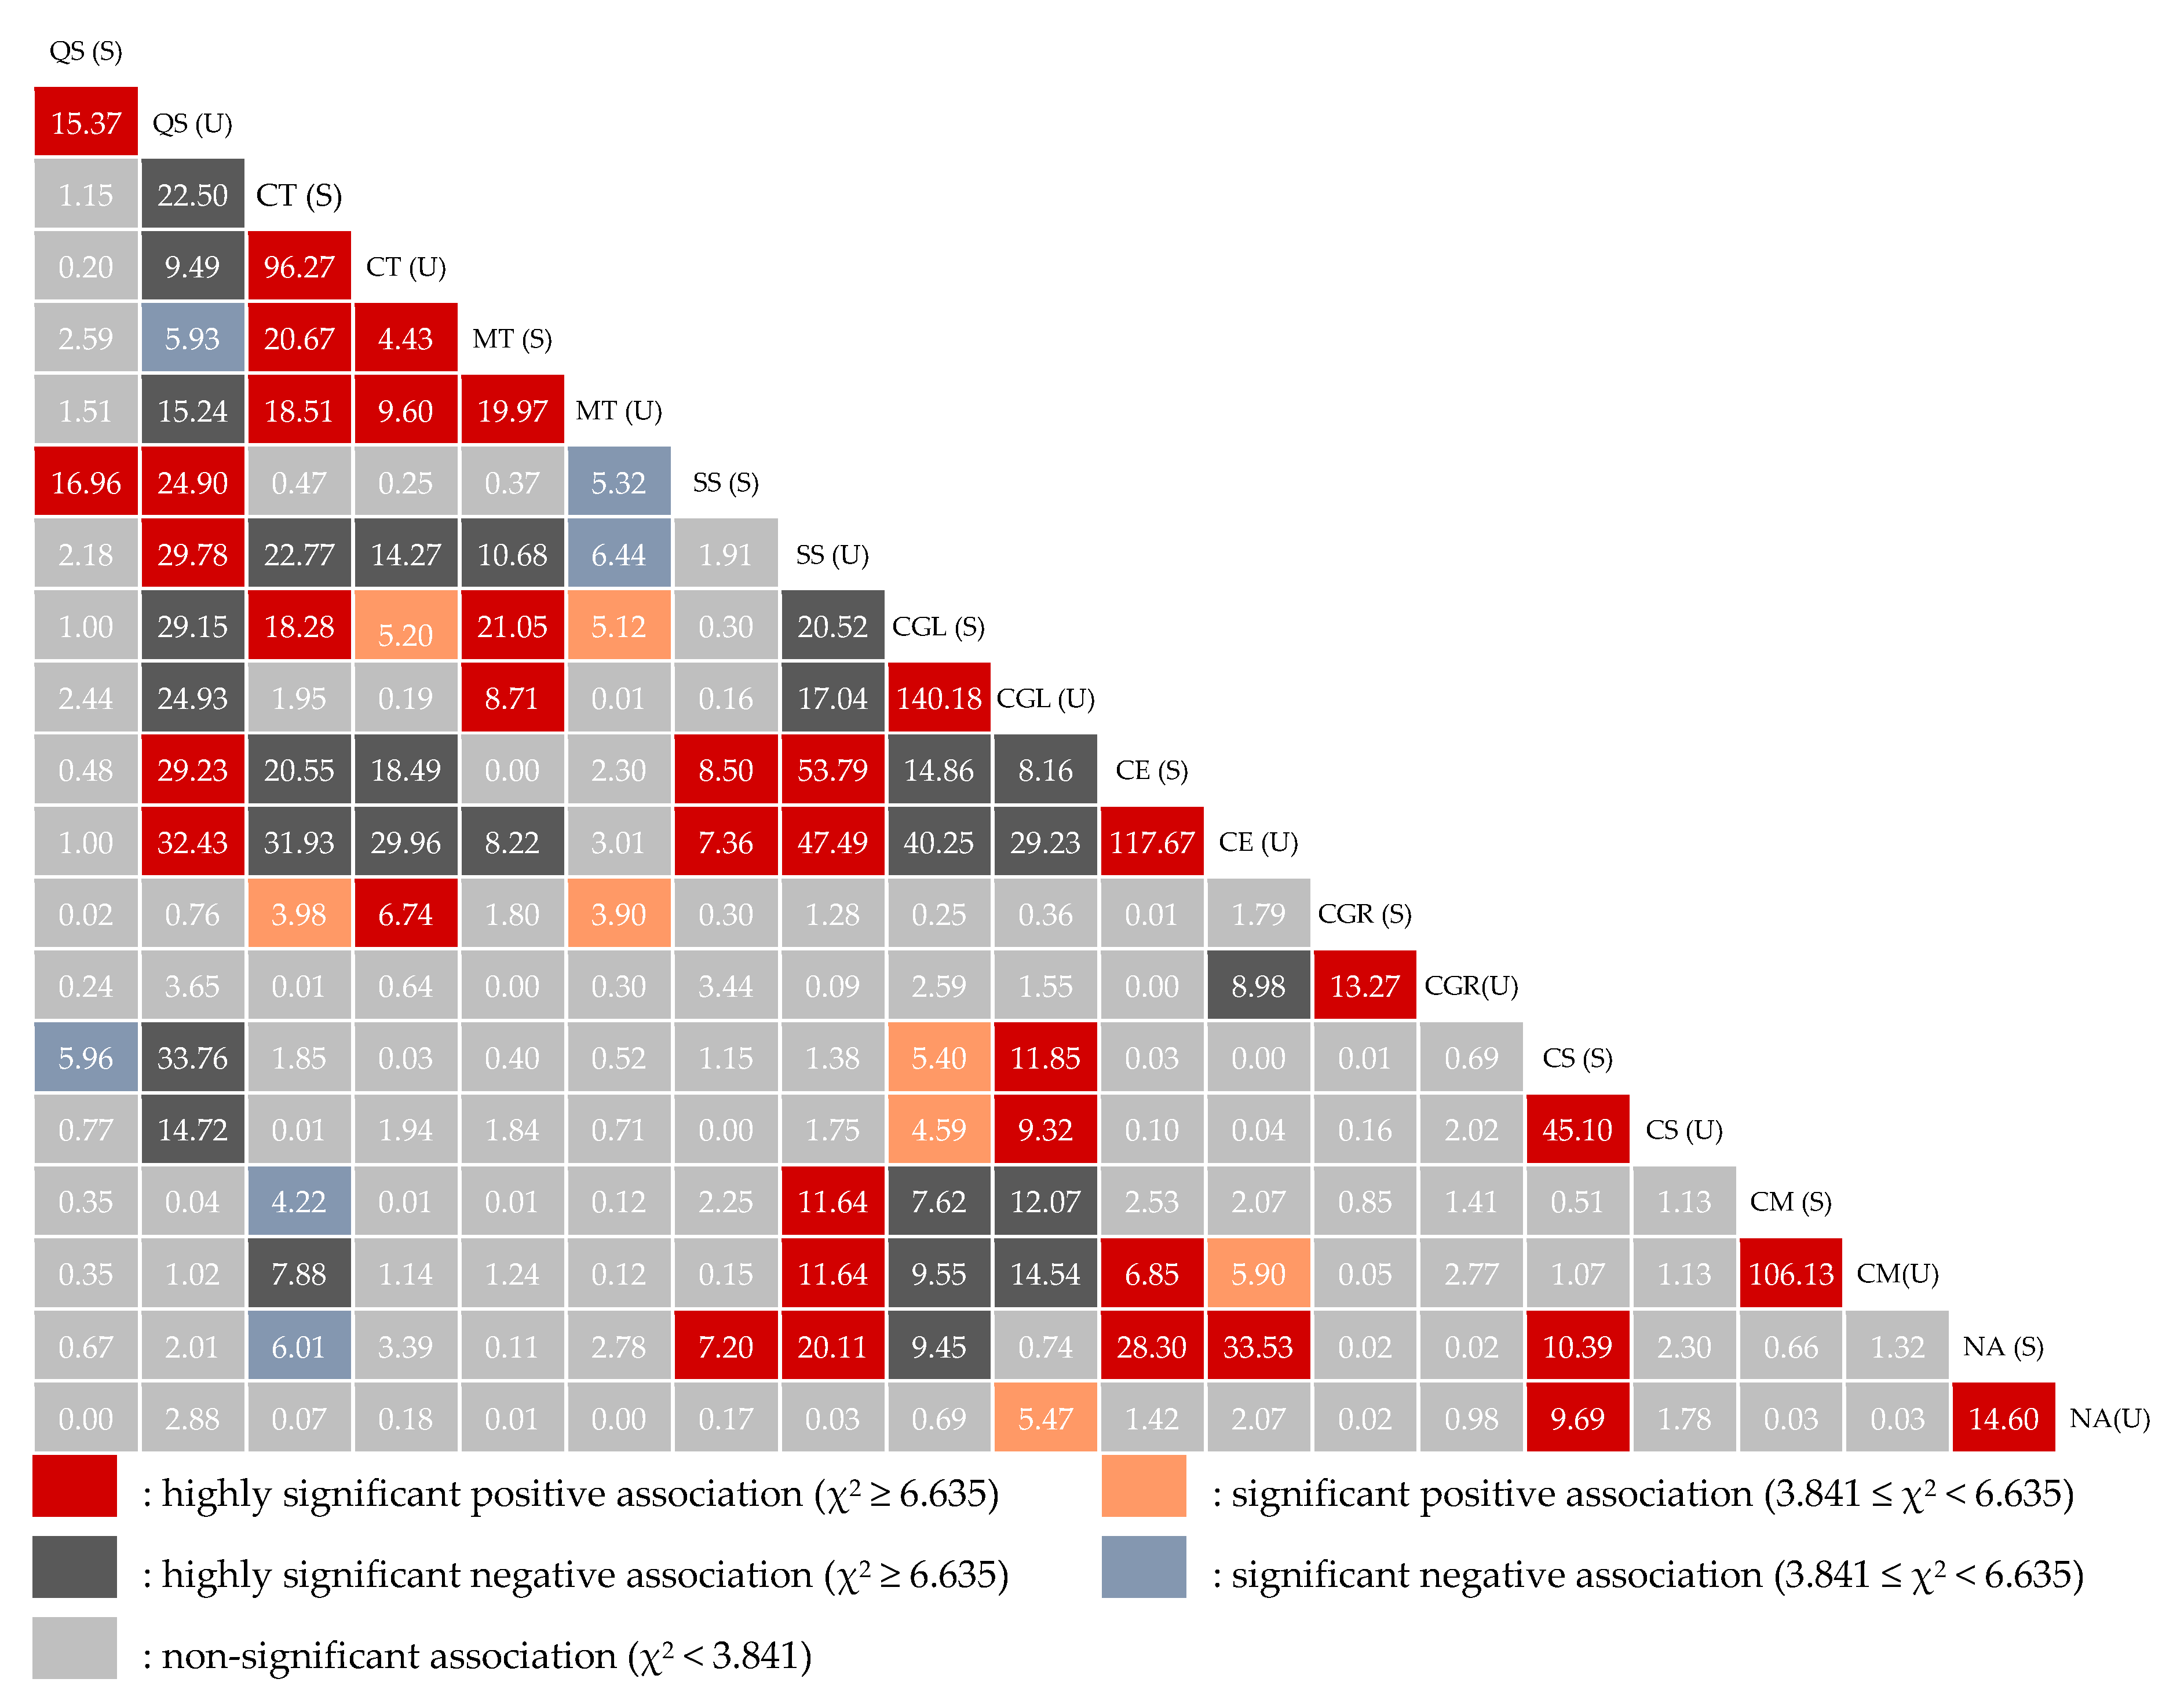
3.3.1. Test of Pairwise Species Associations

The χ2 statistic was calculated to determine the pairwise species association; the results are provided in Figure 3. There were 190 species pairs; 37 pairs (19.5%) had highly significant positive associations, 8 pairs (4.2%) exhibited significant positive associations, 28 pairs (14.7%) had highly significant negative associations, and 6 pairs (3.2%) demonstrated significant negative associations.

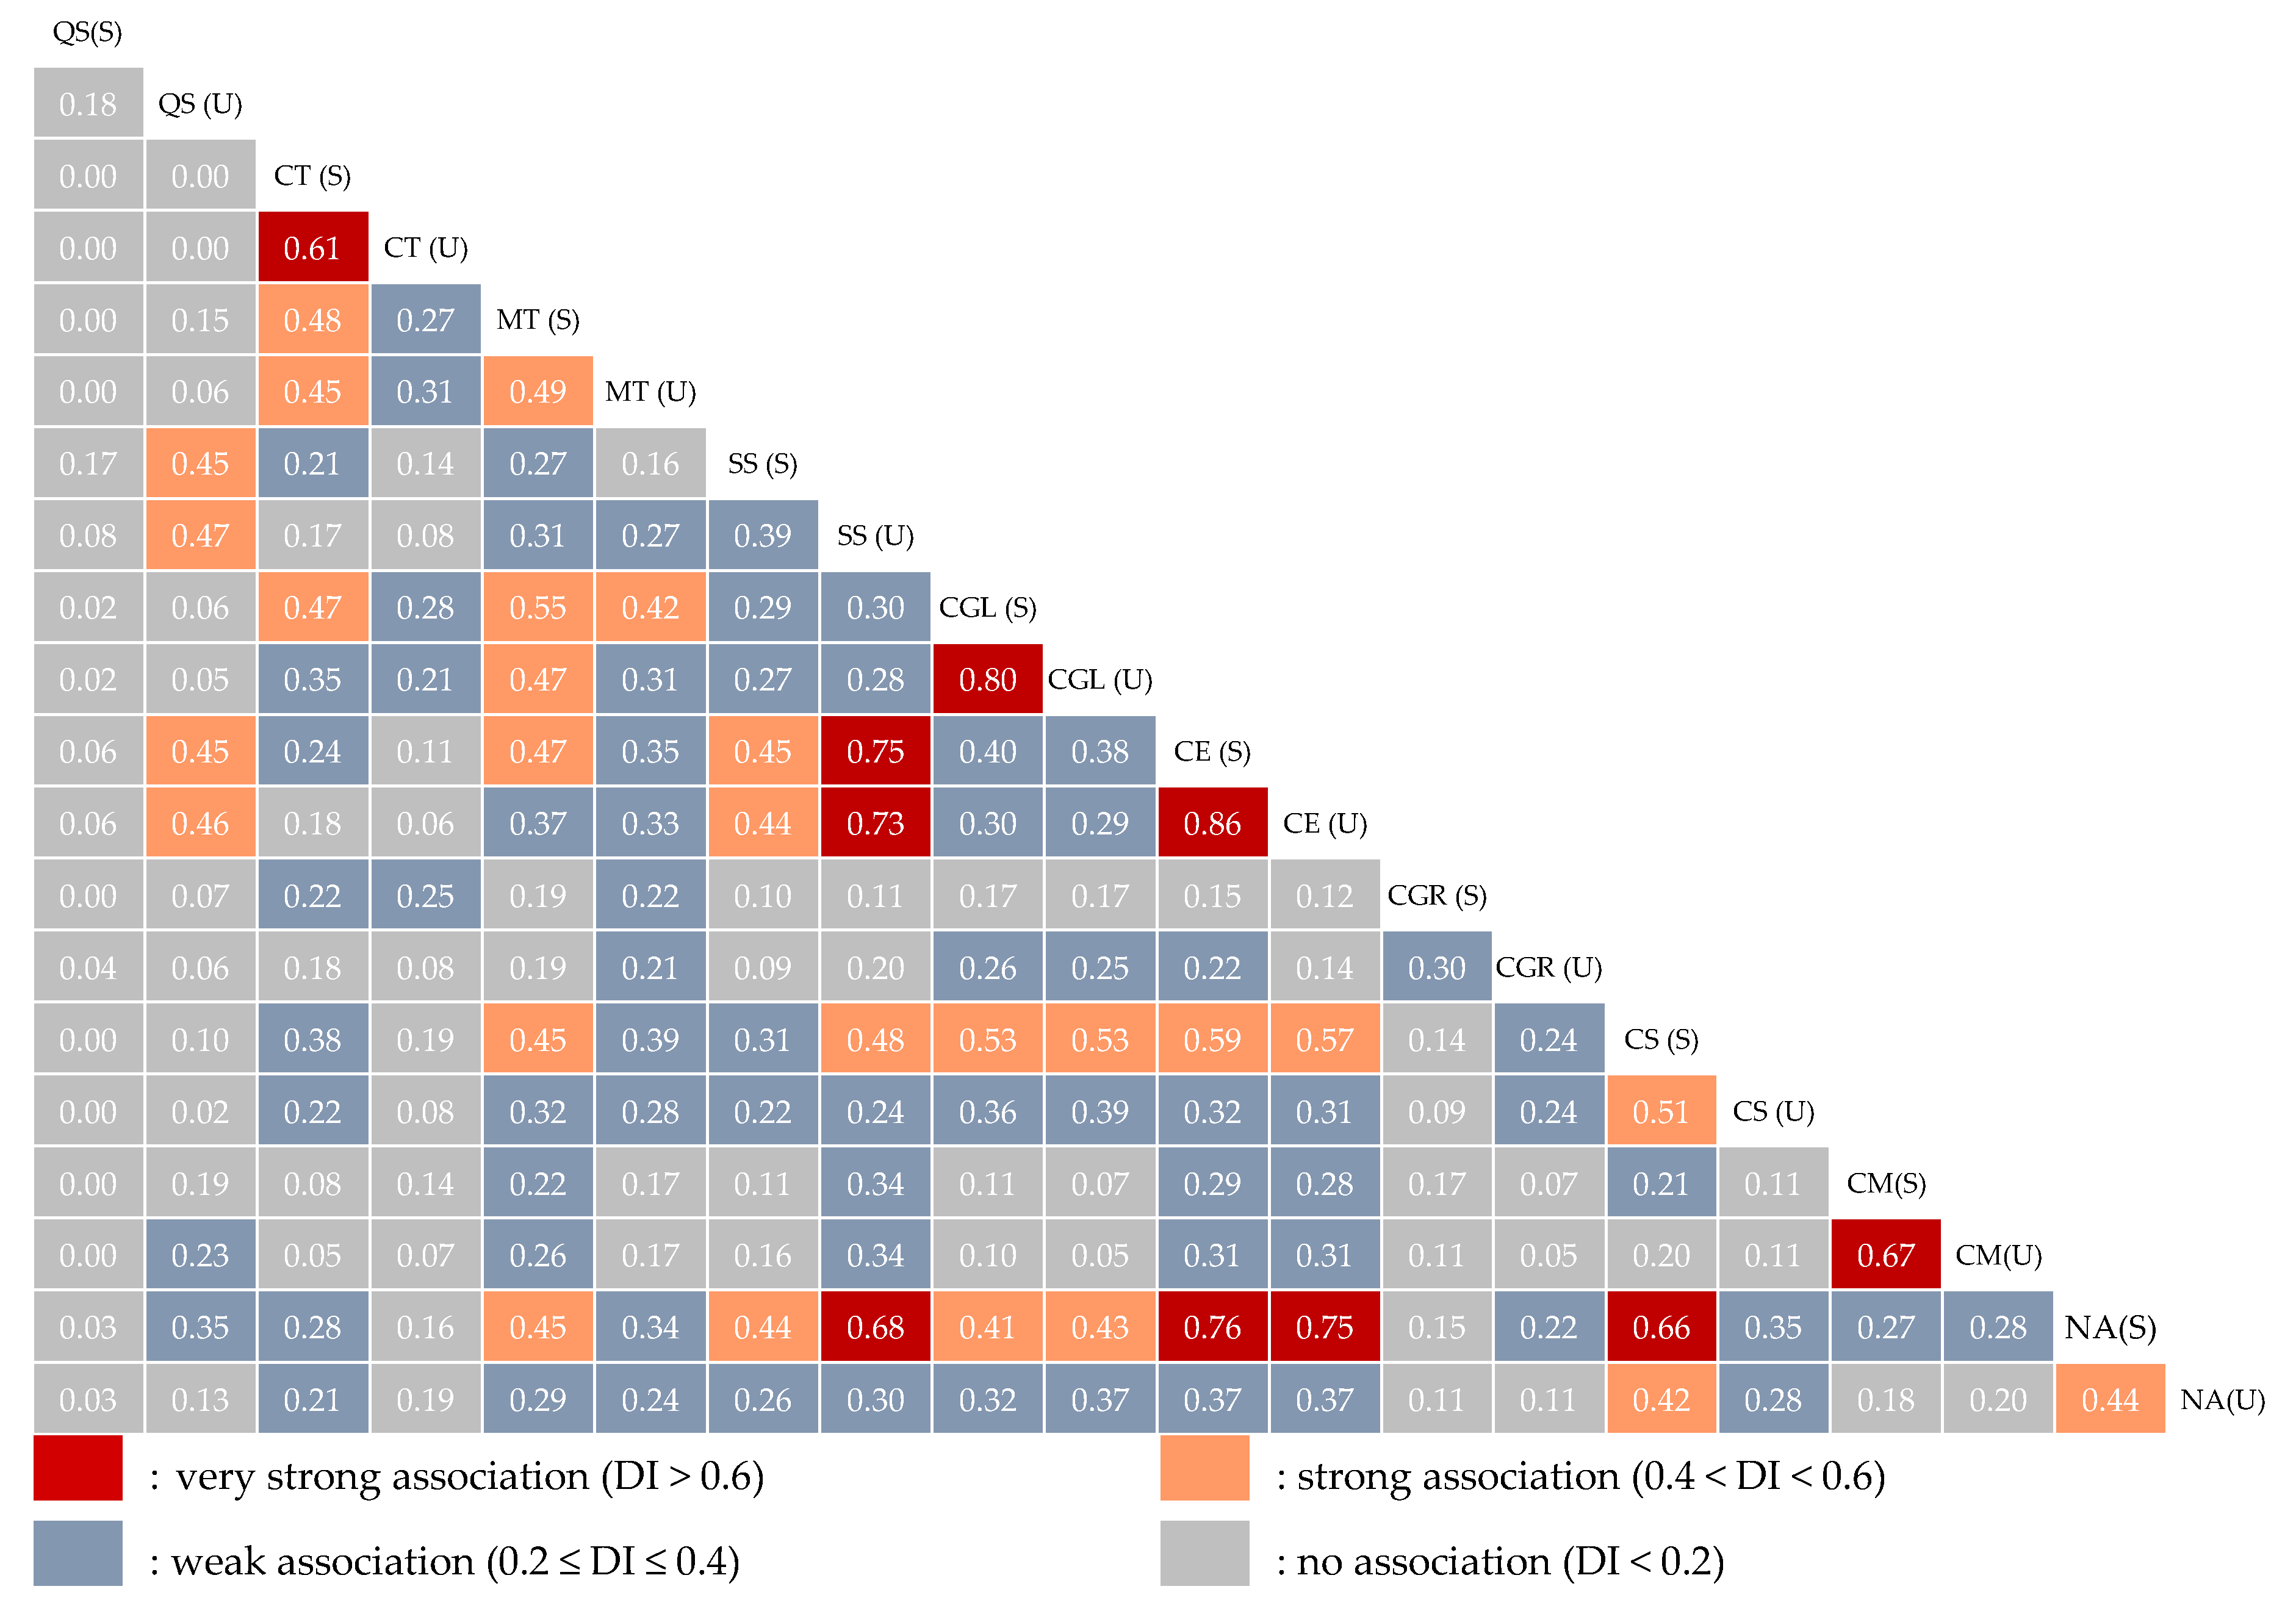
3.3.2. Measure of Pairwise Species Associations

The DI was derived to quantitatively represent the pairwise species associations. Among the 190 pairs, 10 pairs (5.3%) exhibited very strong associations (DI > 0.6), and 27 pairs (14.2%) had strong associations (0.4 < DI < 0.6) (Figure 4). In addition, 72 pairs with weak associations (0.2 ≤ DI ≤ 0.4) and 81 pairs with no association (DI < 0.2) accounted for 37.9% and 42.6% of the total species pairs, respectively.

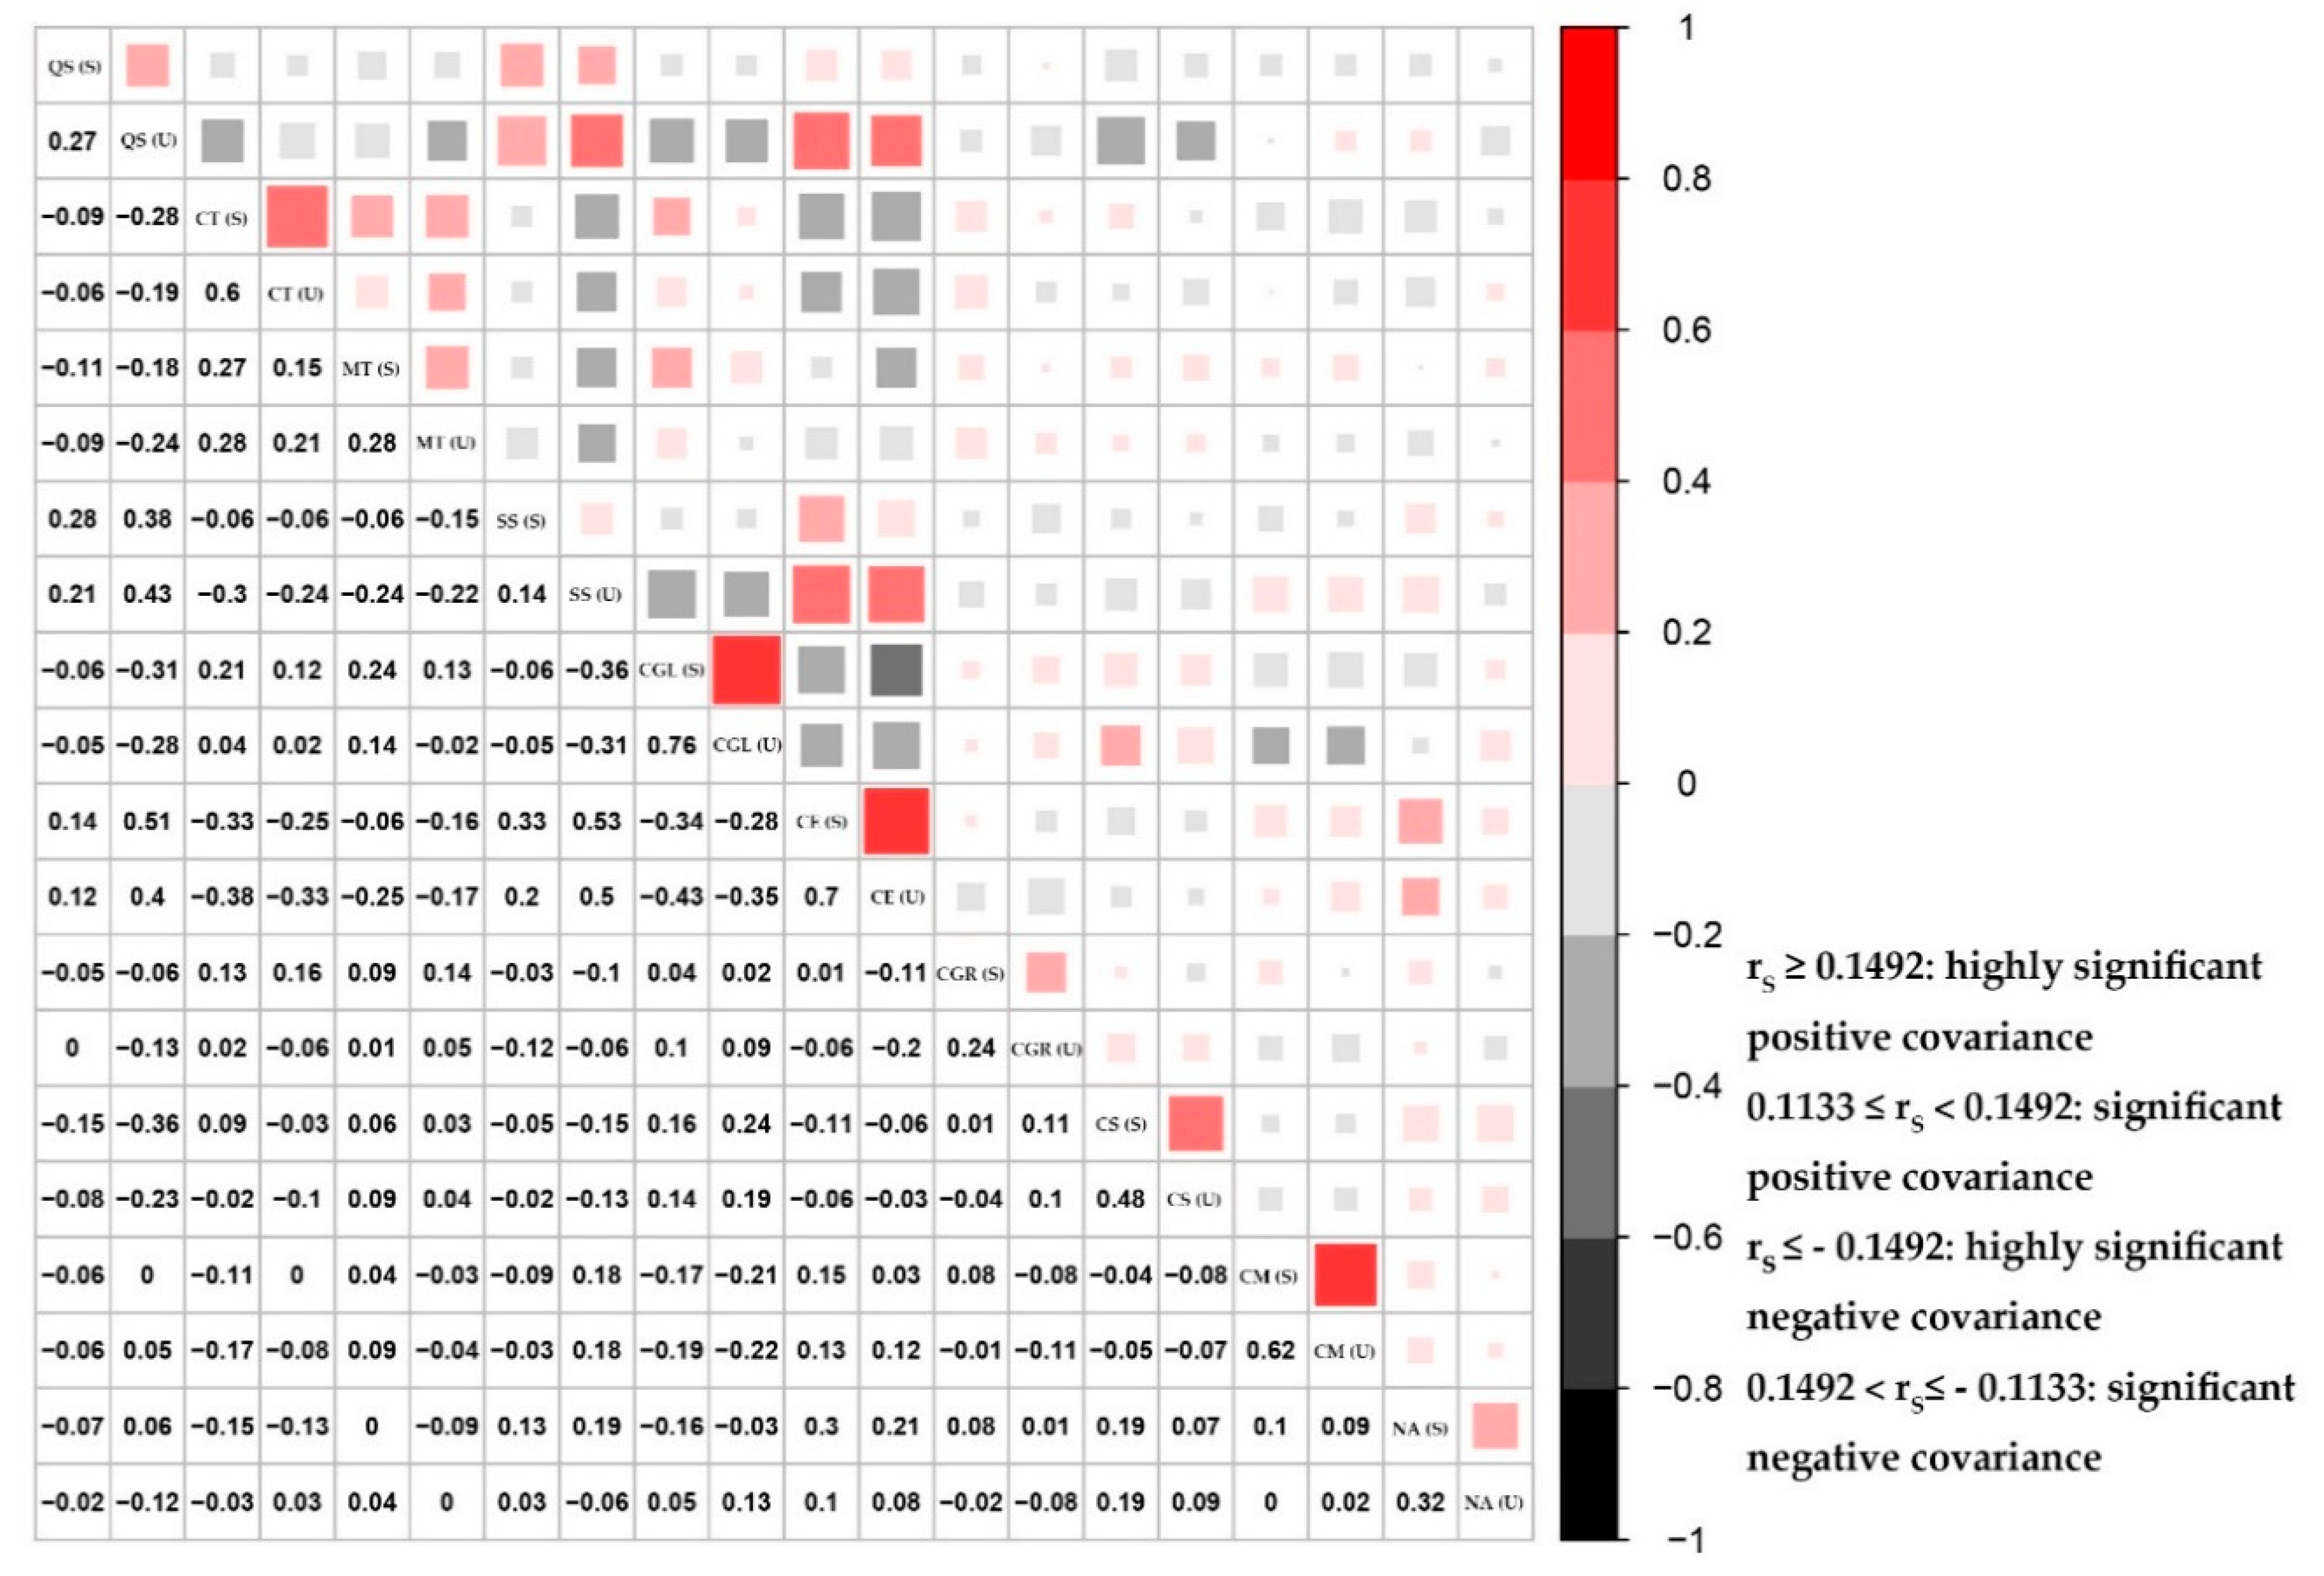
3.3.3. Measure of Pairwise Species Covariance

Although the DI quantitatively describes the degree of species association, it does not provide an indicator of the species pairwise covariance. The SRCC was calculated to investigate species covariance. The results are shown in Figure 5. Among all 190 species pairs, 37 pairs (19.5%) exhibited highly significant positive covariance (rs ≥ 0.1492, p ≤ 0.01) and 14 pairs (7.4%) exhibited significant positive covariance (0.1133 ≤ rs < 0.1492, p ≤ 0.05). Additionally, 35 pairs showed highly significant negative covariance (rs ≤ −0.1492, p ≤ 0.01), accounting for 18.4% of the total pairs; 7 pairs exhibited significant negative covariance (−0.1492 < rs ≤ −0.1133, p ≤ 0.05), accounting for 3.7% of the total pairs.

4. Discussion

4.1. Final Determination of Species Associations

The overall species association describes the static relationship among all species in the community and reflects the stability of the community structure and species composition [50,51]. A significant overall net positive association was observed in the old-growth forest, indicating that it has a stable structure and its species composition is in a dynamic balance. Additionally, a mutually beneficial relationship may exist.
The results of the χ2 test, DI, and SRCC were consistent but there were also some differences. The χ2 test has been widely used to determine species association; however, it does not provide information on the degree of association [59]. Although the DI quantitatively describes species association and outperforms the χ2 test, it is based on binary data, which inevitably leads to a loss of information. In a comparison study, it was demonstrated that the SRCC was suitable for the use of continuous data to evaluate the degree of linear association or correlation between independent variables; it is also unaffected by the distribution of the population [47,52]. Therefore, the SRCC is well suited to be used in conjunction with the χ2 test for determining species association. Many authors [60,61,62,63] suggested that the combination of the χ2 test and the SRCC was necessary to provide reliable results.
In this study, we determined the final species association based on the χ2 test and the SRCC with the DI as supporting information. We grouped the species associations into four categories according to their priority when conducting enrichment planting. Species pairs that exhibited significant associations in both the χ2 test and SRCC and whose DI values indicated strong associations were given first priority. Species pairs that exhibited significant associations in both the χ2 test and SRCC but whose DI values did not indicate strong associations were given secondary priority. Species pairs that exhibited significant associations in either the χ2 test or SRCC and had DI values that indicated strong associations were given third priority. The fourth priority pairs refer to pairs that exhibited significant associations either the χ2 test or SRCC and whose DI values did not indicate strong associations. The four categories of species pairs are listed in Table 2.

4.2. Possible Reasons for the Observed Species Associations

Species pairs with significant positive associations normally share similar ecological characteristics and hence have similar environmental requirements. This similarity means that they are closely associated and coexist well [23,24,25,64]. This was fully supported by our results. For instance, the thermophilic and barren-tolerant species pair (S. superba (U)–C. eyrei (U)) and the fertile- and acid-loving species pair (C. tibetana (U)–M. thunbergii (U)) were significantly associated. Although coexistence may result in competition, overall, a significant positive association was exhibited [23,65].
We observed significant positive interspecific associations between saplings and non-parental adult trees pairs, e.g., S. superba (S)–Q. serrata (U), C. eyrei (S)–Q. serrata (U), C. tibetana (S)–M. thunbergii (U), and M. thunbergii (S)–C. glauca (U). This positive association was attributed to the niche differentiation of resources utilization [25,66]. A similar finding was also reported by Zhao et al. [23] who reported a positive association between the saplings of Vitis amurensis and the adult trees of Abies nephrolepis. The authors attributed the positive association to the shady environment provided by the adult trees of A. nephrolepis since the saplings of V. amurensis require shade. Additionally, in the present study, all saplings were observed to have a significant positive intraspecific association with their parent trees, i.e., the sapling was able to survive and develop under the adult trees of the same species. Many authors found similar results and attributed it to the limited seed dispersal ability [23,25,67,68].
Conversely, the pairs with significant negative associations, e.g., Q. serrata (U)–C. tibetana (U), Q. serrata (U)–M. thunbergii (U), and C. glauca (S)–N. aurata var. chekiangensis (S) have different habitat requirements and interspecific competition occurs in cases of resource scarcity. Consistent with our findings are results that have been reported in the studies [23,25,69].

4.3. Implications for Enrichment Planting

Most natural degraded forest have a degraded canopy, which results in lower efficient of photosynthesis in comparation to vigorous canopy [70,71]. Additionally, the forest is usually comprised of low-value tree species [72]. Furthermore, due to forest fragmentation, the seed dispersal mechanism is often problematic, resulting in a lack of natural regeneration of high-value tree species and late-successional tree species [72,73]. Therefore, it is necessary to conduct enrichment planting with positively associated, high-value, late-successional tree species.
Information on species associations provides a theoretical basis for enrichment planting [51]. Additionally, the light requirement of tree species are also an important factor in species arrangement for enrichment planting [74,75]. Generally, tree species are grouped into shade-intolerant species, shade-tolerant species, and opportunistic species according to their light requirements [76,77]. Shade-intolerant species are usually pioneer species that easily regenerate and become established in large stand gaps or in open areas [78,79]. These species are well suited for planting in sufficiently large gaps or in open areas. In comparison, shade-tolerant tree species can regenerate in moderate shade and are usually found in larger numbers in the understory of forests [78,79]. These species are particularly suited for planting under the canopy during the restoration of natural degraded forests. Opportunist or non-pioneer shade-intolerant species are species with intermediate light demand and can regenerate in or even require shade for germinating seedlings but require more light when mature [79]. These tree species are characterized by their high adaptability and robustness and hence are suited for all types of restoration of natural degraded forests.
We provide the following suggestions for enrichment planting based on species association and the light requirement of tree species. For forest gaps and relatively large openings, the following positively associated shade-intolerant species or opportunistic species are recommended: Q. serrata var. brevipetiolata (U)–S. superba (U), Q. serrata var. brevipetiolata (U)–C. eyrei (U), S. superba (U)–C. eyrei (U), S. superba (S)–C. eyrei (S), Q. serrata var. brevipetiolata (S)–S. superba (S), and Q. serrata var. brevipetiolata (S)–C. eyrei (S). Since there may not always be gaps or openings in natural degraded forests, it might be necessary to create gaps in dense parts of forests.
In the understory, the saplings of shade-tolerant species, which have significant positive associations with the nearby adult tree, are recommended for under-planting. These tree pairs include M. thunbergii (S)–M. thunbergii (U), M. thunbergii (S)–C. glauca (U), C. glauca (S)–C. glauca (U), C. subavenium (S)–C. glauca (U), N. aurata var. chekiangensis (S)–C. eyrei (U), C. subavenium (S)–C. subavenium (U), C. subavenium (S)–N. aurata var. chekiangensis (U), C. myrsinifolia (S)–C. myrsinifolia (U), N. aurata var. chekiangensis (S)–N. aurata var. chekiangensis (U), C. glauca (S)–M. thunbergii (U), M. thunbergii (S)–C. tibetana (U), C. gracilis (S)–C. tibetana (U), C. myrsinifolia (S)–S. superba (U), C. eyrei (S)–C. myrsinifolia (U), C. gracilis (S)–C. gracilis (U), C. glauca (S)–C. tibetana (U), C. gracilis (S)–M. thunbergii (U), C. glauca (S)–C. subavenium (U), and C. subavenium (S)–C. gracilis (U). In addition to the species arrangement for saplings and adult trees, positively associated sapling pairs, i.e., M. thunbergii (S)–C. glauca (S), C. subavenium (S)–N. aurata var. chekiangensis (S), and C. glauca (S)–C. subavenium (S) are recommended to be planted together.
In contrast, it is necessary to avoid planting saplings that have a significant negative association with nearby adult trees. For instance, it is suggested to avoid planting the saplings of C. subavenium and M. thunbergii under the adult trees of Q. serrata var. brevipetiolata, the saplings of C. tibetana and M. thunbergii under the adult trees of S. superba, and the saplings of M. thunbergii and C. glauca under the adult trees of C. eyrei. Additionally, negatively associated sapling pairs are not recommended to be planted together, i.e., C. tibetana (S)–C. eyrei (S), C. glauca (S)–C. eyrei (S), C. glauca (S)–C. myrsinifolia (S), C. glauca (S)–N. aurata var. chekiangensis (S), Q. serrata var. brevipetiolata (S)–C. subavenium (S), and C. tibetana (S)–C. myrsinifolia (S).

5. Conclusions

In this study, we investigated the overall association of dominant species as well as the intra- and interspecies associations among saplings and adult trees in an old-growth forest in the Gutianshan National Nature Reserve, Zhejiang province. A significant overall net positive association was observed in the old-growth forest, indicating that it has a stable structure and its species composition is in a dynamic balance. Based on the intra- and interspecies associations and light requirement of the species, we drew the following conclusions: (1) positively associated shade-intolerant species or opportunistic species are suggested for planting in gaps or large forest openings; (2) shade-tolerant species, which have significant positive associations with the nearby adult tree, are suggested for planting under the tree canopy; (3) positively associated shade tolerant sapling pairs are also suggested for planting under the tree canopy; (4) it is necessary to avoid planting saplings that have a significant negative association with nearby adult trees; (5) negatively associated sapling pairs are not suggested to be planted together. It is expected that the results of this study will contribute to the restoration of natural degraded forest in subtropical China.

Author Contributions

All authors made significant contributions to the manuscript: J.M., Y.Z., W.M., and Z.L. conceived, designed, and performed the experiments; Z.L. and J.W. analyzed the data and results; Y.Z. contributed reagents/materials/analysis tools; J.M. and Z.L. are the main authors who developed and revised the manuscript.

Funding

This research was funded by the National Natural Science Foundation of China, grant number 31870408.

Acknowledgments

We thank our colleagues at the Gutianshan National Nature Reserve for their support during fieldwork.

Conflicts of Interest

The authors declare no conflict of interest.

References

  1. Administration, S.F. China Forest Resource Report (2014–2018); China Forestry Press: Beijing, China, 2019. [Google Scholar]
  2. Yang, X.F.; Bauhus, J.; Both, S.; Fang, T.; Härdtle, W.; Kröber, W.; Ma, K.P.; Nadrowski, K.; Pei, K.Q.; Scherer-Lorenzen, M.; et al. Establishment success in a forest biodiversity and ecosystem functioning experiment in subtropical china (BEF-China). Eur. J. For. Res. 2013, 132, 593–606. [Google Scholar] [CrossRef]
  3. Veloso, M.G.; Dieckow, J.; Zanatta, J.A.; Bayer, C.; Higa, R.C.; Brevilieri, R.C.; Comerford, N.B.; Stoppe, A.M. Reforestation with loblolly pine can restore the initial soil carbon stock relative to a subtropical natural forest after 30 years. Eur. J. For. Res. 2018, 137, 593–604. [Google Scholar] [CrossRef]
  4. Chen, C.R.; Xu, Z.H.; Mathers, N.J. Soil carbon pools in adjacent natural and plantation forests of subtropical australia. Soil Sci. Soc. Am. J. 2004, 68, 282–291. [Google Scholar] [CrossRef]
  5. Liu, S.R.; Shi, Z.M.; Ma, J.M.; Zhao, C.M.; Zhang, Y.D.; Liu, X.L. Ecological strategies for restoration and reconstruction of degraded natural forests on the upper reaches of the yangtze river. Sci. Silvae Sin. 2009, 45, 120–124. [Google Scholar]
  6. Liu, S.R. Ecological Restoration Principle and Techniques of Natural Forest; China Forestry Publishing House: Beijing, China, 2011. [Google Scholar]
  7. Liu, S.R.; Ma, J.M.; Miao, N. Achievements in natural forest protection, ecological restoration, and sustainable management in china. Acta Ecol. Sin. 2015, 35, 212–218. [Google Scholar]
  8. Daily, G.C. Restoring value to the world’s degraded lands. Science 1995, 269, 350–354. [Google Scholar] [CrossRef]
  9. Zhou, B.; Wang, G.; Tang, Y.S.; Zhang, W.Y.; Zang, R.G. Zoning of degraded natural forests in mountain areas of southwest china. For. Res. 2010, 23, 612–616. [Google Scholar]
  10. Silvestrini, M.; Cysneiro, A.D.D.; Lima, A.L.; Veiga, L.G.; Isernhagen, I.; Tamashiro, J.Y.; Gandolfi, S.; Rodrigues, R.R. Natural regeneration in abandoned fields following intensive agricultural land use in an atlantic forest island, brazil. Rev. Árvore 2012, 36, 659–671. [Google Scholar] [CrossRef]
  11. Silvestrini, M.; Dos Santos, F.A.M. Variation in the population structure between a natural and a human-modified forest for a pioneer tropical tree species not restricted to large gaps. Ecol. Evol. 2015, 5, 2420–2432. [Google Scholar] [CrossRef] [PubMed]
  12. Herrera, J.M.; Garcia, D. Effects of forest fragmentation on seed dispersal and seedling establishment in ornithochorous trees. Conserv. Biol. 2010, 24, 1089–1098. [Google Scholar] [CrossRef]
  13. Lamb, D.; Erskine, P.D.; Parrotta, J.A. Restoration of degraded tropical forest landscapes. Science 2005, 310, 1628–1632. [Google Scholar] [CrossRef] [PubMed]
  14. Blay, D. Tropical secondary forest management in humid Africa: Reality and perspectives. In Proceedings of the Fao Workshop on Tropical Secondary Forest Management in Africa, Nairobi, Kenya, 9–13 December 2002. [Google Scholar]
  15. Hoffmann, S.; Jaeger, D.; Shuirong, W. Adapting chinese forest operations to socio-economic developments: What is the potential of plantations for strengthening domestic wood supply? Sustainability 2018, 10, 1042. [Google Scholar] [CrossRef]
  16. Delang, C.O. China’s Soil Pollution and Degradation Problems; Routledge: Abingdon, UK, 2017. [Google Scholar]
  17. Sun, X.F.; Canby, K.; Liu, L.J. China’s Logging Ban in Natural Forests: Impacts of Extended Policy at Home and Abroad; Forest Trends Association: Washington, DC, USA, 2016. [Google Scholar]
  18. Wilson, E. Multiaged silviculture: Managing for complex forest stand structures. Int. For. Rev. 2015, 17, 115–116. [Google Scholar]
  19. Puettmann, K.J.; Wilson, S.M.; Baker, S.C.; Donoso, P.J.; Drössler, L.; Amente, G.; Harvey, B.D.; Knoke, T.; Lu, Y.C.; Nocentini, S. Silvicultural alternatives to conventional even-aged forest management-what limits global adoption? For. Ecosyst. 2015, 2, 8. [Google Scholar] [CrossRef]
  20. O’Hara, K.L. What is close-to-nature silviculture in a changing world? For. Int. J. For. Res. 2016, 89, 1–6. [Google Scholar] [CrossRef]
  21. Favre, L.A.; Oberson, J.M. 111 années d’application de la méthode du contrôle à la forêt de couvet|111 years of application of the method of control in the community forest of couvet. Schweiz. Z. Forstwes. 2002, 153, 298–313. [Google Scholar] [CrossRef]
  22. Zhang, Z.H.; Hu, G.; Zhu, J.D.; Luo, D.H.; Ni, J. Spatial patterns and interspecific associations of dominant tree species in two old-growth karst forests, SW China. Ecol. Res. 2010, 25, 1151–1160. [Google Scholar] [CrossRef]
  23. Zhao, H.Y.; Kang, X.G.; Guo, Z.Q.; Yang, H.; Xu, M. Species interactions in spruce–fir mixed stands and implications for enrichment planting in the Changbai Mountains, China. Mt. Res. Dev. 2012, 32, 187–197. [Google Scholar] [CrossRef]
  24. Jiang, J.; Lu, Y.C.; Pang, L.F. Analysis on interspecific association and management modes of the tree species for plantation in southern subtropical zone, China. For. Resour. Manag. 2014, 6, 79–84. [Google Scholar]
  25. Hao, Z.Q.; Zhang, J.; Song, B.; Ye, J.; Li, B.H. Vertical structure and spatial associations of dominant tree species in an old-growth temperate forest. For. Ecol. Manag. 2007, 252, 1–11. [Google Scholar] [CrossRef]
  26. Chai, Z.Z.; Sun, C.L.; Wang, D.X.; Liu, W.Z. Interspecific associations of dominant tree populations in a virgin old-growth oak forest in the Qinling Mountains, China. Bot. Stud. 2016, 57, 23. [Google Scholar] [CrossRef] [PubMed]
  27. Greig-Smith, P. Quantitative Plant Ecology; University of California Press: Berkeley, CA, USA, 1983. [Google Scholar]
  28. Cole, L.C. The measurement of interspecific associaton. Ecology 1949, 30, 411–424. [Google Scholar] [CrossRef]
  29. Li, G.; Zhu, Z.H.; Wang, X.A.; Guo, H. Interspecific association of trees species in quercus wutaiensis communities in ziwu mountain related to quadrat size. Chin. J. Ecol. 2008, 27, 689–696. [Google Scholar]
  30. Zhao, Z.H.; Zu, Y.G.; Yang, F.J.; Cong, P.T. Study on the sampling technique of interspecific association of ligneous plant in quercus liaotungensis forest in Dongling Mountain. Acta Phytoecol. Sin. 2003, 27, 396–403. [Google Scholar]
  31. Xie, T.; Ju, T.Z.; Shi, H.X.; Fan, Z.H.; Yang, G.K.; Zhang, S.Z. Interspecific association of rare and endangered pinus bungeana community in Xiaolongshan of Gansu. Chin. J. Ecol. 2010, 29, 448–453. [Google Scholar]
  32. Yang, C.Y.; Liu, S.F.; Yu, L.F. Interspecific associations of dominant tree species with restoration of a karst forest. J. Zhejiang For. Coll. 2010, 27, 44–50. [Google Scholar]
  33. Paluch, J.G.; Bartkowicz, L.E. Spatial interactions between scots pine (Pinus sylvestris L.), common oak (Quercus robur L.) and silver birch (Betula pendula Roth.) as investigated in stratified stands in mesotrophic site conditions. For. Ecol. Manag. 2004, 192, 229–240. [Google Scholar] [CrossRef]
  34. White, D.L.; Lloyd, F.T. Defining old growth: Implications for management. Presentation at the 8th Biennial Southern Silvicultural Research Conference, Auburn, AL, USA, 1–3 November 1994. [Google Scholar]
  35. Lund, H.G. Definitions of Old Growth, Pristine, Climax, Ancient Forests, Degradation, Desertification, Forest Fragmentation, and Simiar Terms (Definitions of Forest State, Stage, and Origin); Forest Information Services: Gainesville, VA, USA, 2005. [Google Scholar]
  36. Abrams, M.D.; Copenheaver, C.A. Temporal variation in species recruitment and dendroecology of an old-growth white oak forest in the virginia piedmont, USA. For. Ecol. Manag. 1999, 124, 275–284. [Google Scholar] [CrossRef]
  37. Nagel, T.A.; Zenner, E.K.; Brang, P. Research in old-growth forests and forest reserves: Implications for integrated forest management. In Integrative Approaches as an Opportunity for the Conservation of Forest Biodiversity; European Forest Institute: Freiburg, Germany, 2013; pp. 44–50. [Google Scholar]
  38. Du, Y.J.; Mi, X.C.; Liu, X.J.; Chen, L.; Ma, K.P. Seed dispersal phenology and dispersal syndromes in a subtropical broad-leaved forest of china. For. Ecol. Manag. 2009, 258, 1147–1152. [Google Scholar] [CrossRef]
  39. Feng, G.; Zhang, J.L.; Pei, N.C.; Rao, M.D.; Mi, X.C.; Ren, H.B.; Ma, K.P. Comparison of phylobetadiversity indices based on community data from gutianshan forest plot. Chin. Sci. Bull. 2012, 57, 623–630. [Google Scholar] [CrossRef]
  40. Hu, Z.H.; Yu, M.J.; Ding, B.Y.; Fang, T.; Qian, H.Y.; Chen, Q.C. Types of evergreen broad-leaved forests and their species diversity in gutian mountain national nature reserve. Chin. J. Appl. Environ. Biol. 2003, 9, 341–345. [Google Scholar]
  41. Lou, L.H.; Jin, S.H. Spermatophyta flora of gutianshan nature reserve in Zhejiang. J. Beijing For. Univ. 2000, 22, 33–39. [Google Scholar]
  42. Legendre, P.; Legendre, L. Developments in Numerical Ecology; Springer Science & Business Media: Berlin, Germany, 2013. [Google Scholar]
  43. Lamont, B.B.; Downes, S.; Fox, J.E. Importance–value curves and diversity indices applied to a species-rich heathland in Western Australia. Nature 1977, 265, 438–441. [Google Scholar] [CrossRef]
  44. Wiryani, E. The Abundance and Importance Value of Tree in “Sendang Kalimah Toyyibah” Surrounding and its Implication to the Spring; IOP Publishing: Semarang, Indonesia, 2018. [Google Scholar]
  45. Schluter, D. A variance test for detecting species associations, with some example applications. Ecology 1984, 65, 998–1005. [Google Scholar] [CrossRef]
  46. Chow, K.V.; Denning, K.C. A simple multiple variance ratio test. J. Econom. 1993, 58, 385–401. [Google Scholar] [CrossRef]
  47. Ludwig, J.A.; Quartet, L.; Reynolds, J.F. Statistical Ecology: A Primer in Methods and Computing; John Wiley & Sons: New York, NY, USA, 1988. [Google Scholar]
  48. Hong, W.; Chen, M.X. Calculation and application of interspecific association of broad-leaved trees in the North Fujian. Sci. Silvae Sin. 1990, 26, 175–181. [Google Scholar]
  49. Zar, J.H. Biostatistical Analysis; Prentice-Hall: Upper Saddle River, NJ, USA, 1974. [Google Scholar]
  50. Su, S.J.; Liu, J.F.; He, Z.S.; Zheng, S.Q.; Hong, W.; Xu, D.W. Ecological species groups and interspecific association of dominant tree species in daiyun mountain national nature reserve. J. Mt. Sci. 2015, 12, 637–646. [Google Scholar] [CrossRef]
  51. Gu, L.; Gong, Z.W.; Li, W.Z. Niches and interspecific associations of dominant populations in three changed stages of natural secondary forests on loess plateau, PR China. Sci. Rep. 2017, 7, 6604. [Google Scholar] [CrossRef]
  52. Gautheir, T.D. Detecting trends using spearman’s rank correlation coefficient. Environ. Forensics 2001, 2, 359–362. [Google Scholar] [CrossRef]
  53. Hurlbert, S.H. A coefficient of interspecific assciation. Ecology 1969, 50, 1–9. [Google Scholar] [CrossRef]
  54. Bishara, A.J.; Hittner, J.B. Testing the significance of a correlation with nonnormal data: Comparison of pearson, spearman, transformation, and resampling approaches. Psychol. Methods 2012, 17, 399–417. [Google Scholar] [CrossRef]
  55. Team, R.C. A Language and Environment for Statistical Computing; R Project; R Foundation for Statistical Computing: Vienna, Austria, 2019. [Google Scholar]
  56. Zhang, J.L. Spaa: Species Association Analysis, R Package version 0.2.2; R Foundation for Statistical Computing: Vienna, Austria, 2016. [Google Scholar]
  57. Hadley, W. The Split-apply-combine strategy for data analysis. J. Stat. Softw. 2011, 40, 1–29. [Google Scholar]
  58. Wei, T.; Simko, V. R package “corrplot”: Visualization of a Correlation Matrix (Version 0.84). Available online: https://github.com/taiyun/corrplot (accessed on 1 August 2017).
  59. Xue, O.; Wei, T.X. Interspecific association among understory species of the low-efficiency plantation in the jiufeng national forest park. Bull. Bot. Res. 2016, 36, 34–42. [Google Scholar]
  60. Li, J.; Xie, F.; Chen, C.; Zhang, S.; Xiao, R.; Zhang, D. Interspecif ic association of dominant species in Betula luminifera natural forest communities of Shaowu, Fujian Province. Chin. J. Appl. Ecol. 2001, 12, 168–170. [Google Scholar]
  61. Mundry, R.; Fischer, J. Use of statistical programs for nonparametric tests of small samples often leads to incorrect pvalues: Examples from animal behaviour. Anim. Behav. 1998, 56, 256–259. [Google Scholar] [CrossRef]
  62. Dezfuli, B.; Giari, L.; De Biaggi, S.; Poulin, R. Associations and interactions among intestinal helminths of the brown trout, salmo trutta, in northern Italy. J. Helminthol. 2001, 75, 331–336. [Google Scholar] [CrossRef]
  63. Lun, Z.; Hai, Y.; Kun, C. Relationship between microcystin in drinking water and colorectal cancer. Biomed. Environ. Sci. 2002, 15, 166–171. [Google Scholar]
  64. Chen, Q.; Chen, J.; Zhong, J.J.; Ji, L.T.; Kang, B. Interspecific association and functional group classification of the dominant populations in shrub layer in secondary forest of pinus tabuliformis in Qinling Mountain, China. J. Appl. Ecol. 2018, 29, 1736–1744. [Google Scholar]
  65. Kobe, R.K.; Vriesendorp, C.F. Conspecific density dependence in seedlings varies with species shade tolerance in a wet tropical forest. Ecol. Lett. 2011, 14, 503–510. [Google Scholar] [CrossRef]
  66. Yang, H.; Wu, Y. Species composition, age structure and regeneration strategies in broad-leaved Korean pine mixed forest in Changbai Mountain. Sci. Silvae Sin. 1988, 24, 18–27. [Google Scholar]
  67. Du, Z.; Kang, X.; Meng, J.; Kong, L.; Guo, W.; Yue, G. Spatial distribution pattern and association of dominant tree species in poplar-birch secondary forest stand in Changbai Mountains. J. Northeast For. Univ. 2013, 41, 36–42. [Google Scholar]
  68. Grubb, P.J. The maintenance of species-richness in plant communities: The importance of the regeneration niche. Biol. Rev. 1977, 52, 107–145. [Google Scholar] [CrossRef]
  69. Liu, J.H.; Hong, W.; Fan, H.B.; Lin, R.F. Study on the inter-specific association of species in the vegetation layer in castanopsis kawakamii forest. Sci. Silvae Sin. 2001, 37, 117–123. [Google Scholar]
  70. Wu, C.; Wang, Z.; Fan, Z. Significance of senescence study on tree roots and its advances. J. Appl. Ecol. 2004, 15, 1276–1280. [Google Scholar]
  71. Ma, L.Q. Relations of photosynthetic area of crown leaves and potential use of solar energy to crown profile area. J. Ecol. 1986, 5, 23–26. [Google Scholar]
  72. Chazdon, R.L. Second Growth: The Promise of Tropical Forest Regeneration in an Age of Deforestation; University of Chicago Press: Chicago, IL, USA, 2014. [Google Scholar]
  73. Aide, T.M.; Zimmerman, J.K.; Pascarella, J.B.; Rivera, L.; Humfredo, M.V. Forest regeneration in a chronosequence of tropical abandoned pastures: Implications for restoration ecology. Restor. Ecol. 2000, 8, 328–338. [Google Scholar] [CrossRef]
  74. Oliver, C.D.; Larson, B.C. Forest Stand Dynamics; Wiley: New York, NY, USA, 1996. [Google Scholar]
  75. Gu, L.; O’Hara, K.L.; Li, W.Z.; Gong, Z.W. Spatial patterns and interspecific associations among trees at different stand development stages in the natural secondary forests on the Loess Plateau, China. Ecol. Evol. 2019. [Google Scholar] [CrossRef]
  76. Lamprecht, H. Tropical forest ecosystems and their tree species. In Siliviculture in Tropics, Possibilities and Methods for Their Long-Term Utilization; Institute of for Siliviculture of the University of Gottingen, Technical Cooperation of Federal Republic of Germany: Berlin, Germany, 1989. [Google Scholar]
  77. Swaine, M.D.; Hall, J.B. Early succession on cleared forest land in Ghana. J. Ecol. 1983, 71, 601–627. [Google Scholar] [CrossRef]
  78. Poorter, L. Biodiversity of West African Forests: An Ecological Atlas of Woody Plant Species; CABI: Wallingford, UK, 2004. [Google Scholar]
  79. Hill, J.L.; Curran, P.J. Area, shape and isolation of tropical forest fragments: Effects on tree species diversity and implications for conservation. J. Biogeogr. 2003, 30, 1391–1403. [Google Scholar] [CrossRef]
Figure 1. The location of the study site in the Gutianshan National Nature Reserve in Kaihua County, Zhejiang province, China. The red star represents the Gutianshan National Nature Reserve.
Forests 10 00957 g001
Figure 2. The DBH class distributions of dominant species in the old-growth forest.
Forests 10 00957 g002
Figure 3. Correlation matrix of the χ2 test results of the dominant species in the old-growth forest.
Forests 10 00957 g003
Figure 4. Correlation matrix of the Dice index (DI) results of the dominant species in the old-growth forest.
Forests 10 00957 g004
Figure 5. Correlation matrix of the Spearman’s rank correlation coefficient (SRCC) of the dominant species in the old-growth forest.
Forests 10 00957 g005
Table 1. The importance values and characteristics of the top ten dominant tree species in the old-growth forest.
Latin NameAcronymDensity (Trees ha–1)Mean DBH (cm)Basal Area (m2 ha–1)Light Requirement 1Relative AbundanceRelative FrequencyRelative DominanceImportance Value
Castanopsis eyreiCE21320.80.0121OP23.0432.3914.5923.34
Schima superbaSS19720.10.0367SI21.3027.0812.3320.24
Cyclobalanopsis glaucaCGL9014.50.0408ST9.736.178.468.12
Machilus thunbergiiMT4120.30.0408ST4.435.636.695.58
Quercus serrata var. brevipetiolataQS7611.40.0204SI8.263.114.835.40
Neolitsea aurata var. chekiangensis NA327.20.0451ST3.420.485.403.10
Cinnamomum subaveniumCS317.20.0340ST3.390.454.922.92
Cyclobalanopsis myrsinifoliaCM2514.90.0043ST2.701.823.632.72
Castanopsis tibetanaCT2017.60.0216OP2.162.473.062.57
Cyclobalanopsis gracilisCGR1818.40.0045ST2.022.143.222.46
1 SI: shade-intolerant species; ST: shade-tolerant species; OP: opportunistic species.
Table 2. The classification of tree species association pairs for the species arrangement.
Significant Positive AssociationsSignificant Negative Associations
First priorityQ. serrata (U)–S. superba (S), Q. serrata (U)–S. superba (U), Q. serrata (U)–C. eyrei (S), Q. serrata (U)–C. eyrei (U), C. tibetana (S)–C. tibetana (U), C. tibetana (S)–M. thunbergii (S), C. tibetana (S)–M. thunbergii (U), C. tibetana (S)–C. glauca (S), M. thunbergii (S)–M. thunbergii (U), M. thunbergii (S)–C. glauca (S), M. thunbergii (S)–C. glauca (U), S. superba (S)–C. eyrei (S), S. superba (S)–C. eyrei (U), S. superba (S)–N. aurata var. chekiangensis (S), S. superba (U)–C. eyrei (S), S. superba (U)–C. eyrei (U), S. superba (U)–N. aurata var. chekiangensis (S), C. glauca (S)–C. glauca (U), C. glauca (U)–C. subavenium (S), C. eyrei (S)–C. eyrei (U), C. eyrei (S)–N. aurata var. chekiangensis (S), C. eyrei (U)–N. aurata var. chekiangensis (S), C. subavenium (S)–C. subavenium (U), C. subavenium (S)–N. aurata var. chekiangensis (S), C. subavenium (S)–N. aurata var. chekiangensis (U), C. myrsinifolia (S)–C. myrsinifolia (U), N. aurata var. chekiangensis (S)–N. aurata var. chekiangensis (U), M. thunbergii (U)–C. glauca (S), C. glauca (S)–C. subavenium (S)Q. serrata (U)–C. tibetana (S), Q. serrata (U)–C. tibetana (U), Q. serrata (U)–M. thunbergii (U), Q. serrata (U)–C. glauca (S), Q. serrata (U)–C. glauca (U), Q. serrata (U)–C. subavenium (S), Q. serrata (U)–C. subavenium (U), C. tibetana (S)–S. superba (U), C. tibetana (S)–C. eyrei (S), C. tibetana (S)–C. eyrei (U), C. tibetana (U)–S. superba (U), C. tibetana (U)–C. eyrei (S), C. tibetana (U)–C. eyrei (U), C. tibetana (S)–C. myrsinifolia (U), M. thunbergii (S)–S. superba (U), M. thunbergii (S)–C. eyrei (U), S. superba (U)–C. glauca (S), S. superba (U)–C. glauca (U), C. glauca (S)–C. eyrei (S), C. glauca (S)–C. eyrei (U), C. glauca (S)–C. myrsinifolia (S), C. glauca (S)–C. myrsinifolia (U), C. glauca (S)–N. aurata var. chekiangensis (S), C. glauca (U)–C. eyrei (S), C. glauca (U)–C. eyrei (U), C. glauca (U)–C. myrsinifolia (S), C. glauca (U)–C. myrsinifolia (U), C. eyrei (U)–C. gracilis (U), Q. serrata (S)–C. subavenium (S), Q. serrata (U)–M. thunbergii (S), C. tibetana (S)–C. myrsinifolia (S), C. tibetana (S)–N. aurata var. chekiangensis (S), M. thunbergii (U)–S. superba (S), M. thunbergii (U)–S. superba (U)
Second priorityQ. serrata (S)–Q. serrata (U), Q. serrata (S)–S. superba (S), C. tibetana (U)–M. thunbergii (S), C. tibetana (U)–M. thunbergii (U), C. tibetana (U)–C. gracilis (S), S. superba (U)–C. myrsinifolia (S), S. superba (U)–C. myrsinifolia (U), C. glauca (U)–C. subavenium (U), C. eyrei (S)–C. myrsinifolia (U), C. gracilis (S)–C. gracilis (U), C. tibetana (S)–C. gracilis (S), C. tibetana (U)–C. glauca (S), M. thunbergii (U)–C. gracilis (S), C. glauca (S)–C. subavenium (U), C. glauca (U)–N. aurata var. chekiangensis (U), C. eyrei (U)–C. myrsinifolia (U)-
Third priority-S. superba (U)–C. subavenium (S)
Fourth priorityQ. serrata (S)–S. superba (U), C. eyrei (S)–C. myrsinifolia (S), Q. serrata (S)–C. eyrei (S), Q. serrata (S)–C. eyrei (U), S. superba (S)–S. superba (U), C. gracilis (U)–C. subavenium (S)M. thunbergii (U)–C. eyrei (S), M. thunbergii (U)–C. eyrei (U), Q. serrata (U)–C. gracilis (U), Q. serrata (U)–N. aurata var. chekiangensis (U), C. tibetana (U)–N. aurata var. chekiangensis (S), S. superba (S)–C. gracilis (U), S. superba (U)–C. subavenium (U)

