Article

Spatio–Temporal Changes of Forests in Northeast China: Insights from Landsat Images and Geospatial Analysis

1
Key Laboratory of Wetland Ecology and Environment, Northeast Institute of Geography and Agroecology, Chinese Academy of Sciences, Changchun 130102, China
2
University of Chinese Academy of Science, Beijing 100049, China
3
National Earth System Science Data Center, Beijing 100049, China
4
College of Computer and Information Sciences, Fujian Agriculture and Forestry University, Fuzhou 350002, China
*
Author to whom correspondence should be addressed.
Forests 2019, 10(11), 937; https://doi.org/10.3390/f10110937
Submission received: 17 September 2019 / Revised: 18 October 2019 / Accepted: 21 October 2019 / Published: 23 October 2019

Abstract

:
Dramatic changes of forests have strong influence on regional and global carbon cycles, biodiversity, and ecosystem services. Understanding dynamics of forests from local to global scale is crucial for policymaking and sustainable development. In this study, we developed an updating and object-based image analysis method to map forests in Northeast China using Landsat images from 1990 to 2015. The spatio–temporal patterns of forests were quantified based on resultant maps and geospatial analysis. Results showed that the percentage of forested area occupying the entire northeast China was more than 40%, about 94% of initial forest cover remained unchanged (49.37 × 10⁴ km2) over the course of 25 years. A small net forest loss (1051 km2) was observed during 1990–2015. High forest gain (10,315 km2) and forest loss (9923 km2) both occurred from 2010 to 2015. At the provincial level, Heilongjiang demonstrated the highest rate of deforestation, with a net loss of 1802 km2 (0.89%). Forest changes along elevation, slope, and distance from settlements and roads were also investigated. Over 90% of forest changes occurred in plains and low mountain areas within the elevation of 200–1000 m and slope under 15°. The most dramatic forest changes can be found within the distance of 2000 m from settlements and roads. The reclamation of sloping land, construction of settlements and roads, and possible smallholder clearing contributed more to forest loss, while ecological projects and related government policies play an important role on afforestation and reforestation. These results can provide useful spatial information for further research on the driving forces and consequences of forest changes, which have critical implications for scientific conservation and management of forests.

1. Introduction

Forests cover nearly one-third of the world’s area [1] and changes in forests have strong influence on biodiversity, carbon cycles, water supply, climate change, and ecosystem service [2,3]. High accuracy forest maps are needed for supporting investigation of the changes in carbon fluxes, carbon stock, and ecosystem services by scientists and managers [4]. However, considerable uncertainties still exist in the spatial distribution of forest cover and deforestation from local to global scale [5]. Accurate and up-to-date forest maps can improve on existing knowledge of forest extent and changes, and provide a better understanding of the consequences of forest cover change, supporting scientific and sustainable management of forests [6].
Northeast China is home to the largest area of forested land in China [7], which is an important production base for timber supply as well as the significant regional ecological shelter [8]. Prior to 1998, excessive logging and reclamation nearly led to the exhaustion of the exploitable forests in this region [9]. With the rising awareness of forest ecological significance, several ecological programs have been formally carried out since the late 1990s, including the Natural Forest Protection Program, the Logging Ban Program, the Key Forest Shelterbelt Construction Program, and the Grain-for-Green Program [10,11]. The forest harvesting quota in northeast China then decreased and forest cover has gradually increased [9]. However, these factors taken together lead to questions regarding the distribution, changes, and recovery conditions of forests in northeast China. Information on forests at the national level were mainly provided by official statistics in China [12]; we know little about the detailed spatial and temporal patterns of deforestation or afforestation across northeast China. Such information is necessary for spatially explicit decision-making concerning forest conservation and management. Hence, improved and dynamic forest cover monitoring is needed in designing sustainable policies for forest management.
Remote sensing is the most effective tool for identifying spatial and temporal trends in vegetation [13] and has been widely applied for forest mapping at regional and global scales [14]. Coarse resolution images such as NOAA/AVHRR (1 km resolution) and MODIS (250 m ~ 1 km resolution) can be used to investigate the dynamics of large, homogeneous patches, but are not suitable for the extraction of fragmented patches. Very high-resolution images (<1 m spatial resolution) can provide more details about forests, but they are not applicable for forest monitoring at large areas due to high monetary and computational costs [15]. Active microwave remote sensing images such as Sentinel-1, Japanese Earth Resource Satellite 1 (JERS-1), and Advanced Land Observing Satellite (ALOS) Phased Array type L-band Synthetic Aperture Radar (PALSAR) have been used for mapping forests in mainland southeast Asia [16], south of America [4,17], China [14,15,18], and globally [19]. However, these studies were inhibited by insufficient continuous SAR data and were confined over a short period of time. Freely accessed Landsat imagery enables continuous forest cover updates with moderate spatial resolution from regional to biome scales [20]. In recent years, several global land cover products have been generated from Landsat images (30 m resolution), such as fine resolution observation and monitoring global land cover (FROM-GLC) [21], global forest change (GFC) [3], and GlobeLand30 [22], but timely and long-term datasets of forest changes are still unavailable. Furthermore, all global products with considerable errors may underestimate or overestimate the forest change at a regional scale [23]. To date, most studies still focus on the mono-temporal precise mapping of forests [20,24], the dynamics of forest changes over a period of decades have rarely been investigated at a regional scale.
Differences in drivers of forest dynamics from local to global scale vary due to natural and human-induced factors such as geographic, economic, development history, and policy factors. Among geographic factors, topographic variables, including elevation, slope, aspect, or topographical indices, are the factors most widely used in differentiating vegetation patterns [13]. Previous studies have documented that human activities are important environmental variables influencing forest dynamics [23,25]. Land accessibility (distance to roads and settlements) were often selected as the indicators for exploring the relations between forest dynamics and anthropogenic drivers [25,26,27]. Most of these studies have examined the contributions of influencing factors through statistical methods [18,28]. However, spatial precision information of the relationship between forest dynamics and potential drivers was limited explored, which is crucial for forest monitoring and would provide insights into sustainable development and scientific management of forests.
Therefore, the main objectives of this study are the following: (i) generate forest cover maps of northeast China by an updating and object-oriented classification approach using Landsat images in 1990, 2000, 2010 and 2015; (ii) characterize the spatio–temporal dynamics of forests based on resultant maps produced from Landsat data; and (iii) explore the geographical patterns of forest changes under different topographical gradients and land accessibilities during 1990–2015 based on geospatial analysis.

2. Materials and Methods

2.1. Study Area

Northeast China is located from 115°31’E to 134°47’E and from 38°42’N to 53°34’N, consists of the provinces of Heilongjiang (HLJ), Jilin (JL), Liaoning (LN) and the eastern part of the Inner Mongolia Autonomous Region (IMAR), and has a total land area of about 1.24 million km2 (Figure 1). The study area is influenced by temperate continental monsoon climate, which varies from warm temperate to temperate and cool temperate from south to north, and from humid to semi-humid and semi-arid from east to west. The annual average temperature is 11.5 °C ~ −4 °C and the annual average precipitation is 250 mm ~ 1100 mm [7]. The topography of northeast China is characterized by central plains surrounded by mountains and elevation is around 50 m ~ 2700 m above sea level. Forests are mostly distributed in the Changbai Mountains, Greater Khingan Mountains, and Lesser Khingan Mountains, which are dominated by Dahurian larch (Larix gmelini), Korean pine (Pinus koraiensis), spruce (Picea koraiensis), fir (Abies nephrolepsis), basswood (Tilia amurensis), mongolian oak (Quercus mongolica), birch (Betual platyphyua), and aspen (Populous davidiana) [29].

2.2. Landsat Imagery

The entirety of northeast China is covered by 105 Landsat image footprints (Path 113–126 and Row 22–33) at each time period. We used a total of 536 Landsat TM/ETM+/OLI images (30 m resolution) with less than 10% cloud cover to map forests in northeast China from 1990 to 2015, most of which were acquired from late May through early October. These images were freely downloaded from the USGS Earth Resources Observation and Science (EROS) data center [30]. In this study, atmospheric correction and geometric correction were performed for all images to improve the radiation and geolocation precision through ENVI software. In the rough terrain areas, ASTER GDEM (30 m resolution) acquired from the USGS website [31] was used for image ortho-rectification.

2.3. Forest Mapping with an Updating and Object-Based Image Analysis (OBIA) Approach

Object-based image analysis (OBIA) has become increasingly popular for land cover classification over the last decade [32] and is proven to be economical and efficient at large scale through use of more effective, transparent, and repeatable analytical processes [33]. The updating approach has potential to update land cover dataset effectively [34,35], which integrate the post-classification and change detection approaches [36]. To achieve the goals of our forest classification, we integrated the updating approach and OBIA to map forests from 1990 to 2015 shown in Figure 2.
Firstly, we produced the forest map of northeast China (NECF-2010) using Landsat images (30 m) from 2010 and the OBIA approach demonstrated in a previous study in northeast China [7]. The first step of the OBIA is to implement multi-scale segmentation; image objects were created through segmenting pixels by specified parameters: scale, shape, and compactness. The segmentation parameters were tested and the scale parameter was set to be 30. The shape, compactness factors and image layer weights were empirically optimized to ensure the best results for delineation of forests for each scene of imagery. The classification rules were generated based on the statistical analysis of the training areas from the field surveys and images. The mean normalized difference vegetation index (NDVI) and mean enhanced vegetation index (EVI) was calculated to identify forest objects. Visual interpretation and manual editing based on expert knowledge largely contributed to the modification of omission and commission errors of forests. In this study, eCognition Developer 8.64 was used to perform OBIA for forest classification.
This NECF-2010 map served as a thematic layer for the segmentation of image in 2015. This process will limit the generated objects to across any of the borders separating thematic classes of NECF-2015 map. Change detection in the OBIA was implemented to identify change and no change objects; and the details of this approach were documented in previous studies [36,37]. The final forest map of 2015 was produced from the merged layer with change and no change objects, which have been assigned corresponding attributes. The forest maps for 1990, 2000, and 2015 were generated separately using the updating and OBIA approach, from which we determined the gain, loss, and consistency of forests from the spatial analysis of forest maps.
Accurate field survey samples are critical to ensure reliable algorithms and valid results of classification [38]. Two rounds of field survey were conducted from July to September in 2011 and 2015 to collect ground reference data. The location of each field sample was documented by a global positioning system (GPS), with errors less than 10 m [7]. The field samples in 2011 included 1177 forest points and 1021 non-forest points, and the samples collected in 2015 included 971 forest points and 1083 non-forest points. Because of the lack of ground reference data in 1990 and 2000, 3066 samples were collected by visual inspection from very high resolution images available within Google Earth. The reference data gained in 1990, 2000, 2010, and 2015 consisted of 1531, 1535, 2198, and 2054 samples, respectively. The accuracy of the forest maps was assessed using ground reference data mentioned above. The overall accuracy, producer’s accuracy, user’s accuracy, and Kappa coefficient of classification were calculated for accuracy assessment.

2.4. Data Analysis

In this study, the definition of forest was adapted from the classes set by the United Nations Intergovernmental Panel on Climate Change (IPCC) [39], which specified tree cover >20% and tree height exceeding 0.5 m (Table 1). The quantity and pattern of forest changes in northeast China were quantified from 1990 to 2015. We defined a complete removal of tree cover as forest loss and the establishment of tree cover from a non-forest condition as forest gain at pixel level [3]. Then we generated maps of forest loss, forest gain, and stable and non-stable forest in northeast China by intersecting the forest maps between adjacent time periods. Forest change patches were classified into eleven groups with different patch size, i.e., 0–0.25, 0.25–0.5, 0.5–0.75, 0.75–1, 1–5, 5–10, 10–15, 15–20, 20–25, 25–50, and >50 ha. Patch number and accumulated area of forest change patches were calculated to explore the characteristics of fragmentation. Change areas within each province at different periods were calculated to identify period of dramatic change and hotspots among those provinces. Furthermore, we analyzed the spatial distribution of forest changes related to topographical factors and land accessibility (distance to settlements and roads). The elevation and slope attributes were obtained from DEM data (30-m) for the patches of forest changes. The elevations were classified into eight groups, i.e., 0–200, 200–400, 400–600, 600–800, 800–1000, 1000–1500, 1500–2000, and >2000 m. Slope gradients were classified into nine groups, i.e., 0–2.5°, 2.5°–5°, 5°–8°, 8°–10°, 10°–15°, 15°–20°, 20°–25°, 25°–35°, and >35°. The above classifications for topographic factors were used to examine the geographical characteristics of forest changes through overlaying forest change maps with topographic data. Settlements data were extracted from the ChinaCover dataset produced by the Chinses Academy of Sciences (CAS) [40], which has an overall accuracy greater than 94% [41]. The patches of settlements smaller than 5 km2 were eliminated, then the patches of villages, towns, and cities were kept for distance analysis. Roads, including railway and highway, were provided by National Geomatics Center of China (www.ngcc.cn) at a scale of 1:250000. The distance analysis between forest changes and the location of settlements and roads were conducted by Near Analysis of the ArcGIS software.
Additionally, the resultant forest map was compared with the other five forest products for the year of 2010 to discuss the uncertainty of forest mapping with remote sensing. The detailed information about these freely available forest products is presented in Table 1 along with our Landsat-based NECF map. We calculated and compared their forest areas at the provincial level in northeast China. The root mean square error (RMSE) was selected to illustrate the differences between Landsat-based forest map and the other forest products:
RMSE = t = 1 n ( x i y i ) 2 n ,
where, xi is the forest area of the ith province from the Landsat-based forest map in 2010; yi is the forest area of the ith province from the selected forest product in 2010; n is the total number of provinces in northeast China.

3. Results

3.1. Accuracy Assessment

Accuracy of the forest maps from 1990 to 2015 were assessed using the field validation points (Figure 1). The results revealed that the forest maps had reasonably good accuracies (Table 2). Forests had overall accuracies (OA) of 91%, 92%, 93%, and 94%, and the Kappa coefficients of 0.85, 0.87, 0.90, and 0.91 in 1990, 2000, 2010, and 2015, respectively. The producer accuracies (PA) were 91%, 95%, 93%, and 94%, and the user accuracies (UA) were 89%, 91%, 94%, and 94% in these resultant maps, respectively. This result indicated that it was feasible to monitor dynamics of forests based on these resultant forest maps in the four examined time periods.

3.2. Spatial and Temporal Changes of Forests in Northeast China

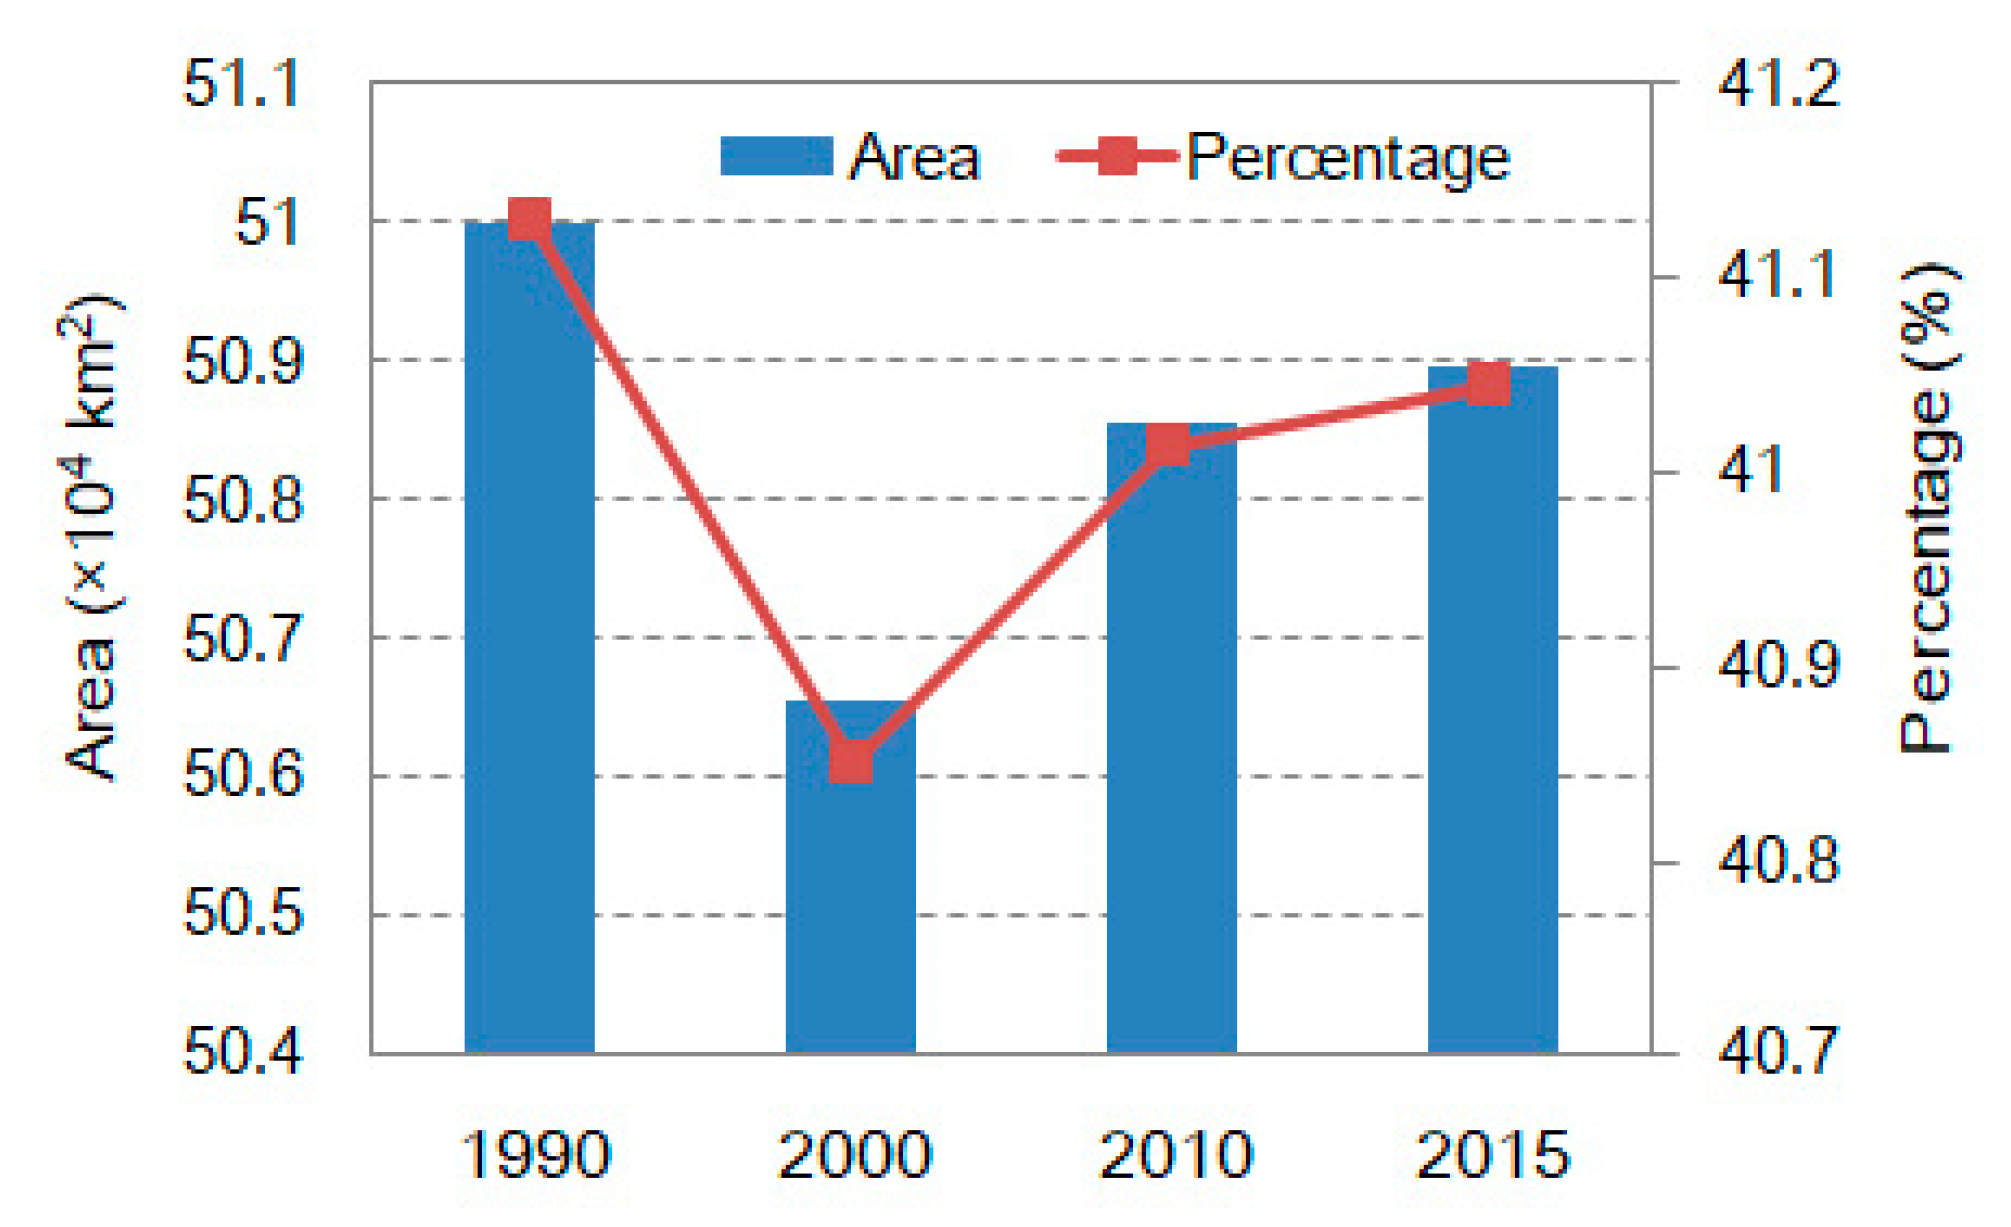
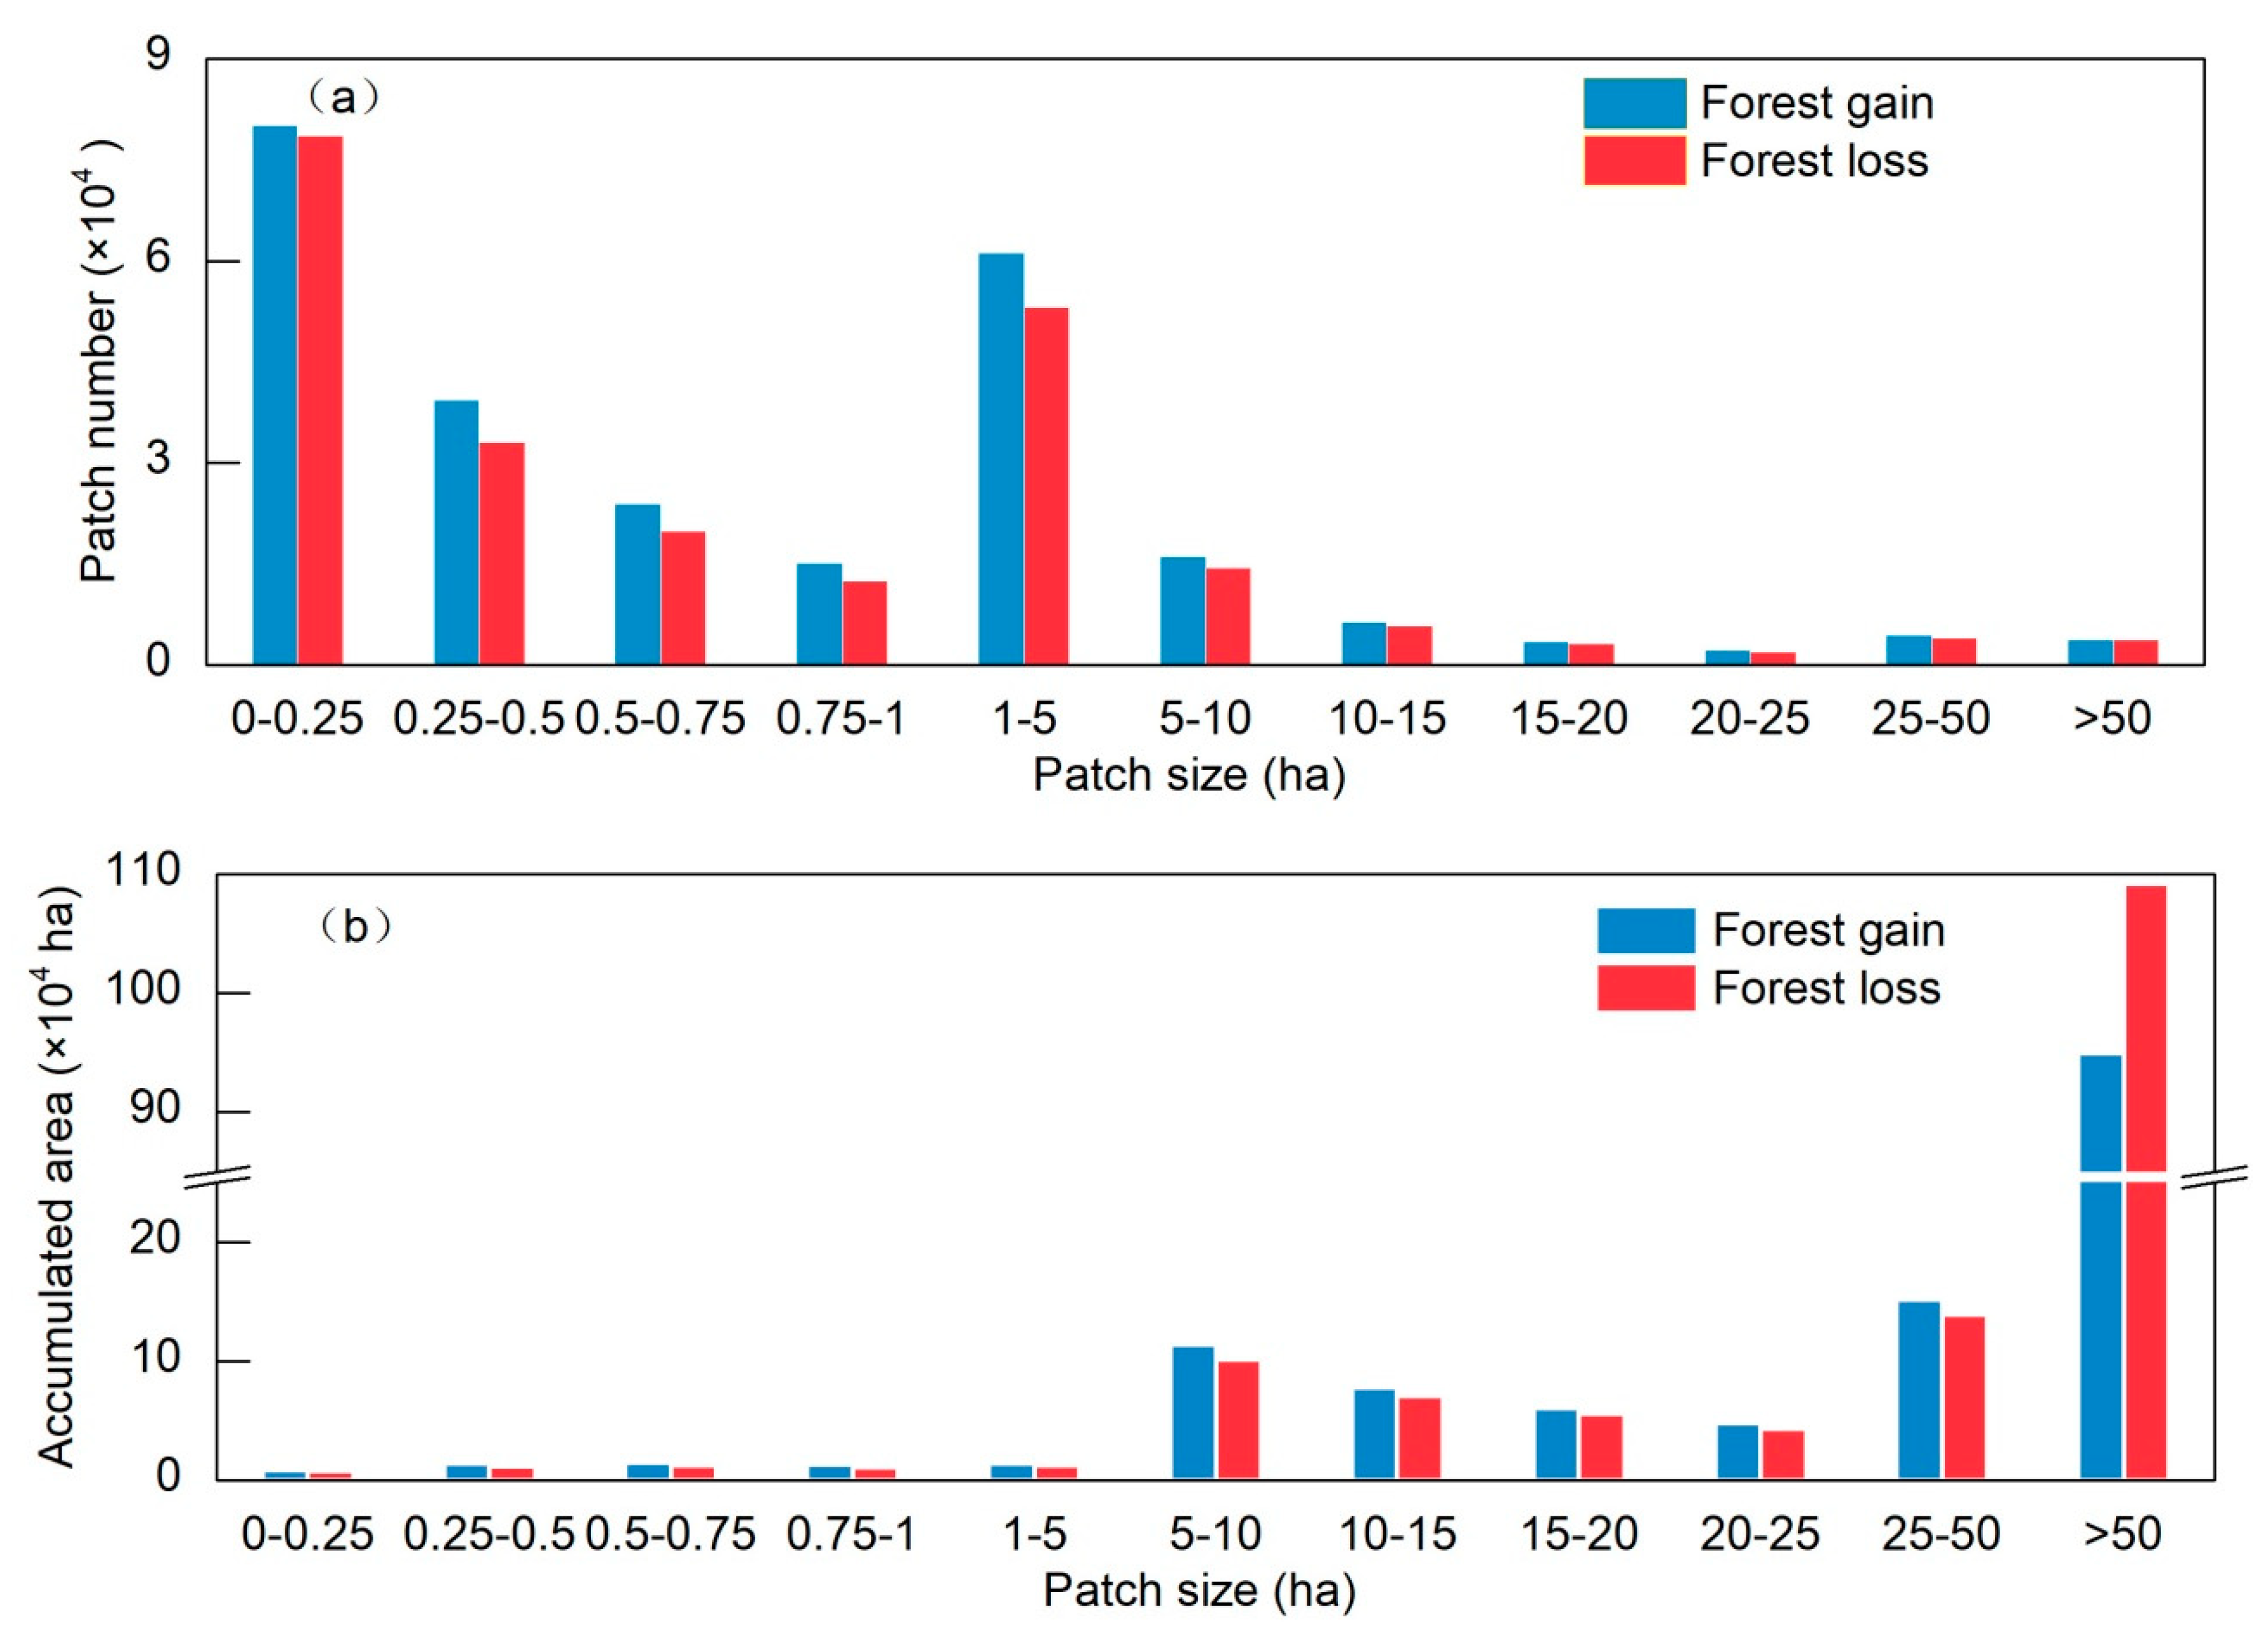
Total mapped forest areas in northeast China were 51.0 × 10⁴ km2, 50.66 × 10⁴ km2, 50.86 × 10⁴ km2, and 50.90 × 10⁴ km2, for 1990, 2000, 2010, and 2015, respectively (Figure 3). The percentage of forested area occupying the entire northeast China fluctuated from 40.85% to 41.13%. The forest maps from 1990 to 2015 had good spatial consistency (Figure 4 and Figure 5). The stable forest area from 1990 to 2015 was about 49.37 × 10⁴ km2 accounting for 94.02% of the total forest area and was mainly distributed in mountainous regions and surrounding lowlands (Figure 4). Forest gain and forest loss between 1990 and 2015 were spatially displayed in Figure 5. Few changes were found from 1990 to 2015, but fragmented change patches were observed in the transition areas between mountains and plains. Figure 6 shows the patch number and accumulated area of forest changes at different patch size levels. The largest patch number of forest changes was observed in the group of 0–0.25 ha followed by the group of 1–5 ha. Patch numbers of forest loss and forest gain less than 10 ha occupied 92% of total forest change patches in this study. Accumulated areas of forest changes within the group of patch size larger than 50 ha was highest compared with other groups. Accumulated areas of the groups patch size <5 ha were relatively smaller than other groups.
Analyses of forest maps between 1990 and 2015 showed a small net loss of the total forest area (1051 km2), accounting for only 0.21% of the total forest area in northeast China (Table 3). The annual rates of forest loss (623 km2 y−1) and gain (581 km2 y−1) were low, approximately 0.12% and 0.11% of the total forest area, respectively. High forest gain (10,315 km2) and forest loss (9923 km2) was found from 2010 to 2015, respectively. In addition to a net loss of forests (3454 km2) during 1990–2000, net forest gains were observed during the periods 2000–2010 and 2010–2015. The net gain of forests between 2000 and 2015 was 2403 km2 with an increasing rate of 160.2 km2 per year.
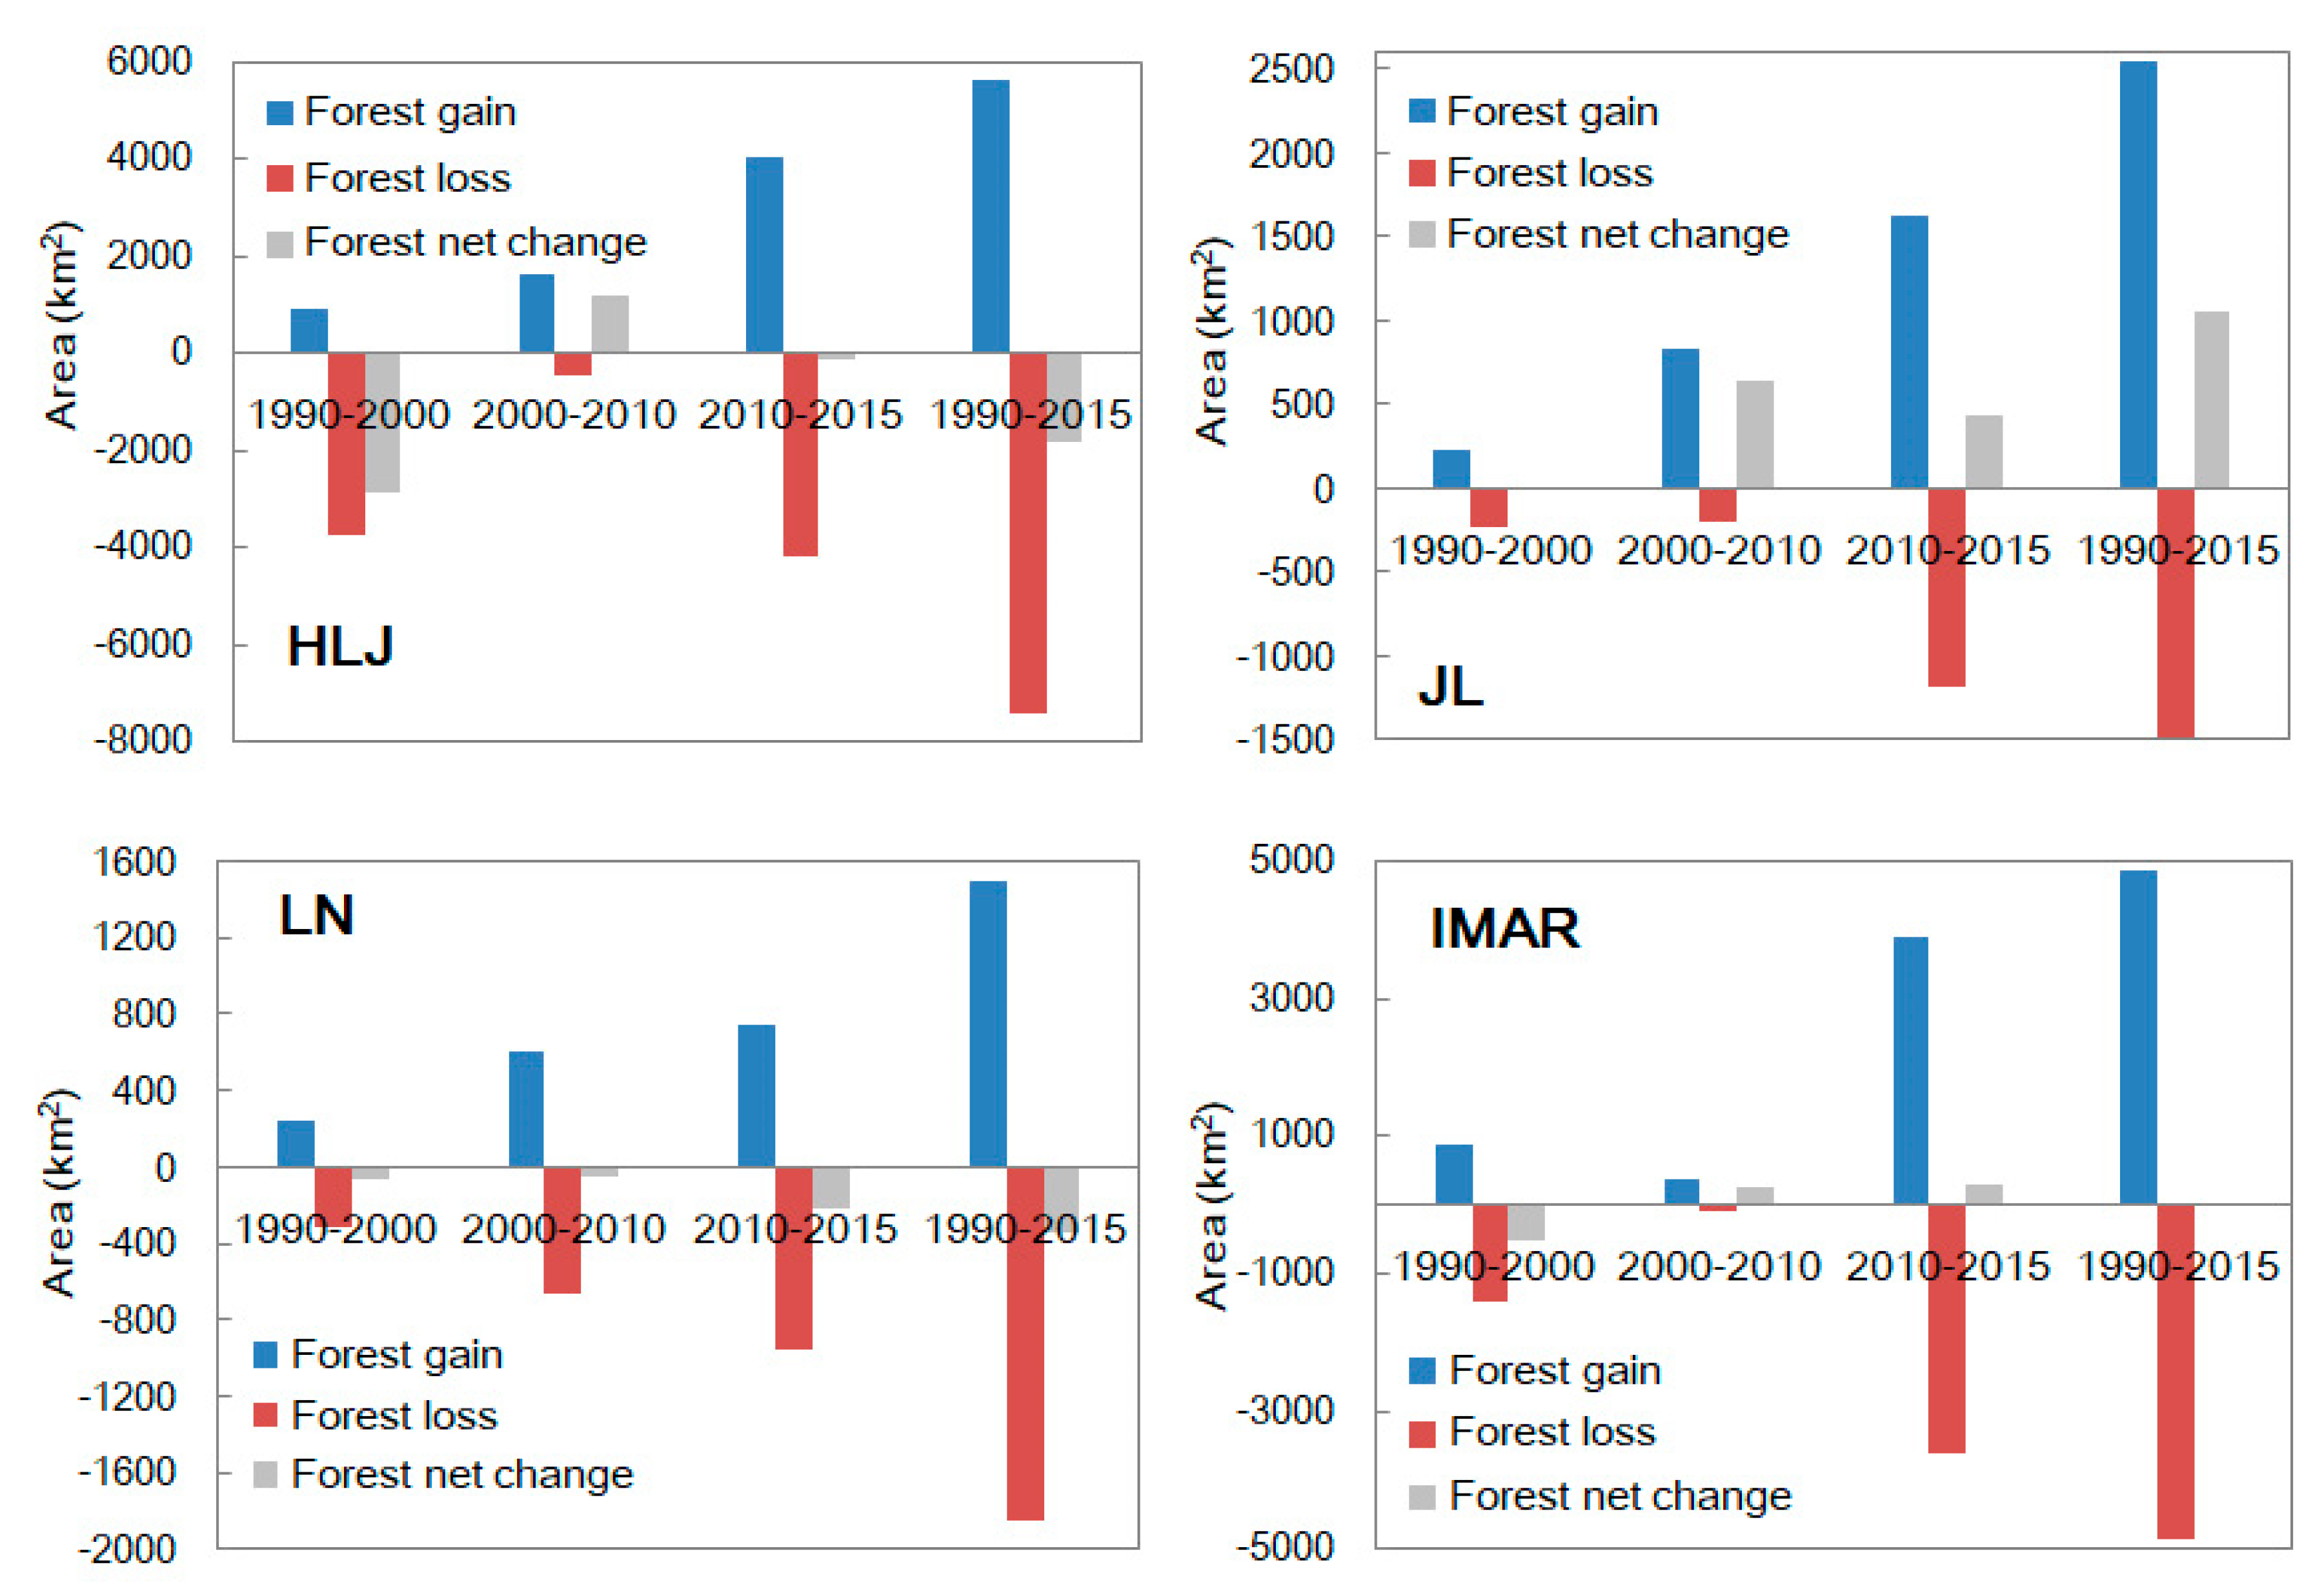
At the provincial level, HLJ and IMAR had the larger area of forests, occupying approximately 39.37% and 31.76% of total forest area in northeast China, respectively. While the forests in JL and LN only contributed about 16.78% and 12.08%. Figure 7 shows the forest gain, loss, and net change between 1990 and 2015 in the provinces of northeast China. In the past 25 years, a net loss of forests was observed in HLJ (1802 km2) and LN (350 km2). In contrast, JL showed a net gain of 1057 km2 and IMAR had almost no change. From 1990 to 2015, forest gain showed a continuous increase in the provinces of HLJ, JL, and LN, but forest loss shrunk between 2000 and 2010 in the provinces of HLJ, JL, and IMAR. High forest gain and forest loss were found during 2010–2015 at each province, which is consistent with the whole region of northeast China.

3.3. Geospatial Variation of Forest Changes in Northeast China

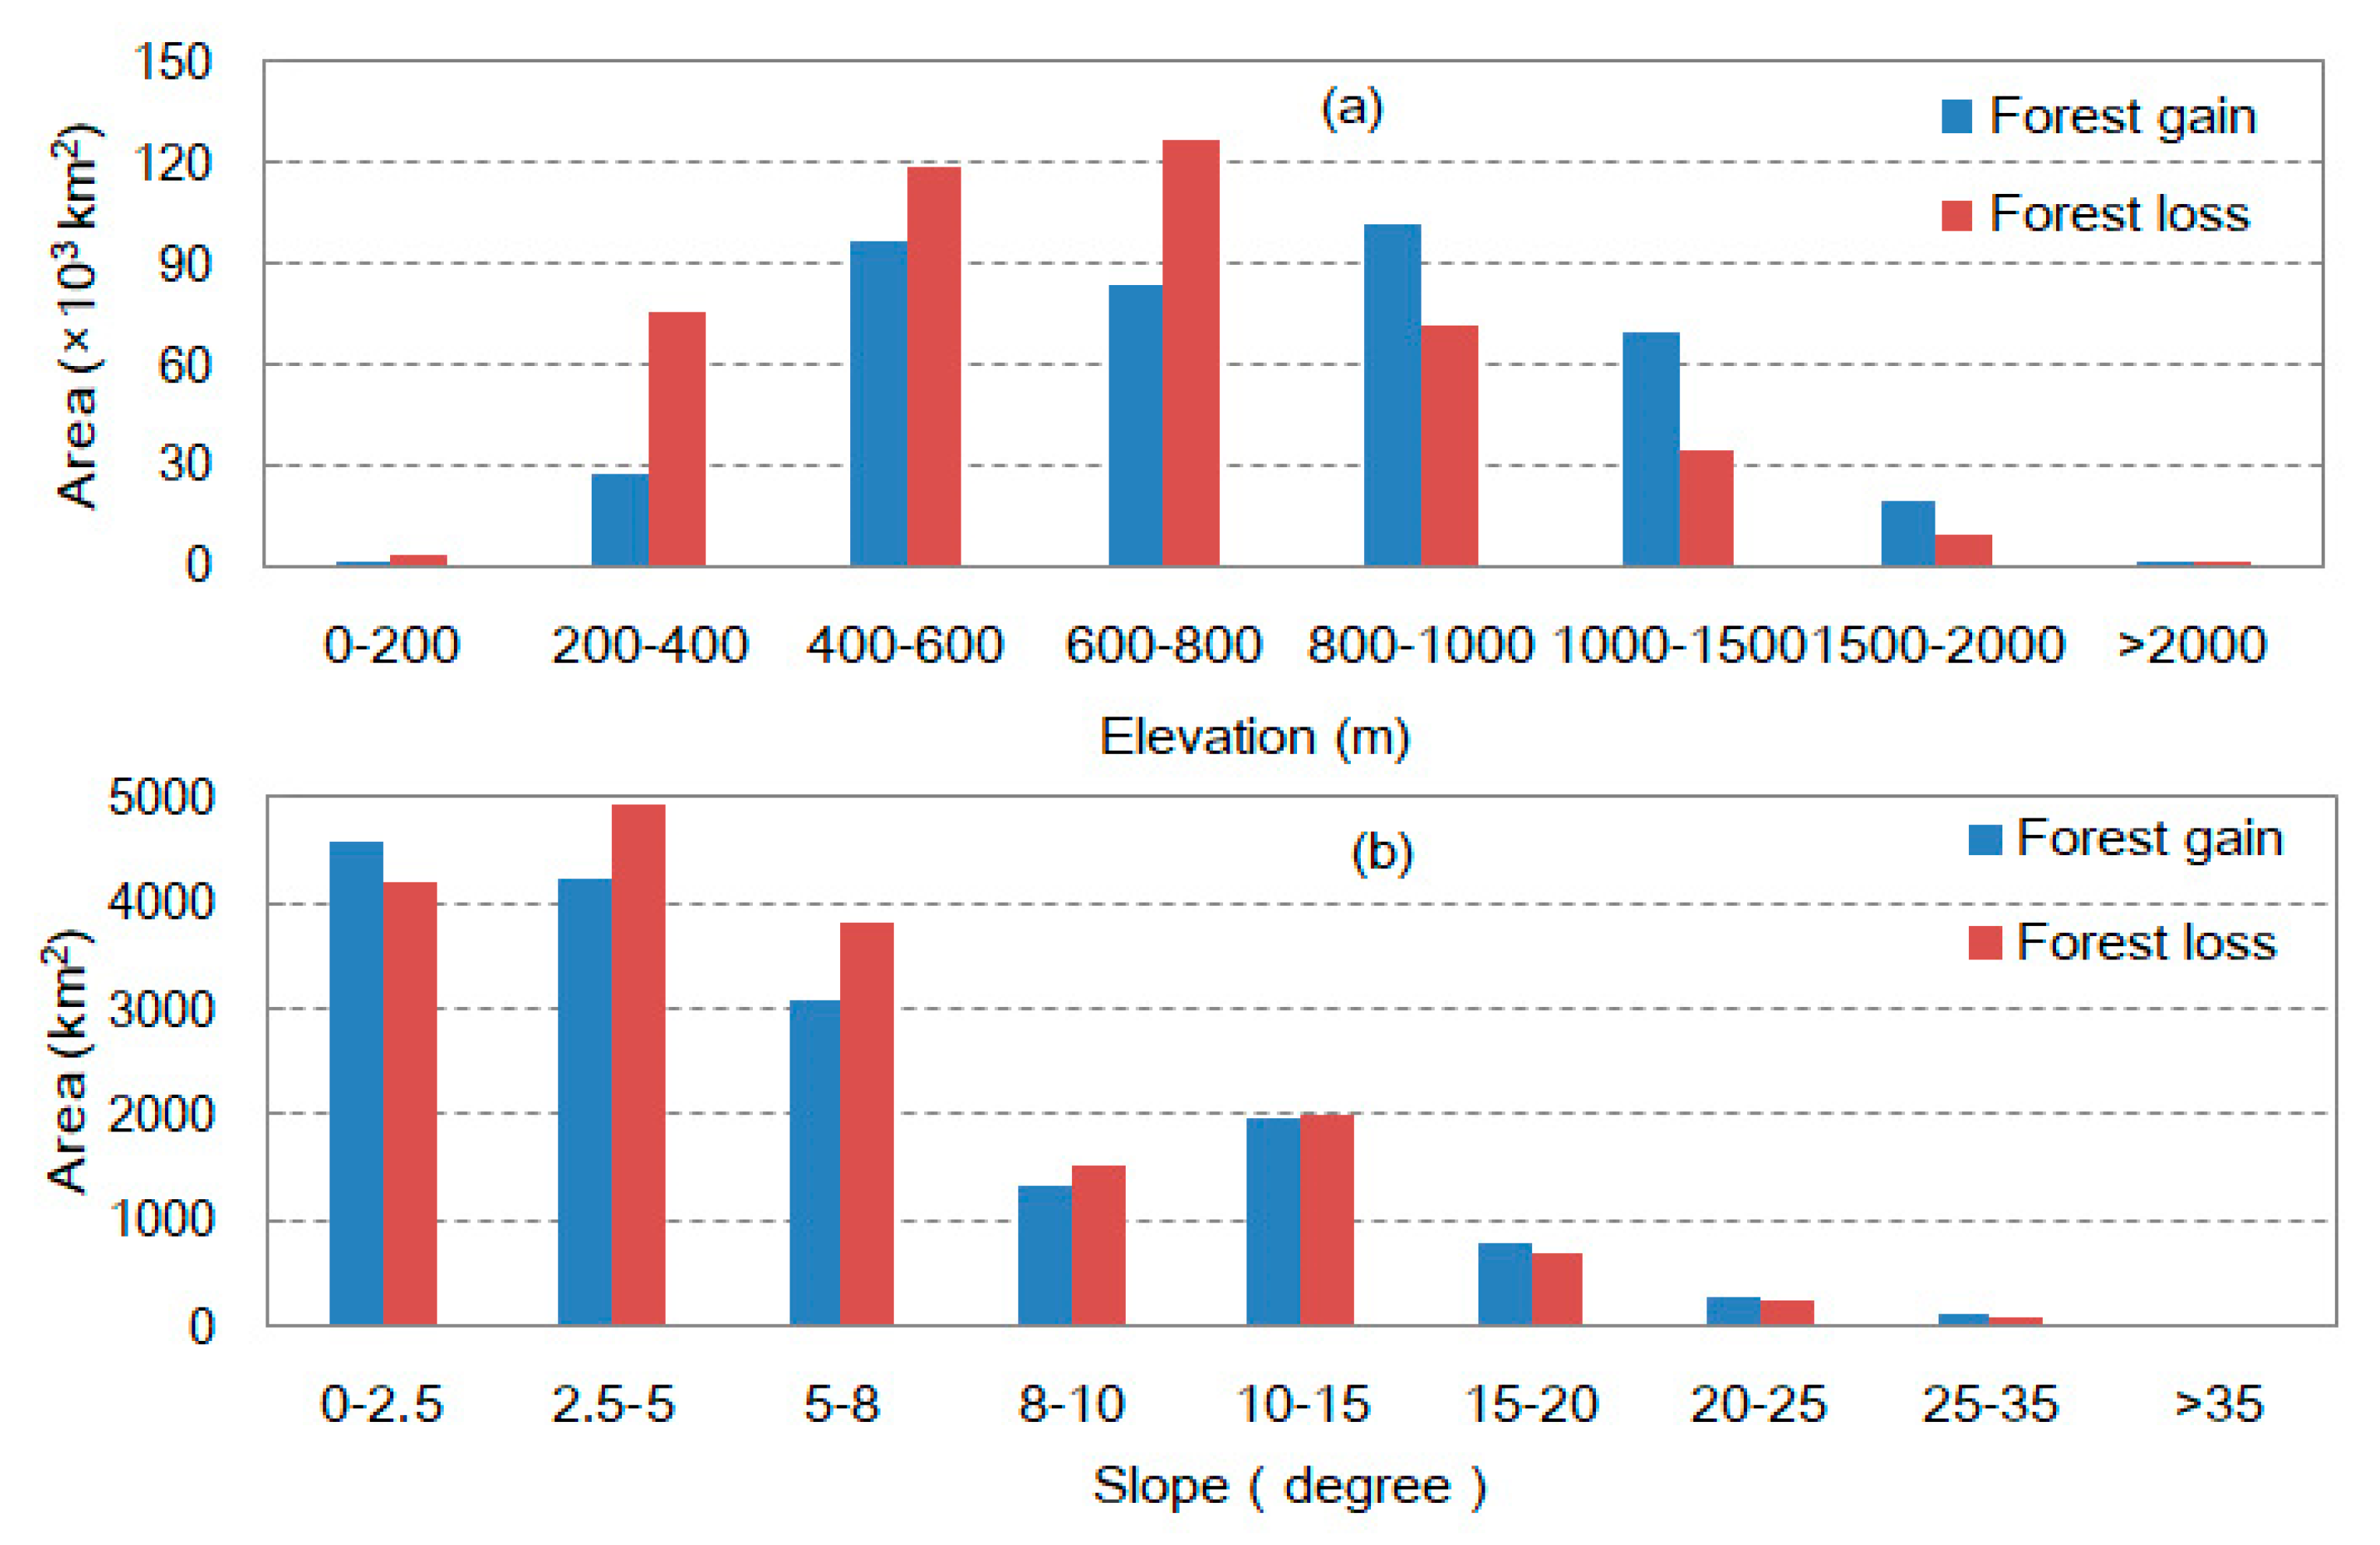
The geospatial characteristics of forest changes were investigated along elevation, slope, and distance from settlements and roads (Figure 8, Figure 9 and Figure 10). Nearly 90% of forest changes were found in plains and low mountain areas within the elevation of 200–1000 m and slope under 15° (Figure 8). The region within the elevation of 600-800 m experienced the largest forest loss, followed by the regions with elevation of 400–600 m and 200–400 m. Forest gain was mainly concentrated within the elevation of 400–1500 m, occupying approximately 88% of total forest gains. In terms of slope, forest gain and loss were larger than 3000 km2 at the slope group of 0–2.5°, 2.5–5°, and 5–8°, and they contributed more than 70% to the changes of forests. Furthermore, with the increase of slope, change area of forests gradually decreased.
Areas of forest changes decreased in a power function with the increasing distance from settlements and roads (Figure 9 and Figure 10). The most dramatic forest changes can be found the closest to settlements and roads. Forest gain and loss larger than 50 km2 were observed within the distance of 2000 m from settlements and roads. The influence of settlements and roads on forest loss was much more significant than on forest gain due to the larger coefficient of determination (R2) of forest loss. Moreover, the distance from roads had stronger impacts on forest changes compared with settlements attributed to the larger change areas and R2 (Figure 10).

4. Discussion

4.1. Forest Dynamics and Potential Drivers in Northeast China

Our Landsat-based results showed that the forests in northeast China decreased by 1051 km2, about 42.04 km2 y−1 during 1990–2015. Despite this decline, northeast China’s forest coverage remains 41 percent of total land area, which is higher than China’s average of 21.63% [45] and the world’s average of 31% [11]. From the perspective of net change in different periods, forest area in northeast China shifted from net loss during 1990–2000 to net gain during 2000–2015 (Table 3). Based on statistical datasets of the sixth–ninth national forest inventory, forest land has increased from 34.67 million ha in 1999 to 37.63 million ha in 2013 in northeast China, which only includes the provinces of Heilongjiang, Jilin, and Liaoning [46]. Forest land mentioned in those statistical datasets was defined as the land classified for forestry use, including forest, non-forest land, shrub land, and open forest land [45]. Compared with these reports, our estimates also showed an increase of forest area from 34.38 million ha in 2000 to 34.73 million ha in 2015. But amplitude of variation in forest area is not as large as in statistics, probably due to the criterion of forest cover extraction from Landsat images, which need reach a 0.5 m height threshold and > 20% tree cover at pixel level (Table 1). It has also been reported that the previously observed drastic decrease in the area of natural forests has now been reversed in northeast China [8]. At the provincial level, relatively sharp net loss in HLJ (1802 km2) and net gain in JL (1057 km2) were found and the corresponding annual change rate was 72 km2 y−1 and 42 km2 y−1, respectively. Although all of the provinces of northeast China had the highest change rate between 2010 and 2015, the rates were much lower than the expansion rate of forests in China between 2010 and 2015 (1.5 × 10⁴ km2 y−1) [47].
Forest changes were observed in different zones with distinct geographic characteristics. The regions with an elevation of 400–800 m, slope under 8°, and <2000 m distance from settlements and roads were highly vulnerable to deforestation (Figure 7, Figure 8 and Figure 9), where the lands are suitable for crop cultivation or convenient for human activities with high land accessibility. In the mountainous area of east Jilin Province, Kuang et al. found that forest changes mainly took place in the area with elevation of 300–900 m and slope between 0–11° during the period 1954–2000 [48]. An estimated two billion ha of forests is degraded worldwide [49], which is largely induced by agricultural expansion and urban sprawl [11,50,51]. It is preferable for cropland to be located in low elevations and on small slopes, for example, 67.4% of the cropland in China was distributed in the area of elevation less than 500 m [52]. During 1990–2000, the largest deforestation occurred in northeast China in which 1.26 million ha of forests was turned into cropland [52]. Cropland expansion was also considered as the main direct cause for deforestation in northeast China during 1977–2013 [53]. Man et al. also confirmed that the regions with low elevation and small slopes facilitated to transform forests into cropland in northeast China during 1990–2013 [54]. Consequently, forest loss in northeast China was highly related with the reclamation of sloping land.
Furthermore, the expansion of settlements and the construction of infrastructures have been linked to deforestation [55]. The distribution of settlements and roads could strongly influence the pattern of forest changes due to the construction of such infrastructures and consequent human-induced disturbances. An exponential relationship between forest changes and distance to the nearest settlements and roads were observed in the mountainous area of east Jilin Province [48]. The coefficient for the nearest distance to city and forest area in the forestry farms of northeast China was estimated to be −0.981, which indicates that forest farms near the timber markets and large cities would undergo more deforestation [8]. Our result also evidenced that the nearest distance to settlements had more forest loss within 4000 m from settlements. Urban growth is positively and significantly correlated with forest loss, due to high consumption levels and increasing demand for agricultural products in the urbanized area, which is likely to exacerbate pressure to clear forests [50]. The most obvious impact of roads is increased human access to interior forest areas [56]. Sun explored the impacts of roads on landscape pattern in the Genhe watershed of Greater Khingan Mountains and found that the area of forests declined significantly within the 2 km buffer of roads; these forest areas were mostly converted into cropland [57]. Similarly, the largest forest loss and gain were found within 2000 m from the nearest roads in our study, which clearly reflected the spatial impacts of roads on forest changes. Many of the areas with significant forest gains were found to be the recently logged areas [12]. Land accessibility to roads was strongly related to forest gains when the expansion of agriculture was limited to deforested areas [27]. In addition, the construction of roads and other infrastructures not only directly leads to a reduction of forested area, but also causes fragmentation of intact forest landscapes, which would lead to subsequent consequences in relation to landscape transformation and loss of conservation values [58].
Although the conditions of forest fragmentation in northeast China were not as serious as other forested areas in China [59], the fragmented patches of forest changes could affect the pattern and quality of forests in this region. The resultant maps (Figure 4 and Figure 5) clearly show that there are a large number of small change patches mostly distributed in the transition areas between mountains and plains (Figure 5). It was reported that 86% of the total intact forest area reduction was due to fragmentation by disturbances (logging, clearing and fires) and infrastructure development in Southeast Asia [58]. Small-scale clearing is the second largest disturbance type in some states of the Brazilian Legal Amazon [55]. In our estimates, smallholder clearing defined by patch size less than 10 ha accounted for nearly 10% of total forest loss and is the third largest contributor to deforestation in northeast China (Figure 6b). This kind of clearing was largely related with the scattered distribution of forests around rural settlements and the logging ban project in northeast China. Commercial logging was controlled by the central government since the late 1990s and changed to being completely banned after 2015 [60]. After the logging ban, legally logging was only allowed by local people for non-commercial use with strictly limitation. Therefore, fragmented logging may be more likely implemented due to smallholder clearing around the rural areas. northeast China had the lowest forest fragmentation at the regional scale [59], but large increase in human-induced disturbances would lead to relatively high levels of fragmentation. From 1954–2010, the large forest patch decreased with small forest patch increased which evidenced the forest fragmentation in the upstream region of the Nenjiang River Basin [61]. The similar fragmentation process of forests in the mountainous area of east Jilin Province was also observed during 1954–2000 [48]. Liu et al. [62] classified the northeast region of China as the most problematic area of forest fragmentation based on 138 previous studies’ data. Thus, the fragmentation induced by natural and human-induced disturbances in this region should draw much more attention from government and scientists. This is because increases in fragment number and decreases in fragment size both have major consequences on the habitats of species and forest fragment edges [28].
Government policy also plays an important role in the transition of forests, particularly in developing countries [63]. Northeast China has experienced excessive logging and reclamation of forests from 1978 to 1998, which were triggered by both national economic reforms and the broadening of international relations [9]. With the rising awareness of ecological sustainability of forests and its significance to global changes, China launched a series of forest-restoration-related programs; several programs were formally implemented since 1998 in northeast China (Figure 11), for example, the Natural Forest Conservation Program (NFCP), the Three North Shelter Forest System Program (TNSP), the Desertification Control Program, and the Grain-for-Green Program (GFGP) [10,11,64]. The NFCP exhibited a significantly positive relation with forest gain in China [12] and new forests converted from previous cropland were mostly attributed to the Grain-for-Green Program, which aims to return marginal cropland to forest land initiated since 2000 [65]. In 2014, the State Forestry Administration (SFA) issued the prohibition of commercial logging in natural forests in Heilongjiang, which historically produced over 30% of China’s round wood. On the basis of Heilongjiang’s experience, the prohibition was extended to other northeast provinces in 2015 [55]. The timber harvesting levels in northeast China declined from 59.72 million m3 in 1996–2000 [66] to 35.67 million m3 in 2006–2010 [67]. Illegal timber cutting and logging were effectively controlled [9]. The small net gain of forests from 2000 to 2015 estimated by this study also confirmed previous studies’ conclusion concerning the restoration of forests in northeast China. In general, government policy and implementation of related ecological programs were main drivers for the afforestation and reforestation in northeast China [48].

4.2. The Uncertainty of Forest Mapping with Remote Sensing

Quantifying and mapping forest changes with remote sensing is critical for sustainable management of forests but remains considerable uncertainties [4]. Three main factors were determined which might be responsible for the uncertainty of different forest products, referring to the definition of forests, data sources, and the classification algorithms [14]. In terms of the definition of forests, thresholds of woody vegetation cover and tree height were defined and varied among different forest products (Table 1). These criteria in the forest definition are conceptual, so the estimates of forest area differ, even with the same definition. Furthermore, variables in the definition are difficult to precisely measure with moderate resolution remote sensing data for large areas [7,16]. Different spatial resolution (fine and coarse), acquisition date and sensors (optical and microwave) of remote sensing data would inevitably lead to high uncertainties of forest classification. From fine (30 m) to coarse spatial resolution (300–500 m), these remotely sensed images have large discrepancy in ability to capture the details of forest distribution. Given the higher penetration capacity by microwave sensors, Radar data, such as PALSAR and Sentinel-1, can retrieve more structural information, whereas optical sensors have advantages on obtaining canopy level information [38]. In recent decades, the automatic or semi-automatic forest classification algorithms have become more popular compared with traditional visual interpretation, having high efficiency of processing a large number of remote sensing images to classify forests [14]. However, these algorithms often do not perform well across complex landscapes and the accuracy of the historical forest maps from the same algorithm may be affected by inconsistent quality of input images at temporal and spatial scales [17,21,68].
In this study, the products with different spatial resolution, sensors, and algorithms were compared to illustrate the uncertainty of forests estimation (Table 1). Generally, all of the other five forest products had noticeable linear relationships with the NECF data produced by this study, with an R2 ranging from 0.95 to 0.99 (Figure 12). Our estimate of forest area for the year of 2010 at the provincial level is nearly the highest among those forest/land cover products. The relationship between the NLCD-China and NECF forest maps was strongest (R2 = 0.99), which may be linked to similar data sources and manual editing after automatic classification in this study. The lowest correlations were found between JAXA and NECF forest maps (R2 = 0.95), mainly due to the different data sources (PALSAR dual-polarized data and optical Landsat data). In addition, the estimates of forest area from NECF and NLCD-China were much closer to the estimates from provincial statistics year books [7]. Based on the above mentioned analysis, policy makers should understand differences between estimates of forest area derived from various data, methods, and definitions, which is critical when establishing policies and targets to reduce deforestation rates and increase forest area [52].

4.3. Limitations and Future Work

The long-term Landsat-based forest maps generated in this study provide accurate and updated estimates of forest cover in northeast China. However, our results only reflect general forest cover dynamics, without information on forest structure, tree height or approximate age of observed forests. Optical sensors are more sensitive to horizontal forest structures such as canopy closure and density. It is difficult to accurately retrieve or extract vertical structure parameters using only the visible spectral bands of Landsat images. On the other hand, sufficient field investigation samples are needed to support the identification of low dense and high dense forest or young and mature forest. However, we have limited field samples with these attributes in northeast China. Recently, intelligent algorithms have been applied for these parameters’ retrieval with limited training data, but the efficiency, feasibility and accuracy at large scale need to be explored in the future work. Nowadays, the integration of optical data and microwave data, as well as application of Google Earth Engine (GEE), bring great opportunity for obtaining high accuracy forest maps at regional or global scales. Image fusion and robust classification algorithms should be considered a priority for improved estimates of forest areas and their changes. In addition, our study demonstrated a small net loss of forests and certain afforestation due to ecological projects in northeast China. However, systematic monitoring related with forest quality or vegetation response to climate change and human activities are rarely reported in this region. Future work should be based on stronger and more robust datasets to explore those questions and finally provide reliable information for policymaking.

5. Conclusions

Forests in northeast China are important to the nation for timber supply, biodiversity conservation, ecological security, and potential carbon sequestration. However, spatial precision information is still limited in the pattern and changes of forests across northeast China, which highlights the needs to the production of accurate and up-to-date forest maps with fine spatial resolution. We proposed an updating and object-based image analysis approach to generate accurate forest maps in northeast China using long-term Landsat images. The spatio–temporal dynamics of forests and geographical patterns of forest changes were quantified based on resultant maps and geospatial analysis. Our study revealed that forests in northeast China exhibited a stable trend and relatively high forest loss and gain were observed during the period 2010–2015. Changes in forest area showed significant spatial variations across the provinces. Topographical gradients such as elevation and slope, and land accessibility (by settlements and roads) were found to strongly influence the spatial pattern of forest changes in northeast China. Human activities, such as the reclamation of sloping land, construction of settlements and roads, and possible smallholder clearing, were identified as the major influencing factors for the loss of forests in northeast China. Forest-restoration-related programs and policies contributed more to afforestation and reforestation. The 30-m Landsat-based forest cover maps generated in this study can provide sufficient spatial information on deforestation, afforestation and fragmentation conditions of forests across northeast China. Such information is necessary for developing sustainable forest management policies, especially relating to biodiversity conservation and prevention of ecosystem fragmentation. In addition, the resultant maps can also serve as baseline data for predicting future trends of forest changes, planning ground-based investigation, and establishing carbon cycle and biodiversity models.

Author Contributions

Methodology, C.R.; software, L.C.; validation, Y.X.; investigation, C.L.; original draft preparation, C.R.; review and editing, Z.W.; funding acquisition, B.Z.

Funding

This research was funded by the National Key Research and Development Program of China (NO. 2016YFC0500300), and Strategic Planning Project from Institute of Northeast Geography and Agroecology, CAS (NO. Y6H2091001).

Acknowledgments

We thank the National Earth System Science Data Center for providing geographic information data (http://www.geodata.cn). We also thank the editor and anonymous reviewers for their labor and precious time for improving our manuscript.

Conflicts of Interest

The authors declare no conflict of interest.

References

  1. FAO. The State of the World’s Forests_Forest Pathways to Sustainable Development; FAO: Rome, Italy, 2018. [Google Scholar]
  2. Foley, J.; DeFries, R.; Asner, G.; Barford, C.; Bonan, G.; Carpenter, S.R.; Chapin, F.S.; Coe, M.T.; Daily, G.C.; Gibbs, H.K.; et al. Global consequences of land use. Science 2005, 309, 570–574. [Google Scholar] [CrossRef] [PubMed]
  3. Hansen, M.; Potapov, P.; Moore, R.; Hancher, M.; Turubanova, S.; Tyukavina, A.; Thau, D.; Stehman, S.V.; Goetz, S.J.; Loveland, T.R.; et al. High-resolution global maps of 21st-century forest cover change. Science 2013, 342, 850–853. [Google Scholar] [CrossRef] [PubMed]
  4. Qin, Y.; Xiao, X.; Dong, J.; Zhou, Y.; Wang, J.; Doughty, R.B.; Chen, Y.; Zou, Z.; Moore, B. Annual dynamics of forest areas in south america during 2007–2010 at 50-m spatial resolution. Remote Sens. Environ. 2017, 201, 73–87. [Google Scholar] [CrossRef]
  5. Qin, Y.; Xiao, X.; Wang, J.; Dong, J.; Ewing, K.; Hoagland, B.; Hough, D.; Fagin, T.; Zou, Z.; Geissler, G.; et al. Mapping annual forest cover in sub-humid and semi-arid regions through analysis of landsat and palsar imagery. Remote Sens. 2016, 8, 933. [Google Scholar] [CrossRef]
  6. Chen, B.Q.; Li, X.P.; Xiao, X.M.; Zhao, B.; Dong, J.W.; Kou, W.L.; Qin, Y.W.; Yang, C.; Wu, Z.X.; Sun, R.; et al. Mapping tropical forests and deciduous rubber plantations in hainan island, china by integrating palsar 25-m and multi-temporal landsat images. Int. J. Appl. Earth Obs. Geoinf. 2016, 50, 117–130. [Google Scholar] [CrossRef]
  7. Ren, C.; Zhang, B.; Wang, Z.; Li, L.; Jia, M. Mapping forest cover in northeast china from chinese hj-1 satellite data using an object-based algorithm. Sensors 2018, 18, 4452. [Google Scholar] [CrossRef]
  8. Huang, W. Forest condition change, tenure reform, and government-funded eco-environmental programs in northeast china. Forest Policy Econ. 2019, 98, 67–74. [Google Scholar] [CrossRef]
  9. Yu, D.; Zhou, L.; Zhou, W.; Ding, H.; Wang, Q.; Wang, Y.; Wu, X.; Dai, L. Forest management in northeast china: History, problems, and challenges. Environ. Manag. 2011, 48, 1122–1135. [Google Scholar] [CrossRef]
  10. Hyde, W.F.; Yin, R. 40 years of china’s forest reforms: Summary and outlook. Forest Policy Econ. 2019, 98, 90–95. [Google Scholar] [CrossRef]
  11. Ren, Y.; Lü, Y.; Fu, B.; Zhang, K. Biodiversity and ecosystem functional enhancement by forest restoration: A meta-analysis in china. Land Degrad. Dev. 2017, 28, 2062–2073. [Google Scholar] [CrossRef]
  12. Andrés Viña, W.J.M.; Yang, H.; Xu, Z.; Liu, J. Effects of conservation policy on china‘s forest recovery. Sci. Adv. 2016, 2, e1500965. [Google Scholar] [CrossRef] [PubMed]
  13. José Vidal-Macua, J.; Ninyerola, M.; Zabala, A.; Domingo-Marimon, C.; Pons, X. Factors affecting forest dynamics in the iberian peninsula from 1987 to 2012. The role of topography and drought. For. Ecol. Manag. 2017, 406, 290–306. [Google Scholar] [CrossRef]
  14. Qin, Y.; Xiao, X.; Dong, J.; Zhang, G.; Shimada, M.; Liu, J.; Li, C.; Kou, W.; Moore, B. Forest cover maps of china in 2010 from multiple approaches and data sources: Palsar, landsat, modis, fra, and nfi. ISPRS J. Photogramm. 2015, 109, 1–16. [Google Scholar] [CrossRef]
  15. Chen, B.; Xiao, X.; Ye, H.; Ma, J.; Doughty, R.; Li, X.; Zhao, B.; Wu, Z.; Sun, R.; Dong, J.; et al. Mapping forest and their spatial–temporal changes from 2007 to 2015 in tropical hainan island by integrating alos/alos-2 l-band sar and landsat optical images. IEEE J-STARS 2018, 11, 852–867. [Google Scholar] [CrossRef]
  16. Dong, J.; Xiao, X.; Sheldon, S.; Biradar, C.; Duong, N.D.; Hazarika, M. A comparison of forest cover maps in mainland southeast asia from multiple sources: Palsar, meris, modis and fra. Remote Sens. Environ. 2012, 127, 60–73. [Google Scholar] [CrossRef]
  17. Wang, J.; Xiao, X.; Qin, Y.; Doughty, R.B.; Dong, J.; Zou, Z. Characterizing the encroachment of juniper forests into sub-humid and semi-arid prairies from 1984 to 2010 using palsar and landsat data. Remote Sens. Environ. 2018, 205, 166–179. [Google Scholar] [CrossRef]
  18. Xu, W.; Qin, Y.; Xiao, X.; Di, G.; Doughty, R.B.; Zhou, Y.; Zou, Z.; Kong, L.; Niu, Q.; Kou, W. Quantifying spatial-temporal changes of tea plantations in complex landscapes through integrative analyses of optical and microwave imagery. Int. J. Appl. Earth Obs. Geoinf. 2018, 73, 697–711. [Google Scholar] [CrossRef]
  19. Shimada, M.; Itoh, T.; Motooka, T.; Watanabe, M.; Shiraishi, T.; Thapa, R.; Lucas, R. New global forest/non-forest maps from alos palsar data (2007–2010). Remote Sens. Environ. 2014, 155, 13–31. [Google Scholar] [CrossRef]
  20. Broich, M.; Hansen, M.C.; Potapov, P.; Adusei, B.; Lindquist, E.; Stehman, S.V. Time-series analysis of multi-resolution optical imagery for quantifying forest cover loss in sumatra and kalimantan, indonesia. Int. J. Appl. Earth Obs. Geoinf. 2011, 13, 277–291. [Google Scholar] [CrossRef]
  21. Gong, P.; Wang, J.; Yu, L.; Zhao, Y.; Zhao, Y.; Liang, L.; Niu, Z.; Huang, X.; Fu, H.; Liu, S.; et al. Finer resolution observation and monitoring of global land cover: First mapping results with landsat TM and ETM+ data. Int. J. Remote Sens. 2013, 34, 2607–2654. [Google Scholar] [CrossRef]
  22. Chen, J.; Chen, J.; Liao, A.; Cao, X.; Chen, L.; Chen, X.; He, C.; Han, G.; Peng, S.; Lu, M.; et al. Global land cover mapping at 30m resolution: A pok-based operational approach. ISPRS J. Photogramm. 2015, 103, 7–27. [Google Scholar] [CrossRef]
  23. Tyukavina, A.; Hansen, M.; Potapov, P.; Parker, D.; Okpa, C.; Stehman, S.; Kommareddy, I.; Turubanova, S. Congo basin forest loss dominated by increasing smallholder clearing. Sci. Adv. 2018, 4, eaat2993. [Google Scholar] [CrossRef] [PubMed]
  24. Wang, J.; Xiao, X.; Qin, Y.; Dong, J.; Geissler, G.; Zhang, G.; Cejda, N.; Alikhani, B.; Doughty, R.B. Mapping the dynamics of eastern redcedar encroachment into grasslands during 1984–2010 through palsar and time series landsat images. Remote Sens. Environ. 2017, 190, 233–246. [Google Scholar] [CrossRef]
  25. Acacio, V.; Dias, F.S.; Catry, F.X.; Rocha, M.; Moreira, F. Landscape dynamics in mediterranean oak forests under global change: Understanding the role of anthropogenic and environmental drivers across forest types. Glob. Chang. Biol. 2017, 23, 1199–1217. [Google Scholar] [CrossRef] [PubMed]
  26. Bello-Rodríguez, V.; García, C.; del-Arco, M.J.; Hernández-Hernández, R.; González-Mancebo, J.M. Spatial dynamics of expanding fragmented thermophilous forests on a macaronesian island. For. Ecol. Manag. 2016, 379, 165–172. [Google Scholar] [CrossRef]
  27. Freitas, S.R.; Hawbaker, T.J.; Metzger, J.P. Effects of roads, topography, and land use on forest cover dynamics in the brazilian atlantic forest. For. Ecol. Manag. 2010, 259, 410–417. [Google Scholar] [CrossRef]
  28. Taubert, F.; Fischer, R.; Groeneveld, J.; Lehmann, S.; Muller, M.S.; Rodig, E.; Wiegand, T.; Huth, A. Global patterns of tropical forest fragmentation. Nature 2018, 554, 519–522. [Google Scholar] [CrossRef]
  29. Zhou, Y.; Zu, Y. Geography of the Vegetation in Northeast China; Science Press: Beijing, China, 1997. [Google Scholar]
  30. Earth Resources Observation and Science (EROS) Data Center, USGS. Available online: https://glovis.usgs.gov/ (accessed on 5 January 2016).
  31. GISAT. Available online: http://gdem.ersdac.jspacesystems.or.jp/ (accessed on 1 July 2011).
  32. Pham, L.T.H.; Brabyn, L.; Ashraf, S. Combining quickbird, lidar, and gis topography indices to identify a single native tree species in a complex landscape using an object-based classification approach. Int. J. Appl. Earth Obs. Geoinf. 2016, 50, 187–197. [Google Scholar] [CrossRef]
  33. Mitchell, M.; Wilson, R.R.; Twedt, D.J.; Mini, A.E.; James, J.D. Object-based forest classification to facilitate landscape-scale conservation in the mississippi alluvial valley. Remote Sens. Appl. Soc. Environ. 2016, 4, 55–60. [Google Scholar] [CrossRef]
  34. Zhou, W.; Huang, G.; Pickett, S.T.A.; Cadenasso, M.L. 90 years of forest cover change in an urbanizing watershed: Spatial and temporal dynamics. Landscape Ecol. 2011, 26, 645–659. [Google Scholar] [CrossRef]
  35. Jin, S.; Yang, L.; Danielson, P.; Homer, C.; Fry, J.; Xian, G. A comprehensive change detection method for updating the national land cover database to circa 2011. Remote Sens. Environ. 2013, 132, 159–175. [Google Scholar] [CrossRef]
  36. Xian, G.; Homer, C. Updating the 2001 national land cover database impervious surface products to 2006 using landsat imagery change detection methods. Remote Sens. Environ. 2010, 114, 1676–1686. [Google Scholar] [CrossRef]
  37. Yu, W.; Zhou, W.; Qian, Y.; Yan, J. A new approach for land cover classification and change analysis: Integrating backdating and an object-based method. Remote Sens. Environ. 2016, 177, 37–47. [Google Scholar] [CrossRef]
  38. Yang, Z.; Dong, J.; Liu, J.; Zhai, J.; Kuang, W.; Zhao, G.; Shen, W.; Zhou, Y.; Qin, Y.; Xiao, A.X. Accuracy assessment and inter-comparison of eight medium resolution forest products on the loess plateau, China. ISPRS Int. J. Geo-Inf. 2017, 6, 152. [Google Scholar] [CrossRef]
  39. Zhang, L.; Li, X.; Yuan, Q.; Liu, Y. Object-based approach to national land cover mapping using hj satellite imagery. J. Appl. Remote Sens. 2014, 8, 083686. [Google Scholar] [CrossRef]
  40. Ouyang, Z.; Zheng, H.; Xiao, Y.; Polasky, S.; Liu, J. Improvements in ecosystem services from investigates in natural capital. Science 2016, 352, 1455–1459. [Google Scholar] [CrossRef]
  41. Mao, D.; Luo, L.; Wang, Z.; Wilson, M.C.; Zeng, Y.; Wu, B.; Wu, J. Conversions between natural wetlands and farmland in China: A multiscale geospatial analysis. Sci. Total Environ. 2018, 634, 550–560. [Google Scholar] [CrossRef]
  42. European Space Agency. Land Cover CCI Product User Guide Version 2.4; European Space Agency: Paris, France, 2016. [Google Scholar]
  43. Friedl, M.A.; Sulla-Menashe, D.; Tan, B.; Schneider, A.; Ramankutty, N.; Sibley, A.; Huang, X. Modis collection 5 global land cover: Algorithm refinements and characterization of new datasets. Remote Sens. Environ. 2010, 114, 168–182. [Google Scholar] [CrossRef]
  44. Liu, J.; Kuang, W.; Zhang, Z.; Xu, X.; Qin, Y.; Ning, J.; Zhou, W.; Zhang, S.; Li, R.; Yan, C.; et al. Spatiotemporal characteristics, patterns, and causes of land-use changes in China since the late 1980s. J. Geogr. Sci. 2014, 24, 195–210. [Google Scholar] [CrossRef]
  45. SFA. The 8th Forest Resources Inventory Results in China; SFA: Beijing, China, 2014. [Google Scholar]
  46. China Forestry Database. Available online: http://www.forestry.gov.cn/data.html (accessed on 25 February 2019).
  47. FAO. Global Forest Resources Assessment; FAO: Rome, Italy, 2015. [Google Scholar]
  48. Kuang, W.; Zhang, S.; Zhang, Y.; Li, Y.; Hou, W. Landscape and its driving mechanism during the last fifty years in the eastern mountain area of jilin province. J. Beijing For. Univ. 2006, 28, 38–45. [Google Scholar]
  49. Stanturf, J.A.; Palik, B.J.; Dumroese, R.K. Contemporary forest restoration: A review emphasizing function. For. Ecol. Manag. 2014, 331, 292–323. [Google Scholar] [CrossRef]
  50. DeFries, R.S.; Rudel, T.; Uriarte, M.; Hansen, M. Deforestation driven by urban population growth and agricultural trade in the twenty-first century. Nat. Geosci. 2010, 3, 178–181. [Google Scholar] [CrossRef]
  51. Ahrends, A.; Burgess, N.; Milledge, S.; Bulling, M.; Fisher, B.; Smart, J.C.; Clarke, G.P.; Mhoro, B.E.; Lewis, S.L. Predictable waves of sequential forest degradation and biodiversity loss spreading from an african city. Proc. Natl. Acad. Sci. USA 2010, 107, 14556–14561. [Google Scholar] [CrossRef] [PubMed]
  52. Liu, J.; Liu, M.; Tian, H.; Zhuang, D.; Zhang, Z.; Zhang, W.; Tang, X.; Deng, X. Spatial and temporal patterns of China‘s cropland during 1990–2000: An analysis based on landsat tm data. Remote Sens. Environ. 2005, 98, 442–456. [Google Scholar] [CrossRef]
  53. Shi, M.; Yin, R.; Lv, H. An empirical analysis of the driving forces of forest cover change in northeast China. For. Policy Econ. 2017, 78, 200–209. [Google Scholar] [CrossRef]
  54. Man, W.; Wang, Z.; Liu, M.; Lu, C.; Jia, M.; Mao, D.; Ren, C. Spatio-temporal dynamics analysis of cropland in Northeast China during 1990-2013 based on remote sensing. T. Chinese Soc. Agric. Eng. 2016, 32, 1–10. [Google Scholar]
  55. Keenan, R.J.; Reams, G.A.; Achard, F.; de Freitas, J.V.; Grainger, A.; Lindquist, E. Dynamics of global forest area: Results from the fao global forest resources assessment 2015. For. Ecol. Manag. 2015, 352, 9–20. [Google Scholar] [CrossRef]
  56. Newman, M.E.; McLaren, K.P.; Wilson, B.S. Assessing deforestation and fragmentation in a tropical moist forest over 68 years; the impact of roads and legal protection in the cockpit country, Jamaica. For. Ecol. Manag. 2014, 315, 138–152. [Google Scholar] [CrossRef]
  57. Sun, J.J. The Impacts of Roads on Landscape Pattern Based on Gis: A Case Study of Genhe Watershed in the Greater Khingan Mountains. Master’s Thesis, JiangXi University of Science and Technology, Ganzhou, China, 2013. [Google Scholar]
  58. Potapov, P.; Hansen, M.; Laestadius, L.; Turubanova, S.; Yaroshenko, A.; Thies, C.; Smith, W.; Zhuravleva, I.; Komarova, A.; Minnemeyer, S.; et al. The last frontiers of wilderness tracking loss of intact forest landscapes from 2000 to 2013. Sci. Adv. 2017, 3, e1600821. [Google Scholar] [CrossRef]
  59. Li, Y.; Xiao, X.; Li, X.; Ma, J.; Chen, B.; Qin, Y.; Dong, J.; Zhao, B. Multi-scale assessments of forest fragmentation in China. Biodivers. Sci. 2017, 25, 372–381. [Google Scholar] [CrossRef] [Green Version]
  60. Hou, J.; Yin, R.; Wu, W. Intensifying forest management in China: What does it mean, why, and how? For. Policy Econ. 2019, 98, 82–89. [Google Scholar] [CrossRef]
  61. Tang, J.; Bu, K.; Yang, J.; Zhang, S.; Chang, L. Multitemporal analysis of forest fragmentation in the upstream region of the Nenjiang River Basin, Northeast China. Ecol. Indic. 2012, 23, 597–607. [Google Scholar] [CrossRef]
  62. Liu, J.; Coomes, D.A.; Gibson, L.; Hu, G.; Liu, J.; Luo, Y.; Wu, C.; Yu, M. Forest fragmentation in China and its effect on biodiversity. Biol. Rev. Camb. Philos. Soc. 2019, 94, 1636–1657. [Google Scholar] [CrossRef]
  63. Lambin, E.F.; Meyfroidt, P. Global land use change, economic globalization, and the looming land scarcity. Proc. Natl. Acad. Sci. USA 2011, 108, 3465–3472. [Google Scholar] [CrossRef] [PubMed] [Green Version]
  64. Wenhua, L. Degradation and restoration of forest ecosystems in China. For. Ecol. Manag. 2004, 201, 33–41. [Google Scholar] [CrossRef]
  65. Zhang, D. China‘s forest expansion in the last three plus decades: Why and how? For. Policy Econ. 2019, 98, 75–81. [Google Scholar] [CrossRef]
  66. The State Council of the People’s Republic of China. Notice of the State Council on Re-issuing the State Forestry Administration for Forest Cutting Quota of Provinces, Autonomous Regions and Municipalities in the Period of the ‘Ninth Five Year Plan’; The state council of the People’s Republic of China: Beijing, China, 1995; p. 120.
  67. The State Council of the People’s Republic of China. Notice of the State Council on Re-issuing the State Forestry Administration for Forest Cutting Quota of Provinces, Autonomous Regions and Municipalities in the Period of the ‘Eleventh Five Year Plan’; The state council of the People’s Republic of China: Beijing, China, 2005; p. 41.
  68. Hansen, M.C.; Potapov, P.V.; Goetz, S.J.; Turubanova, S.; Tyukavina, A.; Krylov, A.; Kommareddy, A.; Egorov, A. Mapping tree height distributions in Sub-Saharan Africa using landsat 7 and 8 data. Remote Sens. Environ. 2016, 185, 221–232. [Google Scholar] [CrossRef]
Figure 1. Location, topography, and ground reference data of study area.
Forests 10 00937 g001
Figure 2. Flowchart of forest mapping using integrated updating and an object-based image analysis method.
Forests 10 00937 g002
Figure 3. Changes of forest areas and percentage in northeast China from 1990 to 2015.
Forests 10 00937 g003
Figure 4. Spatial distribution of forest frequency in northeast China. In legends, 1–4 represent the number of years a pixel was identified as forests during 1990–2015, and the percentage values were their proportion to the total forest area.
Forests 10 00937 g004
Figure 5. Spatial distribution of forest and its changes during 1990–2015 in northeast China.
Forests 10 00937 g005
Figure 6. Patch number and accumulated area of forest changes at different patch size levels. (a) Patch number distribution, and (b) accumulated area distribution.
Forests 10 00937 g006
Figure 7. The area changes of forests in provinces of northeast China during 1990–2015.
Forests 10 00937 g007
Figure 8. Changes of forests under different topographic gradient: elevation (a) and slope (b).
Forests 10 00937 g008
Figure 9. Forest changes analyzed by accessibility to settlements: forest gain (a) and forest loss (b).
Forests 10 00937 g009
Figure 10. Forest changes analyzed by accessibility to roads: forest gain (a) and forest loss (b).
Forests 10 00937 g010
Figure 11. Government policies on forest conservation and management in northeast China.
Forests 10 00937 g011
Figure 12. Uncertainties of forest cover estimation at the provincial level in 2010.
Forests 10 00937 g012
Table 1. Characteristics of selected forest cover products used in this study.
Forest Cover ProductsForest DefinitionsData SourcesSpatial ResolutionAlgorithms
FROM_GLCCanopy cover >15% and tree height >5 mLandsat30 mAutomatic classification [21]
JAXACanopy cover > 10%PALSAR50 mDecision tree [19]
ESA CCICanopy cover >15% and tree height >5 mMERIS300 mUnsupervised classification [42]
MCD12Q1Canopy cover >60% and tree height >2 mMODIS500 mSupervised classification [43]
NLCD-Chinacanopy cover >10%Landsat, CBERS, HJ-1A1000 m (30 m original data)Visual interpretation [44]
NECF (this study)Canopy cover >20% and tree height >0.5 mLandsat30 mOBIA and decision tree
Table 2. Accuracy assessments of the forest classification in northeast China.
YearClassificationGround ReferenceUAPAOAKA
ForestNon-Forest
1990Forest6438089%91%91%0.88
Non-forest6574392%90%
2000Forest8058191%95%92%0.90
Non-forest4660393%88%
2010Forest11057294%93%93%0.91
Non-forest8293992%93%
2015Forest9086394%94%94%0.93
Non-forest54102995%94%
Note: UA: user’s accuracy; PA: producer’s accuracy; OA: overall accuracy; KA: Kappa coefficients.
Table 3. Forest loss and gain between 1990 and 2015 (unit: km2).
GainsLossesNet Change
1990–200022325686−3454
2000–2010344114292011
2010–201510,3159923392
1990–201514,52715,577−1051