Article

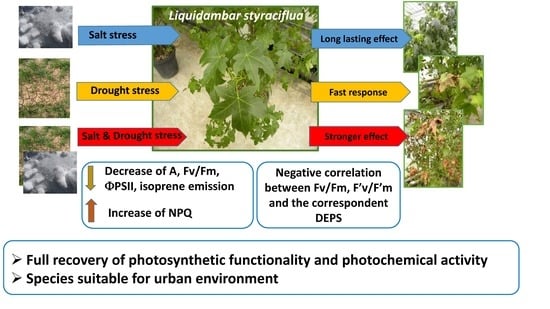
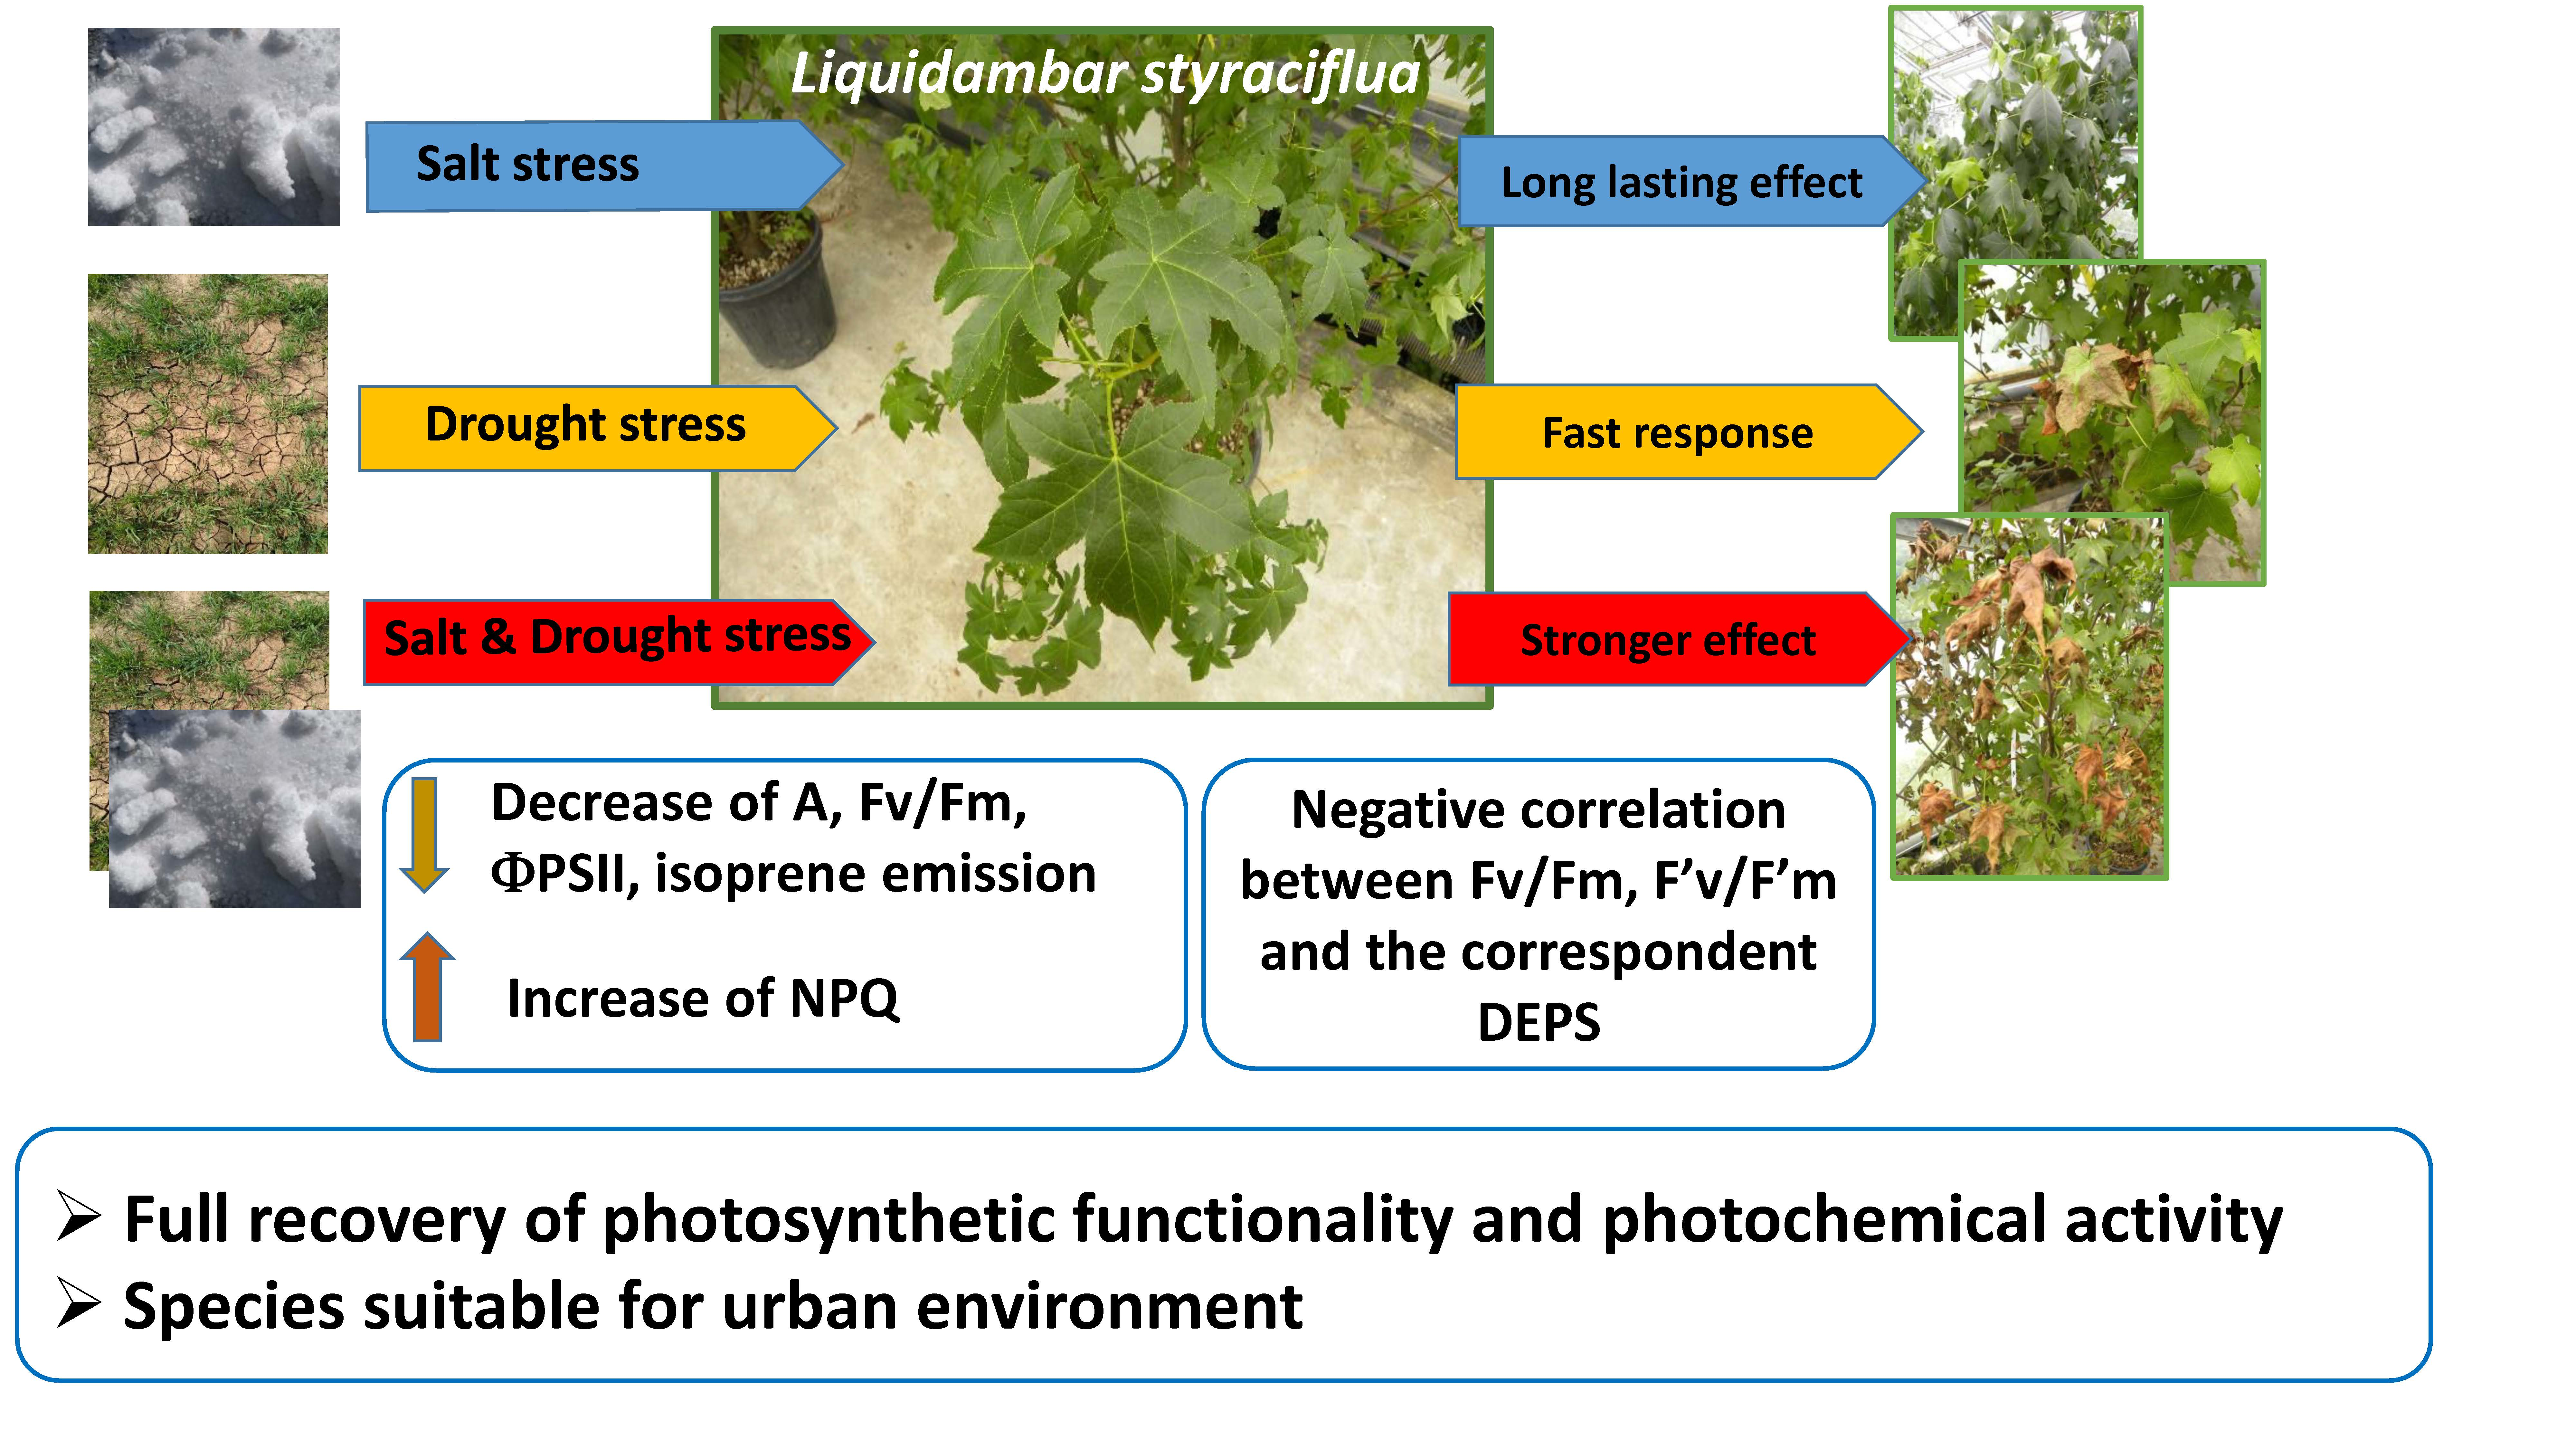
Impact of Drought and Salinity on Sweetgum Tree (Liquidambar styraciflua L.): Understanding Tree Ecophysiological Responses in the Urban Context

1
Institute of BioEconomy-National Research Council (IBE-CNR), Via Gobetti 101, 40129 Bologna, Italy
2
Section of Basic Research in Horticulture, Department of Plant Protection, Institute of Horticulture Sciences, Warsaw University of Life Sciences—SGGW (WULS-SGGW), Nowoursynowska 159, 02-776 Warsaw, Poland
*
Author to whom correspondence should be addressed.
Forests 2019, 10(11), 1032; https://doi.org/10.3390/f10111032
Submission received: 29 August 2019 / Revised: 31 October 2019 / Accepted: 6 November 2019 / Published: 15 November 2019
(This article belongs to the Section Forest Ecophysiology and Biology)

Abstract

:
Understanding urban tree responses to drought, salt stress, and co-occurring stresses, as well as the capability to recover afterward, is important to prevent the cited stresses’ negative effects on tree performance and ecological functionality. We investigated the impact of drought and salinity, alone and in combination, on leaf water potential, gas exchange, chlorophyll a fluorescence, xanthophyll cycle pigments, and isoprene emission of the urban tree species Liquidambar styraciflua L. Generally, drought had a rapid negative impact, while the effect of salt stress was more long lasting. Both stressors significantly decreased photosynthesis, transpiration, and stomatal conductance, as well as the maximum quantum efficiency of photosystem II (Fv/Fm) and the photochemical efficiency of PSII (ΦPSII), but increased nonphotochemical quenching (NPQ). Under stress conditions, a strong negative correlation between the PSII efficiency and the xanthophyll cycle pigment composition indicated a nocturnal retention of zeaxanthin and antheraxanthin in a state primed for energy dissipation. Drought and salt stress inhibited isoprene emission from leaves, although its emission was less responsive to stresses than stomatal conductance and photosynthesis. Full recovery of photosynthetic parameters took place after rewatering and washing off of excess salt, indicating that no permanent damage occurred, and suggesting downregulation rather than permanent impairment of the photosynthetic apparatus. Sweetgum trees were capable of withstanding and surviving moderate drought and salt events by activating defense mechanisms conferring tolerance to environmental stresses, without increasing the emission in the atmosphere of the highly reactive isoprene.

Graphical Abstract

1. Introduction

The wide range of ecosystem services provided by urban trees and their benefits to the environment, climate, and human population are well recognized [1]. Trees can ameliorate the urban environment by reducing the heat island effect, sequestering CO2, and lowering atmospheric pollutants [2,3]. However, urban tree performance and functionality are decreased by human activities, limited sunlight, environmental pollutants, restricted soil volume and water availability, extreme temperatures, and soil compaction, some of which can be exacerbated by climate change [4]. Soil salinity and water deficit are two main environmental stressors significantly constraining plant growth and life span [5,6]. Unfortunately, these stressors are becoming more widespread in many regions and their severity is predicted to increase [7]. In cities, drought stress is induced by both enhanced evapotranspiration and restricted soil volume, which prevent a sufficient amount of water from being retained in soils [8]. High soil salinity occurs in urban areas of temperate and boreal zones due to the extensive use of deicing salts, usually sodium chloride, during the winter period. Salt dispersion from paved surfaces to the surrounding soil causes a peak of salinity in the roadside rooting zone, especially at the beginning of the growing season, when trees are more sensitive [9]. The negative effects of salt stress on vegetation are well documented and have been observed especially in trees located in close proximity to the areas where salt has been applied [10,11]. NaCl exposure negatively affects plant performance by both affecting soil water potential, resulting in early-occurring osmotic stress, and by the direct accumulation of ionic Na+, with additional Cl− stress [12]. Furthermore, the negative effects of deicing salts can be aggravated by other environmental factors, such as drought [13].
Salt and drought stresses have negative effects on plant performance, ranging from molecular to physiological and biochemical responses, such as stomatal closure, decreased gas exchange, osmolyte accumulation, upregulation of antioxidant enzymatic systems, and changes in plant hormones [14,15]. Prolonged salt and drought stress can induce an osmotic response, allowing trees to maintain water uptake and cell turgor, while plants exposed to salt stress experience additional hyperionic and hyperosmotic stresses [14]. The photosynthetic apparatus functional state is a physiological indicator of the plant sensitivity to environmental abiotic stresses [16,17,18]. Stress-induced suppression of photosynthesis is accompanied by a downregulation of photosystem activity (i.e., photosystem II (PSII)) and an increased thermal dissipation of excess excitation energy (nonphotochemical quenching) during the day, often reversible within minutes to hours after relief of excessive light, presumably acting as a photoprotection mechanism [19]. Plants may also activate and enhance their photoprotective systems, e.g., xanthophyll cycle, for defense against irreversible damages [20]. The photoprotective mechanisms compete with photochemistry for the absorbed light energy, leading to a decrease in quantum yield of photosystem II (PSII). Light-dependent thermal dissipation, also called nonphotochemical quenching (NPQ), can be divided into photoprotective quenching and photoinactivated photosystem II (PSII) re-emission [21,22]. The former is realized by the xanthophyll cycle and is able to dissipate up to 75% of the total absorbed energy [23]. The xanthophyll cycle involves the conversion (de-epoxidation) of violaxanthin (V) into zeaxanthin (Z) via antheraxanthin (A) under irradiance excess, and the reversed reaction (epoxidation) under low irradiance [24,25,26]. The products of the light-dependent phase of the xanthophyll cycle play an important role in the protection against oxidative stress generated by irradiance excess, but also by other reactive oxygen species (ROS) generating conditions, such as drought or salt stress [26]. Enhanced de-epoxidation of the xanthophyll cycle and antioxidant levels have been associated with increased drought stress resistance in several Mediterranean species [27]. An ability to maintain the photoprotective and antioxidative mechanisms during drought has been associated also with a rapid recovery [24,28].
In addition to the best-documented physiological responses, the emission of volatile organic compounds (VOCs) such as terpenoids (e.g., isoprene) can contribute to the protection of photosynthetic apparatus against thermal and oxidative stresses [29,30,31], acting as a metabolic safety valve. Isoprene emission plays an important ecological and physiological role in the protection of plants from environmental constraints [32,33]. Photosynthesis reduction and stomatal closure induced by drought and salinity stresses are expected to reduce VOC emission. However, water stress is known to uncouple isoprene emission from photosynthesis [34]. In fact, drought can cause substantial reduction of photosynthesis, whereas isoprene emission is only slightly reduced until the stress becomes more severe and almost completely inhibits photosynthesis [35,36]. Isoprene is a highly reactive compound, which in the urban context can lead to the production of tropospheric ozone (O3), a secondary pollutant and greenhouse gas formed in the presence of nitrogen oxides (NOx) and VOC [37]. The photochemical formation of secondary pollutants is an important environmental concern due to their negative effect on air quality and on human health [38]. Thus, it is important to assess plant responses to urban stressors, bearing in mind the influence of biogenic VOC (especially isoprene) emission on atmospheric chemistry.
Studies on the possible mechanisms for the combined effects of moderate drought and salt exposure are scarce, but the available data suggest that their interaction depends on both the nature of the constraint and the plant species. [39].
Plants’ responses to moderate stress levels and their recovery mechanisms are complex and still not well understood [34,40]. In addition, plant performance under the combination of drought and salt stress is unique and cannot be extrapolated from the corresponding responses to each individual stress [41,42]. To our knowledge, there are no tree physiology studies on the combined effects of drought and salt stress on isoprene emissions. In this study, we addressed some of these knowledge gaps, investigating how the effects of moderate levels of drought, salt stress, and their combination affect leaf water potential, the efficiency of photosynthetic apparatus, and isoprene emission in Liquidambar styraciflua L. Sweetgum, a broadleaf species original of Northern America, is a high isoprene emitter, sensitive to salinity [43] and water loss [44], used in European cities for urban landscaping for its aesthetic values.

2. Materials and Methods

2.1. Plant Material and Experimental Set-Up

The study was carried out in 2015 on three-year-old Liquidambar styraciflua saplings potted in 15 L pots, filled with universal potting soil containing peat and pumice, at pH 6.5; N, P, K were 1000 mg dm−3. Twenty plants of 1.5 m height, selected for their homogeneity in a commercial Italian nursery, were randomly allocated in an open-sided greenhouse of the Institute of BioEconomy of National Research Council (IBE-CNR) in Bologna and irrigated daily with tap water. On April 28th, ten plants were kept irrigated with tap water (control) while the other ten were exposed to increasing NaCl concentrations (salt stressed) from 0 to 25 mM, 50 mM, 75 mM, and finally to 100 mM within 9 days (May the 5th), to avoid osmotic shock. This concentration, which was kept until the end of July (83 days), was chosen to simulate the salt accumulation nearest to the road margin. The amount of the applied water was calculated as the amount needed to obtain field capacity. Salt concentrations were monitored in situ by measuring the electrical conductivity (EC) of the solution with an EcoTestr EC High (Thermo Fisher Scientific Inc., Waltham, MA, USA). On July the 10th, both control and salt-stressed plants were further divided in two batches of five plants each to test the effects of water stress by stopping irrigation. Therefore, the experiment consisted of four treatments with five plants each: control, water stress, salt stress, and combination of salt and water stress. After 12 days of drought (July the 22nd), water supply to all drought-stressed plants was resumed, while at the end of July (83 days) NaCl treatment was suspended by irrigating with salt-free water.

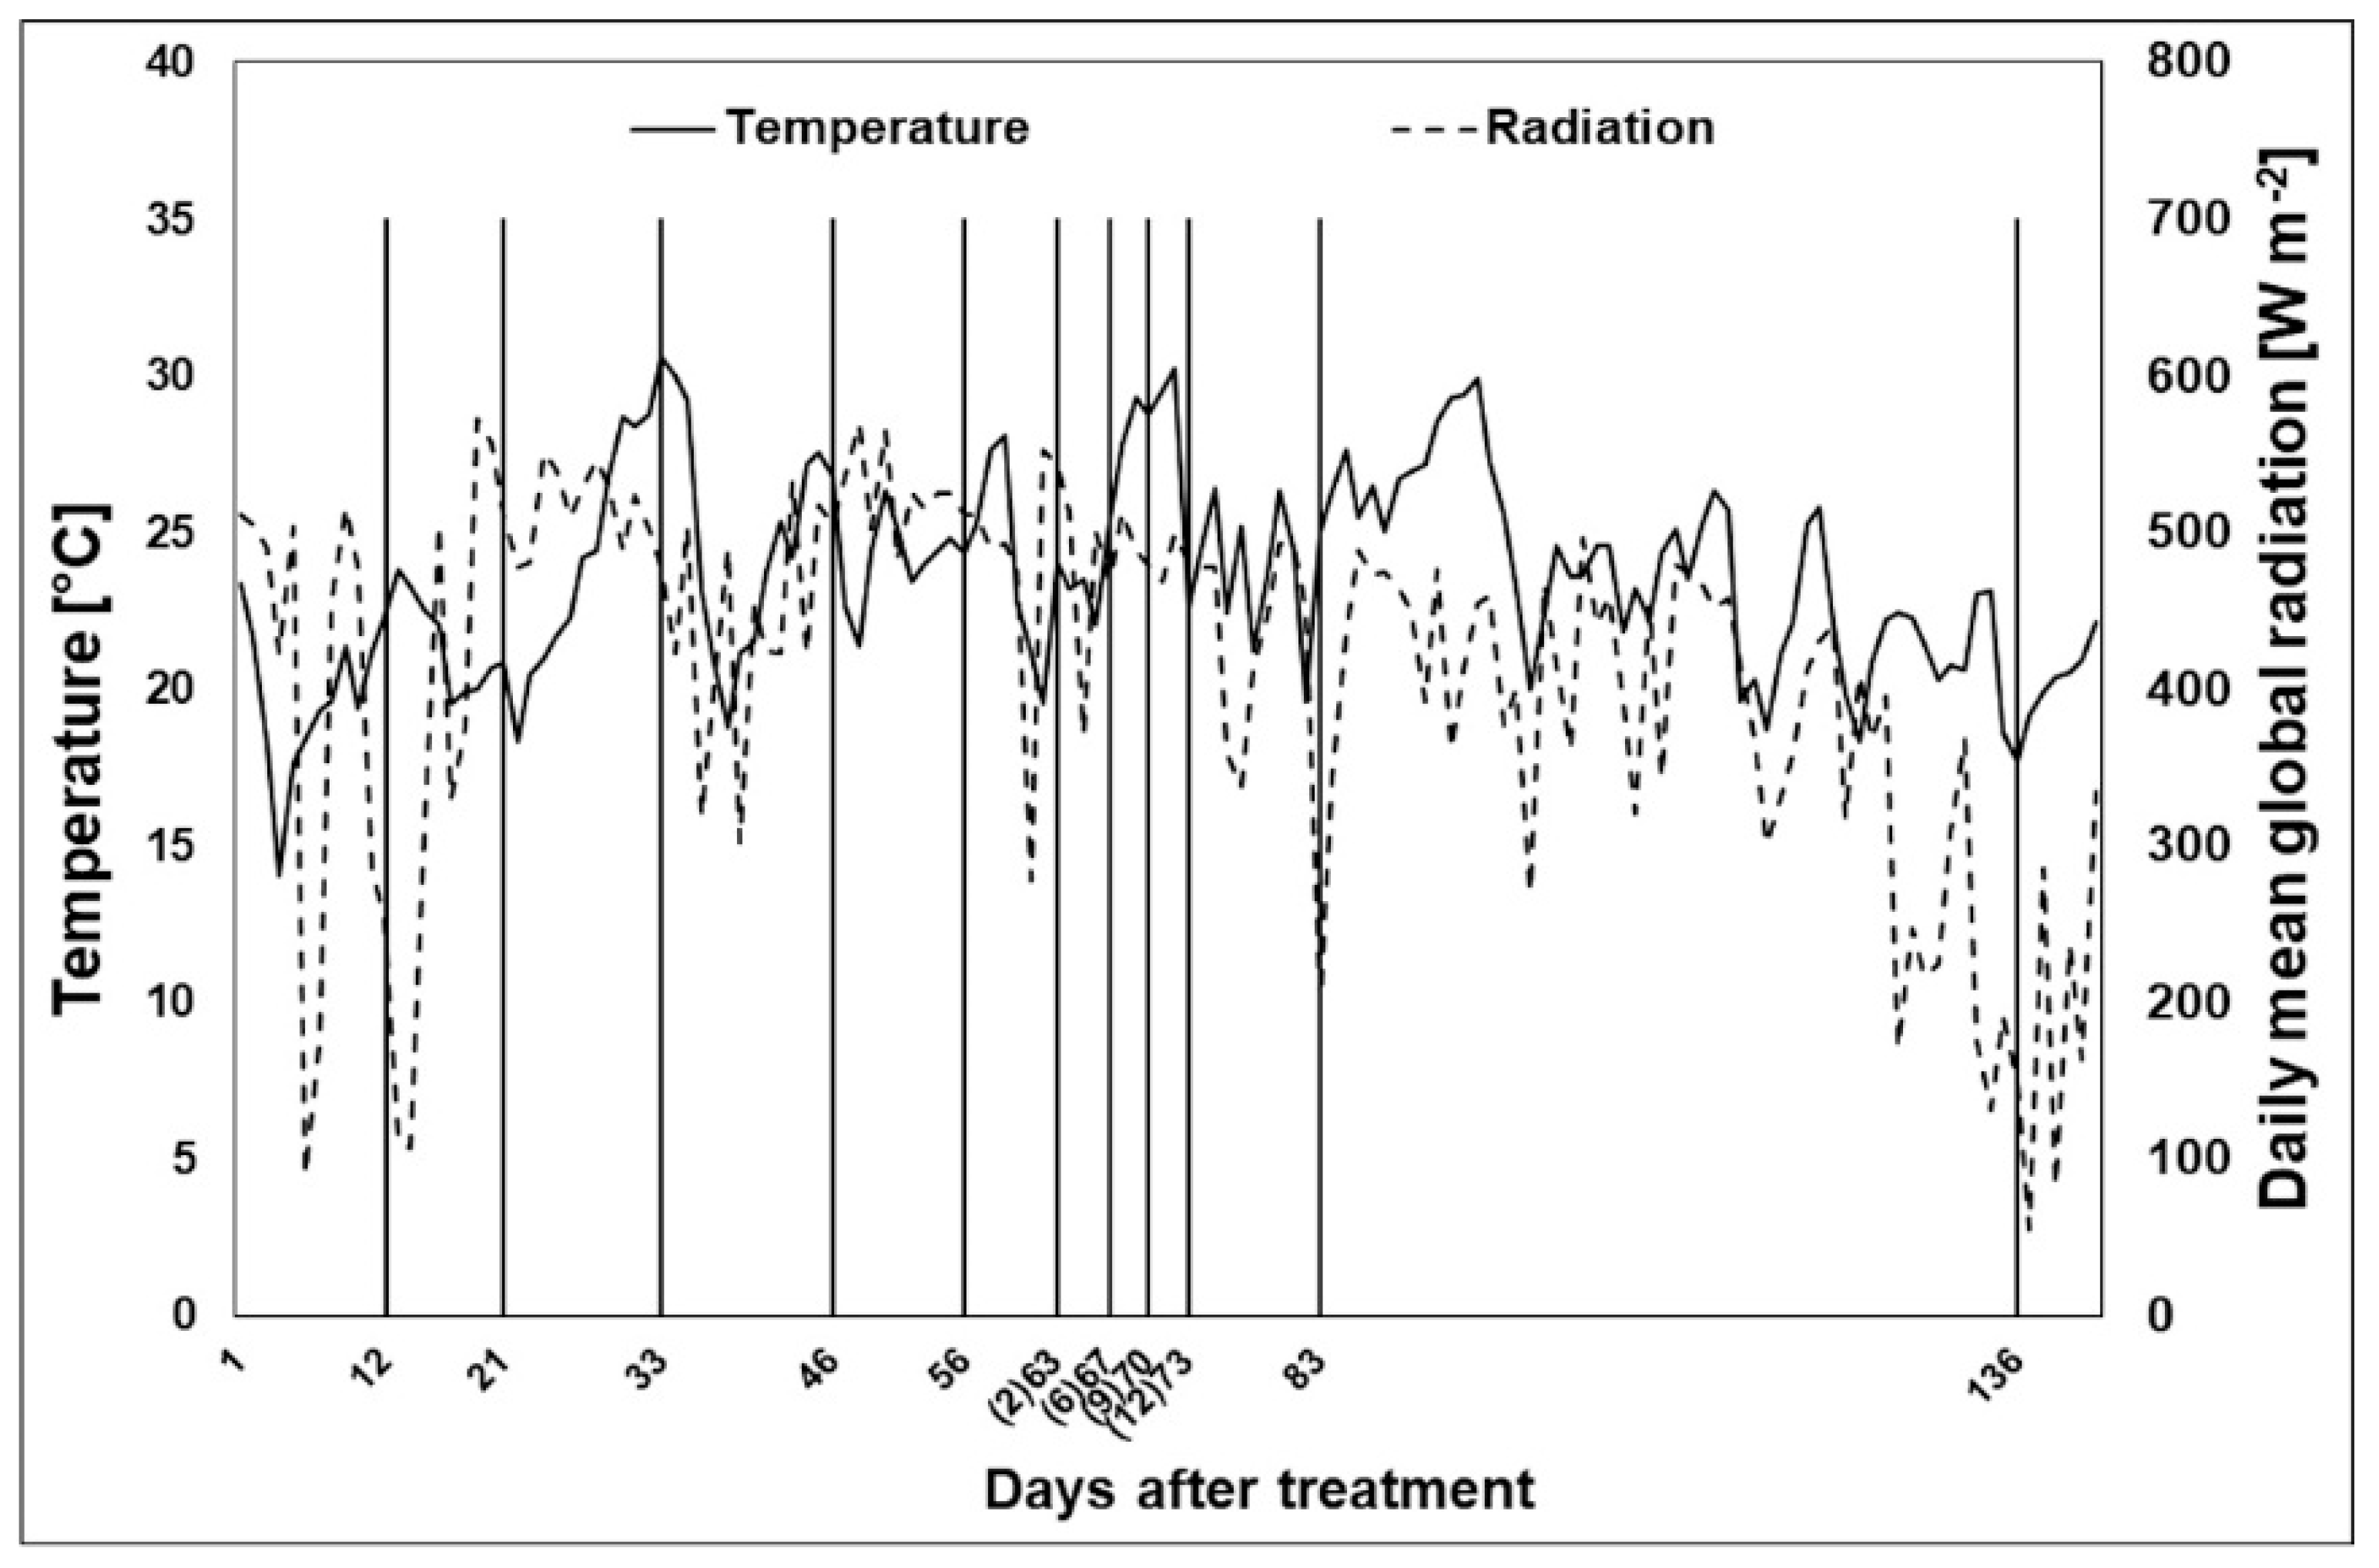
2.2. Meteorological Measurements

During the experimental period, meteorological data were recorded by a permanent weather station located near the nursery. Incoming radiation was measured by a pyranometer with a spectral range of 340–2200 nm (Kipp and Zonen, Delft, The Netherlands).

2.3. Physiological Measurements

Physiological measurements and leaf samplings were performed at 12, 21, 33, 46, 56, 63 (2), 67 (6), 70 (9), 73 (12), 83, and 136 days after the beginning of salt and, in brackets, drought stress treatments. To evaluate plant recovery from water and salt stress, physiological measurements and samplings were carried out at the end of July (83 day) and on September the 22nd (136 day), respectively. On the evening before each measurement day, plants were transferred from the open-sided greenhouse to a darkened room to keep them away from sunlight until the next morning (7 am), when predawn leaf water potential (ψpd) and dark-adapted chlorophyll a fluorescence were measured. At the same time, leaf samples were collected for measuring xanthophylls. After moving plants to full light and acclimation, measurements of leaf gas exchange and isoprene emissions were taken, as well as chlorophyll a fluorescence in light-adapted leaves. Finally, the leaf samples were collected for measuring xanthophyll in light-adapted leaves. All measurements and samplings are mean of ten observations; the observations were taken on one marked fully expanded and undamaged leaf for 10 plants (days 12 to 56) or on two leaves for five plants when only five plants represented each treatment (day 63—end of the experiment).

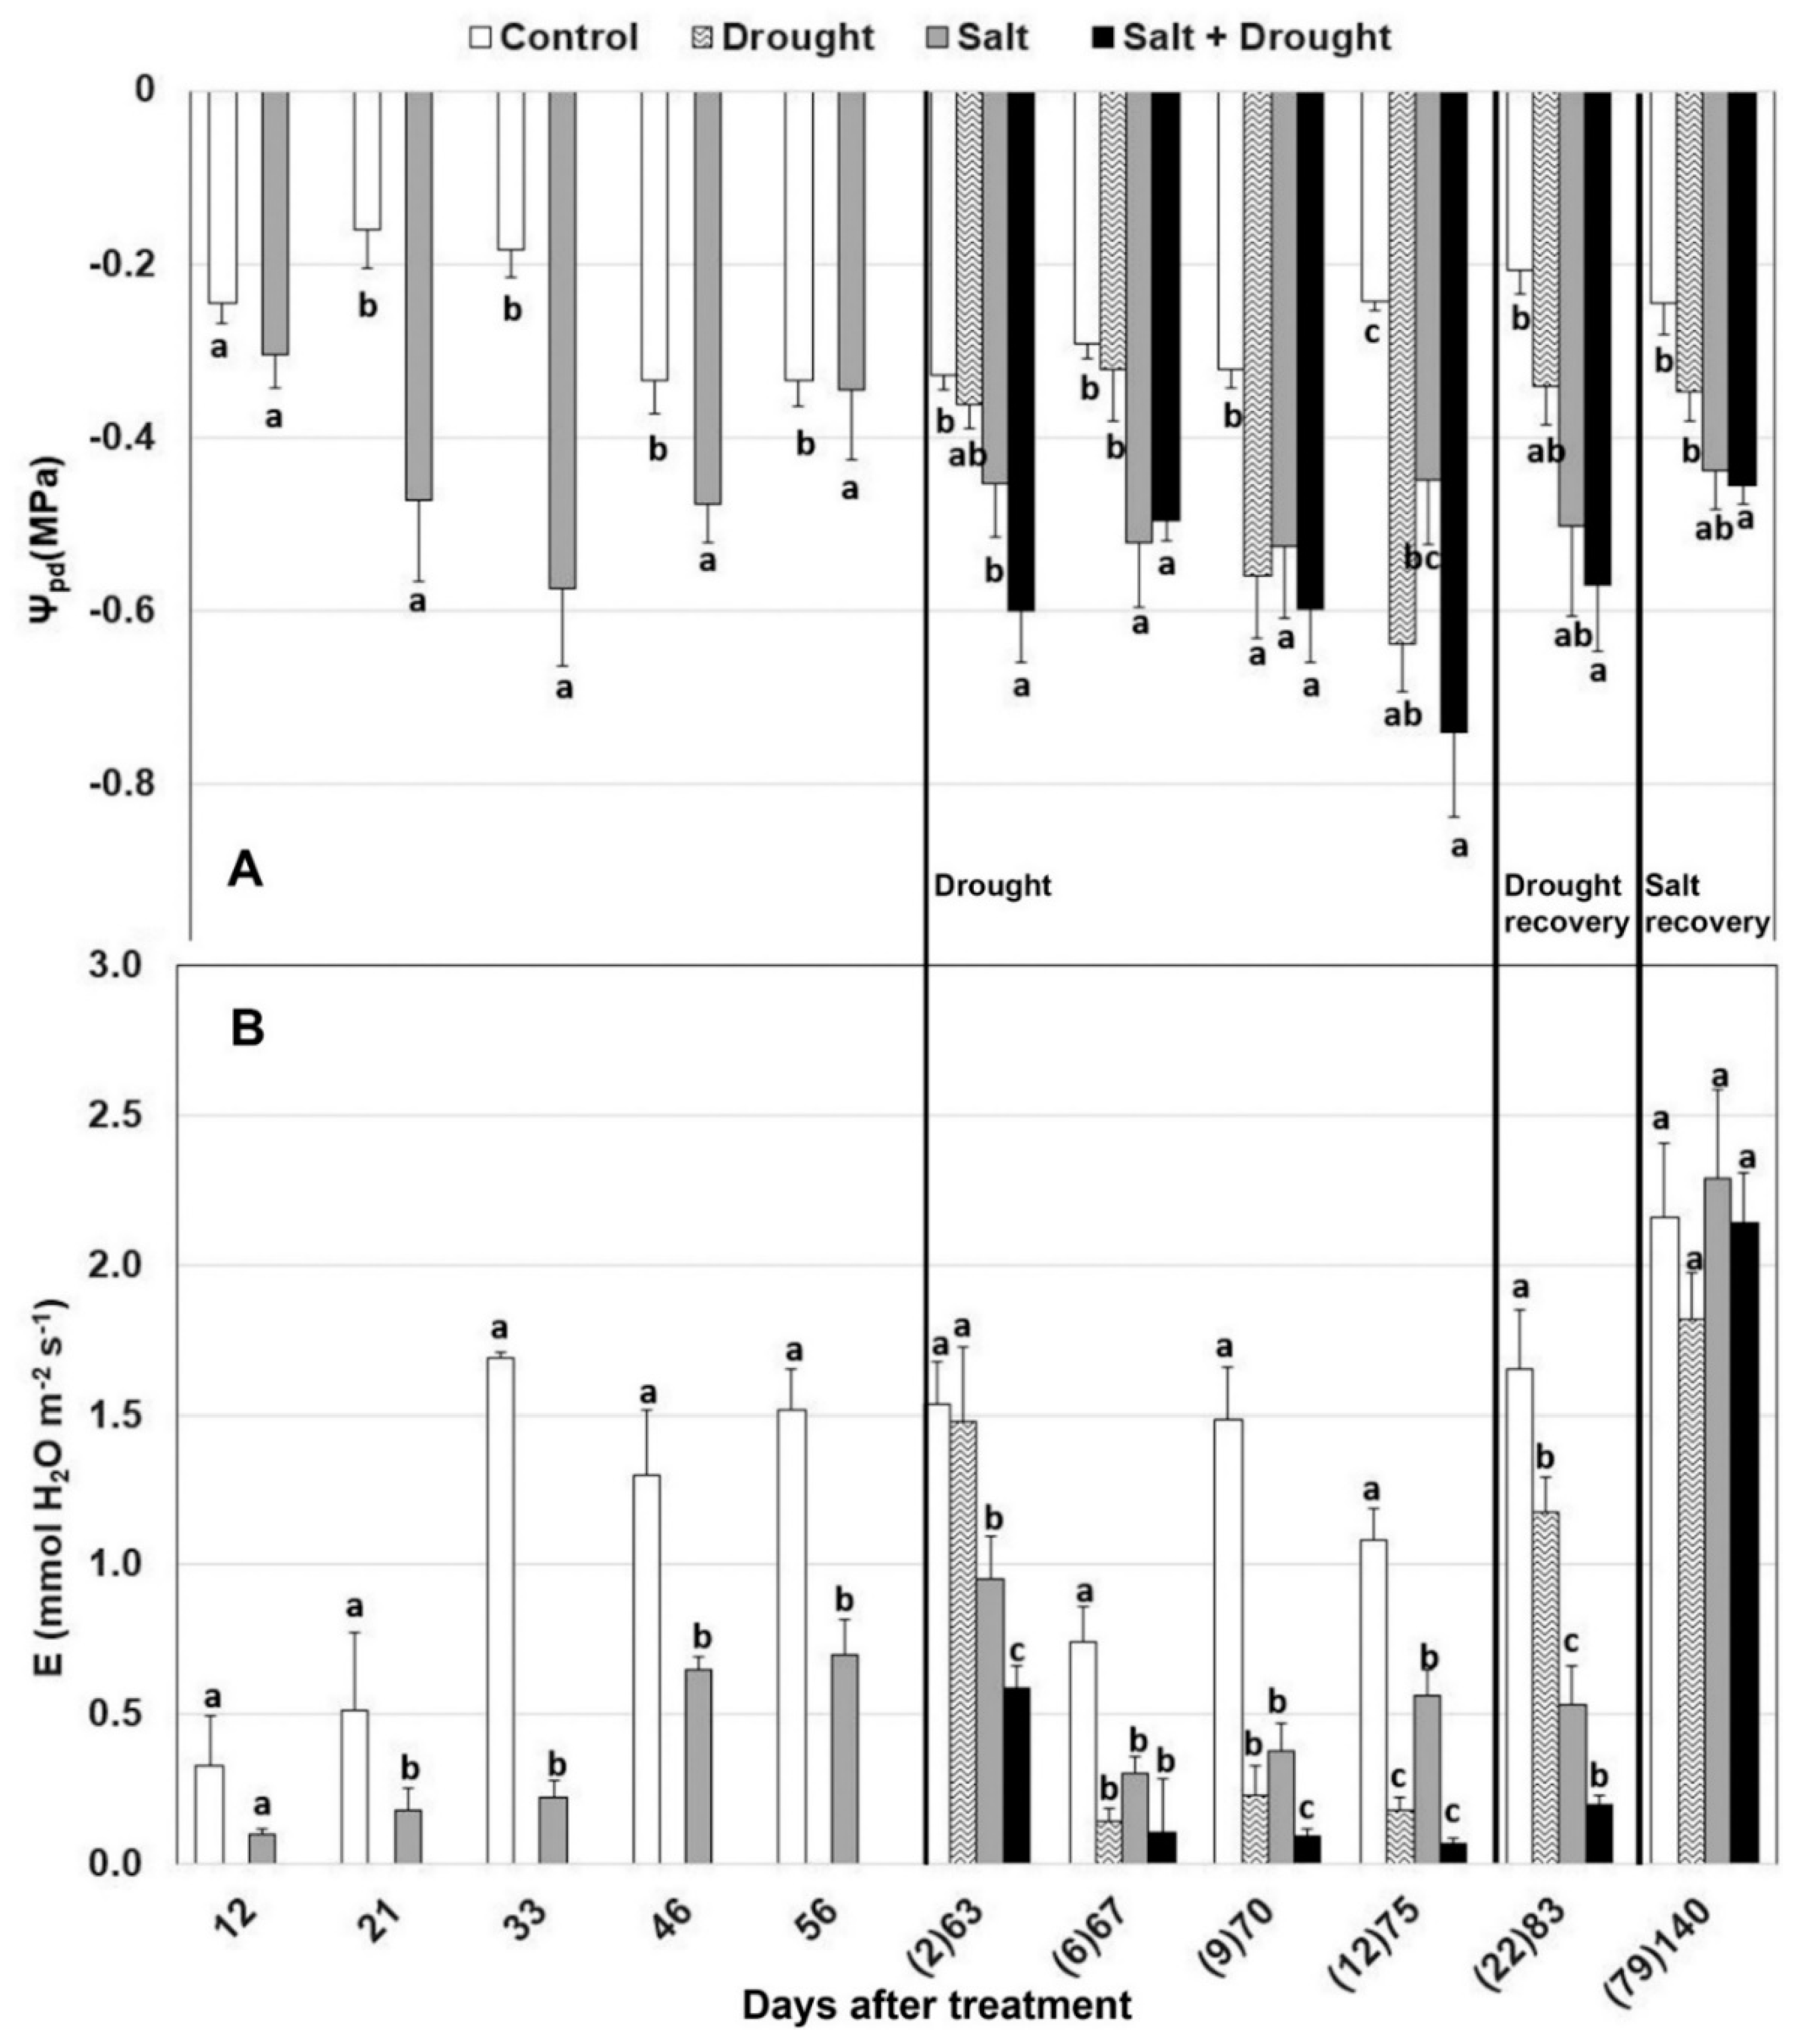
2.3.1. Leaf Water Potential Analysis

Leaf water potential was determined using a pressure chamber (SKPM 1440/80, SKYE Instruments Llandrindod Wells, Powys LD 6DF, UK). A cut-off leaf was placed between the seals of the pressure chamber, and then air pressure was gradually increased until the first appearance of xylem sap on the petiole, relating to the force with which the leaf blade retains water.

2.3.2. Gas Exchanges and Chlorophyll Fluorescence Measurements

Net carbon assimilation (A), stomatal conductance (gs), and transpiration (E) rate were measured with LI-6400 Photosynthesis System (LI-COR, Inc., Lincoln, NE, USA) equipped with a 6400-40 Leaf Chamber Fluorometer and 6400-01 CO2 mixer. Measurements were conducted between 10 am and 1 pm, when changes in environmental conditions were relatively small and gradual. Measurements were taken at reference CO2 (400 µmol s−1), constant flow rate (500 µmol s−1), relative humidity ranging from 30% to 50% and VPD ranging from 2 to 3.7 kPa. Photosynthetic photon flux density (PPFD, 1000 µmol m−2 s−1) and temperature (30 °C) were set at the standard condition for measuring isoprene basal emission [45]. Leaf chlorophyll a fluorescence was measured concurrently with leaf gas exchange measurements after (i) darkness or (ii) light exposure and determined from steady state and saturated fluorescence [25]. In dark-adapted leaves, basic fluorescence parameters were recorded automatically: (1) minimum chlorophyll fluorescence (Fo), when all photosystem II reaction centers are open; (2) maximum chlorophyll fluorescence (Fm), when all photosystem II reaction centers are closed; and variable fluorescence (Fv = Fm − Fo), used for calculating the maximum quantum efficiency of Photosystem II (Fv/Fm). Measurements of chlorophyll a fluorescence on light-acclimated leaves allowed the recording of the maximum variable chlorophyll fluorescence yield in the light-adapted state (F’v), the photochemical efficiency of PSII (ΦPSII = (F’m − F)/F’m), and nonphotochemical quenching (NPQ = (Fm − F’m)/F’m, where F’m refers to the maximum fluorescence measured in light-acclimated leaves).

2.3.3. Xanthophyll Analysis

At predawn and at midday of each day, the same leaves used for measuring chlorophyll a fluorescence were collected and stored in liquid nitrogen at −80 °C until analysis. Two discs (0.64 cm2) were cut from each leaf, ground in a mortar in liquid nitrogen, and extracted with 1.5 mL cold HPLC grade 100% acetone according to Ripullone et al. [46]. The pigments in the extracts were analyzed with a HPLC system (Model LC-10AS with an SPD-10AV detector, Shimadzu, Kyoto, Japan), and their relative concentrations were calculated according to Baraldi et al. [25]. To estimate the actual number of partially or totally de-epoxidised molecules within the xanthophyll cycle compared to the maximum possible, the xanthophyll de-epoxidation state (DEPS) index, resulting from the conversion of V to Z via A, was calculated as: (Z + 0.5A)/(V + A + Z) [47].

2.3.4. Isoprene Analysis

Isoprene emissions were measured in real time, simultaneously to gas exchange on the same light-adapted leaves and plants, by connecting the inlet of a proton transfer reaction—mass spectrometer (PTR-MS—Ionicon Analytik Ges.m.b.H., Innsbruck, Austria) directly to the LI-COR 6400 cuvette with a Teflon tube. During measurements, the PTR-MS was set to operate in selected ion monitoring (SIM) mode, acquiring the protonated ion 69+ and running continuously to complete at least ten real-time cycles for measurement [48]. The setting involved a pressure of 2.6 mbar and the acquisition of the single ion signals every second; the results in counts per second (CPS) were converted in nmol s−1 with calibration curves and referred to the leaf area.

2.4. Statistical Analyses

A linear mixed effect model was used to assess the effect of tree (as random factor), salt, drought and the combination of stresses (as fixed factors) on gas exchanges, chlorophyll a fluorescence, and isoprene emission. A repeated measures ANOVA was used to assess dependent variables over time. All statistical analyses were performed with general linear model (GLM) SAS 9.4/STAT software (SAS Institute, Cary, USA). For multiple comparisons, a Tukey’s HSD post hoc test was used. Results were considered significant at p < 0.05.

3. Results

3.1. Meteorological Data

The daily average temperature was 21.5, 24.5, 24.7, 25.4, and 21.1 °C in May, June, July, August, and September, respectively (Figure 1). The highest temperature was recorded on the 34th (30.6 °C) and the 73rd (30.2 °C) days after the beginning of salt treatment, while the lowest was recorded on the 23rd day (18.3 °C). The daily mean radiation values were 375, 486, 463, 427, and 282 W m−2 in May, June, July, August, and September, respectively (Figure 1).

3.2. Physiological Measurements

3.2.1. Plant Water Status

Plant water status was negatively affected by both stresses, but also by environmental conditions, such as high temperatures and radiation, that lowered leaf hydration. The minimum value of ψpd was found in plants exposed to the combination of stresses, reaching the value of –0.75 MPa on the 73rd day after the beginning of salt stress treatment (12th day of drought stress) in conjunction with high temperature (30 °C; Figure 1 and Figure 2A). In plants treated with salt stress alone, a significant decrease of ψpd compared to control was recorded after three weeks of treatment and remained low throughout the experimental period. Drought stress alone led to a significant decrease of ψpd compared to control after nine days of water withholding, while when applied in combination to salt stress, a significant ψpd decrease occurred already after two days. After 12 days of drought, plants began to wilt and watering was restored. Drought-stressed plants positively responded to water recovery (83rd day), reaching water potential similar to those recorded in their respective control plants (control and salted plants). After salt recovery (136th day), only the plants subjected to the combination of stresses did not reach similar ψpd compared to the control plants.
After 12 days of salt stress, transpiration rate significantly decreased compared to control plants and remained different through the experimental treatment (Figure 2B). The impact of drought was more pronounced in combination with salt stress, reducing transpiration already after two days of water withholding, while it occurred after six days when applied alone. The greatest reduction of transpiration was recorded between the 67th and the 73rd day, when plants were subjected to high temperatures as well (Figure 1). After the water recovery period (83rd day), transpiration rate increased in plants exposed to drought and both drought and salt stress, reaching values similar to those recorded in their respective control. After the salt recovery period, transpiration was similar in all plants (Figure 2B).

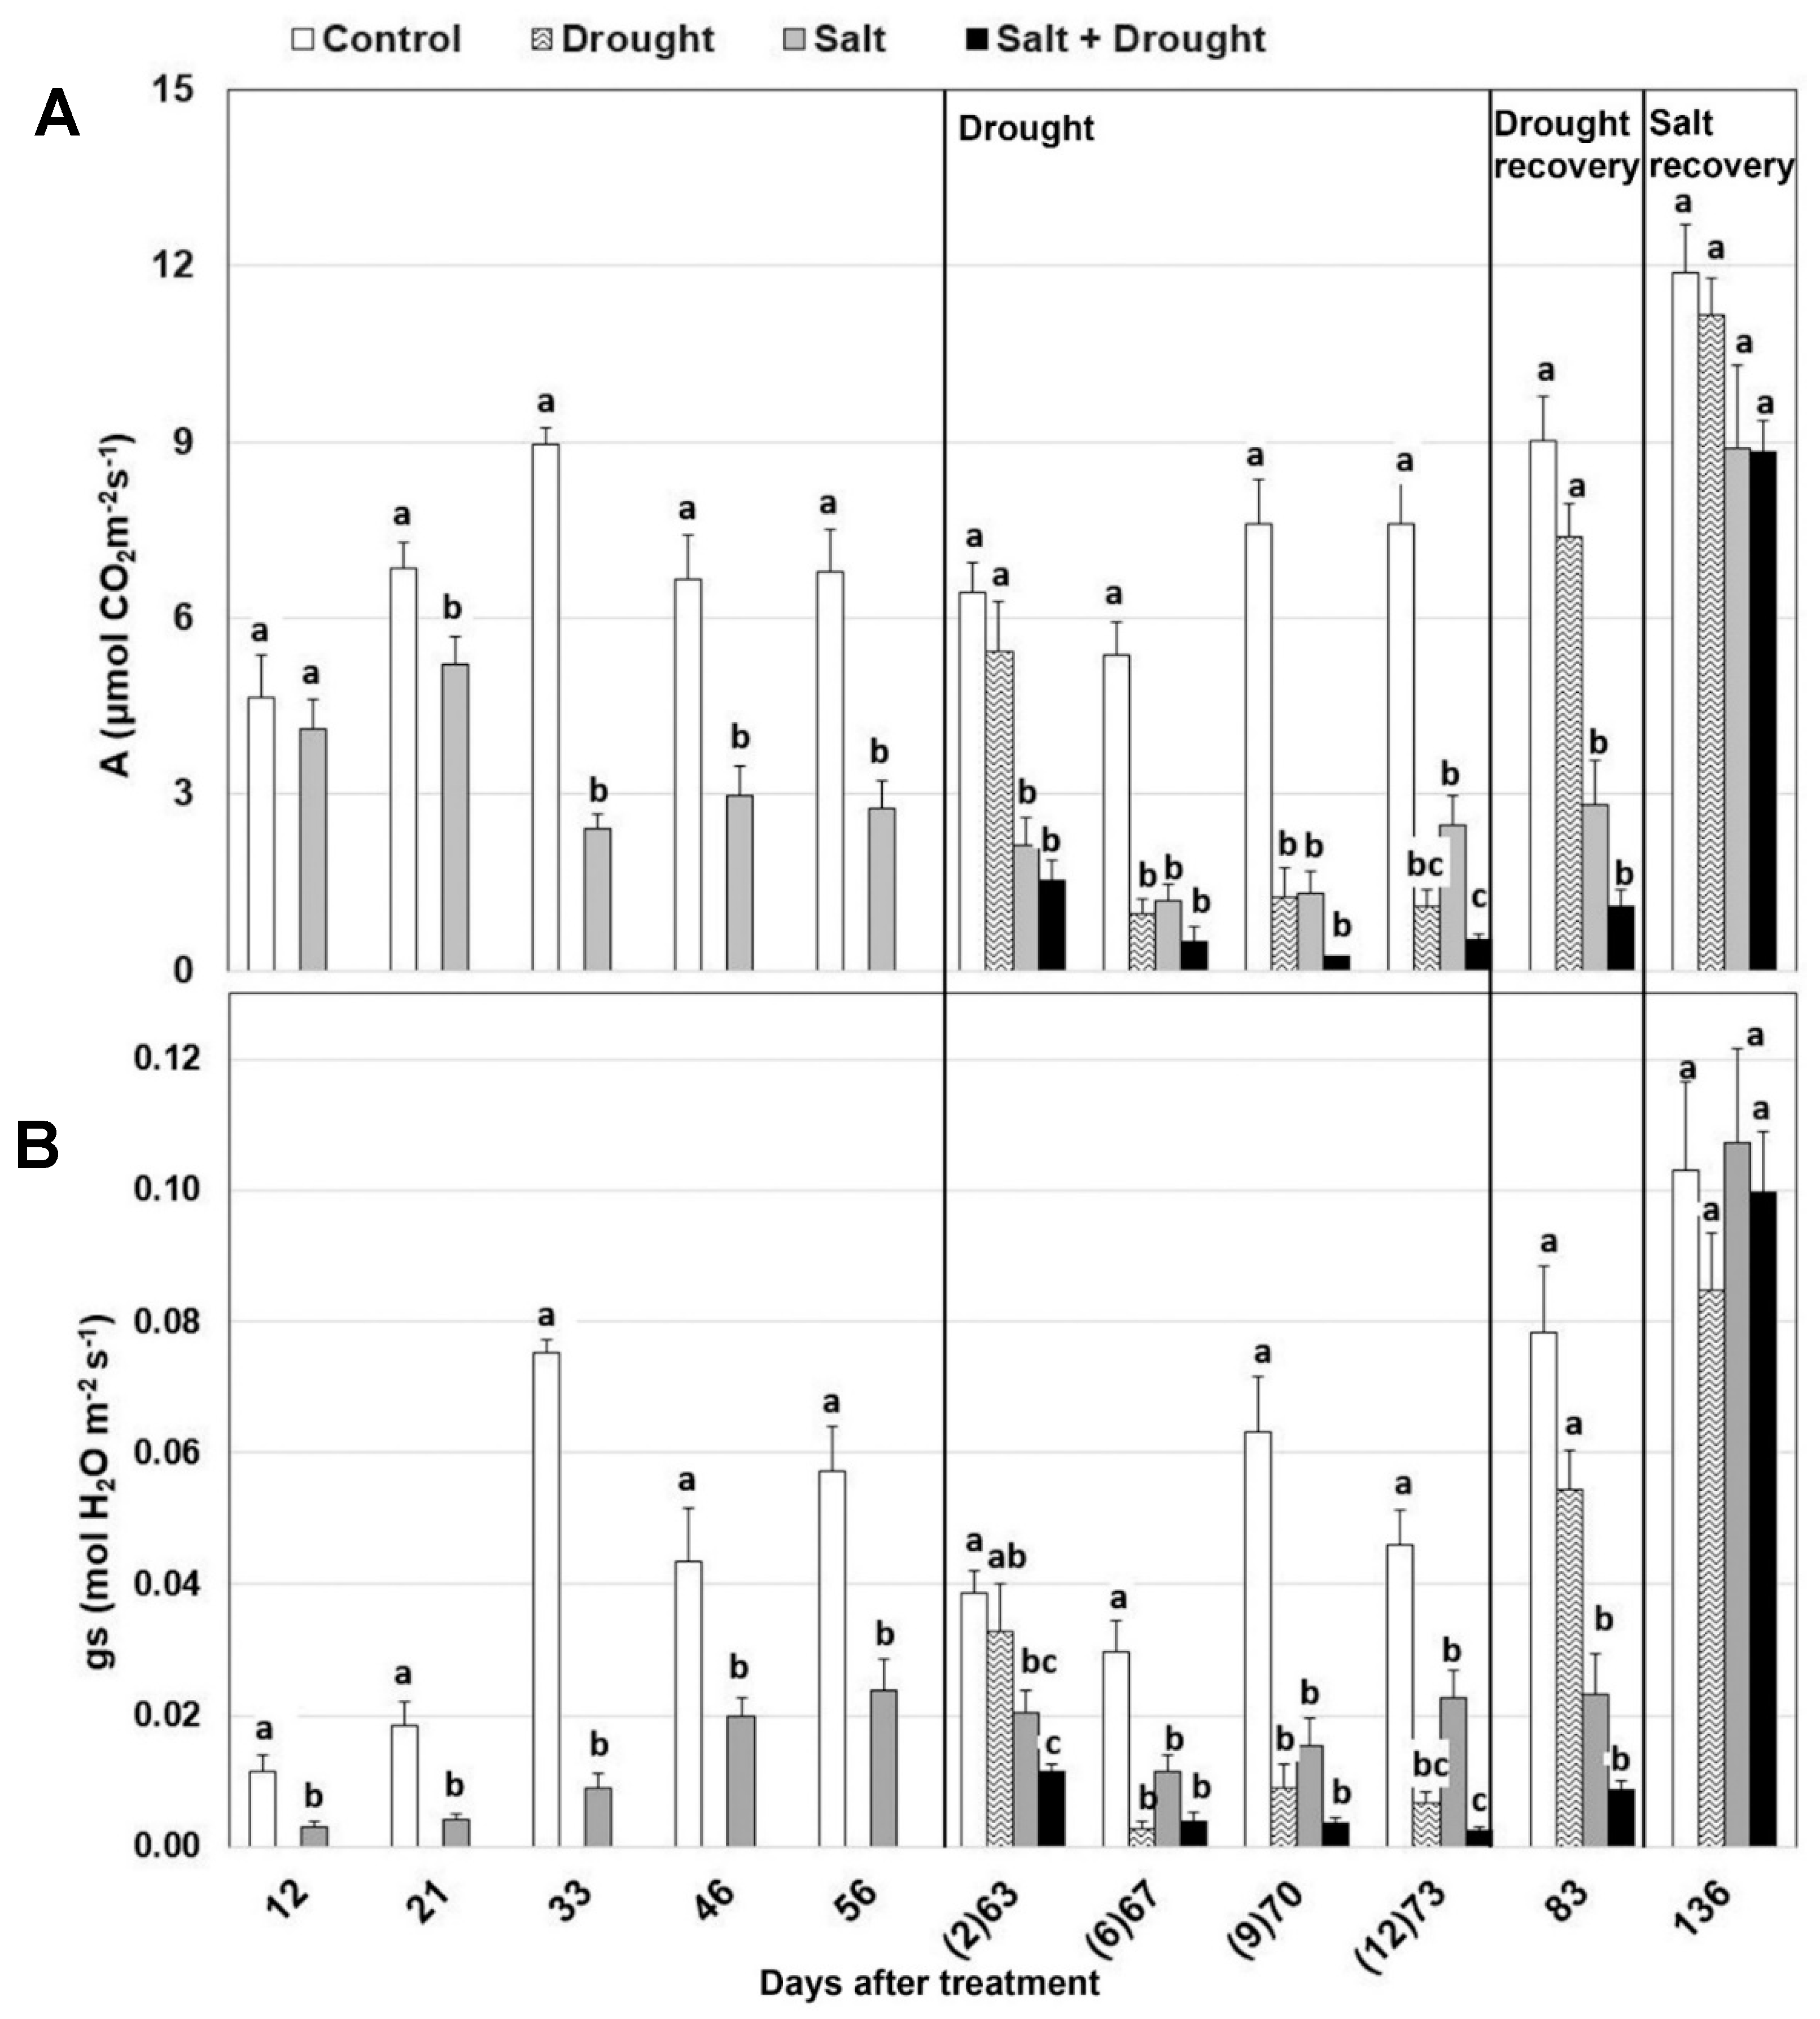
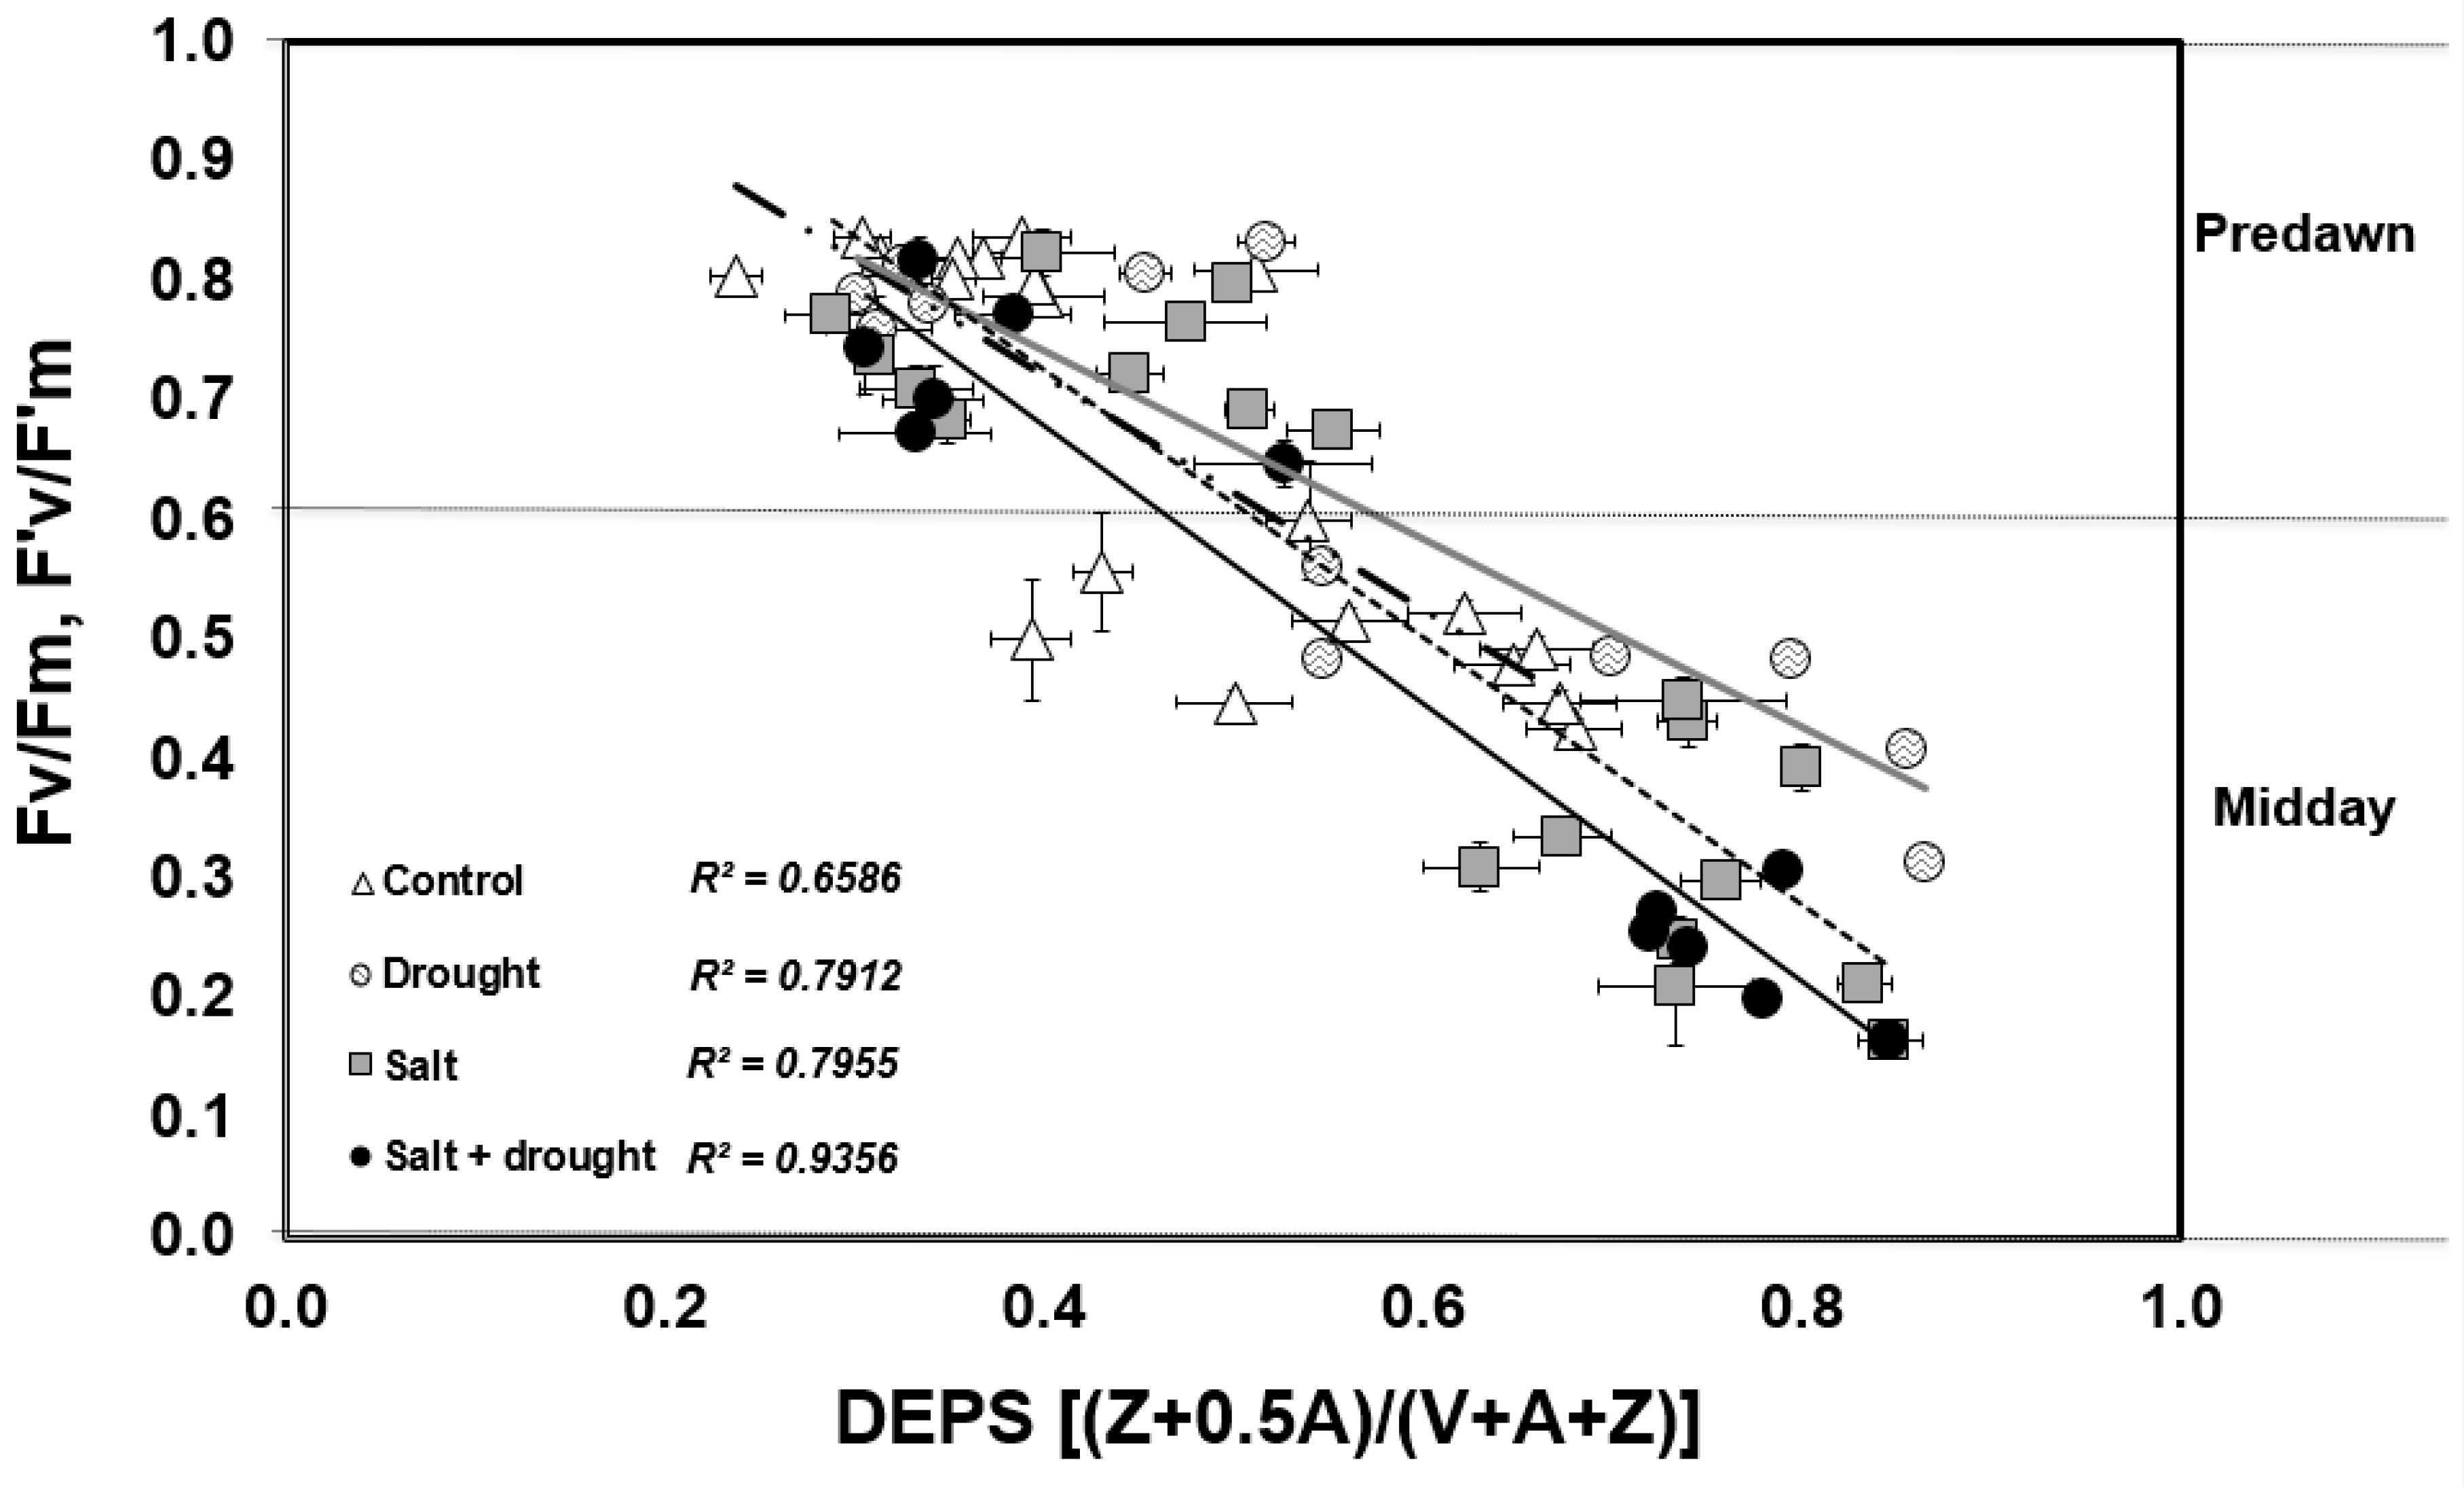
3.2.2. Photosynthesis and Chlorophyll Fluorescence Parameters

Salt stress significantly reduced photosynthesis and stomatal conductance within the first three weeks of treatment by 24% and 77%, respectively (Figure 3A,B). These reductions further increased, reaching the maximum of 83% and 67%, for A and gs, respectively, after 70 days. Water stress further reduced photosynthesis and stomatal conductance in both control and salt-stressed plants. At the beginning of water stress (2nd day), the main factor affecting A and gs was still salt stress (Table 1). In fact, the nested factorial ANOVA model explained 83.3% and 58.5% of their variation, respectively. When water shortage became more severe (12th day) and ψpd strongly declined, drought became the main affecting factor, explaining 73.4% and 88.0% of the variation of A and gs, respectively (Table 1).
After drought recovery (day 83), both physiological parameters returned to the level of their control in both water and water and salt-stressed plants, with the detrimental effect of salt still evident (Figure 3A,B). Salt treatment again accounted for 79.7% and 72.1% of variation of A and gs, respectively (Table 1). After salt stress recovery (day 136), both photosynthesis and stomatal conductance were completely restored in all the plants (Figure 3A,B).
The maximum efficiency of PSII (Fv/Fm) in control leaves remained close to 0.8 throughout the experiment, while both drought and salt stress significantly affected chlorophyll a fluorescence parameters (Table 2).
The maximum efficiency of PSII, Fv/Fm, was not influenced by salt stress until the 33rd day of salt treatment, when it significantly dropped. At the same time, the minimum chlorophyll fluorescence, Fo, significantly increased, reaching the maximum value on the 73rd day, when it was higher than the control by 31% and 51% in salt-stressed plants and in the combination of both stresses, respectively. Negative effect of drought on Fo was much lower than that induced by salt stress, becoming significant only after 12 days of water withholding. Drought did not exacerbate the impact of salt stress on Fo. Similarly to Fo, the greatest effect of salinity on Fv/Fm values in salt-treated plants was recorded between the 70th–73rd days of treatment (reduction by 12%–13%). Drought alone did not affect Fv/Fm, while it significantly decreased it when in combination with salt. The photochemical efficiency of PSII (ΦPSII) was more sensitive to salt stress and drought than Fo and Fv/Fm. In fact, significant downregulation of this parameter was already recorded at the 21st day of salt stress and after nine days of drought. Again, water withholding did not affect ΦPSII when applied to salt-stressed plants. In the same period, salt stress significantly increased the nonphotochemical quenching, NPQ, compared to the control, while drought stress alone significantly increased NPQ after 12 days of treatment. Water withholding combined with salt stress significantly affected ΦPSII only compared to the control, but not to salt stress applied alone. A complete recovery from drought and salt stress resulted in full restoration of all the fluorescence parameters after 136 days of treatment (Table 2). The main constraint affecting all of these chlorophyll a fluorescence parameters was salt stress, as demonstrated by the high percentage of variability explained, along the whole experimental period (Table 3).

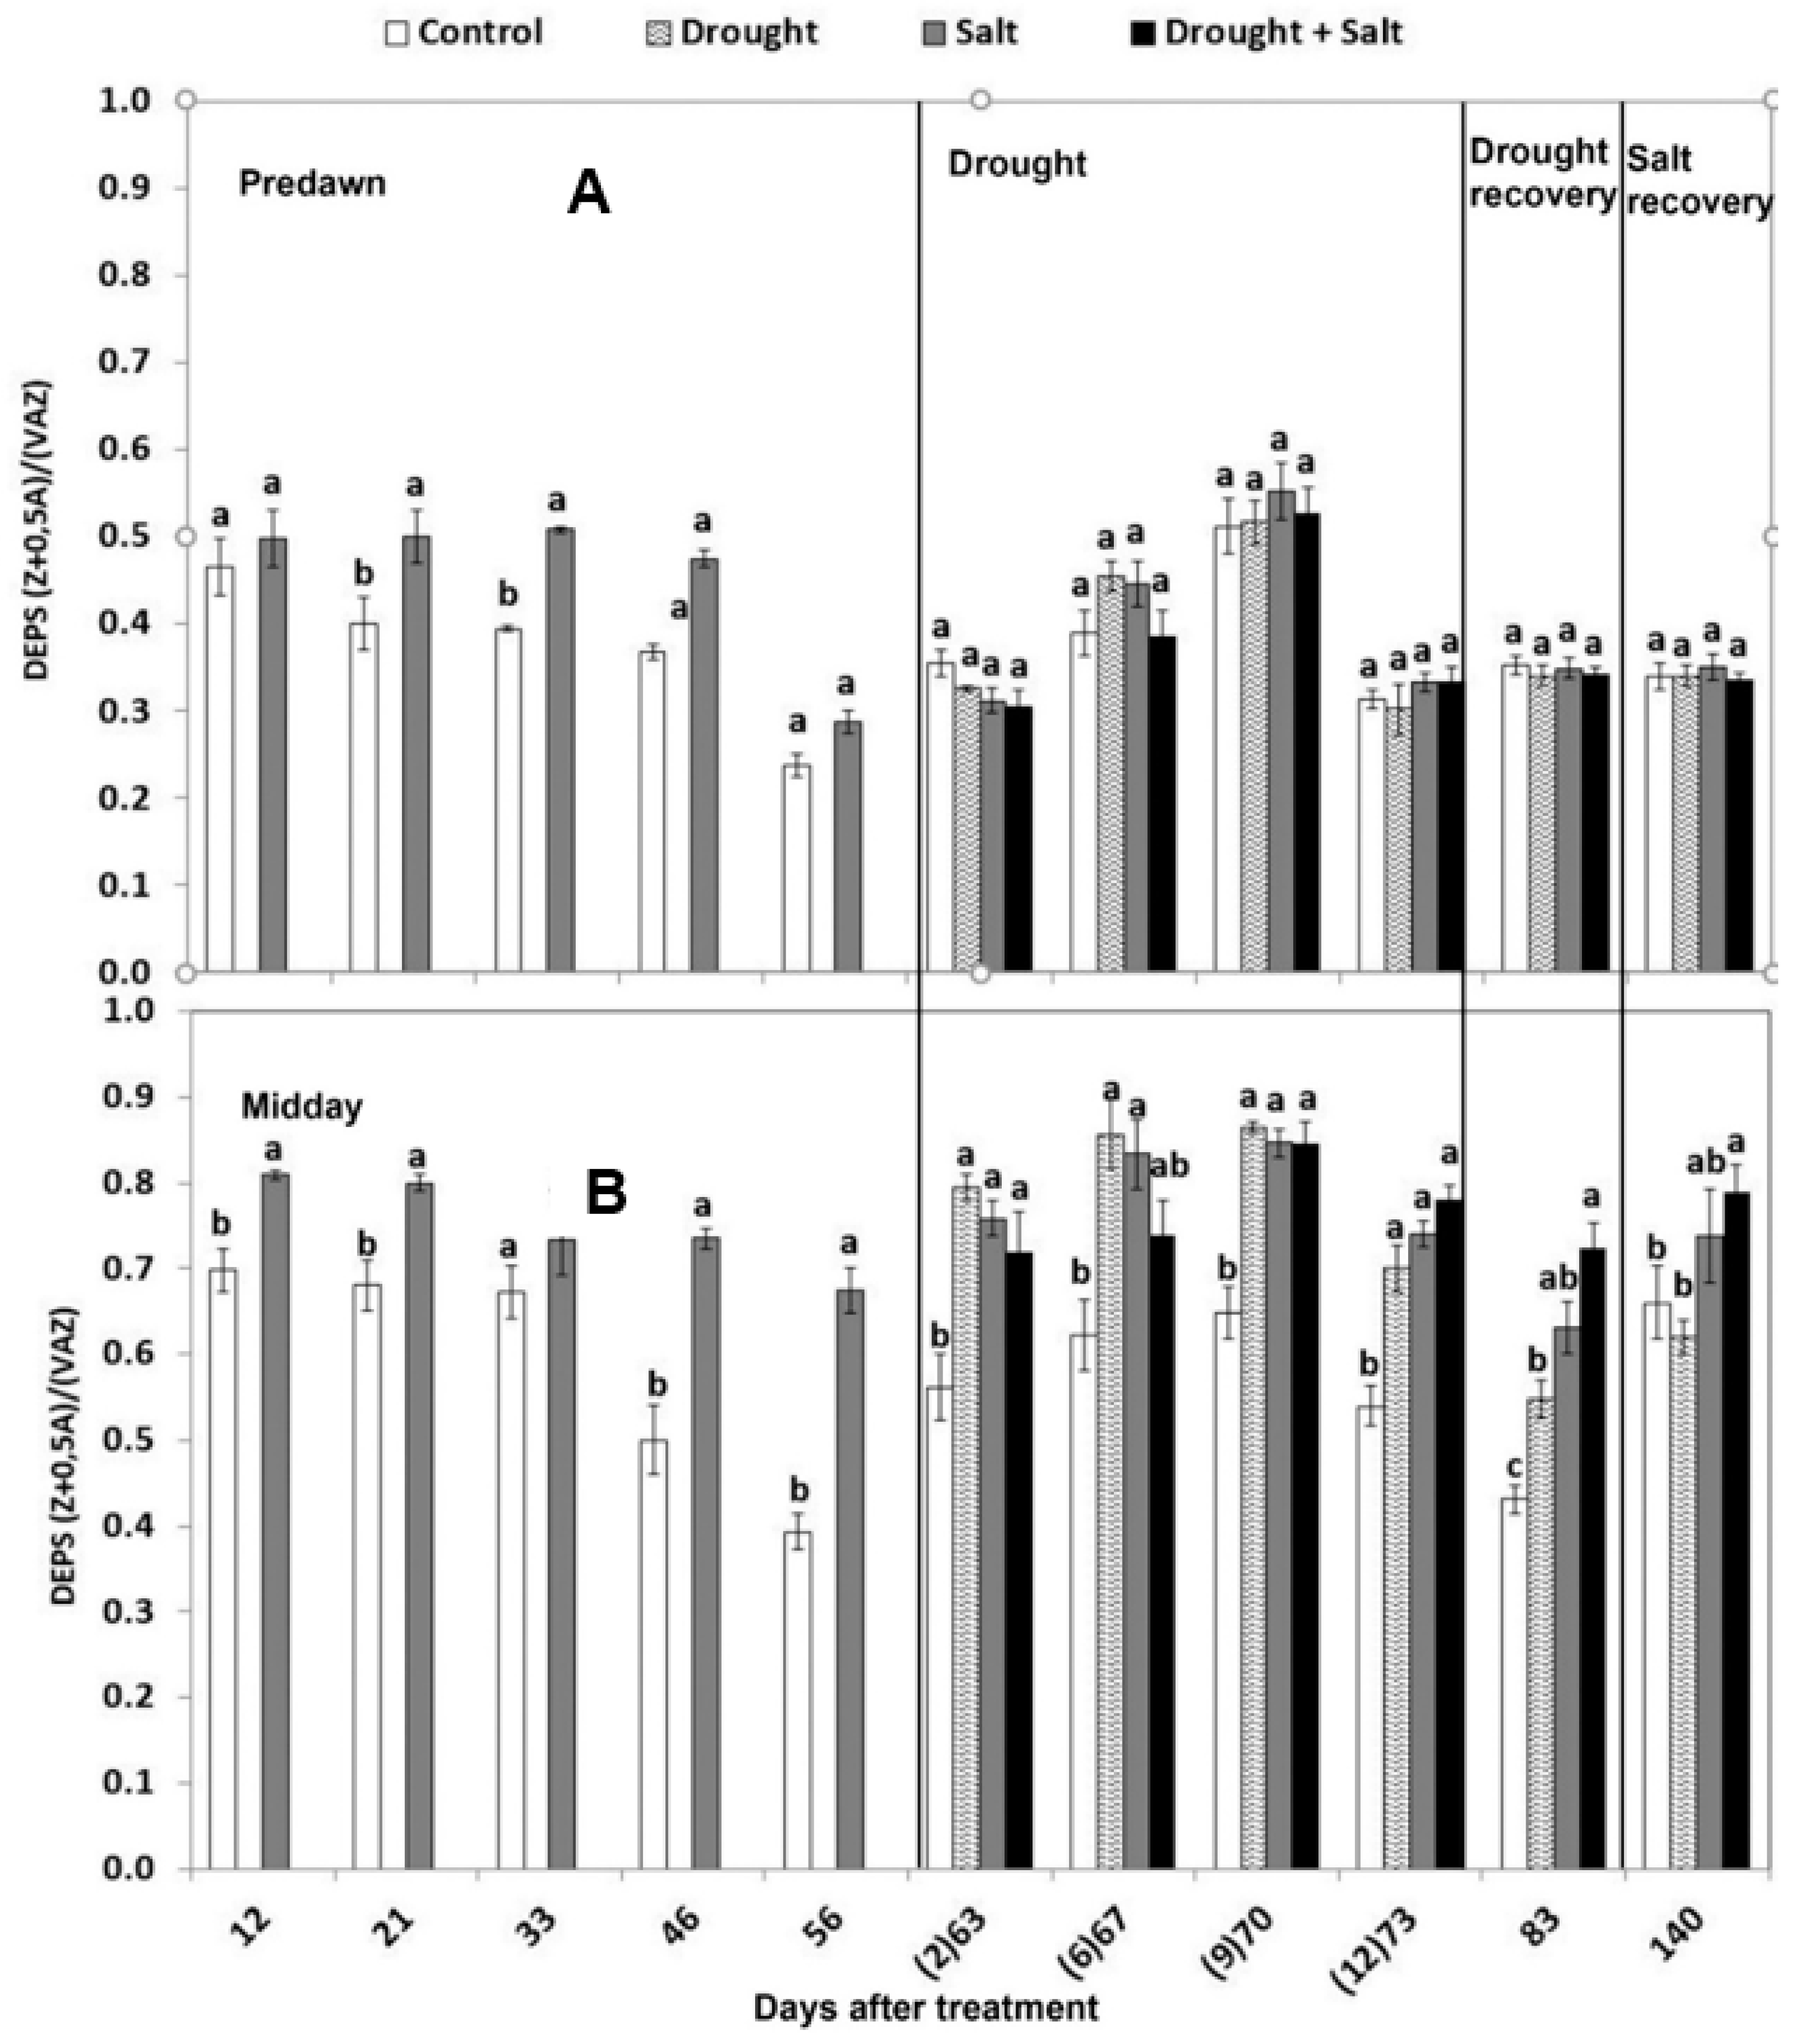
3.2.3. Xanthophyll Cycle

The de-epoxidation state of xanthophyll cycle pigments (DEPS) was generally higher at midday in stressed leaves compared to the control (Figure 4B). The maximum levels of 0.84–0.86 were reached during the water stress period in salt and drought-stressed leaves, as a result of the almost complete de-epoxidation of violaxanthin into zeaxanthin. At predawn, lower levels were recorded, with an average of 0.5, indicating a partial conversion of zeaxanthin to violaxanthin overnight (Figure 4A). Xanthophyll DEPS at predawn and at midday correlated well with photosynthetic efficiency in the dark (Fv/Fm) and in the light (F’v/F’m): the PSII efficiency decreased as DEPS increased (Figure 5). This was more evident in plants stressed with water withholding alone or in combination with salt (r2 = 0.80 and r2 = 0.94, respectively) than in control or salt-stressed plants (r2 = 0.64 and r2 = 0.80, respectively).

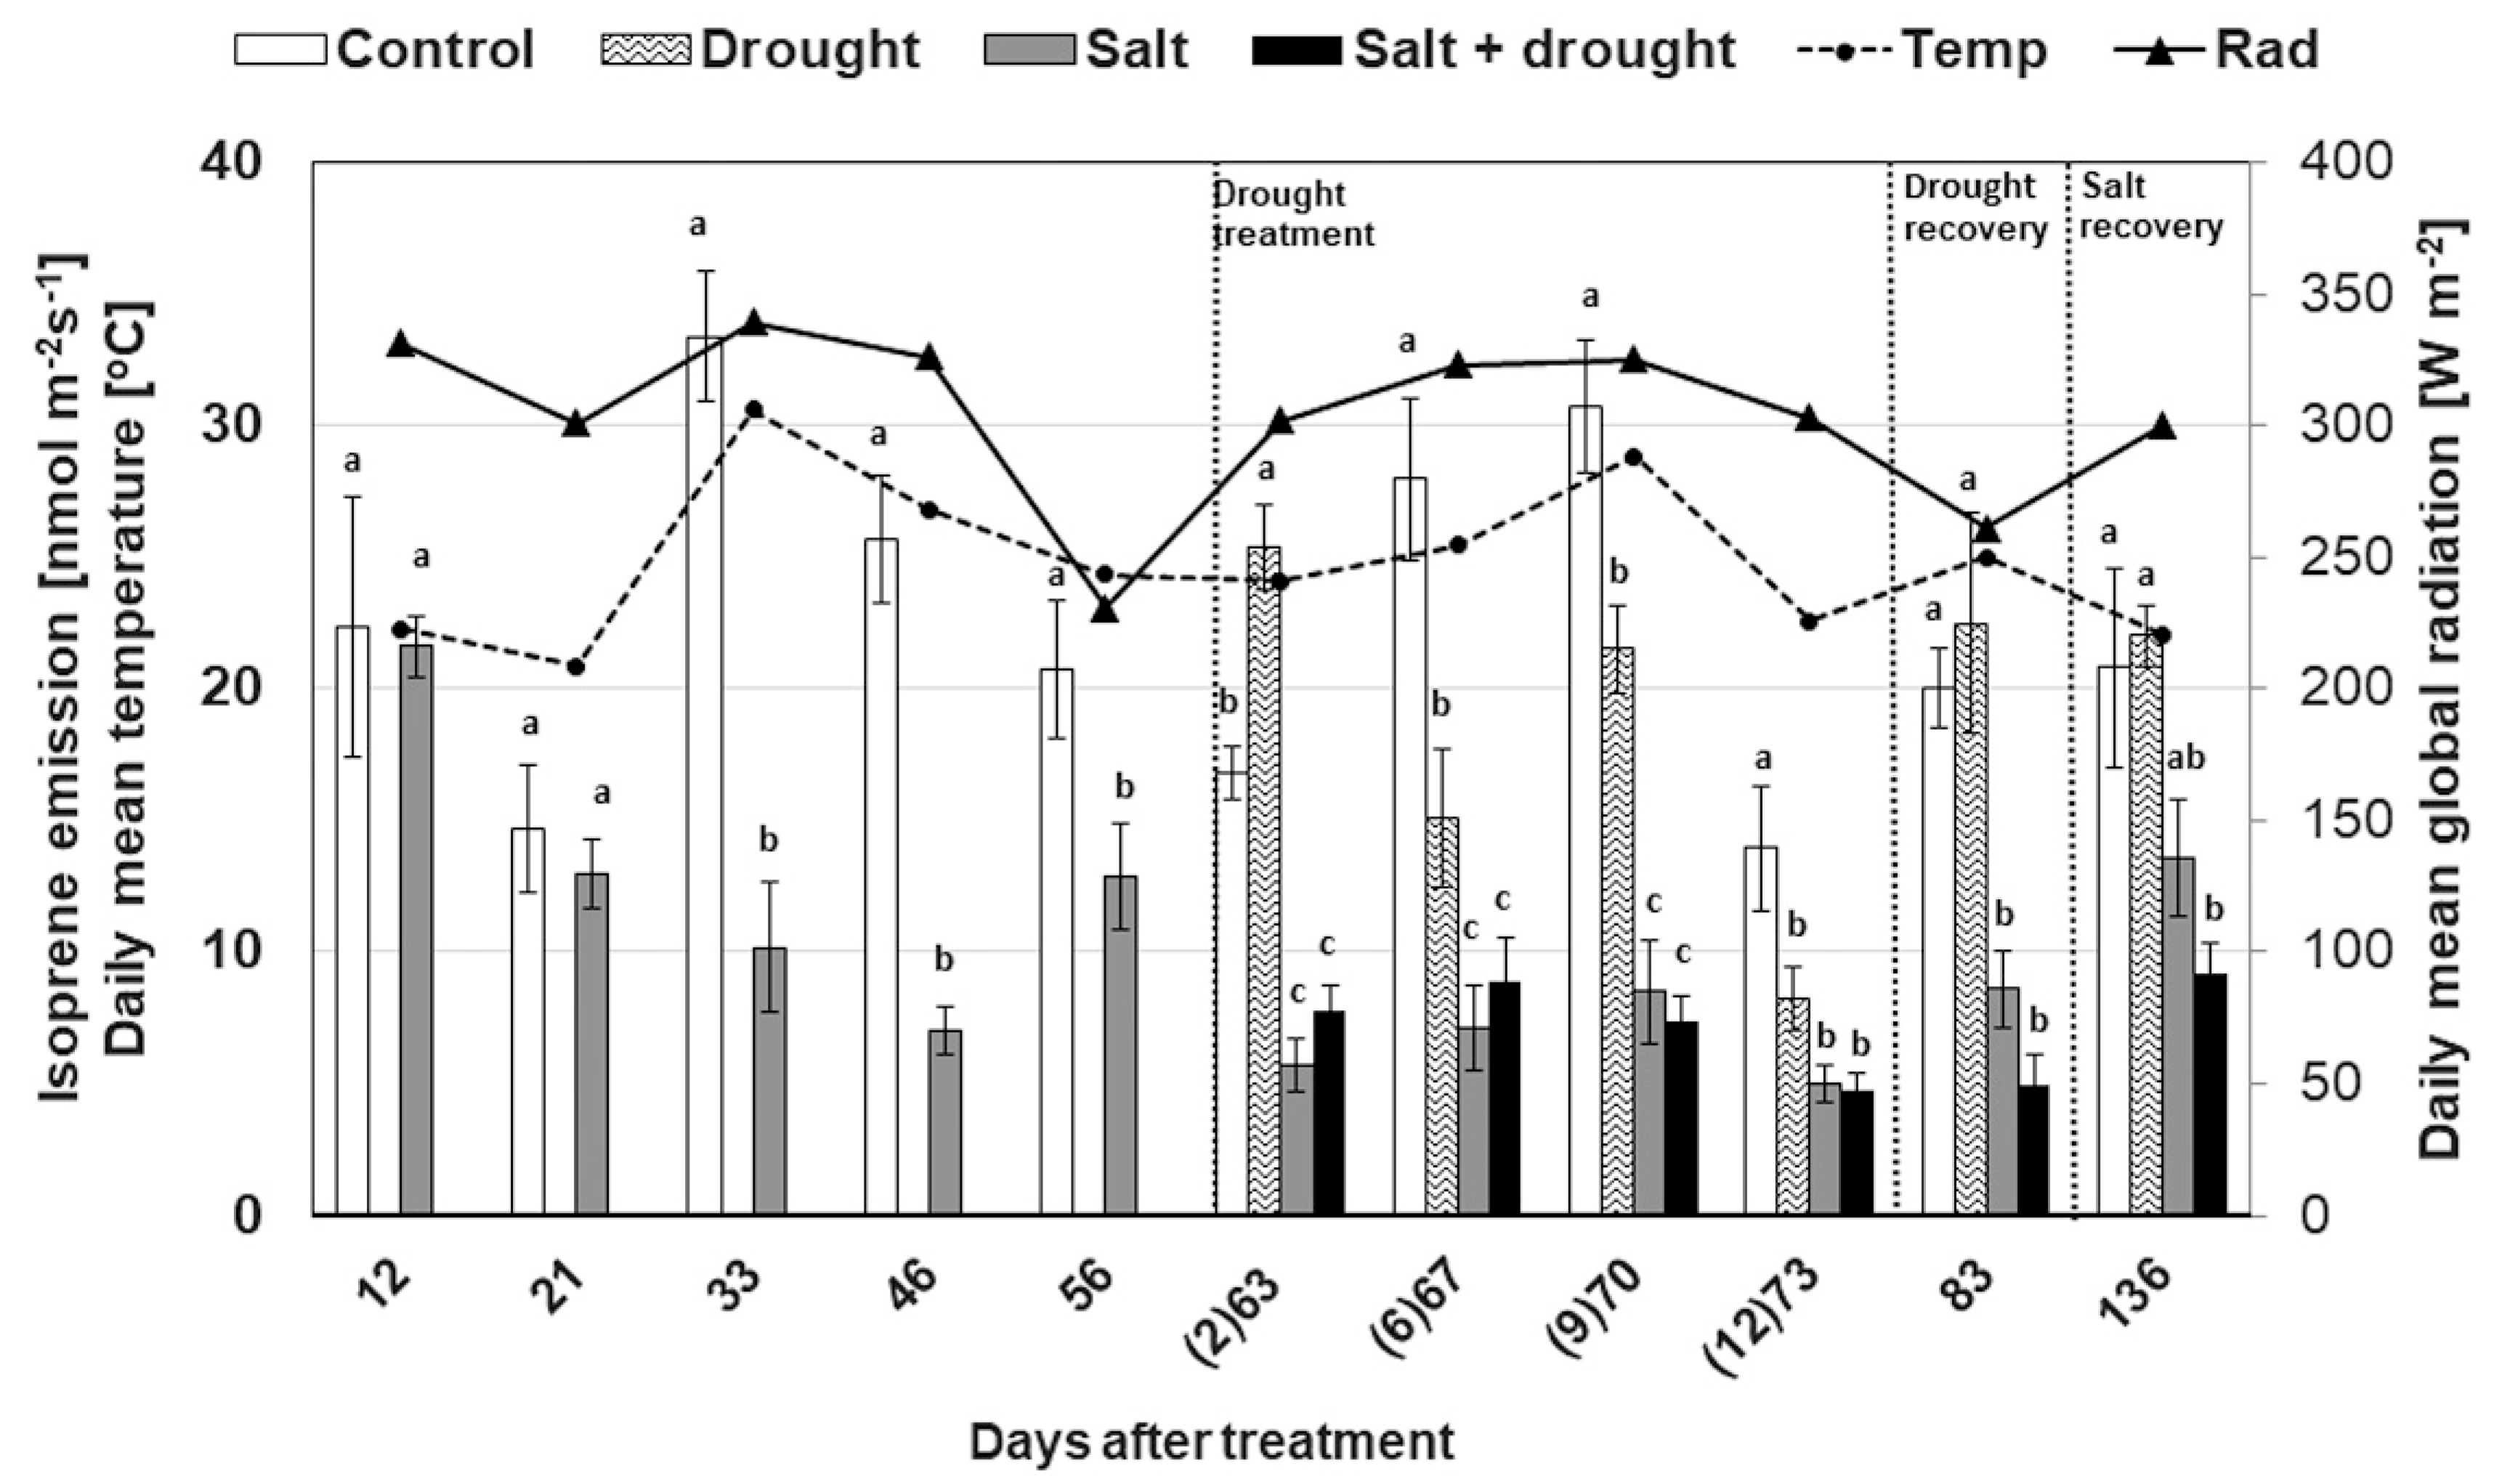
3.2.4. Isoprene Emission

The rate of isoprene emission recorded in control plants during the experiment increased with the increasing temperature and solar radiation, up to 33.4 nmol m−2s−1 at 30.6 °C (day 33; Figure 6). At that time, isoprene emission of salt-stressed leaves significantly decreased to one third of the control and remained different during all the experimental period. A burst effect on isoprene emission induced by drought stress occurred at the beginning of water withholding (second day), when isoprene emission rate increased by almost 34% in plants grown in drought conditions compared to the control. A negative effect of drought on isoprene emission was then recorded six days after water withholding, when it decreased by approximately 46% relative to the control, and the effect lasted until the recovery period. The levels of isoprene emission were always similarly low in plants subjected to salt and the combination of both stressors, indicating that water had no significant effect on the emission of salt-stressed leaves. In fact, the maximum percentage of variation was recorded for salinity, ranging between 68.6% and 96.1% (Table 1). The portion of photosynthetic fixed carbon emitted as isoprene (carbon ratio), was about 1%–2%, but increased up to 6% when drought was applied in combination with salt stress. When plants were rehydrated (day 83), isoprene returned to the level of the relative control plants, while significant differences still occurred between salt-stressed and control plants. Finally, the recovery from salt stress did not occur in drought and salt-stressed plants (day 136) (Figure 6).

4. Discussion

Trees are subjected to multiple environmental constraints, especially in urban areas where the effects of climate changes are more pronounced and direct anthropogenic impacts more severe. In temperate climates, where deicing salt is often used and drought periods are frequent, plants face both water and salt stresses. As previously reported [49,50], changes in photosynthetic activity are an early response of plants to abiotic stresses. We demonstrated that both salinity and drought stress reduced vitality in L. styraciflua, although with different responses. In fact, soil water shortage and salinity caused significant reductions in predawn leaf water potential, concomitant to the reduction of transpiration and stomatal conductance; those are typical physiological mechanisms that prevent water loss by the plants and irreversible cell dehydration during the drought persistence [44,51]. As a consequence, the decline of stomatal conductance negatively affected the efficiency of the photosynthetic system of sweetgum, confirming its sensitivity to changes in gs related to ψ [44]. Indeed, the suppression of photosynthesis was accompanied by changes in several chlorophyll a fluorescence parameters, such as the maximum efficiency of PSII (Fv/Fm), the photochemical efficiency of PSII (ΦPSII), and the nonphotochemical quenching (NPQ), confirming previous findings [52,53]. Chlorophyll fluorescence analysis revealed that Fv/Fm, an indicator of photoinhibition [54] indicating both photoprotective and PSII damaging processes, was unaffected by water shortage alone, but significantly reduced by salt stress. This photoinhibition was not attributed to photodamage, but to an enhancement in the rate of thermal energy dissipation mediated by zeaxanthin [25]. In fact, under environmental stresses, NPQ of chlorophyll a fluorescence was associated with the downregulation of Fv/Fm, as occurred in other species [52]. NPQ steadily increased in salt-treated plants up to rehydration, and it was most probably involved in mitigating damages caused by salt stress and early stages of drought on the photosynthetic apparatus. Enhanced de-epoxidation of the xanthophyll cycle has been associated with increased drought resistance in several Mediterranean species (reviewed by [55]). Similarly, in L. styraciflua, the de-epoxidation of the xanthophyll cycle (DEPS) increased (on average 35%) with drought and salt stress in the light, indicating a decrease in photosynthetic efficiency in favor of an increase in xanthophyll conversion for absorbing and dissipating heat during the night. In our experimental conditions, the strong negative correlation between the photosynthetic efficiency in the dark (Fv/Fm) and in the light (F’v/F’m), and the correspondent xanthophyll cycle, was indicative of a nocturnal retention of Z + A in a state primed for energy dissipation, as suggested by other authors [25,56]. Liquidambar styraciflua is considered a high isoprene emitter [57], with daily emissions ranging up to 60 nmol m−2 s−1 [58], but highly variable between sun and shade leaves [59] and depending on experimental conditions. In our study isoprene emissions, comparable to the emissions recorded in other studies [60], depended on light and temperature under natural environmental condition as expected, while this dependency was lost or largely attenuated in the presence of environmental stresses [61,62]. At the beginning of water withholding, we observed an isoprene burst in drought-stressed leaves that might have been due to the activation of resistance mechanisms when the stress was mild, sustained by the still unaffected photosynthesis and stomatal closure [30,32,33]. Afterward, when the water stress applied to both control and salt-stressed plants became severe and almost completely inhibited photosynthesis, isoprene emission was significantly reduced (46%–76%), although to a lesser extent than photosynthesis (85–95%). It is known that drought can decrease isoprenoid emissions when severe, while the emissions can increase under mild or short drought stress [30,63]. Isoprene formation is photosynthesis-dependent, as photosynthesis is the main source of C for isoprene synthesis [30,64]. However, the processes regulating photosynthesis and isoprene metabolisms are affected by stress in different ways [35,62]. Indeed, it has been shown that while stomatal limitations dominated the photosynthetic response of L. styraciflua to drought, isoprene emission was independent of stomatal dynamics [65]. This indicates a process leading to isoprene emissions that are more resistant than photosynthesis, and a possible presence of alternative C sources used for isoprene synthesis, such as cytosolic and extra-chloroplastic C pools [35,66], respiration [67], sugar, and starch [64]. The lower water and salt stress sensitivity of isoprene emissions compared to photosynthesis resulted in a relatively higher percentage of fixed carbon lost as isoprene (2%–6%), although lower than those observed in other species under different conditions (up to 50%) [30,66,68,69]. The fact that isoprene biosynthesis was still active during stress conditions suggests that isoprene has a role in stress mitigation [30,70,71,72], acting as an additional protection mechanism to prevent oxidative damage to the cell’s photosynthetic structures [69]. As for photosynthesis, full recovery of isoprene emissions from drought was found only when plants were rewatered, as also reported for other species [35,73]. However, a complete recovery of the isoprene functions was not observed when drought was combined with salinity, similarly to the study of Behnke et al. [74], indicating a possible slower resumption of isoprene emissions compared to photosynthesis [61]. Although a fast adverse effect was observed for drought stress, the impact of salinity on the considered physiological parameters was more lasting, as also demonstrated by the high proportion of variance of the salt factor expressed as a percentage of the total sum of the squares. This could be explained by the fact that salt-treated plants, in addition to an isohydric response to water deficit, experienced ion toxicity as well as hyperionic and hyperosmotic stresses [12,14]. Furthermore, the combination of both stresses was usually more severe than the single treatments, but not always significantly.

5. Conclusions

Overall, this study highlights the importance of the physiological responses of L. styraciflua to cope with water deficit and salt stress occurring in cities at different intensities throughout the growing season. Under transient drought and salt stress, photosynthesis of sweetgum plants greatly decreased, probably resulting from a reduction of carbon availability due to stress-induced stomatal closure and to nonstomatal limitations related to the downregulation of PSII photochemical activity. With a greater decrease in photosynthetic efficiency, there was an increase in xanthophyll conversion for absorbing and dissipating heat, protecting the photosynthetic apparatus from permanent damage. The absence of permanent damage to the photosynthetic apparatus was confirmed by the recovery of photosynthetic functionality and photochemical activity after stress relief. Recovery periods are pivotal, as plants make up for the losses suffered during stress periods. Our results indicate that processes leading to isoprene emission are far more resistant than photosynthesis to drought and salt stresses, alone or in combination, and suggest a secondary source of isoprene precursors, likely to be independent from photosynthesis, and stimulated by these environmental constraints. Dissipation of excess excitation energy, mediated by photoprotective isoprene, may have an important role as an additional defense mechanism against drought and salt stress when photosynthesis is hampered [75].
In conclusion, this study improves our understanding on how limited water availability and salinity affect photosynthesis and isoprene emission, vital for predicting the interaction between biosphere and atmosphere in heavily populated urban areas. Liquidambar styraciflua is capable of withstanding and surviving drought and salt events by activating defense mechanisms that allow maintenance of plant performances under stressful conditions, and recovery after seasonal drought events and increased soil salinity, without increasing the emission in the atmosphere of the highly reactive isoprene.

Author Contributions

Conceptualization, R.B. and A.P.; methodology, R.B., O.F., and A.P.; validation, R.B. and O.F.; formal analysis, O.F.; investigation, R.B., O.F., L.P., and G.B.; resources, R.B.; data curation, O.F., L.P., A.P., and G.C.; writing—original draft preparation, R.B., A.P., and G.C.; writing—review and editing, L.N., R.B., and A.P.; visualization, R.B., O.F., and L.N., and G.C.; supervision, R.B.; project administration, R.B.; funding acquisition, R.B. and A.P.

Funding

This work was supported by the EXPEER (Distributed Infrastructure for Experimentation in Ecosystem Research) project of the FP7-INFRASTRUCTURES-2010-1.

Acknowledgments

The authors thank Matteo Mari and Mafalda Govoni for their excellent technical supports, and Massimiliano Magli for statistical analysis.

Conflicts of Interest

The authors declare no conflict of interest. The founding sponsors had no role in the design of the study; in the collection, analyses, or interpretation of data; in the writing of the manuscript, and in the decision to publish the results.

References

  1. Nowak, D.J.; Crane, D.E. Carbon storage and sequestration by urban trees in the USA. Environ. Pollut. 2002, 116, 381–389. [Google Scholar] [CrossRef]
  2. Gómez-Baggethun, E.; Barton, D.N. Classifying and valuing ecosystem services for urban planning. Ecol. Econ. 2013, 86, 235–245. [Google Scholar] [CrossRef]
  3. Nowak, D.J.; Greenfield, E.J.; Hoehn, R.; Lapoint, E. Carbon storage and sequestration by trees in urban and community areas of the United States. Environ. Pollut. 2013, 178, 229–236. [Google Scholar] [CrossRef] [PubMed]
  4. Bussotti, F.; Ferrini, F.; Pollastrini, M.; Fini, A. The challenge of Mediterranean schlerophyllous vegetation under climate change: From acclimation to adaptation. Environ. Exp. Bot. 2014, 103, 80–98. [Google Scholar] [CrossRef]
  5. Bartels, D.; Sunkar, R. Drought and salt tolerance in plants. Crit. Rev. Plant Sci. 2005, 24, 23–58. [Google Scholar] [CrossRef]
  6. Equiza, M.A.; Calvo-Polanco, M.; Cirelli, D.; Señorans, J.; Wartenbe, M.; Saunders, C.; Zwiazek, J.J. Long-term impact of road salt (NaCl) on soil and urban trees in Edmont, Canada. Urban For. Urban Green. 2017, 21, 16–28. [Google Scholar] [CrossRef]
  7. Adams, H.D.; Guardiola-Claramonte, M.; Barron-Gafford, G.A.; Villegas, J.C.; Breshears, D.D.; Zou, C.B.; Troch, P.A.; Huxman, T.E. Temperature sensitivity of drought-induced tree mortality portends increased regional die-off under global-change-type drought. Proc. Natl. Acad. Sci. USA 2009, 106, 7063–7066. [Google Scholar] [CrossRef]
  8. Kalaji, H.M.; Račková, L.; Paganova, V.; Swoczyna, T.; Rusinowski, S.; Sitko, K. Can chlorophyll-a fluorescence parameters be used as bio-indicators to distinguish drought and salinity stress in Tilia cordata Mill? Environ. Exp. Bot. 2018, 152, 149–157. [Google Scholar] [CrossRef]
  9. Čekstere, G.; Osvalde, A. A study of chemical characteristics of soil in relation to street trees status in Riga (Latvia). Urban For. Urban Green. 2013, 12, 69–78. [Google Scholar] [CrossRef]
  10. Godwin, K.S.; Hafner, S.D.; Buff, M.F. Long-trend trends in sodium and chloride in the Mohawk River. New York: The effect of fifty years of road-salt application. Environ. Pollut. 2003, 124, 273–281. [Google Scholar] [CrossRef]
  11. Ramakrishna, D.M.; Viraraghavan, T. Environmental impact of chemical deicers—A review. Water Air Soil Pollut. 2005, 166, 49–63. [Google Scholar] [CrossRef]
  12. Deinlein, U.; Stephan, A.B.; Horie, T.; Luo, W.; Xu, G.; Schroeder, J.I. Plant salt-tolerance mechanisms. Trends Plant Sci. 2014, 19, 371–379. [Google Scholar] [CrossRef] [PubMed]
  13. Chen, L.; Zhang, S.; Zhao, H.; Korpelainen, H.; Li, C. Sex-related adaptive responses to interaction of drought and salinity in Populus yunnanensis. Plant Cell Environ. 2010, 33, 1767–1778. [Google Scholar] [CrossRef] [PubMed]
  14. Chaves, M.M.; Flexas, J.; Pinheiro, C. Photosynthesis under drought and salt stress: Regulation mechanisms from whole plant to cell. Ann. Bot. 2009, 103, 551–560. [Google Scholar] [CrossRef]
  15. Lipiec, J.; Doussan, C.; Nosalewicz, A.; Kondracka, K. Effect of drought and heat stress on plant growth and yield: A review. Int. Agrophys. 2013, 27, 463–477. [Google Scholar] [CrossRef]
  16. Lui, J.; Shi, D.C. Photosynthesis, chlorophyll fluorescence, inorganic ion and organic acid accumulations of sunflower in responses to salt and salt-alkaline mixed stress. Photosynthetica 2010, 48, 127–134. [Google Scholar]
  17. Mehta, P.; Allakhverdiev, S.I.; Jajoo, A. Characterization of photosystem II heterogeneity in response to high salt stress in wheat leaves (Triticum aestivum). Photosynth. Res. 2010, 105, 249–255. [Google Scholar] [CrossRef]
  18. Tsonev, T.; Wahbi, S.; Sun, P.; Sorreutiuo, G.; Centritto, M. Gas exchange, water relations photochemical reflectance index in stress and recovery and their relationships with Quercus ilex plants during water stress and recovery. Int. J. Agric. Biol. 2014, 16, 335–341. [Google Scholar]
  19. Szabo, I.; Bergantino, E.; Giacometti, G.M. Light and oxygenic photosynthesis: Energy dissipation as a protection mechanism against photo-oxidation. EMBO Rep. 2005, 6, 629–634. [Google Scholar] [CrossRef]
  20. Reddy, A.R.; Chaitanya, K.V.; Vivekanandan, M. Drought-induced responses of photosynthesis and antioxidant metabolism in higher plants. J. Plant Physiol. 2004, 161, 1189–1202. [Google Scholar] [CrossRef]
  21. Björkman, O.; Demmig-Adams, B. Regulation of photosynthetic light energy capture, conversion, and dissipation in leaves of higher plants. In Ecophysiology of Photosynthesis; Springer: Berlin/Heidelberg, Germany, 1995; pp. 17–47. [Google Scholar]
  22. Müller, P.; Li, X.; Niyogi, K.K. Non-photochemical quenching. A response to excess light energy. Plant Physiol. 2001, 125, 1558–1566. [Google Scholar] [CrossRef] [PubMed]
  23. Jahns, P.; Holzwarth, A.R. The role of xanthophyll cycle and of lutein in photoprotection of photosystem II. Biochim. Biophys. Acta Bioenerg. 2012, 1817, 182–193. [Google Scholar] [CrossRef] [PubMed]
  24. Munnè-Bosch, S.; Alegre, L. The xanthophyll cycle is induced by light irrespective of water status in field-grown lavender (Lavandula stoechas) plants. Physiol. Plant 2000, 108, 147–151. [Google Scholar] [CrossRef]
  25. Baraldi, R.; Canaccini, F.; Cortes, S.; Magnani, F.; Rapparini, F.; Zamboni, A.; Raddi, S. Role of xanthophyll cycle-mediated photoprotection in Arbutus unedo plants exposed to water stress during the Mediterranean summer. Photosynthetica 2008, 46, 378–386. [Google Scholar] [CrossRef]
  26. Latowski, D.; Kuczynska, P.; Strzalka, K. Xanthophyll cycle—A mechanism protecting plants against oxidative stress. Redox Rep. 2011, 16, 78–90. [Google Scholar] [CrossRef] [PubMed]
  27. Munnè-Bosch, S.; Peñuelas, J. Photo-and antioxidative protection, and a role for salicylic acid during drought and recovery in field-grown Phillyrea angustifolia plants. Planta 2013, 217, 758–766. [Google Scholar] [CrossRef]
  28. Rapparini, F.; Neri, L.; Mihailova, G.; Petkova, S.; Georgieva, K. Growth irradiance affects the photoprotective mechanisms of the resurrection angiosperm Haberlea rhodopensis Friv. in response to desiccation and rehydration at morphological, physiological and biochemical levels. Environ. Exp. Bot. 2015, 113, 67–79. [Google Scholar] [CrossRef]
  29. Velikova, V.; Loreto, F. On the relationship between isoprene emission and thermotolerance in Phragmites australis leaves exposed to high temperatures and during the recovery from a heat stress. Plant Cell Environ. 2005, 28, 318–327. [Google Scholar] [CrossRef]
  30. Loreto, F.; Schnitzler, J.P. Abiotic stresses and induced BVOCs. Trends Plant Sci. 2010, 15, 154–166. [Google Scholar] [CrossRef]
  31. Lahr, E.C.; Schade, G.W.; Crossett, C.C.; Watson, M.R. Photosynthesis and isoprene emission from trees along an urban-rural gradient in Texas. Glob. Chang. Biol 2015, 21, 4221–4236. [Google Scholar] [CrossRef]
  32. Niinemets, Ü.; Sun, Z. How light, temperature, and measurement and growth [CO2] interactively control isoprene emission in hybrid aspen. J. Exp. Bot. 2014, 66, 841–851. [Google Scholar] [CrossRef] [PubMed]
  33. Loreto, F.; Fineschi, S. Reconciling functions and evolution of isoprene emission in higher plants. New Phytol. 2015, 206, 578–582. [Google Scholar] [CrossRef] [PubMed]
  34. Niinemets, Ü.; Arneth, A.; Kuhn, U.; Monson, R.K.; Peñuelas, J.; Staudt, M. The emission factor of volatile isoprenoids: Stress, acclimation, and developmental responses. Biogeosciences 2010, 7, 2203–2223. [Google Scholar] [CrossRef] [Green Version]
  35. Funk, J.L.; Jones, C.G.; Gray, D.W.; Throop, H.L.; Hyatt, L.A.; Lerdau, M.T. Variation in isoprene emission from Quercus rubra: Sources, causes, and consequences for estimating fluxes. J. Geophys. Res. 2005, 110, D04301. [Google Scholar] [CrossRef] [Green Version]
  36. Brilli, F.; Barta, C.; Fortunati, A.; Lerdau, M.; Loreto, F.; Centritto, M. Response of isoprene and carbon metabolism to drought in white poplar (Populus alba) saplings. New Phytol. 2007, 175, 244–254. [Google Scholar] [CrossRef]
  37. Jenkin, M.E.; Clemitshaw, K.C. Ozone and other secondary photochemical pollutants: Chemical processes governing their formation in the planetary boundary layer. Atmos. Environ. 2000, 34, 2499–2527. [Google Scholar] [CrossRef]
  38. Tsui, J.K.; Guenther, A.; Yip, W.K.; Chen, F. A biogenic volatile organic compound emission inventory for Hong Kong. Atmos. Environ. 2009, 43, 6442–6448. [Google Scholar] [CrossRef] [Green Version]
  39. Slama, I.; Ghnaya, T.; Savouré, A.; Abdelly, C. Combined effects of long-term salinity and soil drying on growth, water relations, nutrient status and proline accumulation of Sesuvium portulacastrum. C. R. Biol. 2008, 331, 442–451. [Google Scholar] [CrossRef]
  40. Suzuki, N.; Rivero, R.M.; Shulaev, V.; Blumwald, E.; Mittler, R. Abiotic and biotic stress combination. New Phytol. 2014, 203, 32–43. [Google Scholar] [CrossRef]
  41. Brown, C.E.; Pezeshki, S.R.; DeLaune, R.D. The effects of salinity and soil drying on nutrient uptake and growth of Spartina alterniflora in a simulated tidal system. Environ. Exp. Bot. 2006, 58, 140–148. [Google Scholar] [CrossRef]
  42. Mittler, R. Abiotic stress, the field environment and stress combination. Trends Plant Sci. 2006, 11, 15–19. [Google Scholar] [CrossRef] [PubMed]
  43. Wu, L.; Guo, X.; Harivandi, A. Salt tolerance and salt accumulation of landscape plants irrigated by sprinkler and drip irrigation systems. J. Plant Nutr. 2001, 24, 1473–1490. [Google Scholar] [CrossRef]
  44. Esperón-Rodríguez, M.; Barradas, V.L. Ecophysiological vulnerability to climate change: Water stress responses in four tree species from the central mountain region of Veracruz, Mexico. Reg. Environ. Chang. 2015, 15, 93–108. [Google Scholar] [CrossRef]
  45. Guenther, A.P.; Zimmerman, P.; Harley, R.; Monson, R.K.; Fall, R. Isoprene and monoterpene emission rate variability: Model evaluation and sensitivity analysis. J. Geophys. Res. 1993, 98, 12609–12617. [Google Scholar] [CrossRef] [Green Version]
  46. Ripullone, F.; Rivelli, A.R.; Baraldi, R.; Guarini, R.; Guerrieri, R.; Magnani, F.; Peñuelas, J.; Raddi, S.; Borghetti, M. Effectiveness of the photochemical reflectance index to track photosynthetic activity over a range of forest tree species and plant water statuses. Funct. Plant Biol. 2011, 38, 177–186. [Google Scholar] [CrossRef] [Green Version]
  47. Müller, M.; Hernandez, I.; Alegre, L.; Munnè-Bosch, S. Enhanced α-tocopherol quinone levels and xanthophyll cycle de-epoxidation in rosemary plants exposed to water deficit during a Mediterranean winter. J. Plant Physiol. 2006, 163, 601–606. [Google Scholar] [CrossRef]
  48. Baraldi, R.; Neri, L.; Costa, F.; Facini, O.; Rapparini, F.; Carriero, G. Ecophysiological and micromorphological characterization of green roof vegetation for urban mitigation. Urban For. Urban Green. 2019, 37, 24–32. [Google Scholar] [CrossRef]
  49. Čekstere, G.; Nikodemus, O.; Osvalde, A. Toxic impact of the de-icing material to street greenery in Riga, Latvia. Urban For. Urban Green. 2008, 7, 207–217. [Google Scholar] [CrossRef]
  50. Savi, T.; Bertuzzi, S.; Branca, S.; Tretiach, M.; Nardini, A. Drought-induced xylem cavitation and hydraulic deterioration: Risk factors for urban trees under climate change? New Phytol. 2015, 205, 1106–1116. [Google Scholar] [CrossRef] [Green Version]
  51. Leibar, U.; Aizpurua, A.; Unamunzaga, O.; Pascual, I.; Morales, F. How will climate change influence grapevine cv. Tempranillo photosynthesis under different soil textures? Photosynth. Res. 2015, 124, 199–215. [Google Scholar] [CrossRef]
  52. Zhang, C.; Preece, C.; Filella, I.; Farrè-Armengol, G.; Peñuelas, J. Assessment of the response of photosynthetic activity of Mediterranean evergreen oaks to enhanced drought stress and recovery by using PRI and R690/R630. Forests 2017, 8, 386. [Google Scholar] [CrossRef] [Green Version]
  53. Yan, W.; Zheng, S.; Zhong, Y.; Shangguan, Z. Contrasting dynamics of leaf potential and gas exchange during progressive drought cycles and recovery in Amorpha fruticosa and Robinia pseudoacacia. Sci. Rep. 2017, 7, 4470. [Google Scholar] [CrossRef] [Green Version]
  54. Maxwell, K.; Johnson, G.N. Chlorophyll fluorescence—A practical guide. J. Exp. Bot. 2000, 51, 659–668. [Google Scholar] [CrossRef]
  55. Chaves, M.M.; Pereira, J.S.; Maroco, J.; Rodrigues, M.L.; Ricardo, C.P.P.; Osório, M.L.; Carvalho, I.; Faria, T.; Pinheiro, C. How plants cope with water stress in the field? Photosynthesis and growth. Ann. Bot. 2002, 89, 907–916. [Google Scholar] [CrossRef] [Green Version]
  56. Levizou, E.; Petropoulou, E.; Manetas, Y. Carotenoid composition of peridermal twigs does not fully conform to a shade acclimation hypotesis. Photosynthetica 2004, 42, 591–596. [Google Scholar] [CrossRef]
  57. Benjamin, M.T.; Winer, A.M. Estimating the ozone-forming potential of urban trees and shrubs. Atmos. Environ. 1998, 32, 53–68. [Google Scholar] [CrossRef]
  58. Fang, C.; Monson, R.K.; Cowling, E.B. Isoprene emission, photosynthesis, and growth in sweetgum (Liquidambar styraciflua) seedlings exposed to short-and long-term drying cycles. Tree Physiol. 1996, 16, 441–446. [Google Scholar] [CrossRef]
  59. Harley, P.; Guenther, A.; Zimmerman, P. Effects of light, temperature and canopy position on net photosynthesis and isoprene emission from sweetgum (Liquidambar styraciflua) leaves. Tree Physiol. 1996, 16, 25–32. [Google Scholar] [CrossRef] [Green Version]
  60. Niinemets, Ü.; Tenhunen, J.D.; Harley, P.C.; Steinbrecher, R. A model of isoprene emission based on energetic requirements for isoprene synthesis and leaf photosynthetic properties for Liquidambar and Quercus. Plant Cell Environ. 1999, 22, 1319–1335. [Google Scholar] [CrossRef]
  61. Fortunati, A.; Barta, C.; Brilli, F.; Centritto, M.; Zimmer, I.; Schnitzler, J.P.; Loreto, F. Isoprene emission is not temperature dependent during and after severe drought stress: A physiological and biochemical analysis. Plant J. 2008, 55, 687–697. [Google Scholar] [CrossRef]
  62. Centritto, M.; Brilli, F.; Fodale, R.; Loreto, F. Different sensitivity of isoprene emission, respiration and photosynthesis to high growth temperature coupled with drought stress in black poplar (Populus nigra) saplings. Tree Physiol. 2011, 31, 275–286. [Google Scholar] [CrossRef] [Green Version]
  63. Lavoir, A.V.; Staudt, M.; Schnitzler, J.P.; Landais, D.; Massol, F.; Rocheteau, A.; Rodriguez, R.; Zimmer, I.; Rambal, S. Drought reduced monoterpene emissions from the evergreen Mediterranean oaks Quercus ilex: Results from a throughfall displacement experiment. Biogeoscienses 2009, 6, 1167–1180. [Google Scholar] [CrossRef] [Green Version]
  64. Ghirardo, A.; Gutknecht, J.; Zimmer, I.; Brüggemann, N.; Schnitzler, J.P. Biogenic volatile organic compound and respiratory CO2 emission after 13C-labelling: Online tracing of C translocation dynamics in poplar plants. PLoS ONE 2011, 6, e17393. [Google Scholar] [CrossRef] [Green Version]
  65. Fall, R.; Monson, R.K. Isoprene emission rate and intercellular isoprene concentration as influenced by stomatal distribution. Plant Physiol. 1992, 100, 987–992. [Google Scholar] [CrossRef] [Green Version]
  66. Morfopoulos, C.; Sperlich, D.; Peñuelas, J.; Filella, I.; Llusià, J.; Medlyn, B.E.; Niinemets, U.; Possell, M.; Sun, Z.; Prentice, I.C. A model of plant isoprene emission based on available reducing power captures responses to atmospheric CO2. New Phytol. 2014, 203, 125–139. [Google Scholar] [CrossRef]
  67. Loreto, F.; Pinelli, P.; Brancaleoni, E.; Ciccioli, P. 13C labeling reveals chloroplastic and extrachloroplastic pools of dimethylallyl pyrophosphate and their contribution to isoprene formation. Plant Physiol. 2004, 135, 1903–1907. [Google Scholar] [CrossRef] [Green Version]
  68. Beckett, M.; Loreto, F.; Velikova, V.; Brunetti, C.; di Ferdinando, M.; Tattini, M.; Calfapietra, C.; Farrant, J.M. Photosynthetic limitation and volatile and non-volatile isoprenoids in the poikilochlorophyllous resurrection plant Xerophyta humilis during dehydration and rehydration. Plant Cell Environ. 2012, 35, 2061–2074. [Google Scholar] [CrossRef]
  69. Tattini, M.; Velikova, V.; Vickers, C.; Brunetti, C.; di Ferdinando, M.; Trivellini, A.; Fineschi, S.; Agati, G.; Ferrini, F.; Loreto, F. Isoprene production in transgenic tobacco alters isoprenoid, non-structural carbohydrate and phenylpropanoid metabolism, and protects photosynthesis from drought stress. Plant Cell Environ. 2015, 37, 1950–1964. [Google Scholar] [CrossRef] [Green Version]
  70. Vickers, C.E.; Gershenzon, J.; Lerdau, M.T.; Loreto, F. A unified mechanism of action of volatile isoprenoids in plant abiotic stress. Nat. Chem. Biol. 2009, 5, 283–291. [Google Scholar] [CrossRef]
  71. Velikova, V.; Tsonev, T.; Loreto, F.; Centritto, M. Changes in photosynthesis, mesophyll conductance to CO2, and isoprenoid emissions in Populus nigra plants exposed to excess nickel. Environ. Pollut. 2011, 159, 1058–1066. [Google Scholar] [CrossRef]
  72. Loreto, F.; Dicke, M.; Schnitzler, J.P.; Turlings, T.C.J. Plant volatiles and the environment. Plant Cell Environ. 2014, 37, 1905–1908. [Google Scholar] [CrossRef]
  73. Pegoraro, E.; Rey, A.; Greenberg, J.; Harley, P.; Grace, J.; Malhi, Y.; Guenther, A. Effect of drought on isoprene emission rates from leaves of Quercus virginiana Mill. Atmos. Environ. 2004, 38, 6149–6156. [Google Scholar] [CrossRef] [Green Version]
  74. Behnke, K.; Ghirardo, A.; Janz, D.; Kanawati, B.; Esperschütz, J.; Zimmer, I.; Schmitt-Kopplin, P.; Niinemets, U.; Polle, A.; Schnitzler, J.P.; et al. Isoprene function in two contrasting poplars under salt and sunflecks. Tree Physiol. 2013, 33, 562–578. [Google Scholar] [CrossRef] [Green Version]
  75. Junker, L.V.; Kleiber, A.; Jansen, K.; Wildhagen, H.; Hess, M.; Kayler, Z.; Kammerer, B.; Schnitzler, J.P.; Kreuzwieser, J.; Gessler, A.; et al. Variation in short-term and long-term responses of photosynthesis and isoprenoid-mediated photoprotection to soil water availability in four Douglas-fir provenances. Sci. Rep. 2017, 7, 40145. [Google Scholar] [CrossRef] [Green Version]
Figure 1. Meteorological data recorded during the experimental period. Average daily temperature (continuous line) and radiation (dotted line) recorded during the days of measurements (vertical black line). The days after drought treatment are reported in brackets.
Forests 10 01032 g001
Figure 2. Effect of drought, salt, and the combination of both stresses, on (A) predawn water potential (ψpd) and (B) transpiration rate. The days after drought treatment are reported in brackets. Values per treatments are mean ± SE (n = 10). Data characterized by the same letter do not differ significantly (p < 0.05, Tukey’s HSD test).
Forests 10 01032 g002
Figure 3. Effect of drought, salt, and the combination of both stresses on (A) photosynthesis and (B) stomatal conductance. The days after drought treatment are reported in brackets. Values per treatments are mean ± SE (n = 10). Data characterized by the same letter do not differ significantly (p < 0.05, Tukey’s HSD test).
Forests 10 01032 g003
Figure 4. Effect of drought, salt, and the combination of both stresses on de-epoxidation state of the xanthophyll cycles (DEPS) at predawn (A) and midday (B) of sweetgum plants. The days after drought treatment are reported in brackets. Values per treatment are mean ± SE (n = 10). Data characterized by the same letter do not differ significantly (p < 0.05, Tukey’s HSD test).
Forests 10 01032 g004
Figure 5. Correlation between photosynthetic efficiency (Fv/Fm= Predawn, F’v/F’m = Midday) and xanthophyll cycle (DEPS).
Forests 10 01032 g005
Figure 6. Effect of drought, salt, and the combination of both stresses on isoprene emission in sweetgum plants. Values are mean ± SE (n = 10). Data characterized by the same letter do not differ significantly (p < 0.05).
Forests 10 01032 g006
Table 1. Results of linear mixed model analysis of variance, shown as percentage (%) of the variance loaded on fixed factors and interactions, for photosynthesis, stomatal conductance, and isoprene for each day after treatment.
Days After Salt StressDays After Water StressPhotosynthesisStomatal ConductanceIsoprene Emission
Salt StressDrought StressSalt X Drought StressSalt StressDrought StressSalt X Drought StressSalt StressDrought StressSalt X Drought Stress
12-ns--*--ns--
21-*--**--ns--
33-***--***--***--
46-*--*--***--
56-**--**--**--
63283.3 ***11.9 ns4.8 ns58.5 **34.0 ns7.5 ns76.8 ***17.2 **6.0 *
67626.6 **59.2 **14.6*14.8 ns72.9 *12.3 ns50.7 ***25.9 *23.4 **
70945.4 **46.8 *7.8*32.0 *60.7 *7.3 *76.9 ***16.9 **6.2 ns
731219.2 ***73.4 ***7.4 ***9.2 *88.0 ***72.866.0 *20.9 ns13.1 ns
83 79.7 ***13.8 *6.0 *72.1 ***17.5 **10.4 **88.9 ***10.8 ns0.3 ns
136 nsnsnsnsnsns50.0 **32.4 ns17.6 *
Significance: * = p < 0.05, ** = p < 0.01, *** = p < 0.001, ns = not significant.
Table 2. Mean values (±SE) chlorophyll a fluorescence parameters for sweetgum plants affected by the factors of drought, salt, and their combination on each day after treatment. Data (in column) followed by the same letter do not differ significantly (p < 0.05), n.d. = not detected.
Days After Treatment
122133465663(2)67(6)70(9)73(12)83 Drought Recovery136 Salt Recovery
Fo
Control205.2 a195.5 a198.7 b196.0 b206.3 b192.1 b193.2 b195.9 b187.7 c211.0 b196.41 a
(±3.8)(±2.7)(±4.2)(±3.3)(±4.5)(±3.9)(±2.6)(±3.8)(±2.4)(±7.3)(±3.4)
Droughtn.d.n.d.n.d.n.d.n.d.195.1 b196.6 b212.6 b233.4 b267.3 ab202.2 a
(±4.3)(±2.9)(±6.5)(±9.4)(±9.7)(±9.1)
Salt190.4 b193.4 a251.3 a248.2 a237.5 a246.6 a258.3 a256.5 a271.3 ab250.7 ab182.6 a
(±3.6)(±4.5)(±21.3)(±15.6)(±16.4)(±10,1)(±14.4)(±11.9)(±78)(±18.8)(±6.8)
Salt + droughtn.d.n.d.n.d.n.d.n.d.250.3 a246.9 a263.3 a283.3 a302.7 a194.5 a
(±17.5)(±14.4)(±18.0)(±14.2)(±30.7)(±8.0)
Fv/Fm
Control0.79 a0.80 a0.80 a0.82 a0.81 a0.82 a0.84 a0.81 a0.82 a0.80 a0.79 a
(±0.01)(±0.00)(±0.01)(±0.00)(±0.00)(±0.00)(±0.00)(±0.00)(±0.00)(±0.01)(±0.01)
Droughtn.d.n.d.n.d.n.d.n.d.0.81 a0.83 a0.79 a0.78 ab0.76 ab0.80 a
(±0.01)(±0.00)(±0.01)(±0.01)(±0.02)(±0.01)
Salt0.80 a0.80 a0.76 b0.77 b0.77 b0.74 b0.72 b0.71 b0.71 bc0.69 ab0.79 a
(±0.01)(±0.01)(±0.01)(±0.02)(±0.01)(±0.01)(±0.03)(±0.03)(±0.02)(±0.03)(±0.01)
Salt + droughtn.d.n.d.n.d.n.d.n.d.0.76 b0.75 ab0.68 b0.67 c0.68 c0.78 a
(±0.01)(±0.02)(±0.03)(±0.03)(±0.04)(±0.00)
ΦPSII
Control0.19 a0.20 a0.16 a0.18 a0.14 a0.14 a0.14 a0.18 a0.13 a0.18 a0.18 a
(±0.01)(±0.01)(±0.03)(±0.02)(±0.01)(±0.01)(±0.01)(±0.02)(±0.01)(±0.01)(±0.03)
Droughtn.d.n.d.n.d.n.d.n.d.0.12 ab0.11 a0.10 b0.04 b0.13 b0.16 a
(±0.02)(±0.01)(±0.01)(±0.01)(±0.01)(±0.03)
Salt0.17 a0.12 b0.06 b0.07 b0.06 b0.07 bc0.06 b0.03 c0.07 b0.10 bc0.20 a
(±0.01)(±0.01)(±0.01)(±0.01)(±0.01)(±0.01)(±0.01)(±0.01)(±0.02)(±0.02)(±0.05)
Salt + droughtn.d.n.d.n.d.n.d.n.d.0.06 c0.07 b0.05 c0.04 b0.06 c0.16 a
(±0.01)(±0.01)(±0.01)(±0.01)(±0.02)(±0.02)
NPQ
Control2.44 a2.06 b2.34 b2.73 b1.72 b1.76 b2.34 c2.01 b0.57 b1.29 b2.10 a
(±0.26)(±0.16)(±0.39)(±0.27)(±0.19)(±0.29)(±0.45)(±0.28)(±0.10)(±0.53)(±0.37)
Droughtn.d.n.d.n.d.n.d.n.d.1.86 b3.49 bc3.41 ab2.00 a1.62 b1.66 a
(±0.32)(±0.14)(±0.22)(±0.26)(±0.33)(±0.28)
Salt2.97 a2.96 a3.68 a4.36 a3.87 a3.47 a4.65 ab4.50 a1.88 a2.81 ab2.18 a
(±0.36)(±0.19)(±0.45)(±0.35)(±0.30)(±0.46)(±0.47)(±0.82)(±0.17)(±0.61)(±0.35)
Salt + droughtn.d.n.d.n.d.n.d.n.d.4.53 a5.06 a3.94 a2.30 a3.74 a2.48 a
(±0.33)(±0.25)(±0.37)(±0.26)(±0.43)(±0.22)
Table 3. Results of linear mixed model analysis of variance, shown as percentage (%) of the variance loaded on fixed factors and interactions, for F0, Fv/Fm, ΦPSII, and NPQ for each day after treatment.
Days After Salt StressDays After Water StressF0Fv/FmΦPSIINPQ
Salt StressDrought StressSalt + Drought StressSalt StressDrought StressSalt + Drought StressSalt StressDrought StressSalt + Drought StressSalt StressDrought StressSalt + Drought Stress
12-*--ns--ns--ns--
21-ns--ns--*--*--
33-*--*--**--*--
46-**--*--**--*--
56-*--**--***-****--
63278.3 **20.6 ns1.1 ns76.2 ***18.7 ns5.1 ns61.9 **27.5 ns10.6 ns60.8 **37.8 ns1.4 ns
67683.1 **11.9 ns5.0 ns57.9 ***26.4 *15.7 *67.9 ***13.0 ns19.1 *53.7 ***39.4 **6.9 ns
70971.8 **22.2 ns6.0 ns66.9 ***24.7 **8.4 ns65.1 ***15.3 *19.6 ***48.0 **28.4 ns23.6 *
731263.2 ***28.4 *8.4 ns72.1 ***25.8 ns2.1 ns9.7 *72.6 ***17.7 **27.6 **62.5 ***9.9 ns
83 35.5 ns62.7 ns1.8 nsnsnsns57.8 **41.2 ns1.0 ns68.2 ***30.6 ns1.2 ns
136 **nsns*nsnsnsnsns*nsns
Significance: * = p < 0.05, ** = p < 0.01, *** = p < 0.001, ns = not significant.

