Genetic Diversity and Population Genetic Structure of Cinnamomum camphora in South China Revealed by EST-SSR Markers

 ,
,
Abstract
1. Introduction
2. Materials and Methods
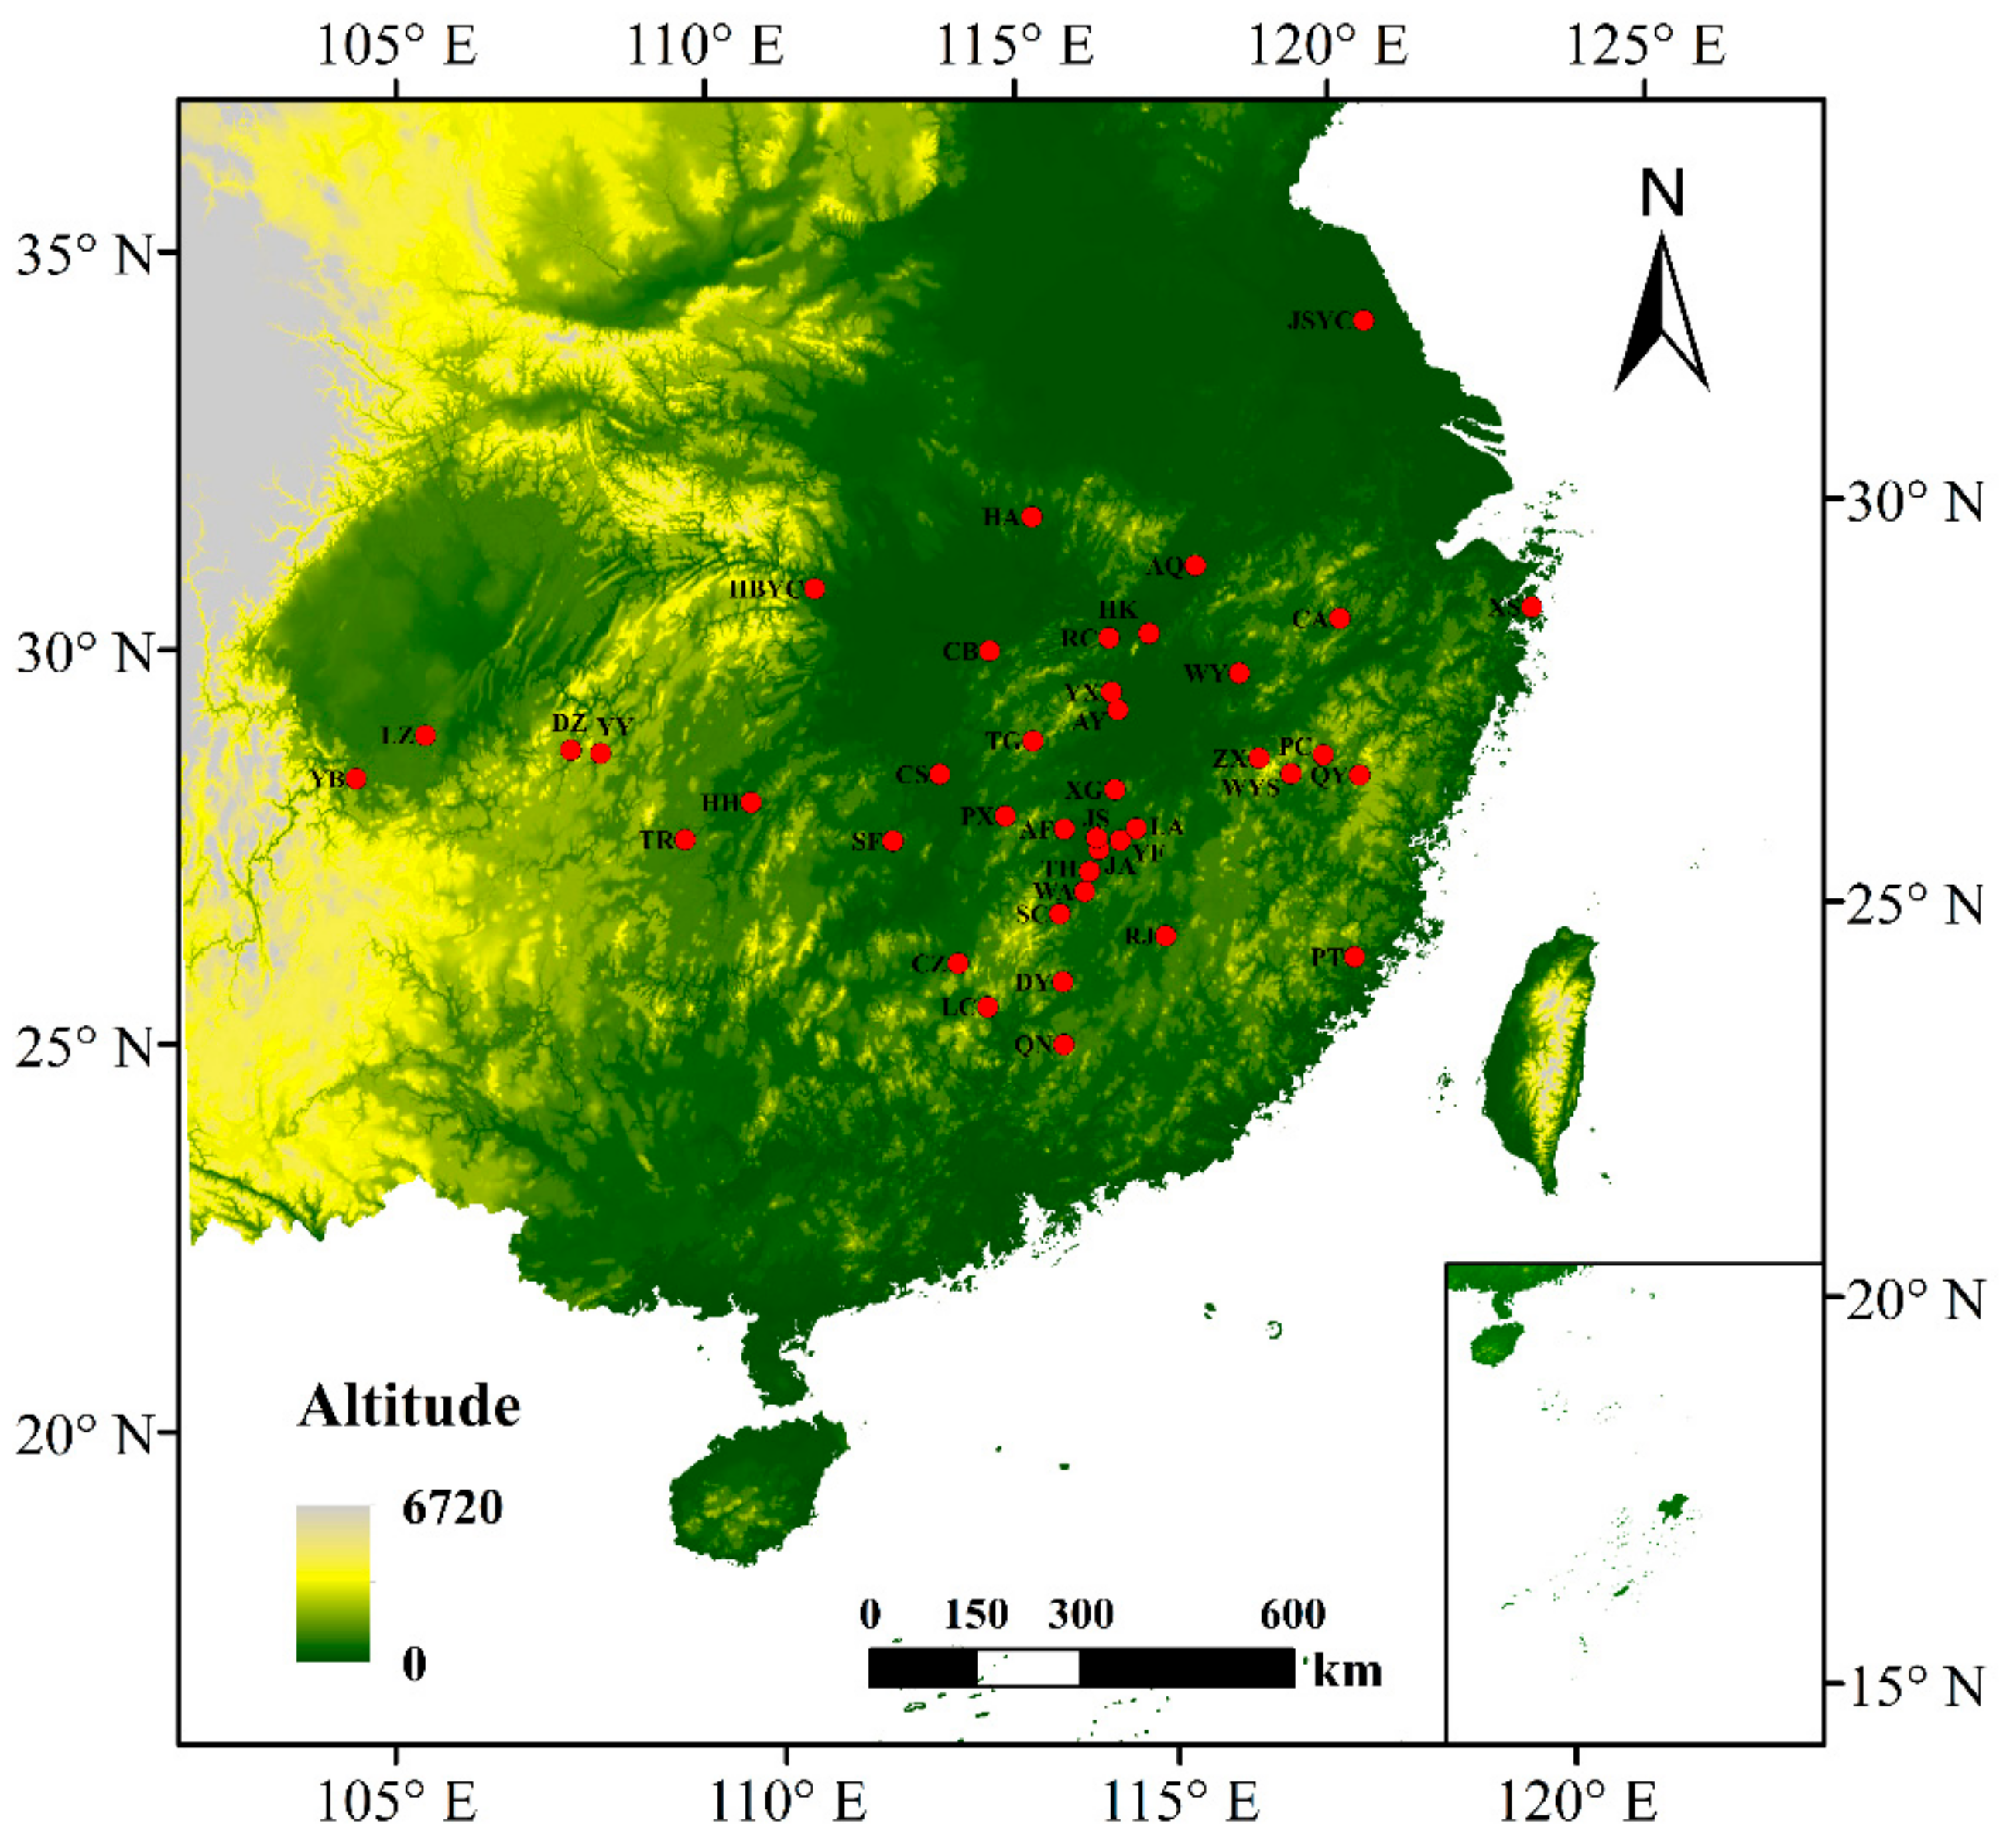
2.1. Plant Material and DNA Isolation
2.2. SSR Development, Identification, and Analysis
2.3. Statistical Analysis
3. Results
3.1. Development of Polymorphic EST-SSR Markers
3.2. Polymorphism of 22 SSR Loci
3.3. Genetic Diversity in C. camphora
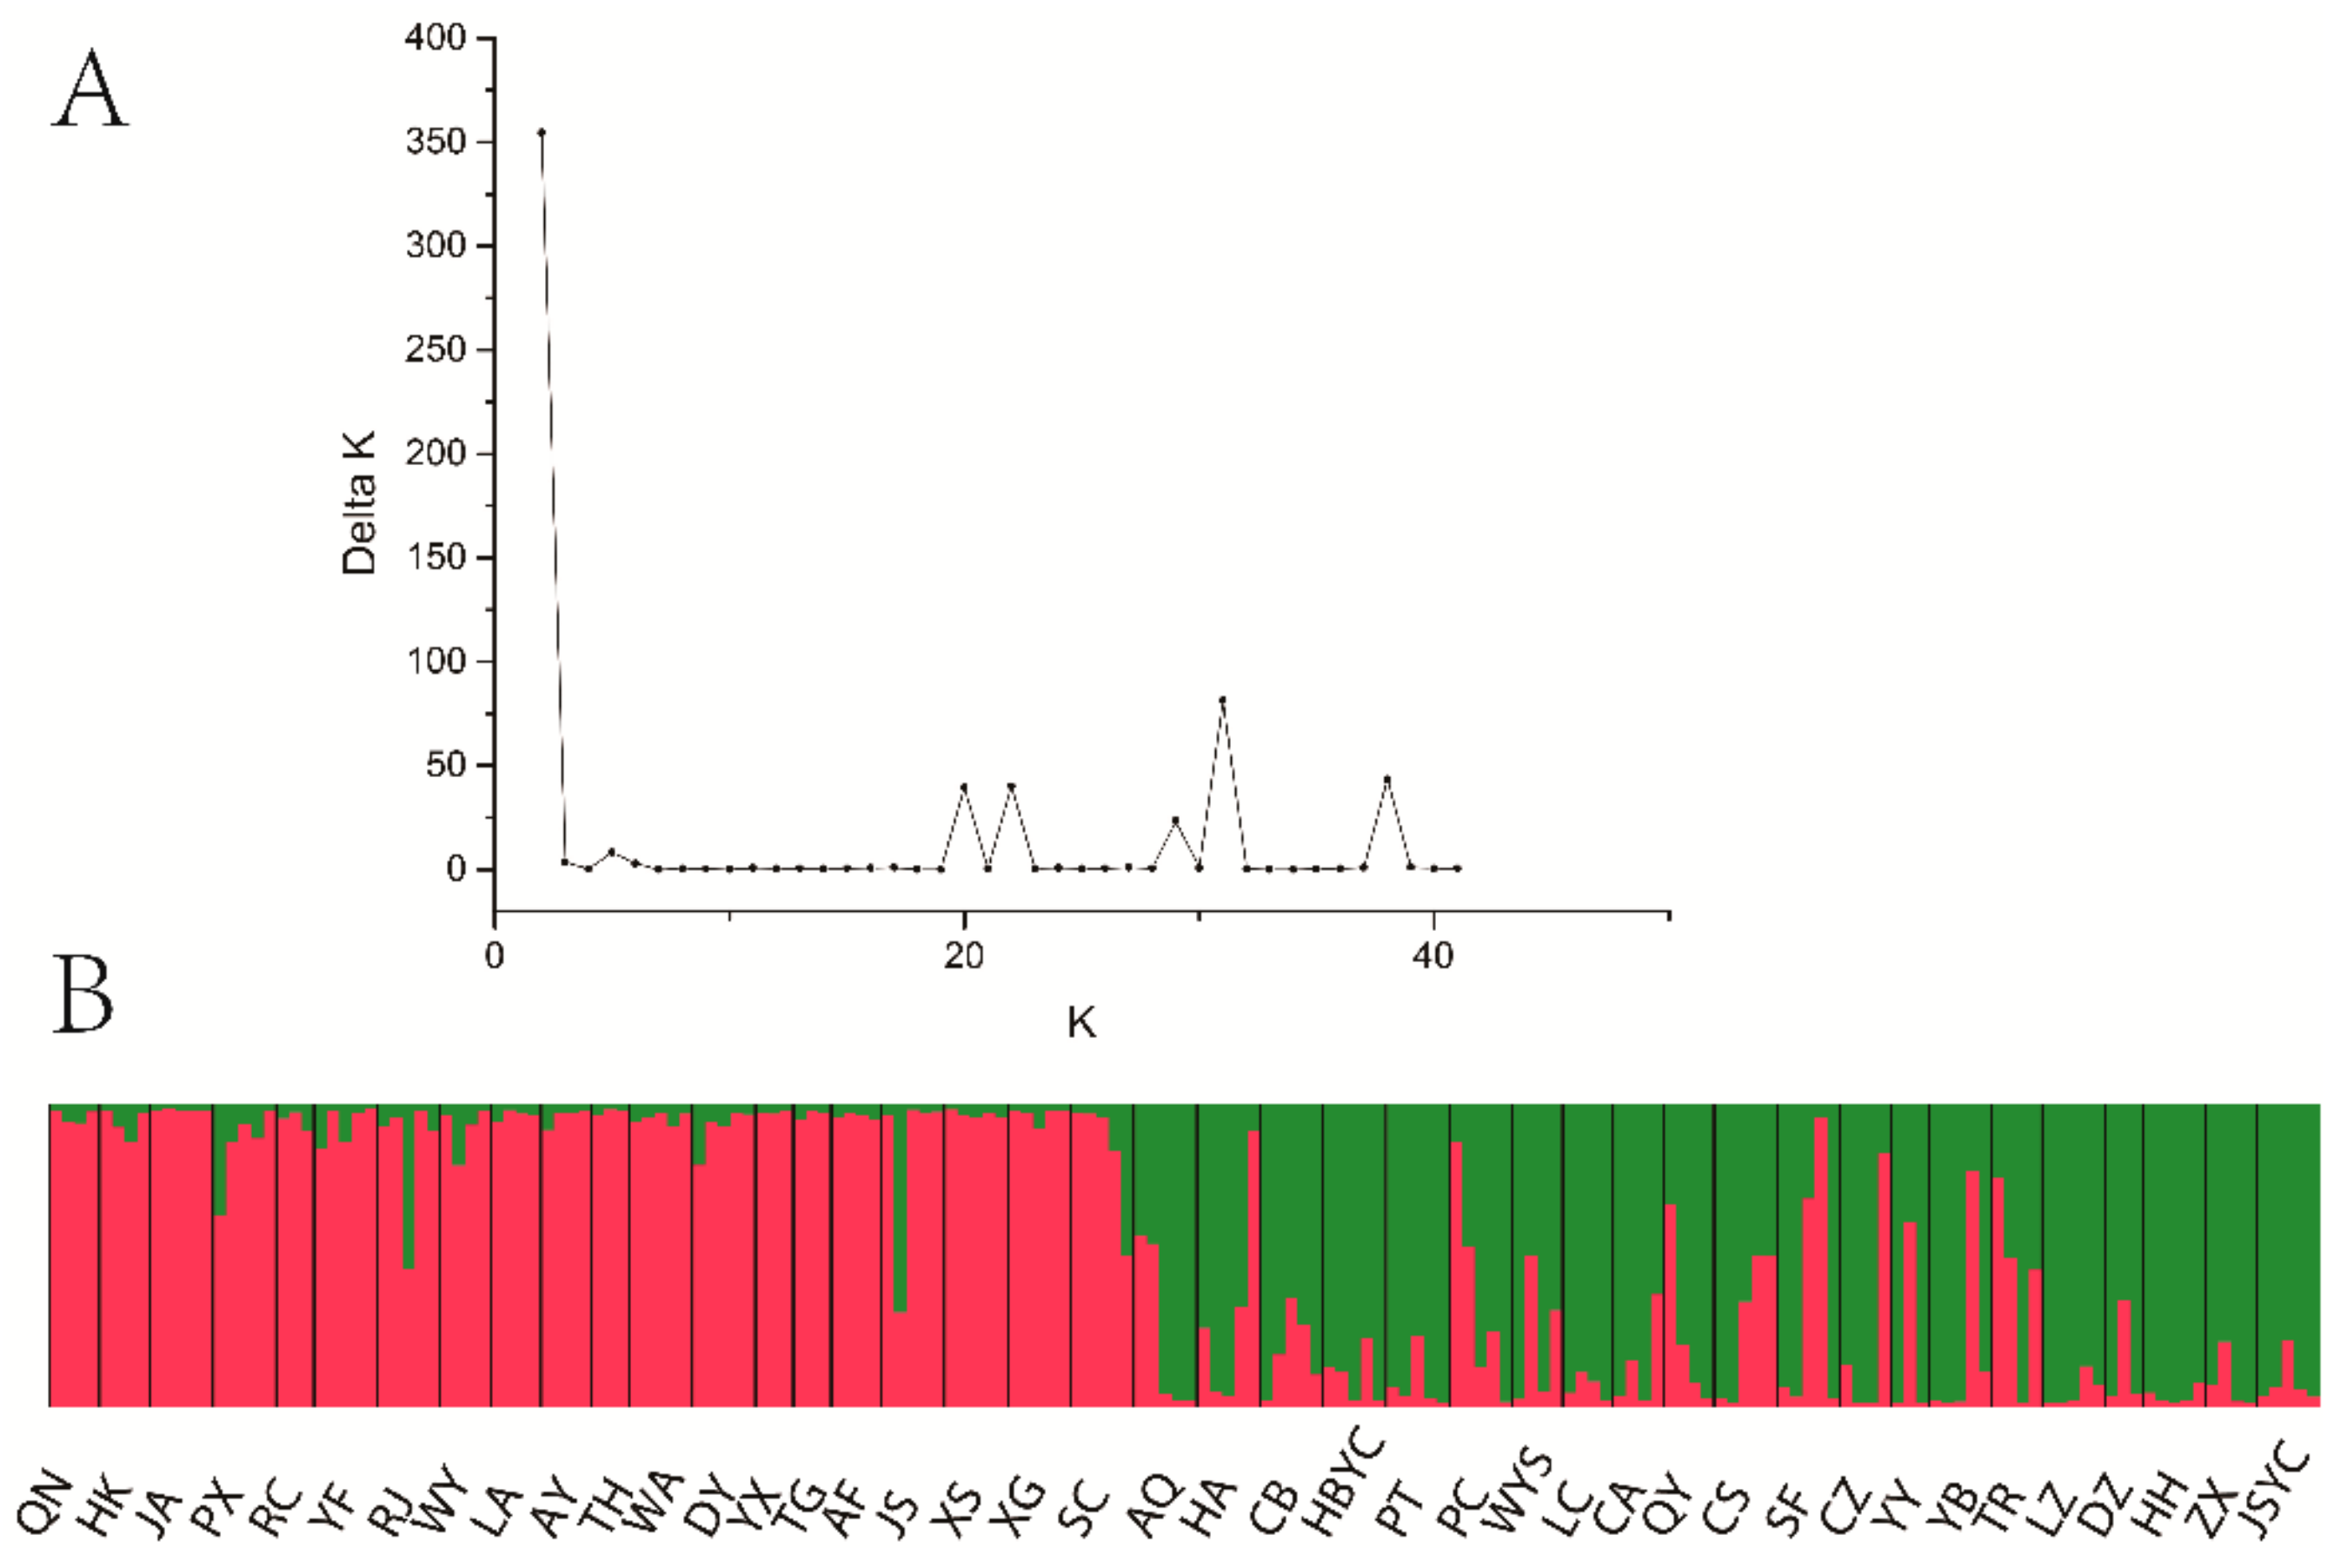
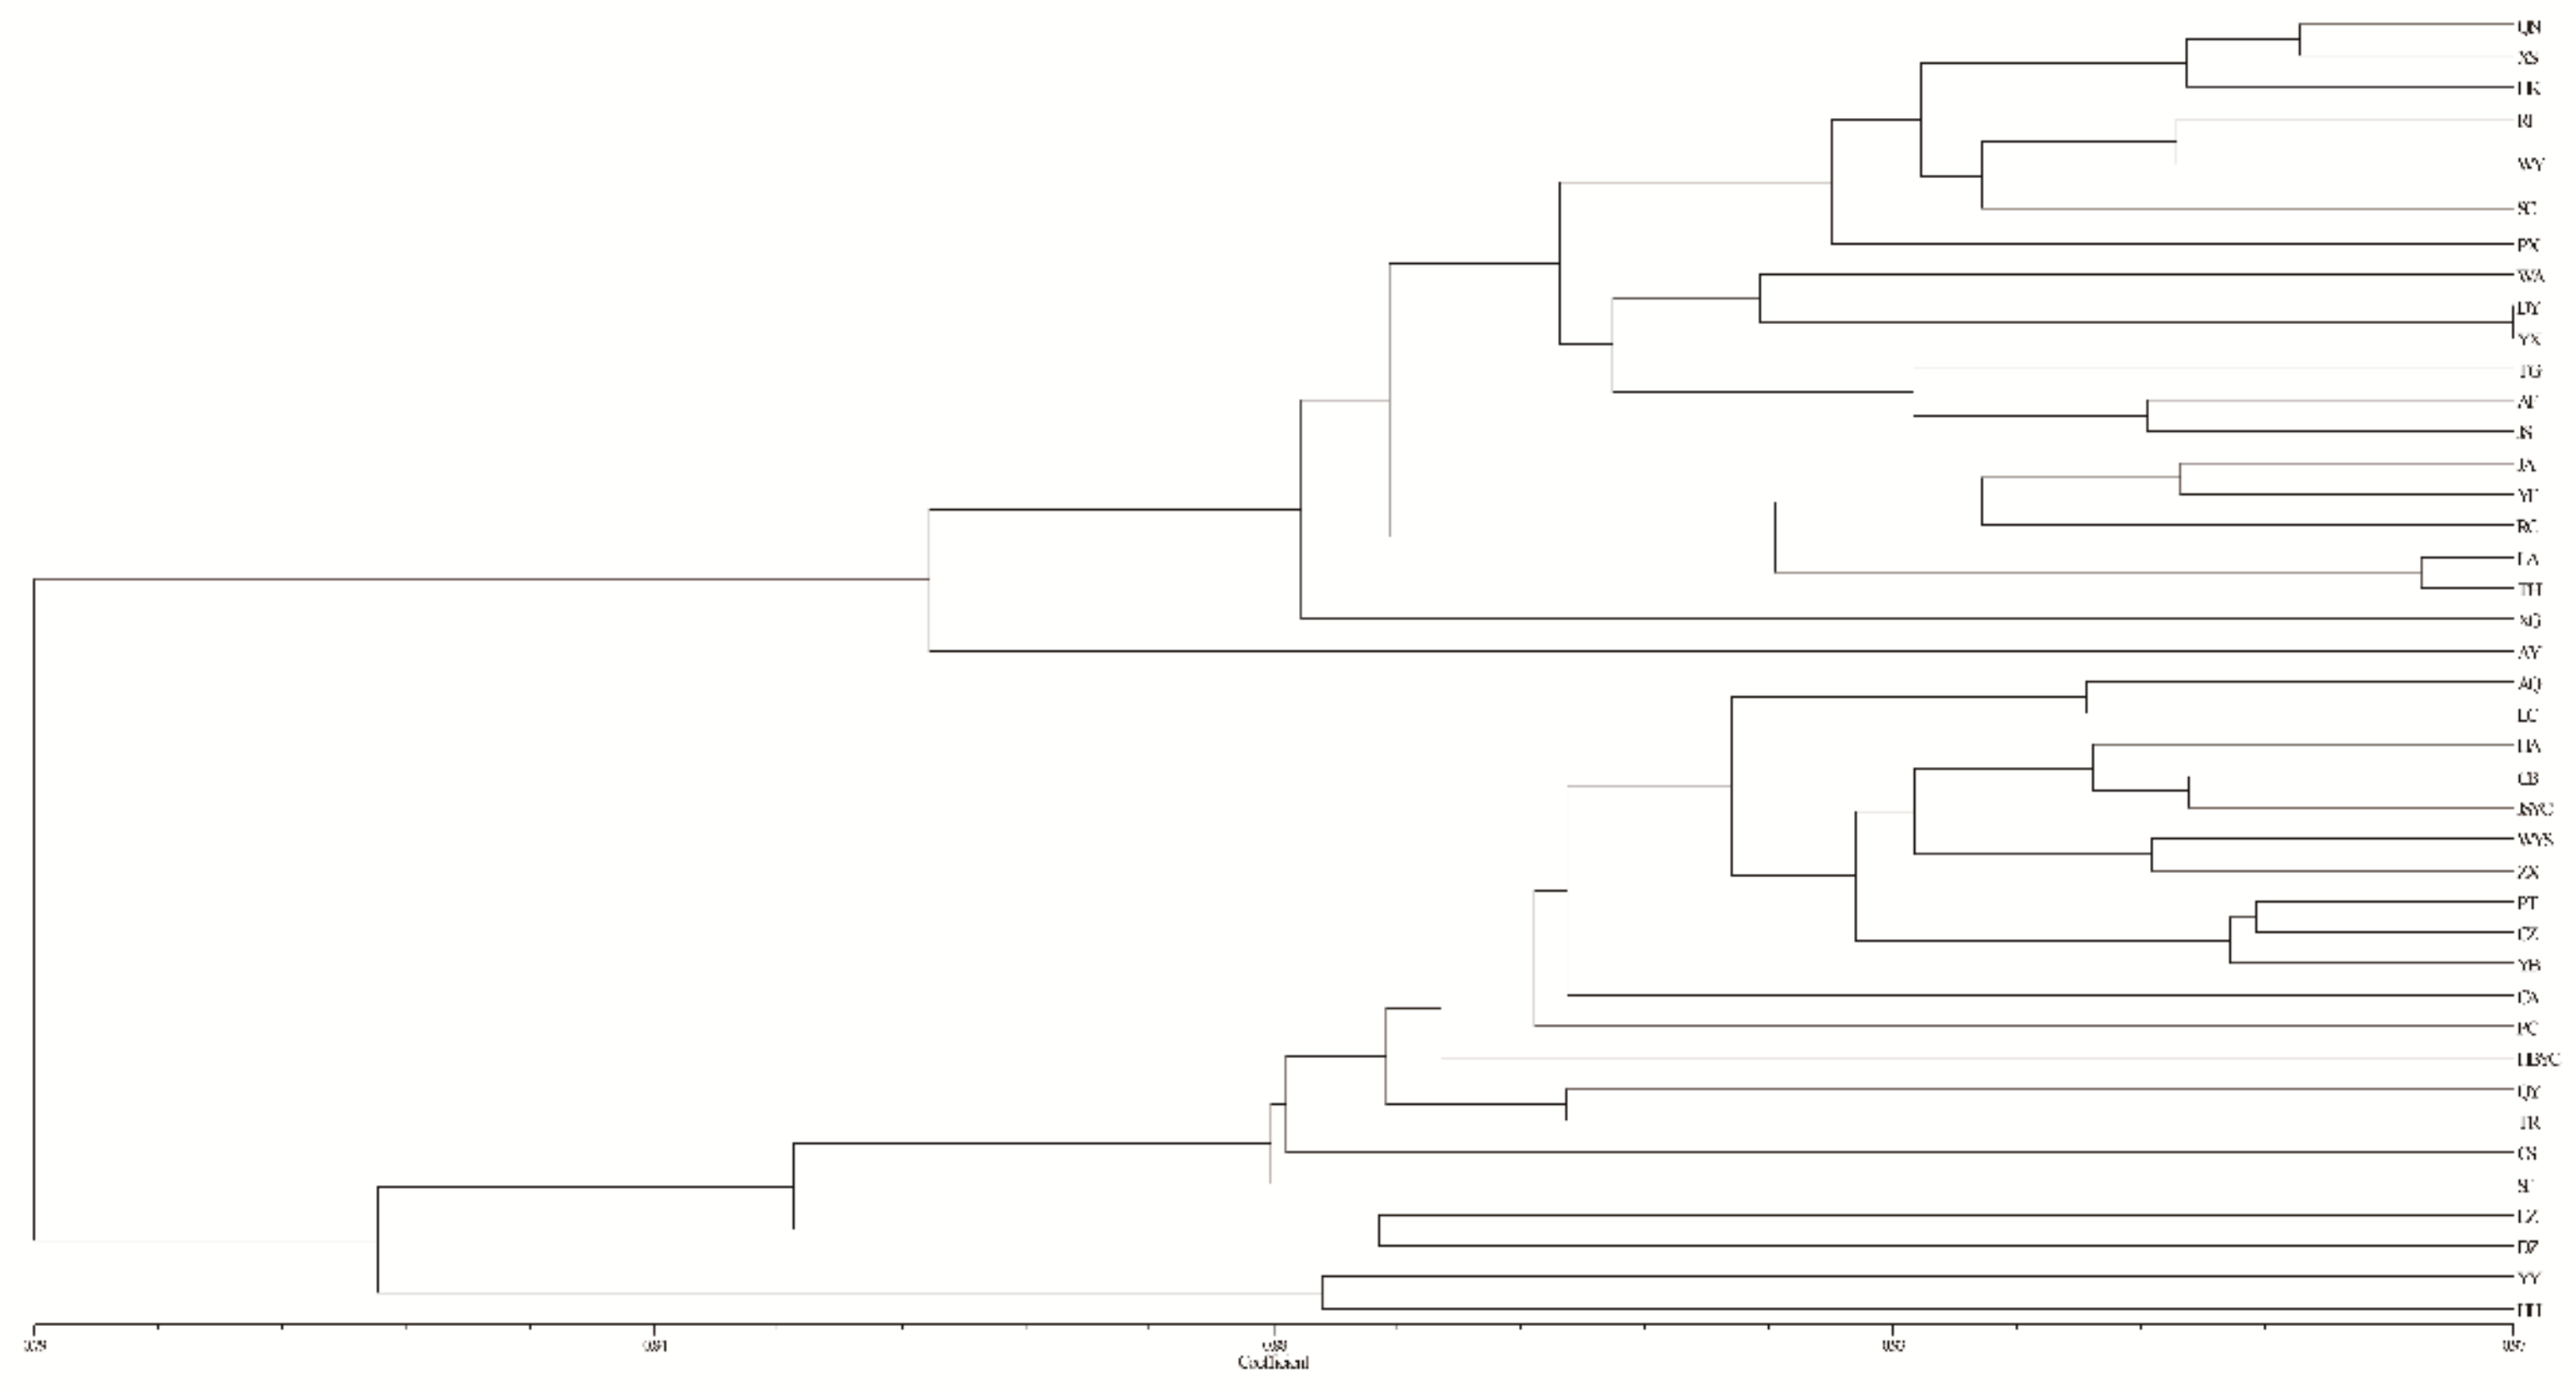
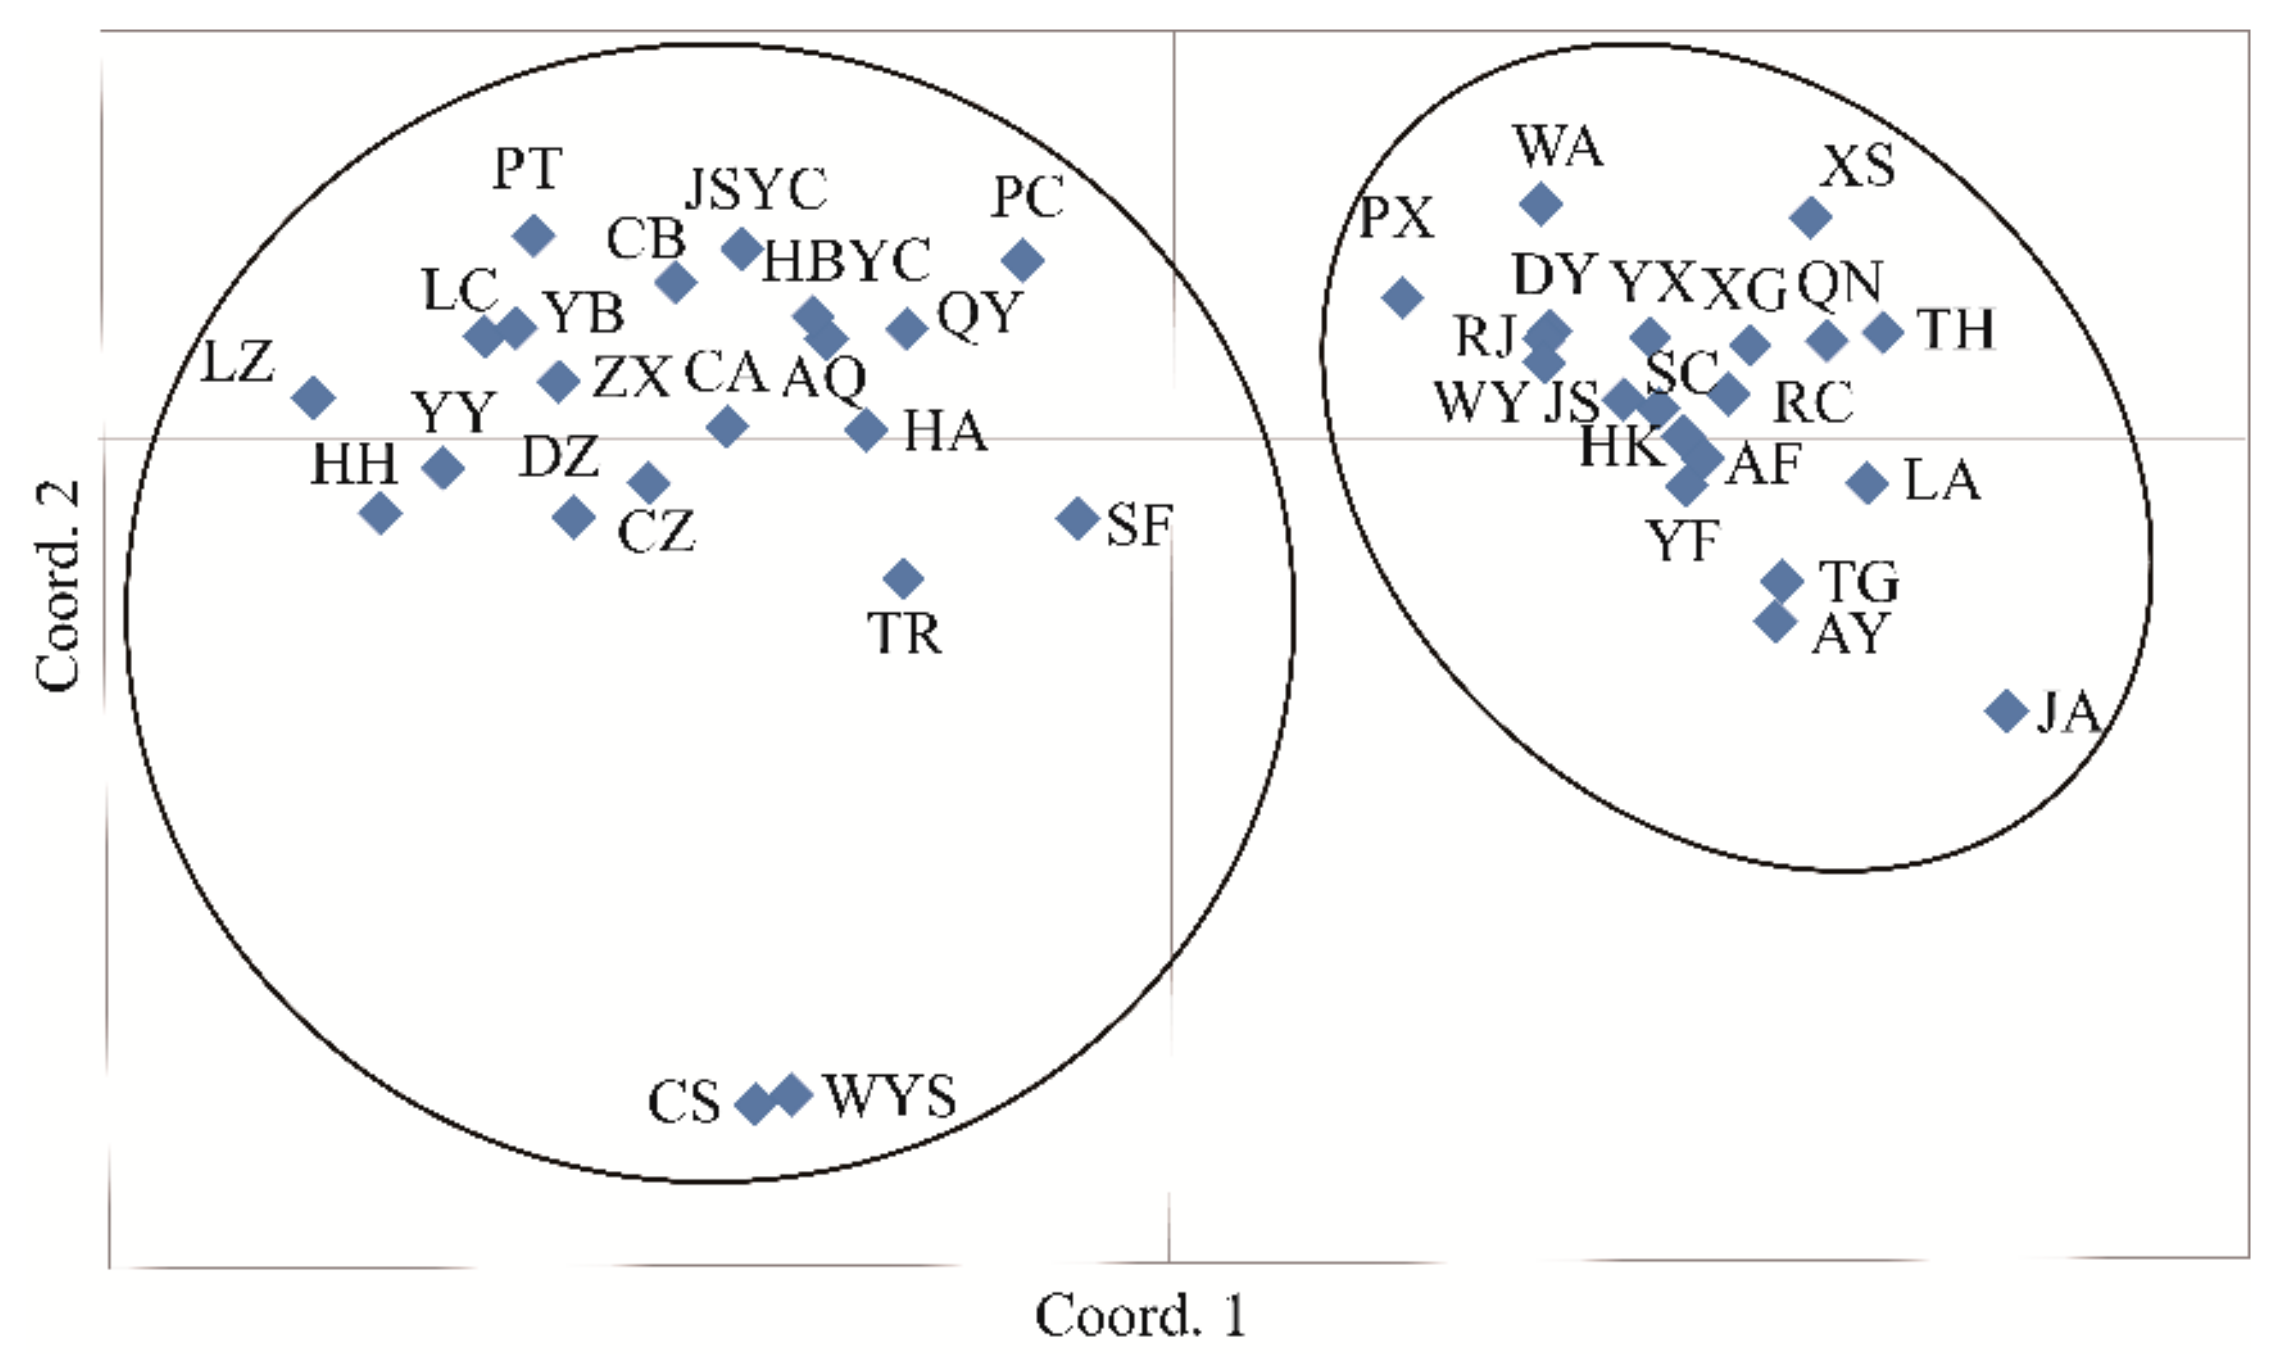
3.4. Population Genetic Structure of C. camphora
4. Discussion
4.1. Development of EST-SSR Markers for C. camphora
4.2. Genetic Diversity of C. camphora
4.3. Genetic Differentiation and Population Genetic Structure of C. camphora
4.4. Conservation Strategies for C. camphora
5. Conclusions
Supplementary Materials
Author Contributions
Funding
Acknowledgments
Conflicts of Interest
References
- Chaw, S.M.; Liu, Y.C.; Wu, Y.W.; Wang, H.Y.; Lin, C.I.; Wu, C.S.; Ke, H.M.; Chang, L.Y.; Hsu, C.Y.; Yang, H.T.; et al. Stout camphor tree genome fills gaps in understanding of flowering plant genome evolution. Nat. Plants 2019, 5, 63–73. [Google Scholar] [CrossRef]
- Joy, P.; Maridass, M. Inter Species Relationship of Cinnamomum Species Using RAPD Marker Analysis. Ethnobot. Leafl. 2008, 12, 476–480. [Google Scholar]
- Editorial Board of Flora of the Trees in China. In Flora of the Trees in China; Science Press: Beijing, China, 1982.
- Chen, Z.; Wu, B.; Li, J.; Zhao, T.; Zhou, X.; Zhang, Y. Germination of the seeds and growth of the seedlings of Cinnamomum camphora (L.) Presl. Plant Species Biol. 2004, 19, 55–58. [Google Scholar] [CrossRef]
- Doh, E.J.; Kim, J.H.; Oh, S.E.; Lee, G. Identification and monitoring of Korean medicines derived from Cinnamomum spp. by using ITS and DNA marker. Genes Genom. 2017, 39, 101–109. [Google Scholar] [CrossRef]
- Panetta, F.D. Seedling emergence and seed longevity of the tree weeds Celtis sinensis and Cinnamomum camphora. Weed Res. 2010, 41, 83–95. [Google Scholar] [CrossRef]
- Firth, D.J. Camphor laurel (Cinnamomum camphora)—A new weed in north-eastern New South Wales. Aust. Weeds 1981, 2, 26–28. [Google Scholar]
- Firth, D.J. Camphor laurel: Important tree weed in the north-east. Agric. Gaz. N. S. W. 1979, 90, 14–15. [Google Scholar]
- Daubenmire, R. The Magnolia grandiflora-Quercus virginiana Forest of Florida. Am. Midl. Nat. 1990, 123, 331–347. [Google Scholar] [CrossRef]
- Kameyama, Y.; Nakajima, H. Environmental conditions for seed germination and seedling growth of Cinnamomum camphora (Lauraceae): The possibility of regeneration in an abandoned deciduous broad-leaved forest, eastern Japan. J. For. Res. 2018, 23, 190–194. [Google Scholar] [CrossRef]
- Zhou, Y.; Yan, W. Conservation and applications of camphor tree (Cinnamomum camphora) in China: Ethnobotany and genetic resources. Genet. Resour. Crop Evol. 2015, 63, 1049–1061. [Google Scholar] [CrossRef]
- Singh, R.; Jawaid, T. Cinnamomum camphora (Kapur): Review. Pharmacogn. J. 2012, 4, 1–5. [Google Scholar] [CrossRef]
- Lee, H.J.; Hyun, E.-A.; Yoon, W.J.; Kim, B.H.; Rhee, M.H.; Kang, H.K.; Cho, J.Y.; Yoo, E.S. In vitro anti-inflammatory and anti-oxidative effects of Cinnamomum camphora extracts. J. Ethnopharmacol. 2006, 103, 208–216. [Google Scholar] [CrossRef]
- Li, Y.; Fu, C.; Yang, W.; Wang, X.; Feng, D.; Wang, X.; Ren, D.; Lou, H.; Shen, T. Investigation of constituents from Cinnamomum camphora (L.) J. Presl and evaluation of their anti-inflammatory properties in lipopolysaccharide stimulated RAW 264.7 macrophages. J. Ethnopharmacol. 2018, 221, 37–47. [Google Scholar] [CrossRef]
- Li, Z.R.; Chen, S.X. Jiangxi Camphor Tree; Jiangxi Science and Technology Press: Nanchang, China, 2015. [Google Scholar]
- Kameyama, Y.; Furumichi, J.; Li, J.; Tseng, Y.-H. Natural genetic differentiation and human-mediated gene flow: The spatiotemporal tendency observed in a long-lived Cinnamomum camphora (Lauraceae) tree. Tree Genet. Genomes 2017, 13, 38. [Google Scholar] [CrossRef]
- Wang, S.; Xie, Y. China Species Red List; Higer Education Press: Beijing, China, 2004. [Google Scholar]
- Yao, X.; Ren, H.; Wang, K.; Wu, K.; Gao, S. A Preliminary Study on Genetic Variance of Bud Germination at the Seedling Stage of Cinnamomum camphora (L.) presl. Acta Agric. Univ. Jiangxiensis 2001, 23, 537–543. [Google Scholar]
- Li, Z.; Zhong, Y.; Yu, F.; Xu, M. Novel SSR marker development and genetic diversity analysis of Cinnamomum camphora based on transcriptome sequencing. Plant Genet. Resour. Charact. Util. 2018, 16, 568–571. [Google Scholar] [CrossRef]
- Kameyama, Y. Development of microsatellite markers for Cinnamomum camphora (Lauraceae). Am. J. Bot. 2012, 99, e1–e3. [Google Scholar] [CrossRef]
- Liu, F.; Hong, Z.; Xu, D.; Jia, H.; Zhang, N.; Liu, X.; Yang, Z.; Lu, M. Genetic Diversity of the Endangered Dalbergia odorifera Revealed by SSR Markers. Forests 2019, 10, 225. [Google Scholar] [CrossRef]
- Tan, J.; Zhao, Z.-G.; Guo, J.-J.; Wang, C.-S.; Zeng, J. Genetic Diversity and Population Genetic Structure of Erythrophleum fordii Oliv., an Endangered Rosewood Species in South China. Forests 2018, 9, 636. [Google Scholar] [CrossRef]
- Thriveni, H.N.; Sumangala, R.C.; Shivaprakash, K.N.; Ravikanth, G.; Vasudeva, R.; Ramesh Babu, H.N. Genetic structure and diversity of Coscinium fenestratum: A critically endangered liana of Western Ghats, India. Plant Syst. Evol. 2013, 300, 403–413. [Google Scholar] [CrossRef]
- Chen, Y.-Y.; Bao, Z.-X.; Qu, Y.; Li, W.; Li, Z.-Z. Genetic diversity and population structure of the medicinal orchid Gastrodia elata revealed by microsatellite analysis. Biochem. Syst. Ecol. 2014, 54, 182–189. [Google Scholar] [CrossRef]
- Müller, M.; Cuervo-Alarcon, L.; Gailing, O.; Rajendra, K.C.; Chhetri, M.; Seifert, S.; Arend, M.; Krutovsky, K.; Finkeldey, R. Genetic Variation of European Beech Populations and Their Progeny from Northeast Germany to Southwest Switzerland. Forests 2018, 9, 469. [Google Scholar] [CrossRef]
- Powell, W.; Morgante, M.; Andre, C.; Hanafey, M.; Vogel, J.; Tingey, S.; Rafalski, A. The comparison of RFLP, RAPD, AFLP and SSR (microsatellite) markers for germplasm analysis. Mol. Breed. 1996, 2, 225–238. [Google Scholar] [CrossRef]
- Stojnić, S.; Avramidou, E.V.; Fussi, B.; Westergren, M.; Orlović, S.; Matović, B.; Trudić, B.; Kraigher, H.; Aravanopoulos, F.A.; Konnert, M. Assessment of Genetic Diversity and Population Genetic Structure of Norway Spruce (Picea abies (L.) Karsten) at Its Southern Lineage in Europe. Implications for Conservation of Forest Genetic Resources. Forests 2019, 10, 258. [Google Scholar]
- Chen, C.; Zheng, Y.; Zhong, Y.; Wu, Y.; Li, Z.; Xu, L.A.; Xu, M. Transcriptome analysis and identification of genes related to terpenoid biosynthesis in Cinnamomum camphora. BMC Genom. 2018, 19, 550. [Google Scholar] [CrossRef]
- Yeh, F.C.; Yang, R.C.; Boyle, T.B.J.; Ye, Z.H.; Mao, J.X.; Yeh, C.; Timothy, B.; Mao, X. POPGENE (Version 1.31), the User-Friendly Shareware for Population Genetic Analysis. In Molecular Biology and Biotechnology Center; University of Alberta: Edmonton, Canada, 1997. [Google Scholar]
- Nagy, S.; Poczai, P.; Cernák, I.; Gorji, A.M.; Hegedűs, G.; Taller, J. PICcalc: An Online Program to Calculate Polymorphic Information Content for Molecular Genetic Studies. Biochem. Genet. 2012, 50, 670–672. [Google Scholar] [CrossRef]
- Peakall, R.; Smouse, P.E. GenAlEx 6.5: Genetic analysis in Excel. Population genetic software for teaching and research-an update. Bioinformatics 2012, 28, 2537–2539. [Google Scholar] [CrossRef]
- Evanno, G.; Regnaut, S.J.; Goudet, J. Detecting the number of clusters of individuals using the software STRUCTURE A simulation study. Mol. Ecol. 2005, 14, 2611–2620. [Google Scholar] [CrossRef]
- Earl, D.A.; vonHoldt, B.M. STRUCTURE HARVESTER: A website and program for visualizing STRUCTURE output and implementing the Evanno method. Conserv. Genet. Resour. 2011, 4, 359–361. [Google Scholar] [CrossRef]
- Jakobsson, M.; Rosenberg, N.A. CLUMPP: A cluster matching and permutation program for dealing with label switching and multimodality in analysis of population structure. Bioinformatics 2007, 23, 1801–1806. [Google Scholar] [CrossRef]
- Rohlf, F.J. NTSYS-pc Numerical Taxonomy and Multivariate Analysis System Solutions Manual. Am. Stat. 2000, 41, 330. [Google Scholar] [CrossRef]
- Manel, S.; Schwartz, M.K.; Luikart, G.; Taberlet, P. Landscape genetics combining landscape ecology and population genetics. Trends Ecol. Evol. 2003, 18, 189–197. [Google Scholar] [CrossRef]
- Yuan, X.-Y.; Sun, Y.-W.; Bai, X.-R.; Dang, M.; Feng, X.-J.; Zulfiqar, S.; Zhao, P. Population Structure, Genetic Diversity, and Gene Introgression of Two Closely Related Walnuts (Juglans regia and J. sigillata) in Southwestern China Revealed by EST-SSR Markers. Forests 2018, 9, 646. [Google Scholar] [CrossRef]
- Ellis, J.R.; Burke, J.M. EST-SSR as a resource for population genetic analyses. Heredity 2007, 99, 125–132. [Google Scholar] [CrossRef] [PubMed]
- Dang, M.; Zhang, T.; Hu, Y.; Zhou, H.; Woeste, K.; Zhao, P. De Novo Assembly and Characterization of Bud, Leaf and Flowers Transcriptome from Juglans Regia L. for the Identification and Characterization of New EST-SSRs. Forests 2016, 7, 247. [Google Scholar] [CrossRef]
- Hung, K.-H.; Lin, C.-H.; Shih, H.-C.; Chiang, Y.-C.; Ju, L.-P. Development, characterization and cross-species amplification of new microsatellite primers from an endemic species Cinnamomum kanehirae (Lauraceae) in Taiwan. Conserv. Genet. Resour. 2014, 6, 911–913. [Google Scholar] [CrossRef]
- Dong, W.; Zhang, X.; Guansong, Y.; Yang, L.; Wang, Y.; Shen, S. Biological characteristics and conservation genetics of the narrowly distributed rare plant Cinnamomum chago (Lauraceae). Plant Divers. 2016, 38, 247–252. [Google Scholar] [CrossRef]
- Liu, S.; An, Y.; Li, F.; Li, S.; Liu, L.; Zhou, Q.; Zhao, S.; Wei, C. Genome-wide identification of simple sequence repeats and development of polymorphic SSR markers for genetic studies in tea plant (Camellia sinensis). Mol. Breed. 2018, 38, 59. [Google Scholar] [CrossRef]
- Väli, U.; Einarsson, A.; Waits, L.; Ellegren, H. To what extent do microsatellite markers reflect genome-wide genetic diversity in natural populations? Mol. Ecol. 2008, 17, 3808–3817. [Google Scholar] [CrossRef]
- Lammi, A.; Siikamaki, P.; Mustajarvi, K. Genetic Diversity, Population Size, and Fitness in Central and Peripheral Populations of a Rare Plant Lychnis viscaria. Conserv. Biol. 1999, 13, 1069–1078. [Google Scholar] [CrossRef]
- Li, X.; Li, M.; Hou, L.; Zhang, Z.; Pang, X.; Li, Y. De Novo Transcriptome Assembly and Population Genetic Analyses for an Endangered Chinese Endemic Acer miaotaiense (Aceraceae). Genes 2018, 9, 378. [Google Scholar] [CrossRef] [PubMed]
- Ferrer, M.; Eguiarte, L.; Montana, C. Genetic structure and outcrossing rates in Flourensia cernua (Asteraceae) growing at different densities in the South-western Chihuahuan Desert. Ann. Bot. 2004, 94, 419–426. [Google Scholar] [CrossRef] [PubMed]
- Shen, Y.; Cheng, Y.; Li, K.; Li, H. Integrating Phylogeographic Analysis and Geospatial Methods to Infer Historical Dispersal Routes and Glacial Refugia of Liriodendron chinense. Forests 2019, 10, 565. [Google Scholar] [CrossRef]
- Hamrick, J.L.; Godt, M.J.W.; Sherman-Broyles, S.L. Factors influencing levels of genetic diversity in woody plant species. New For. 1992, 6, 95–124. [Google Scholar] [CrossRef]
- Zhai, S.H.; Yin, G.S.; Yang, X.H. Population Genetics of the Endangered and Wild Edible Plant Ottelia acuminata in Southwestern China Using Novel SSR Markers. Biochem. Genet. 2018, 56, 235–254. [Google Scholar] [CrossRef]
- Shen, Z.; Zhang, K.; Ma, L.; Duan, J.; Ao, Y. Analysis of the genetic relationships and diversity among 11 populations of Xanthoceras sorbifolia using phenotypic and microsatellite marker data. Electron. J. Biotechnol. 2017, 26, 33–39. [Google Scholar] [CrossRef]
- Dervishi, A.; Jakše, J.; Ismaili, H.; Javornik, B.; Štajner, N. Comparative assessment of genetic diversity in Albanian olive (Olea europaea L.) using SSRs from anonymous and transcribed genomic regions. Tree Genet. Genomes 2018, 14, 53. [Google Scholar] [CrossRef]
- Boaventura-Novaes, C.R.D.; Novaes, E.; Mota, E.E.S.; Telles, M.P.C.; Coelho, A.S.G.; Chaves, L.J. Genetic drift and uniform selection shape evolution of most traits in Eugenia dysenterica DC. (Myrtaceae). Tree Genet. Genomes 2018, 14, 76. [Google Scholar] [CrossRef]
- Long, X.; Weng, Y.; Liu, S.; Hao, Z.; Sheng, Y.; Guan, L.; Shi, J.; Chen, J. Genetic Diversity and Differentiation of Relict Plant Liriodendron Populations Based on 29 Novel EST-SSR Markers. Forests 2019, 10, 334. [Google Scholar] [CrossRef]
- Guo, H.-Y.; Wang, Z.-L.; Huang, Z.; Chen, Z.; Yang, H.-B.; Kang, X.-Y. Genetic Diversity and Population Structure of Alnus cremastogyne as Revealed by Microsatellite Markers. Forests 2019, 10, 278. [Google Scholar] [CrossRef]
- Quintana, J.; Contreras, A.; Merino, I.; Vinuesa, A.; Orozco, G.; Ovalle, F.; Gomez, L. Genetic characterization of chestnut (Castanea sativa Mill.) orchards and traditional nut varieties in El Bierzo, a glacial refuge and major cultivation site in northwestern Spain. Tree Genet. Genomes 2014, 11, 826. [Google Scholar] [CrossRef][Green Version]
- Wright, S. The interpretation of population structure by F-statistics with special regard to systems of mating. Evolution 1965, 19, 395–420. [Google Scholar] [CrossRef]
- Hartvig, I.; So, T.; Changtragoon, S.; Tran, H.T.; Bouamanivong, S.; Theilade, I.; Kjaer, E.D.; Nielsen, L.R. Population genetic structure of the endemic rosewoods Dalbergia cochinchinensis and D. oliveri at a regional scale reflects the Indochinese landscape and life-history traits. Ecol. Evol. 2018, 8, 530–545. [Google Scholar] [CrossRef] [PubMed]
- Wright, S. Evolution in mendelian populations. Genetics 1931, 16, 97–159. [Google Scholar] [PubMed]
- Albaladejo, R.G.; Carrillo, L.F.; Aparicio, A.; Fernández-Manjarrés, J.F.; González-Varo, J.P. Population genetic structure in Myrtus communis L. in a chronically fragmented landscape in the Mediterranean: Can gene flow counteract habitat perturbation? Plant Biol. 2009, 11, 442–453. [Google Scholar] [CrossRef] [PubMed]
- Forest, F.; Grenyer, R.; Rouget, M.; Davies, T.J.; Cowling, R.M.; Faith, D.P.; Balmford, A.; Manning, J.C.; Procheş, Ş.; Bank, M.V.D.; et al. Preserving the evolutionary potential of floras in biodiversity hotspots. Nature 2007, 445, 757–760. [Google Scholar] [CrossRef]


| Abbreviation | Sample Size | Locations | Longitude (E) | Latitude (N) | Altitude (m) | DBH (cm) | Alleles | Na | Ne | Ho | He | GD | FIS | PPB% |
|---|---|---|---|---|---|---|---|---|---|---|---|---|---|---|
| Group I | 86 | |||||||||||||
| QN | 4 | Quannan, Jiangxi | 114°22′–114°35′ | 24° 38′–24° 46′ | 257–352 | 115–165 | 44 | 2.00 | 1.77 | 0.58 | 0.45 | 0.40 | −0.46 | 86.36 |
| HK | 4 | Hukou, Jiangxi | 116°12′–116°13′ | 29° 43′ | 20.9–190.1 | 51–111 | 46 | 2.09 | 1.84 | 0.61 | 0.48 | 0.42 | −0.44 | 90.91 |
| JA | 5 | Ji’an, Jiangxi | 115°08′ | 27°04′ | 75.1–76.5 | 52–70 | 45 | 2.05 | 1.78 | 0.52 | 0.43 | 0.38 | −0.36 | 81.82 |
| PX | 5 | Pingxiang, Jiangxi | 113°50′–114°04′ | 27°36′–27°38′ | 113.7–194.1 | 125–260 | 49 | 2.23 | 1.83 | 0.49 | 0.44 | 0.40 | −0.23 | 86.36 |
| RC | 3 | Ruichang, Jiangxi | 115°36′ | 29°43′ | 23.7–39.6 | 83–127 | 41 | 1.86 | 1.70 | 0.44 | 0.40 | 0.34 | −0.31 | 68.18 |
| YF | 5 | Yongfeng, Jiangxi | 115°27′–115°31′ | 27°09′–27°19′ | 78.9–103.8 | 74–165 | 46 | 2.09 | 1.75 | 0.49 | 0.42 | 0.37 | −0.32 | 86.36 |
| RJ | 5 | Ruijing, Jiangxi | 115°57′–116°00′ | 25°53′–25°57′ | 209.3–220.9 | 43–161 | 50 | 2.27 | 1.77 | 0.52 | 0.43 | 0.39 | −0.35 | 95.45 |
| WY | 4 | Wuyuan, Jiangxi | 117°27′–118°01′ | 29°05′–29°23′ | 71.8–165.8 | 110–222 | 44 | 2.00 | 1.73 | 0.52 | 0.41 | 0.36 | −0.45 | 77.27 |
| LA | 4 | Le’an, Jiangxi | 115°42′–115°43′ | 27°17′–27°20′ | 97.1–175.7 | 106–149 | 46 | 2.09 | 1.65 | 0.47 | 0.36 | 0.32 | −0.48 | 77.27 |
| AY | 4 | An’yi, Jiangxi | 115°37′ | 28°48′ | 43.8–68.7 | 101–176 | 47 | 2.14 | 1.77 | 0.53 | 0.45 | 0.39 | −0.37 | 86.36 |
| TH | 3 | Taihe, Jiangxi | 114°58′ | 26°48′ | 49.7–50.9 | 129–185 | 44 | 2.00 | 1.76 | 0.50 | 0.42 | 0.34 | −0.46 | 72.73 |
| WA | 5 | Wan’an, Jiangxi | 114°52′ | 26°33′ | 102.2–102.8 | 86–143 | 41 | 2.00 | 1.66 | 0.45 | 0.37 | 0.33 | −0.36 | 77.27 |
| DY | 5 | Da’yu, Jiangxi | 114°26′ | 25°26′ | 159.9–164.8 | 50–85 | 46 | 2.09 | 1.64 | 0.46 | 0.38 | 0.34 | −0.35 | 86.36 |
| YX | 3 | Yongxiu, Jiangxi | 115°33′–115°35′ | 29°02′–29°03′ | 99.1–119.7 | 108–176 | 39 | 1.77 | 1.56 | 0.42 | 0.33 | 0.27 | −0.56 | 59.09 |
| TG | 3 | Tonggu, Jiangxi | 114°20′–114°28′ | 28°31′–28°37′ | 215.6–270.2 | 108–336 | 44 | 2.00 | 1.79 | 0.44 | 0.46 | 0.38 | −0.16 | 77.27 |
| AF | 4 | An’fu, Jiangxi | 114°40′–114°41′ | 27°22′–27°23′ | 77.1–87.6 | 191–312 | 45 | 2.05 | 1.71 | 0.45 | 0.40 | 0.35 | −0.30 | 72.73 |
| JS | 5 | Jishui, Jiangxi | 115°07′–115°14′ | 27°13′–27°26′ | 41–55.1 | 53–207 | 46 | 2.09 | 1.88 | 0.53 | 0.44 | 0.40 | −0.32 | 81.82 |
| XG | 5 | Xin’gan, Jiangxi | 115°27′–115°28′ | 27°48′–27°50′ | 45.9–62.1 | 100–171 | 39 | 1.82 | 1.62 | 0.31 | 0.34 | 0.30 | −0.02 | 77.27 |
| SC | 5 | Suichuan, Jiangxi | 114°29′–114°30′ | 26°18′ | 84.5–113.9 | 83–120 | 43 | 1.96 | 1.66 | 0.30 | 0.37 | 0.33 | 0.10 | 68.18 |
| XS | 5 | Xiangshan, Zhejiang | 121°52′ | 29°22′–29°28′ | 10.4–24.7 | 45–500 | 43 | 1.96 | 1.67 | 0.42 | 0.37 | 0.33 | −0.27 | 63.64 |
| Group II | 94 | |||||||||||||
| AQ | 5 | An’qing, Anhui | 117°00′–117°01′ | 30°30′–30°31′ | 26.5–52.1 | 105–165 | 42 | 1.86 | 1.67 | 0.34 | 0.36 | 0.32 | −0.06 | 81.82 |
| HA | 5 | Hong’an, Hubei | 114°38′–114°42′ | 31°20′–31°29′ | 217.7–355.6 | 42–50 | 45 | 2.05 | 1.77 | 0.38 | 0.42 | 0.38 | −0.02 | 81.82 |
| CB | 5 | Chibi, Hubei | 113°49′–114°04′ | 29°42′–29°47′ | 22.3–70.2 | 51–113 | 48 | 2.18 | 1.77 | 0.39 | 0.40 | 0.36 | −0.08 | 81.82 |
| PT | 5 | Putian, Fujian | 118°34′–118°56′ | 25°19′–25°42′ | 118.4–494.3 | 100–400 | 45 | 2.05 | 1.61 | 0.38 | 0.35 | 0.32 | −0.20 | 81.82 |
| PC | 5 | Pucheng, Fujian | 118°31′–118°32 | 27°55′ | 219.1–324.4 | 36–96 | 47 | 2.14 | 1.79 | 0.44 | 0.42 | 0.38 | −0.15 | 72.73 |
| WYS | 4 | Wuyishan, Fujian | 118°01′ | 27°44′ | 195.2–252.3 | 53–90 | 44 | 2.00 | 1.77 | 0.43 | 0.43 | 0.36 | −0.21 | 77.27 |
| CA | 4 | Chun’an, Zhejiang | 119°02′ | 29°36′ | 138.4–165.5 | 50–130 | 44 | 2.00 | 1.83 | 0.51 | 0.45 | 0.39 | −0.31 | 77.27 |
| QY | 4 | Qingyuan, Zhejiang | 119°00′–119°05′ | 27°36′–27°37′ | 318.1–409.8 | 100–156 | 45 | 1.96 | 1.69 | 0.49 | 0.38 | 0.33 | −0.47 | 77.27 |
| CS | 5 | Changsha, Hunan | 112°56–113°04′ | 28°12′ | 33.7–102.1 | 42–86 | 43 | 1.96 | 1.69 | 0.44 | 0.41 | 0.34 | −0.30 | 90.91 |
| CZ | 4 | Chenzhou, Hunan | 112°59′ | 25°47′ | 160.8–183.3 | 32–59 | 46 | 2.09 | 1.77 | 0.48 | 0.45 | 0.39 | −0.25 | 68.18 |
| JSYC | 5 | Yancheng, Jiangsu | 120°03′–120°78′ | 33°16′–33°65′ | 1.8–3.5 | 55–74 | 39 | 1.77 | 1.60 | 0.32 | 0.31 | 0.27 | −0.15 | 68.18 |
| LC | 4 | Lechang, Guangdong | 113°21′ | 25°12′–25°13′ | 232.1–246.4 | 65–80 | 43 | 1.96 | 1.64 | 0.39 | 0.37 | 0.33 | −0.18 | 77.27 |
| ZX | 4 | Zixi, Jiangxi | 116°95′ | 27°59′ | 332.8–335.6 | 128–156 | 43 | 1.96 | 1.67 | 0.42 | 0.39 | 0.34 | −0.26 | 63.64 |
| HBYC | 5 | Yichang, Hubei | 111°17′–111°27′ | 30°39′–30°42′ | 76.8–167.6 | 51–81 | 47 | 2.14 | 1.74 | 0.41 | 0.41 | 0.37 | −0.13 | 72.73 |
| SF | 5 | Shuangfeng, Hunan | 112°11′–112°27′ | 27°24′–27°27′ | 90.9–147.9 | 53–143 | 51 | 2.18 | 1.74 | 0.50 | 0.43 | 0.38 | −0.31 | 90.91 |
| HH | 5 | Huaihua, Hunan | 110°10′–110°14′ | 28°00′–28°08′ | 154.6–233.1 | 43–70 | 45 | 2.05 | 1.70 | 0.46 | 0.39 | 0.34 | −0.32 | 77.27 |
| TR | 4 | Tongren, Guizhou | 109°11′–109°15′ | 27°34′–27°44′ | 303.4–546 | 91–210 | 49 | 2.23 | 1.86 | 0.51 | 0.48 | 0.41 | −0.24 | 63.64 |
| DZ | 3 | Daozhen, Guizhou | 107°34′–107°43′ | 28°45′–28°68′ | 682.6–814.3 | 37–53 | 44 | 2.00 | 1.71 | 0.33 | 0.41 | 0.33 | 0.00 | 81.82 |
| YY | 3 | Youyang, Chongqing | 108°51′ | 28°42′–28°43′ | 1263.3–1312.1 | 100–118 | 41 | 1.86 | 1.68 | 0.50 | 0.39 | 0.32 | −0.55 | 72.73 |
| YB | 5 | Yibing, Sichuan | 104°25′–104°36′ | 28°25′–28°40′ | 364.2–552.1 | 55–81 | 43 | 2.00 | 1.66 | 0.43 | 0.36 | 0.32 | −0.31 | 86.36 |
| LZ | 5 | Luzhou, Sichuan | 105°26′ | 28°58′ | 299.7–322.3 | 50–70 | 40 | 1.82 | 1.56 | 0.34 | 0.31 | 0.28 | −0.22 | 72.73 |
| Mean | 4.39 | 44.44 | 2.02 | 1.72 | 0.45 | 0.40 | 0.35 | –0.27 | 77.82 | |||||
| Total | 180 | 61 | 1.72 | 1.72 | 0.45 | 0.44 | 0.44 | −0.27 | 78.05 |
| Locus | ID | Repeat Motif | Forwad Primer (5’-3’) | Reverse Primer (5’-3’) | Product Size (bp) | SSR Position | Tm (°C) |
|---|---|---|---|---|---|---|---|
| CcSSR01 | Cluster37113.0 | (TTGT)5 | TTTCTTCCTCACCACCATTTGAGGG | ACCTTTCATCACCTGCGCTT | 100 | 5’UTR | 59 |
| CcSSR02 | Cluster13185.37887 | (AAAT)5 | AATGCTGTAGGACAAGAATGCCA | ACCTCGCCAACAGGCTTTGT | 129 | Unknown | 59 |
| CcSSR03 | Cluster13185.77998 | (AGAT)5 | TGAGGGTTCTTACTGCAATAGCG | ACAGAAGCCGGATGACGCAG | 219 | 3’UTR | 59 |
| CcSSR04 | Cluster13185.54738 | (ATGA)5 | TCCATTCCACACCAAACGGCT | CCACCACAACATCTCTCCAGCA | 265 | Unknown | 59 |
| CcSSR05 | Cluster13185.83550 | (CAAA)5 | GGTTGCTTGGCACAAAGCCG | TCGCATCTCGAGGGACATCCT | 206 | 5’UTR | 59 |
| CcSSR06 | Cluster13185.81702 | (TGAT)5 | AACTCTGCAGGTGTTTGGCA | TGGGATGAAACGATCGCCGT | 185 | 5’UTR | 59 |
| CcSSR07 | Cluster13185.103252 | (GATA)5 | GCGGAAACAGCAGTGGTCAG | CACGGCTCCGTTGATCCACAT | 204 | Unknown | 59 |
| CcSSR08 | Cluster13185.35657 | (TTTA)5 | TGTGAGGCCATAGTTAGTGCTGGA | ATGTGGGCTGTGGGAACTGT | 185 | Unknown | 59 |
| CcSSR09 | Cluster13185.39671 | (GCAG)5 | TCAATTGAGCGGGCCCTGTG | ATGGACGGCTGATGCAGTGG | 211 | 5’UTR | 59 |
| CcSSR10 | Cluster13185.9921 | (ATTT)5 | TGCTACGACAGCCACAAACCA | AGCCTGCGACCTCATAGTTGC | 147 | Unknown | 59 |
| CcSSR11 | Cluster13185.7689 | (TTGT)5 | TTTCTTCCTCACCACCATTTGAGGG | ACCTTTCATCACCTGCGCTT | 100 | 5’UTR | 59 |
| CcSSR12 | Cluster13185.58363 | (GAAA)5 | TCTCGTGGCTCGACCTGCTA | GTCTCCGCAAAGCTCCCTGG | 300 | 5’UTR | 59 |
| CcSSR13 | Cluster13185.63033 | (GAAA)5 | TGGGACCCACCTACCTTGGG | TGAGCACGGGCCATATCAGC | 182 | 5’UTR | 59 |
| CcSSR14 | Cluster13185.81378 | (TGTT)5 | CCCATCAGGACGCCTTCGAC | TCCGCTTGAATCCCTGCACA | 131 | Unknown | 59 |
| CcSSR15 | Cluster13185.88201 | (GAAA)5 | GCACACTGATGCGCAGATGG | TGTGCGGTCCACTTTGTGAA | 235 | Unknown | 59 |
| CcSSR16 | Cluster13185.48159 | (AAAG)5 | CCGCCCTCCCAAATTCCACA | CGTTTGCACGTACATCTTCGCC | 262 | 5’UTR | 59 |
| CcSSR17 | Cluster13185.34016 | (GAAA)5 | GCACACTGATGCGCAGATGG | TGTGCGGTCCACTTTGTGAA | 235 | 3’UTR | 59 |
| CcSSR18 | Cluster13185.84151 | (TGA)5 | AGTAGGCAGGAGAGGACATGGA | CCATCACCACCAACGTCACCA | 265 | Unknown | 59 |
| CcSSR19 | Cluster13185.84151 | (GAT)5 | CCCTATTGACGACAACGAGGTTGA | AACGCAGGTCATCACCACCA | 139 | Unknown | 59 |
| CcSSR20 | Cluster13185.81659 | (CTC)5 | GAATCTCGGCCGTCCGCATC | CCGAGGGCGAGGAGGTAGAA | 172 | 5’UTR | 59 |
| CcSSR21 | Cluster13185.7761 | (TGA)5 | TCTCAAGGGTCGGAAGTGCCT | CAGCCAGGCACCCAACAGAA | 243 | CDS | 59 |
| CcSSR22 | Cluster13185.84662 | (ATC)5 | TCTGCAACACAAAGCGAATTCCA | ACCCGGGTTAACCAAACACATGA | 149 | Unknown | 59 |
| Locus | Na | Ne | Ho | He | GD | PIC | FST | Nm | F | PHWE a |
|---|---|---|---|---|---|---|---|---|---|---|
| CcSSR1 | 3 | 2.35 | 0.49 | 0.58 | 0.57 | 0.55 | 0.15 | 1.49 | −0.03 | 0.004 ** |
| CcSSR2 | 2 | 1.09 | 0.08 | 0.08 | 0.08 | 0.11 | 0.16 | 1.22 | −0.22 | 0.598 NS |
| CcSSR3 | 4 | 3.60 | 0.68 | 0.72 | 0.72 | 0.72 | 0.16 | 1.35 | −0.11 | 0.000 *** |
| CcSSR4 | 3 | 1.41 | 0.25 | 0.29 | 0.29 | 0.33 | 0.28 | 0.62 | −0.16 | 0.100 *** |
| CcSSR5 | 3 | 2.09 | 0.86 | 0.52 | 0.52 | 0.50 | 0.11 | 2.00 | −0.80 | 0.000 *** |
| CcSSR6 | 3 | 1.41 | 0.17 | 0.29 | 0.29 | 0.29 | 0.42 | 0.36 | 0.02 | 0.000 *** |
| CcSSR7 | 2 | 1.78 | 0.10 | 0.44 | 0.44 | 0.41 | 0.58 | 0.19 | 0.47 | 0.000 *** |
| CcSSR8 | 3 | 1.66 | 0.14 | 0.40 | 0.40 | 0.42 | 0.25 | 0.72 | 0.44 | 0.000 *** |
| CcSSR9 | 2 | 1.99 | 0.44 | 0.50 | 0.50 | 0.45 | 0.16 | 1.28 | −0.07 | 0.127 NS |
| CcSSR10 | 2 | 1.62 | 0.14 | 0.38 | 0.38 | 0.39 | 0.41 | 0.37 | 0.24 | 0.000 *** |
| CcSSR11 | 3 | 2.74 | 0.51 | 0.64 | 0.64 | 0.62 | 0.29 | 0.59 | −0.18 | 0.002 ** |
| CcSSR12 | 3 | 2.24 | 0.50 | 0.56 | 0.55 | 0.55 | 0.35 | 0.45 | −0.28 | 0.000 *** |
| CcSSR13 | 4 | 1.64 | 0.36 | 0.39 | 0.39 | 0.48 | 0.19 | 1.12 | −0.12 | 0.000 *** |
| CcSSR14 | 3 | 2.21 | 0.74 | 0.55 | 0.55 | 0.51 | 0.11 | 2.11 | −0.50 | 0.000 *** |
| CcSSR15 | 3 | 1.45 | 0.30 | 0.31 | 0.31 | 0.40 | 0.19 | 1.06 | −0.14 | 0.000 *** |
| CcSSR16 | 2 | 1.42 | 0.23 | 0.30 | 0.30 | 0.36 | 0.20 | 1.04 | 0.04 | 0.004 * |
| CcSSR17 | 3 | 2.11 | 0.73 | 0.53 | 0.53 | 0.49 | 0.12 | 1.95 | −0.57 | 0.000 *** |
| CcSSR18 | 3 | 2.63 | 0.94 | 0.62 | 0.62 | 0.57 | 0.10 | 2.20 | −0.69 | 0.000 *** |
| CcSSR19 | 3 | 2.18 | 0.85 | 0.54 | 0.54 | 0.48 | 0.09 | 2.35 | −0.75 | 0.000 *** |
| CcSSR20 | 2 | 1.99 | 0.58 | 0.50 | 0.50 | 0.42 | 0.13 | 1.60 | −0.28 | 0.042 NS |
| CcSSR21 | 3 | 1.27 | 0.24 | 0.22 | 0.21 | 0.25 | 0.19 | 1.03 | −0.29 | 0.415 NS |
| CcSSR22 | 2 | 1.68 | 0.52 | 0.41 | 0.41 | 0.36 | 0.17 | 1.22 | −0.45 | 0.000 *** |
| Mean | 2.77 | 1.93 | 0.45 | 0.44 | 0.44 | 0.44 | 0.22 | 1.20 | −0.41 |
| Source | d.f. | Sum of Square | Mean of Square | Variance Components | Percentage of Variation | FIS |
|---|---|---|---|---|---|---|
| Among populations within groups | 40 | 802.700 | 20.068 | 2.191 | 17% | −0.207 *** |
| Within populations | 139 | 1453.433 | 10.456 | 10.456 | 83% | |
| Total | 179 | 2256.133 | 12.647 | 100% |
© 2019 by the authors. Licensee MDPI, Basel, Switzerland. This article is an open access article distributed under the terms and conditions of the Creative Commons Attribution (CC BY) license (http://creativecommons.org/licenses/by/4.0/).
Share and Cite
Zhong, Y.; Yang, A.; Li, Z.; Zhang, H.; Liu, L.; Wu, Z.; Li, Y.; Liu, T.; Xu, M.; Yu, F. Genetic Diversity and Population Genetic Structure of Cinnamomum camphora in South China Revealed by EST-SSR Markers. Forests 2019, 10, 1019. https://doi.org/10.3390/f10111019
Zhong Y, Yang A, Li Z, Zhang H, Liu L, Wu Z, Li Y, Liu T, Xu M, Yu F. Genetic Diversity and Population Genetic Structure of Cinnamomum camphora in South China Revealed by EST-SSR Markers. Forests. 2019; 10(11):1019. https://doi.org/10.3390/f10111019
Chicago/Turabian StyleZhong, Yongda, Aihong Yang, Zhiting Li, Hui Zhang, Lipan Liu, Zhaoxiang Wu, Yanqiang Li, Tengyun Liu, Meng Xu, and Faxin Yu. 2019. "Genetic Diversity and Population Genetic Structure of Cinnamomum camphora in South China Revealed by EST-SSR Markers" Forests 10, no. 11: 1019. https://doi.org/10.3390/f10111019
APA StyleZhong, Y., Yang, A., Li, Z., Zhang, H., Liu, L., Wu, Z., Li, Y., Liu, T., Xu, M., & Yu, F. (2019). Genetic Diversity and Population Genetic Structure of Cinnamomum camphora in South China Revealed by EST-SSR Markers. Forests, 10(11), 1019. https://doi.org/10.3390/f10111019