Shifts in Climate–Growth Relationships of Sky Island Pines


Abstract
:1. Introduction
2. Materials and Methods
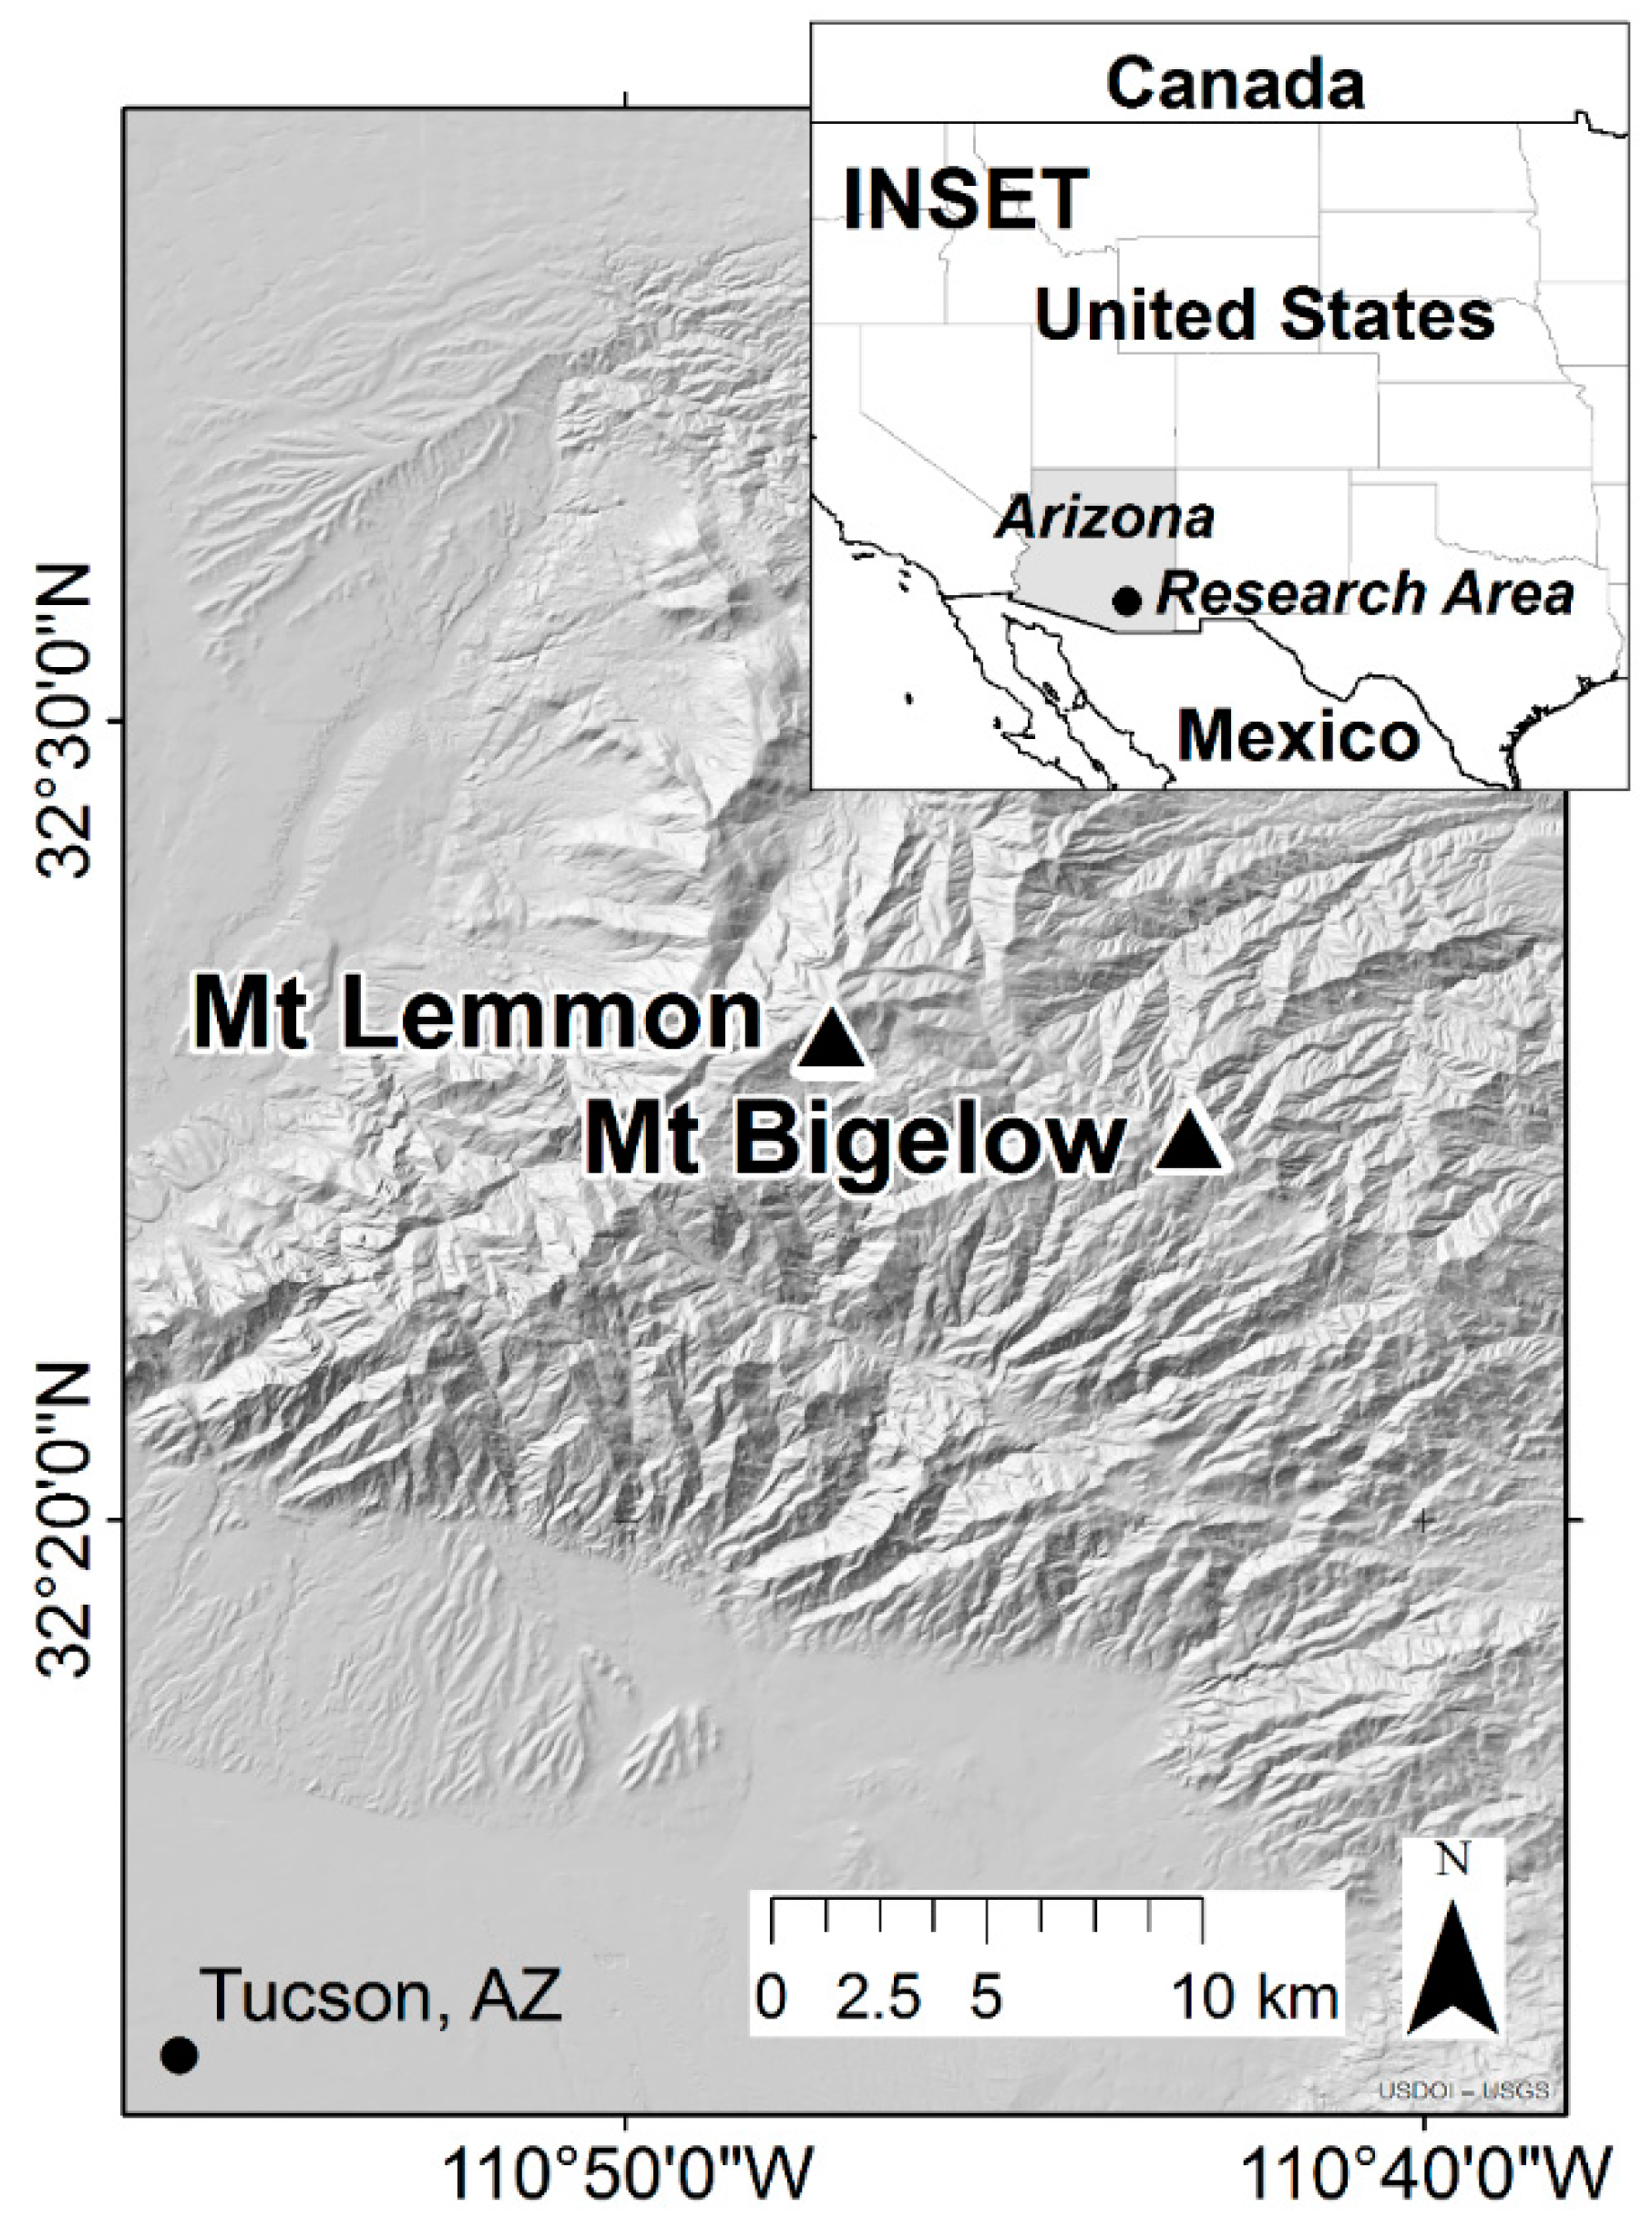
2.1. Study Area
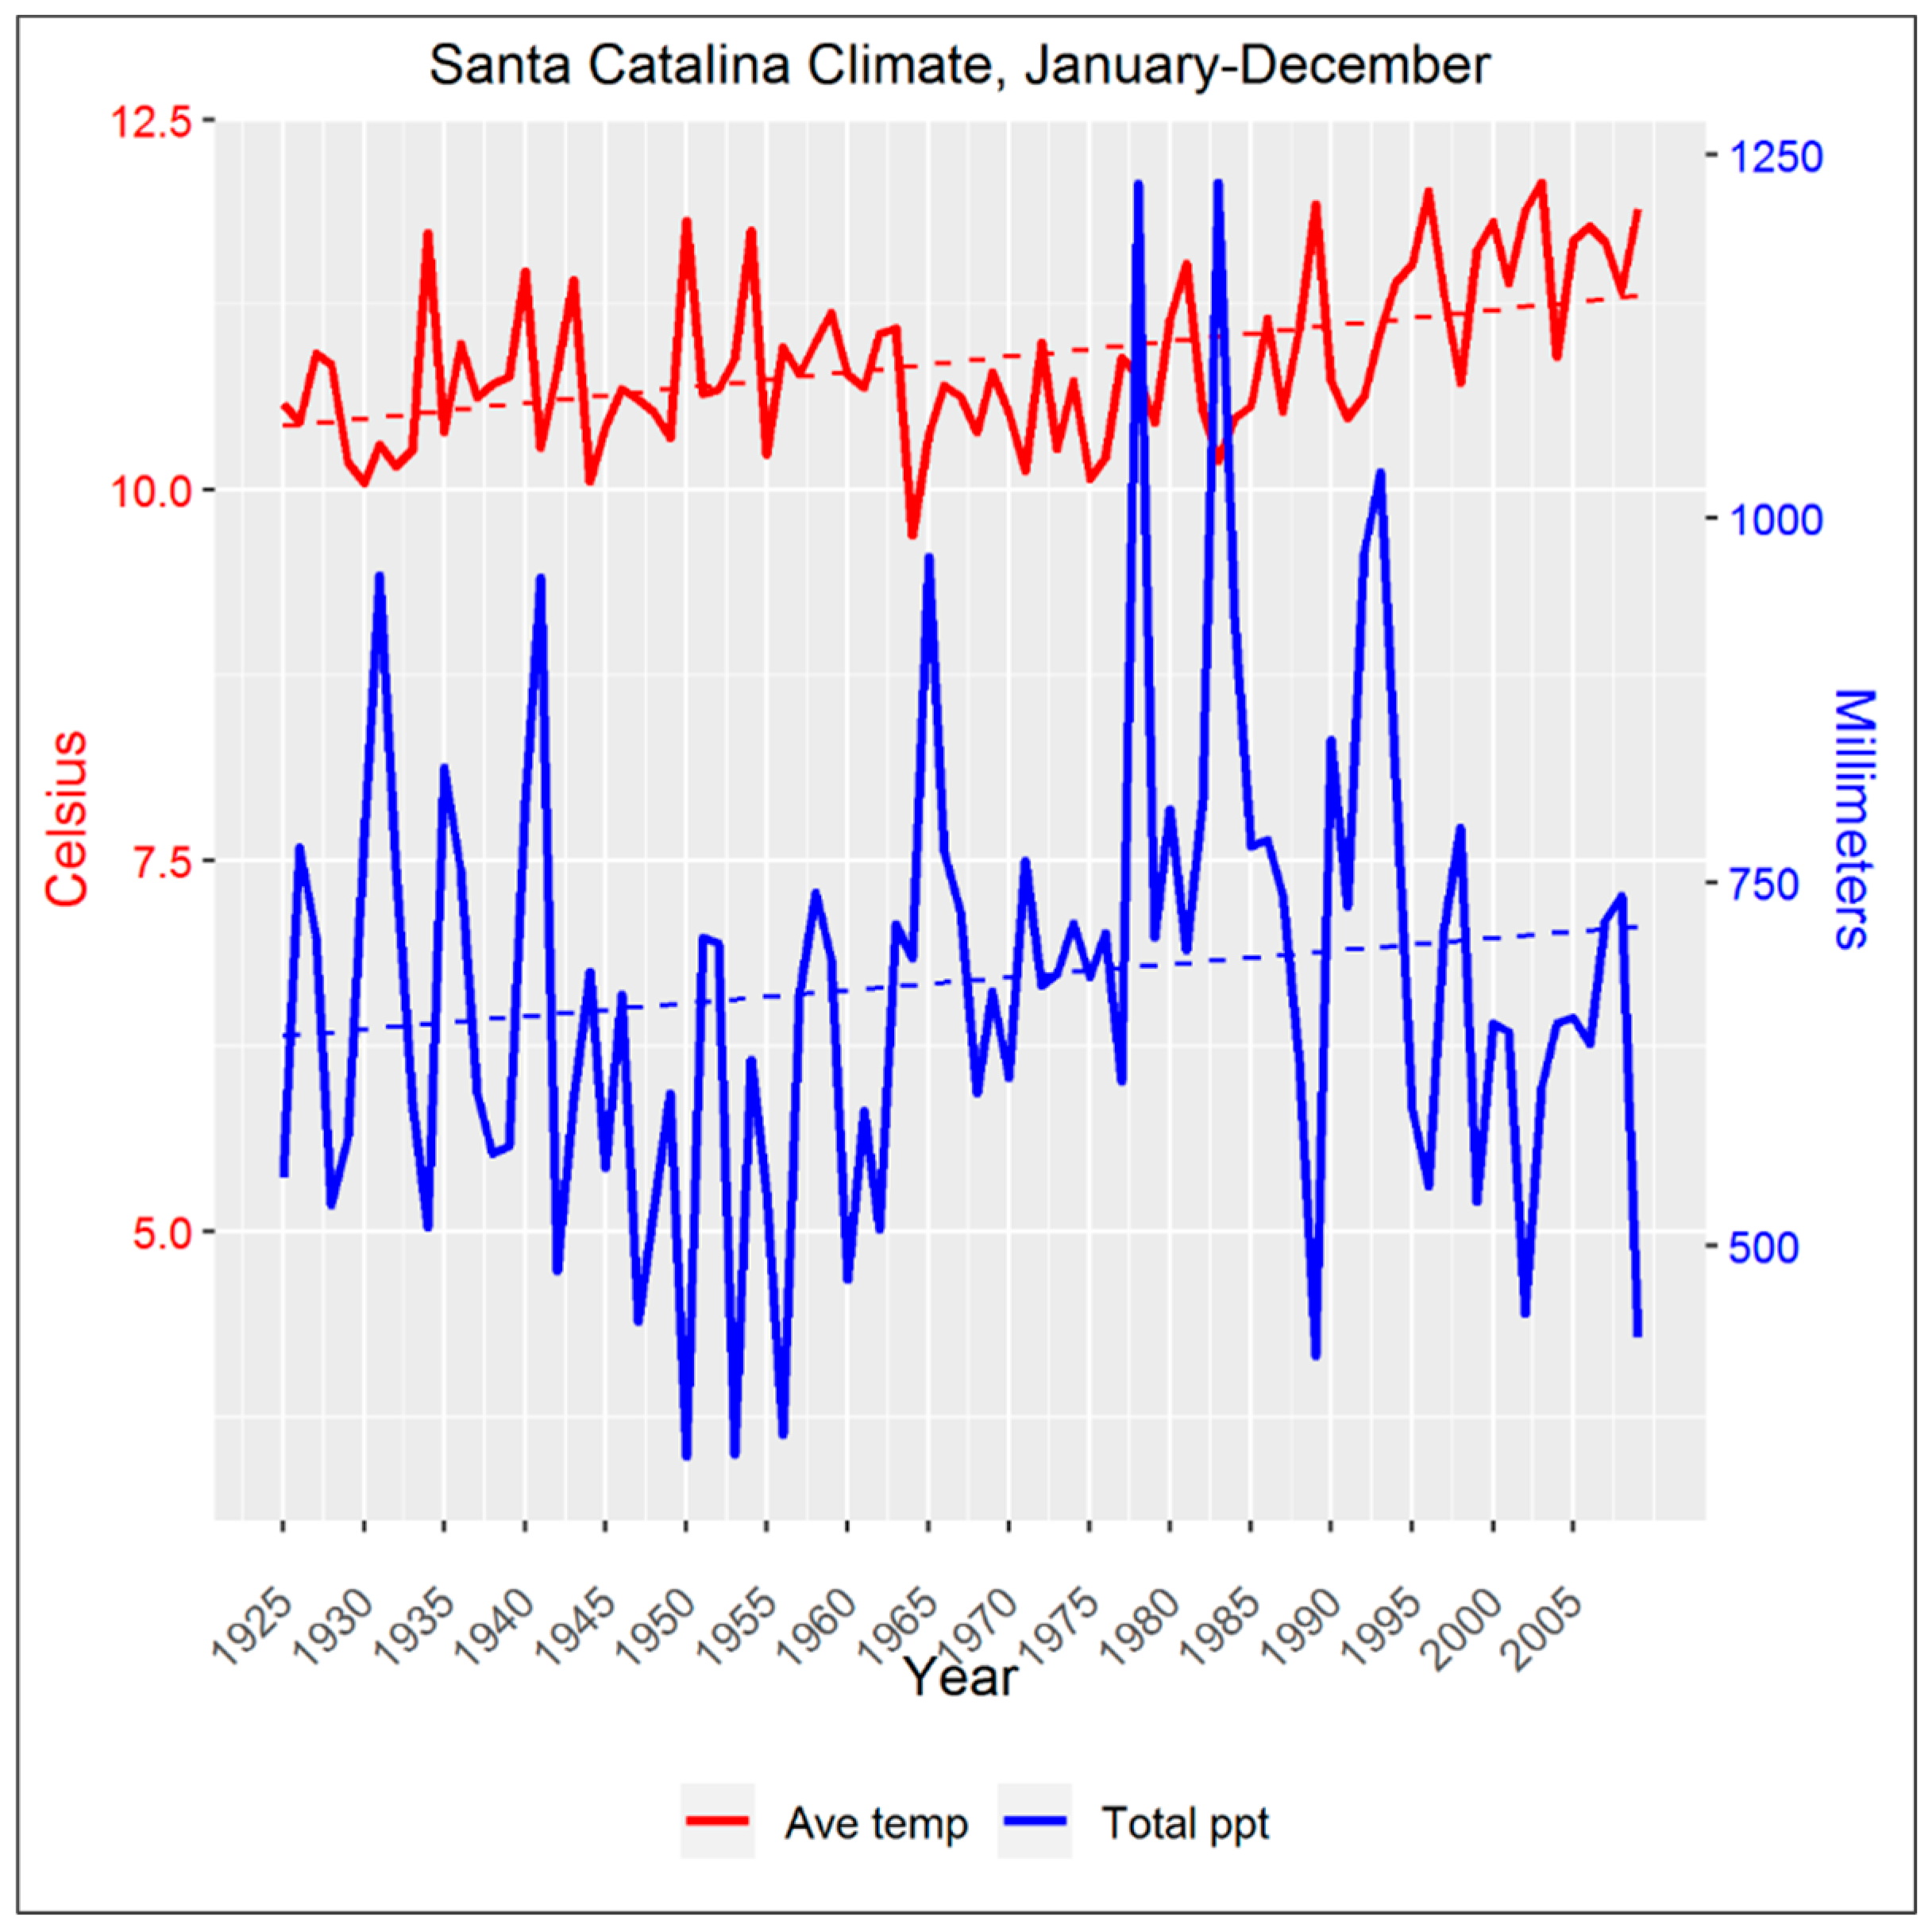
2.2. Climate Data
2.3. Tree Growth Chronologies and Data Archives
2.4. Climate–Growth Relationships
3. Results
3.1. Seasonal Climate–Growth Relationships
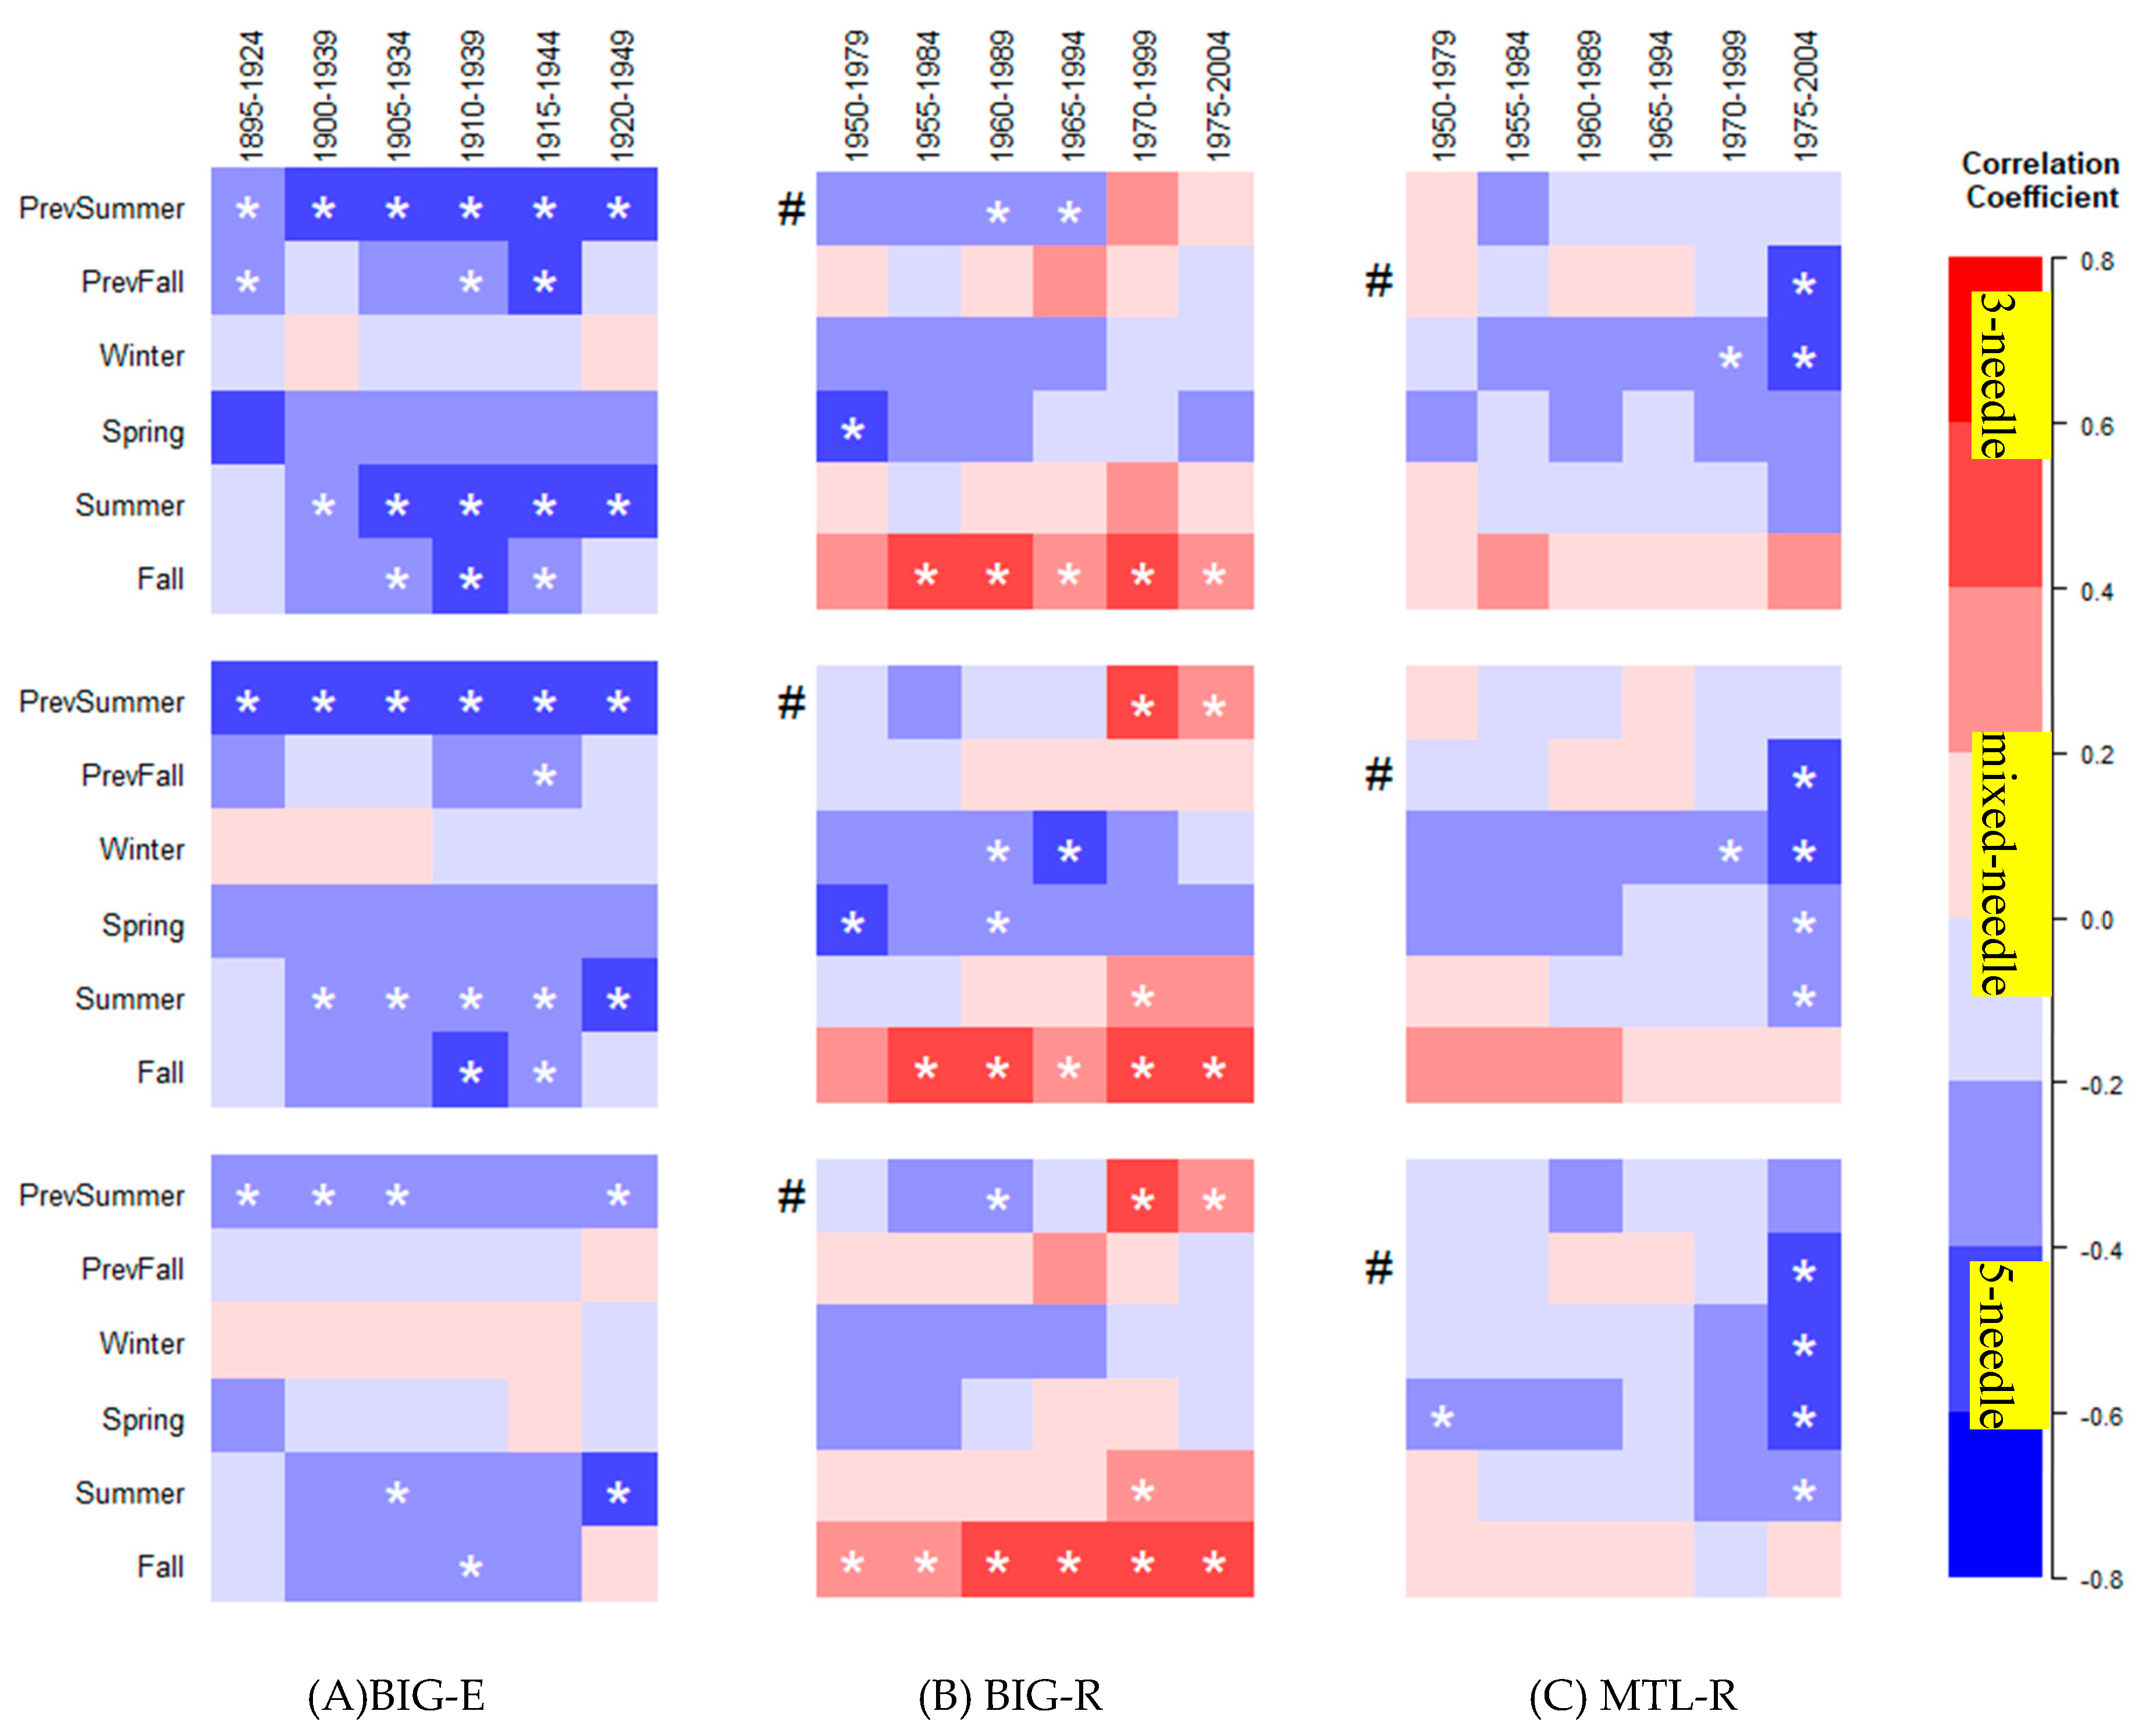
3.2. Temporal Stability of Climate–Growth Relationships
4. Discussion
4.1. Seasonal Climate-Growth Relationships
4.2. Temporal Stability of Climate–Growth Relationships
5. Conclusions
Supplementary Materials
Author Contributions
Funding
Acknowledgments
Conflicts of Interest
Appendix A
Defining Chronology Confidence and EPS Thresholds
References
- Warshall, P. The Madrean sky island archipelago: A planetary overview. In Biodiversity and Management of the Madrean Archipelago: The Sky Islands of Southwestern United States and Northwestern Mexico; DeBano, L.F., Ffolliott, P.F., Ortega-Rubio, A., Gottfried, G.J., Hamre, R.H., Edminster, C.B., Eds.; US Department of Agriculture: Fort Collins, CO, USA, 1995; pp. 6–18. [CrossRef]
- Jump, A.S.; Hunt, J.M.; Penuelas, J. Rapid climate change-related growth decline at the southern range edge of Fagus sylvatica. Glob. Chang. Biol. 2006, 12, 2163–2174. [Google Scholar] [CrossRef]
- Tegel, W.; Seim, A.; Hakelberg, D.; Hoffmann, S.; Panev, M.; Westphal, T.; Büntgen, U. A recent growth increase of European beech (Fagus sylvatica L.) at its Mediterranean distribution limit contradicts drought stress. Eur. J. Forest Res. 2014, 133, 61–71. [Google Scholar] [CrossRef]
- USGCRP. Climate Science Special Report: Fourth National Climate Assessment; Wuebbles, D.J., Fahey, D.W., Hibbard, K.A., Dokken, D.J., Stewart, B.C., Maycock, T.K., Eds.; U.S. Global Change Research Program: Washington, DC, USA, 2017; Volume 1, p. 470. [CrossRef]
- Rehfeldt, G.E. Systematics and genetic structure of Ponderosae taxa (Pinaceae) inhabiting the Mountain Islands of the Southwest. Am. J. Bot. 1999, 86, 741–752. [Google Scholar] [CrossRef] [PubMed]
- Epperson, B.K.; Telewski, F.W.; Willyard, A. Chloroplast diversity in a putative hybrid swarm of Ponderosae (Pinaceae). Am. J. Bot. 2009, 96, 707–712. [Google Scholar] [CrossRef] [PubMed]
- Willyard, A.; Gernandt, D.S.; Potter, K.; Hipkins, V.; Marquardt, P.; Mahalovich, M.F.; Langer, S.K.; Telewski, F.W.; Cooper, B.; Douglas, C.; et al. Pinus ponderosa: A checkered past obscured four species. Am. J. Bot. 2017, 104, 161–181. [Google Scholar] [CrossRef] [PubMed]
- Rehfeldt, G.E. Early selection in Pinus ponderosa: Compromises between growth potential and growth rhythm in developing breeding strategies. Forest Sci. 1992, 38, 661–677. [Google Scholar] [CrossRef]
- Epperson, B.K.; Telewski, F.W.; Plovanich-Jones, A.E.; Grimes, J.E. Clinal differentiation and putative hybridization in a contact zone of Pinus ponderosa and P. arizonica (Pinaceae). Am. J. Bot. 2001, 88, 1052–1057. [Google Scholar] [CrossRef] [PubMed]
- Dodge, R.A. Investigations into the Ecological Relationships of Ponderosa Pine in Southeast Arizona. Ph.D. Thesis, University of Arizona, Tucson, AZ, USA, 1963. [Google Scholar]
- Fritts, H.C. Computer programs for tree-ring research. Tree-Ring Bull. 1963, 25, 2–7. [Google Scholar]
- Fritts, H.C. Relationships of ring widths in arid-site conifers to variations in monthly temperature and precipitation. Ecol. Monogr. 1974, 44, 411–440. [Google Scholar] [CrossRef]
- Marquardt, P.E.; Miranda, B.R.; Jennings, S.; Thurston, G.; Telewski, F.W. Variable climate response differentiates growth of the Sky Island ponderosa pines. Trees 2019, 3, 317–332. [Google Scholar] [CrossRef]
- IPCC. 2007: Climate Change. The physical science basis. In Contribution of Working Group I to the Fourth Assessment Report of the Intergovernmental Panel on Climate Change; Solomon, S., Qin, D., Manning, M., Chen, Z., Marquis, M., Averyt, K.B., Tignor, M., Miller, H.L., Eds.; Cambridge University Press: Cambridge, UK; New York, NY, USA, 2007. [Google Scholar]
- Pascale, S.; Boos, W.R.; Bordoni, S.; Delworth, T.L.; Kapnick, S.B.; Murakami, H.; Vecchi, G.A.; Zhang, W. Weakening of the North American monsoon with global warming. Nat. Clim. Chang. 2017, 7, 806–812. [Google Scholar] [CrossRef]
- McKenney, D.W.; Hutchinson, M.F.; Papadopol, P.; Lawrence, K.; Pedlar, J.; Campbell, K.; Milewska, E.; Hopkinson, R.F.; Price, D.; Owen, T. Customized spatial climate models for North America. Bull. Am. Meteorol. Soc. 2011, 92, 1611–1622. [Google Scholar] [CrossRef]
- Sheppard, P.R.; Comrie, A.C.; Packin, G.D.; Angersbach, K.; Hughes, M.K. The climate of the US Southwest. Clim. Res. 2002, 21, 219–238. [Google Scholar] [CrossRef]
- Hutchinson, M.; Xu, T. Anusplin Version 4.4 User Guide; Australia National University: Canberra, Australia, 2013. [Google Scholar]
- Marquardt, P.E.; Miranda, B.R.; Telewski, F.W. (2018-01-18): NOAA/WDS Paleoclimatology - Mt. Bigelow – PIAZ, PIPO – ITRDB AZ595-596 [Study 23650-23651]; Mt. Lemmon – PIAZ, PIPO – ITRDB AZ597-598 [Study 23652-23653]. NOAA National Centers for Environmental Information. Available online: https://www.ncdc.noaa.gov/paleo/study/xxxxx (accessed on 1 October 2018).
- Cook, E.R. ATime Series Analysis Approach to Tree Ring Standardization. Ph.D. Thesis, University of Arizona, Tucson, AZ, USA, 1985. [Google Scholar]
- Bunn, A.G. A dendrochronology program library in R (dplR). Dendrochronologia 2008, 26, 115–124. [Google Scholar] [CrossRef]
- Bunn, A.G. Statistical and visual crossdating in R using the dplR library. Dendrochronologia 2010, 28, 251–258. [Google Scholar] [CrossRef]
- R Core Team. R: A Language and Environment for Statistical Computing; R Foundation for Statistical Computing: Vienna, Austria, 2016; Available online: https://www.R-project.org/ (accessed on 1 October 2018).
- Peloquin, R.L. The identification of three-species hybrids in the ponderosa pine complex. Southwest. Nat. 1984, 29, 115–122. [Google Scholar] [CrossRef]
- Rehfeldt, G.E. Genetic variation in the Ponderosae of the southwest. Am. J. Bot. 1993, 80, 330–343. [Google Scholar] [CrossRef]
- Zang, C.; Biondi, F. Treeclim: An R package for the numerical calibration of proxy-climate relationships. Ecography 2015, 38, 431–436. [Google Scholar] [CrossRef]
- Wei, T.; Simko, V. R Package “Corrplot”: Visualization of a Correlation Matrix (Version 0.84). 2017. Available online: https://github.com/taiyun/corrplot (accessed on 1 October 2018).
- Kienast, F.; Luxmoore, R.J. Tree-ring analysis and conifer growth responses to increased atmospheric CO 2 levels. Oecologia 1988, 76, 487–495. [Google Scholar] [CrossRef] [PubMed]
- Lévesque, M.; Rigling, A.; Bugmann, H.; Weber, P.; Brang, P. Growth response of five co-occurring conifers to drought across a wide climatic gradient in Central Europe. Agri. Forest Meteorol. 2014, 197, 1–12. [Google Scholar] [CrossRef]
- Kilgore, J. Distribution and Ecophysiology of the Ponderosae in the Santa Catalina Mountains of Southern Arizona. Ph.D. Thesis, Michigan State University, East Lansing, MI, USA, 2007. [Google Scholar]
- Norris, J.R.; Jackson, S.T.; Betancourt, J.L. Classification tree and minimum-volume ellipsoid analyses of the distribution of ponderosa pine in the western USA. J. Biogeogr. 2006, 33, 342–360. [Google Scholar] [CrossRef]
- Ziaco, E.; Truettner, C.; Biondi, F.; Bullock, S. Moisture-driven xylogenesis in Pinus ponderosa from a Mojave Desert mountain reveals high phenological plasticity. Plant Cell Environ. 2018, 41, 823–836. [Google Scholar] [CrossRef] [PubMed]
- Palmer, W.C. Meteorological Drought; U.S. Weather Bureau Research Paper No. 45; US Department of Commerce: Washington, DC, USA, 1965; Volume 30, pp. 1–58. [Google Scholar]
- Wilmking, M.; Juday, G.P.; Barber, V.A.; Zald, H.S. Recent climate warming forces contrasting growth responses of white spruce at treeline in Alaska through temperature thresholds. Glob. Chang. Biol. 2004, 10, 1724–1736. [Google Scholar] [CrossRef]
- Briffa, K.; Jones, P. Basic Chronology statistics and assessment. In Methods of Dendrochronology; Cook, E.R., Kairiukstis, L.A., Eds.; Springer Science Business Media B.V: Dordrecht, The Netherlands, 1990; pp. 137–152. ISBN 978-90-481-4060-2. [Google Scholar]
- Fritts, H.C. Tree Rings and Climate; Academic Press Inc.: London, UK, 1976; ISBN 0 12 268450-8. [Google Scholar]
- Wigley, T.M.L.; Briffa, K.R.; Jones, P.D. On the average value of correlated time series, with applications in dendroclimatology and hydrometeorology. J. Clim. Appl. Meteorol. 1984, 23, 201–213. [Google Scholar] [CrossRef]


| Site. | Taxa | Ave (#) | Range | SD | N |
|---|---|---|---|---|---|
| BIG | 3 | 3.1 | 3.0–3.1 | 0.1 | 7 |
| MTL | 3 | 3.1 | 3.0–3.2 | 0.1 | 7 |
| BIG | M | 3.7 | 3.2–4.6 | 0.6 | 6 |
| MTL | M | 3.8 | 3.4–4.6 | 0.5 | 7 |
| BIG | 5 | 4.9 | 4.8–5.0 | 0.1 | 7 |
| MTL | 5 | 4.9 | 4.9–5.0 | 0.0 | 6 |
| Early | Recent | Recent | ||||||||||
|---|---|---|---|---|---|---|---|---|---|---|---|---|
| Taxa | BIG (1891–1949) 2500 m | BIG (1950–2007) 2534 m | MTL (1950–2007) 2577 m | |||||||||
| PrSum | Win | Spr | Sum | PrSum | Win | Spr | Sum | PrSum | Win | Spr | Sum | |
| 3N | - | - | - | 0.32 | - | - | 0.32 | - | - | - | 0.32 | - |
| MN | - | 0.26 | - | 0.29 | - | - | 0.26 | - | - | 0.35 | 0.38 | - |
| 5N | - | 0.21 | - | 0.26 | - | - | 0.24 | - | - | 0.31 | 0.39 | - |
| Three-Needle Type | |||||
| Year | BIG-R | MTL-R | AVE | SD | % DIFF |
| 1961 | 731 | 769 | 750.0 | 026.9 | |
| 1962 | 1000 | 886 | 943.0 | 080.6 | 26 |
| Mixed-Needle Type | |||||
| Year | BIG-R | MTL-R | AVE | SD | % DIFF |
| 1961 | 832 | 673 | 752.5 | 112.4 | |
| 1962 | 967 | 828 | 897.5 | 098.3 | 19 |
| Five-Needle Type | |||||
| Year | BIG-R | MTL-R | AVE | SD | % DIFF |
| 1961 | 716 | 627 | 671.5 | 062.9 | |
| 1962 | 966 | 898 | 932.0 | 048.1 | 41 |
© 2019 by the authors. Licensee MDPI, Basel, Switzerland. This article is an open access article distributed under the terms and conditions of the Creative Commons Attribution (CC BY) license (http://creativecommons.org/licenses/by/4.0/).
Share and Cite
Marquardt, P.E.; Miranda, B.R.; Telewski, F.W. Shifts in Climate–Growth Relationships of Sky Island Pines. Forests 2019, 10, 1011. https://doi.org/10.3390/f10111011
Marquardt PE, Miranda BR, Telewski FW. Shifts in Climate–Growth Relationships of Sky Island Pines. Forests. 2019; 10(11):1011. https://doi.org/10.3390/f10111011
Chicago/Turabian StyleMarquardt, Paula E., Brian R. Miranda, and Frank W. Telewski. 2019. "Shifts in Climate–Growth Relationships of Sky Island Pines" Forests 10, no. 11: 1011. https://doi.org/10.3390/f10111011
APA StyleMarquardt, P. E., Miranda, B. R., & Telewski, F. W. (2019). Shifts in Climate–Growth Relationships of Sky Island Pines. Forests, 10(11), 1011. https://doi.org/10.3390/f10111011