Article

Leaf Abundance Affects Tree Height Estimation Derived from UAV Images

1
National Engineering Research Centre of Geospatial Information Technology, Fuzhou University, Fuzhou 350108, China
2
Key Laboratory of Spatial Data Mining and Information Sharing of Ministry of Education, Fuzhou University, Fuzhou 350108, China
*
Author to whom correspondence should be addressed.
Forests 2019, 10(10), 931; https://doi.org/10.3390/f10100931
Submission received: 23 September 2019 / Revised: 18 October 2019 / Accepted: 18 October 2019 / Published: 22 October 2019
(This article belongs to the Section Forest Inventory, Modeling and Remote Sensing)

Abstract

:
Tree height is an important vegetative structural parameter, and its accurate estimation is of significant ecological and commercial value. We collected UAV images of six tree species distributed throughout a subtropical campus during three periods from March to late May, during which some deciduous trees shed all of their leaves and then regrew, while other evergreen trees kept some of their leaves. The UAV imagery was processed by computer vision and photogrammetric software to generate a three-dimensional dense point cloud. Individual tree height information extracted from the dense photogrammetric point cloud was validated against the manually measured reference data. We found that the number of leaves in the canopy affected tree height estimation, especially for deciduous trees. During leaf-off conditions or the early season, when leaves were absent or sparse, it was difficult to reconstruct the 3D canopy structure fully from the UAV images, thus resulting in the underestimation of tree height; the accuracy improved considerably when there were more leaves. For Terminalia mantaly and Ficus virens, the root mean square errors (RMSEs) of tree height estimation reduced from 2.894 and 1.433 m (leaf-off) to 0.729 and 0.597 m (leaf-on), respectively. We provide direct evidence that leaf-on conditions have a positive effect on tree height measurements derived from UAV photogrammetric point clouds. This finding has important implications for forest monitoring, management, and change detection analysis.

1. Introduction

Tree height is an important vegetative structural parameter and one of the key attributes of forest inventories, and its accurate estimation is critical for many ecological and commercial applications. Previously, digital aerial photographs (including satellite and aerial images) and LiDAR (light detection and ranging) point clouds [1,2,3,4] were the major data sources that were utilized to find this information; recent advancements in unmanned aerial vehicles (UAVs) and sensor technology have provided another remote sensing toolset for obtaining tree height information [5,6,7,8].
Both LiDAR and image sensors can be attached to UAVs to collect required data. Three-dimensional (3D) point cloud can be produced directly from LiDAR sensors or indirectly from overlapping UAV images processed in computer vision structure-from-motion (sfm) and photogrammetry software. Compared to the UAV LiDAR system [9], which is capable of penetrating forest canopy layers and reaching the ground, the UAV camera has the advantage of being more affordable, portable, and easier to deploy.
In recent years, there has been a huge increase in research and applications using UAV images for tree detection, vegetation mapping, monitoring, and forest inventory purposes. Numerous studies have used UAV images to generate point clouds and digital surface models (DSMs) and then extract forest vegetative structure parameters at either the stand or single-tree level using either area-based [10,11] or individual tree-based [12,13] methods. Recent studies have shown that digital aerial photogrammetry performs as well as airborne LiDAR in the derivation of tree or canopy heights [8,14,15,16].
This technique has been applied to various types of vegetation, including urban forests [17], boreal forests [18], temperate deciduous trees [19,20], temperate mixed forests [21,22], coniferous trees [6,14,17,23,24], tropical monoculture plantations [25], palm plantations [26], citrus trees [27], olives [28,29], almonds [30], and even herbaceous and grassy vegetation [31,32]. With the reported ground sample distance (GSD) varying from 1 cm to 20 cm, tree height estimations can achieve root mean square errors (RMSEs) from less than 10 cm to a few meters [33,34].
The researchers in [19] were among the first groups to study the 3D mapping of vegetative phenological dynamics using a computer vision technique on UAV images; they later [20] evaluated optimal altitude, overlap, and weather conditions for forest structure estimation using UAV images; they found that clear lighting and high image overlap (>80%) are conducive to accurate canopy height estimation. Many researchers have discovered or proposed that the indirect measurement of tree height as ground truth always contains some degree of error or uncertainty [6,14,35]. An accurate digital elevation model (DEM) of the bare earth or ground is critical to tree height estimations [4,12]. UAV image acquisition settings and processing parameters, along with forest types and canopy structures, are major factors that influence tree height estimation. Many studies are currently identifying these factors and quantifying their effects on the accuracy of tree height estimation.
In this study, we collected time series UAV images when some trees were in phenological transition from late spring to early summer. These deciduous trees changed from leafless to sparse leaves and full leaves, while some other evergreen trees were fully covered with dense leaves. We demonstrate that tree canopy structure factors, especially foliar amount or volume, can have a great effect on tree height estimation using UAV images. Although it was suspected or implied in some previous studies [19,22,25], to the best of our knowledge, this is the first time that direct evidence has been presented at the individual tree level.

2. Materials and Methods

2.1. Study Area

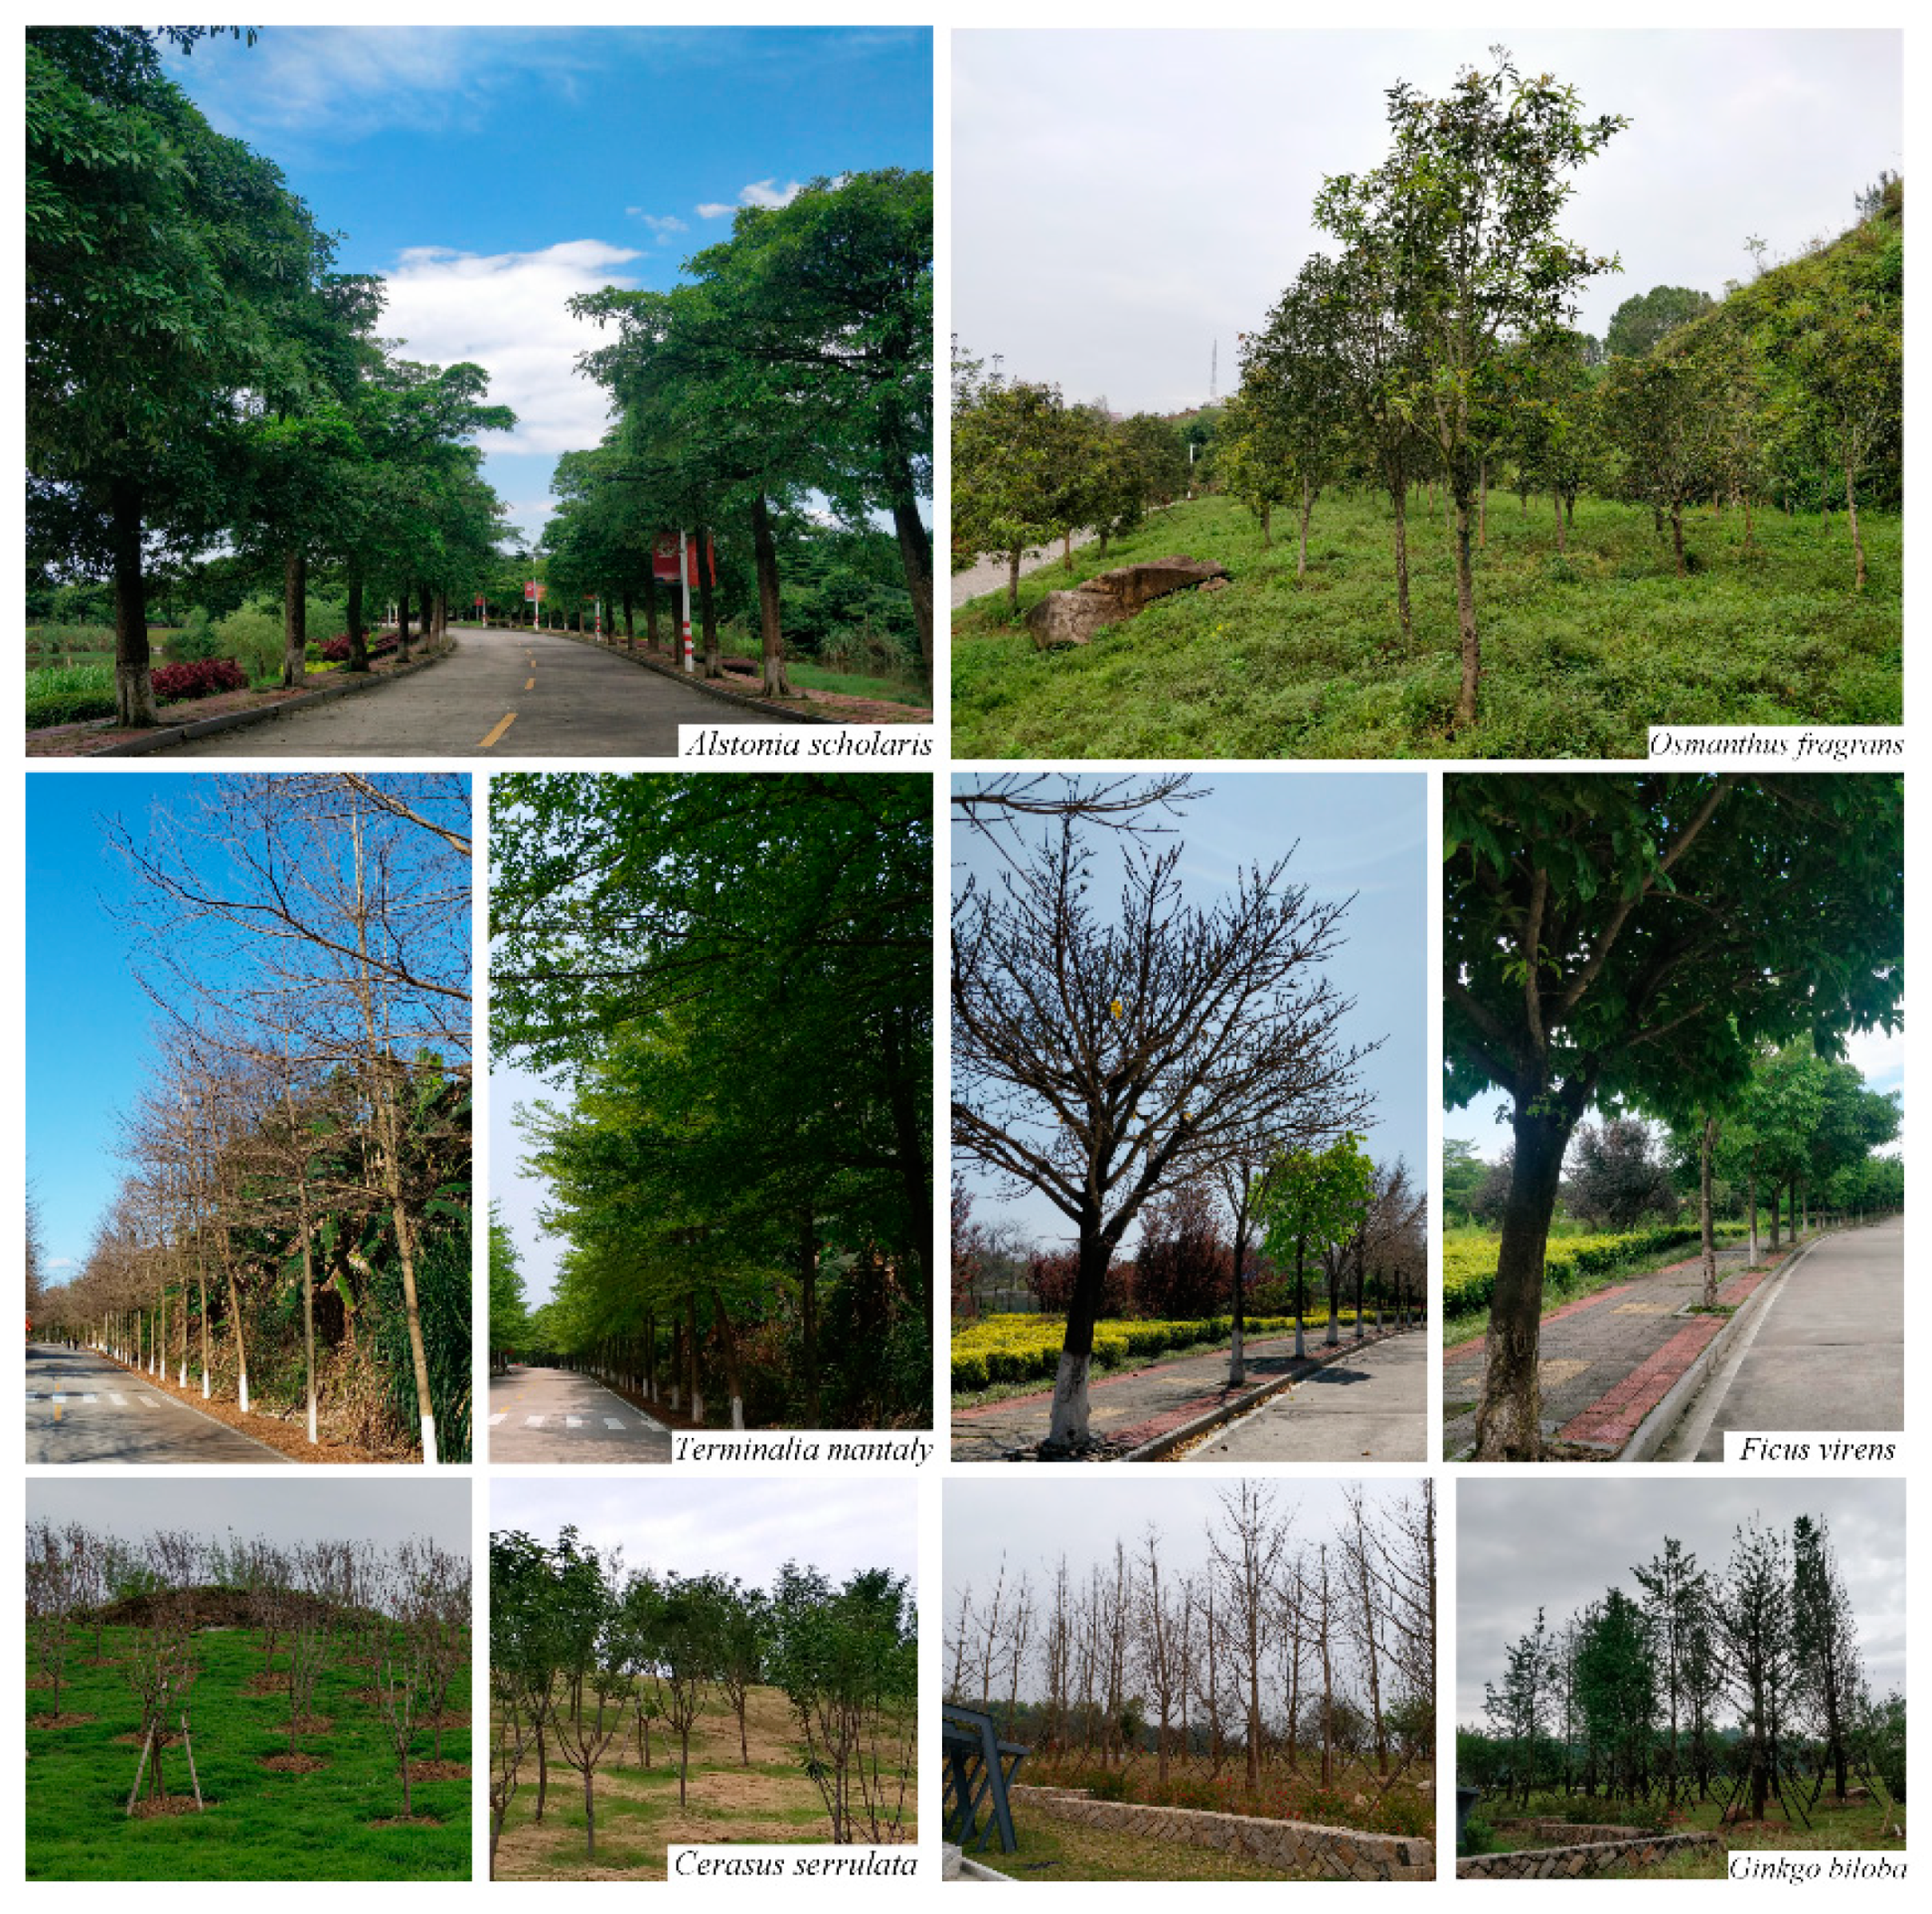
The study area was located in the Qishan Campus of Fuzhou University (119°11’ E, 26°03’ N; Figure 1), China. The region has a mid-subtropical climate, with mostly flat terrain and some gentle slopes. Many tree species are planted on the campus, with the majority being broadleaved. We focused on six tree species, including Dita trees (Alstonia scholaris (L.) R. Br., hereafter abbreviated as AS; this same convention is used for the other species), Umbrella tree (Terminalia mantaly Capuron, TM), Sweet Osmanthus (Osmanthus fragrans (Thunb.) Lour., OF), Cherry (Cerasus serrulata (Lindl.) G. Don ex London, CS), Ginkgo (Ginkgo biloba L., GB), and White fig (Ficus virens Ait. var. sublanceolata (Miq.) Corner, FV). Of these species, AS and OF are evergreen trees, while the other four are deciduous, shedding their leaves in autumn or late spring and regaining their leaves in summer. Figure 2 presents the ground perspective images of these trees. These trees are planted either in rows along traffic routes or in pockets in open areas.

2.2. Field Measurements

UAV images, tree measurement data, and ground control points were collected for this study. From the end of March to early April in 2019, we conducted the 1st tree height and crown diameter measurements of six tree species.
We used an electronic total station (TS) to obtain tree height by first pointing the lenses of the TS to the base of the tree stem and then to the top of the tree. A measuring tape was used to measure the crown diameter, which is the average length of two length measurements across the crown. We estimated that the tree height measurement accuracy was approximately 5 cm, and the crown diameter measurement accuracy was approximately 30 cm. A real-time kinematic global navigation satellite system (GNSS) receiver (i70 from Shanghai Huace Navigation Technology Ltd., Shanghai, China) was used to record the tree stem position and its elevation above the ground. Accuracies within a few centimeters, both horizontally and vertically, can be achieved under favorable conditions when the vegetation canopies do not obstruct the signals. A total of 174 trees were measured. Table 1 summarizes the tree height statistics.
We conducted the 2nd tree height measurement in early June. A subset (56 out of the original 174) of trees was measured again in the field. Table 2 shows the means and standard deviations of the tree height changes for some of the trees re-measured during this period.
We used a consumer-grade quadcopter drone with a built-in effective 20 M pixel camera (DJI Phantom 4 Pro from DJI Technology Co. Ltd., Shenzhen, China) to collect aerial images at multiple dates corresponding to different phenological phases. The missions were planned in Pix4dCapture, a UAV mission planning and control app that is installed on a smartphone or tablet. Missions were planned to generate 2D maps; after drawing the mission area, the ground sampling distance (GSD) and overlap ratios (including front and side overlaps) were specified; the camera viewing angle was set to nadir (pointing to the ground). Then, the planned waypoint information was transmitted wirelessly to the drone’s autopilot, and the drone took off and performed the task; after completing the mission, it landed automatically. Each mission took less than 20 minutes. Multiple drone image acquisition missions were executed from mid-March to late May. The amounts of leaves on those six tree species when we acquired the drone images on March 29, April 17, and May 30 are shown in Table 1. Weather conditions during those missions were usually fine with no or light wind; the GSD was close to 5 cm (the takeoff point of each mission changed slightly sometimes); the overlap was set to be sufficiently high (with a front overlap of 90% and side overlap of 80%). The i70 GNSS receiver was also used to measure the positions of the ground control points (GCPs), which tie the reference coordinate system to the UAV images and products. Tree stem positions and GCPs are all in China Geodetic Coordinate System 2000.

2.3. UAV Image Processing

UAV images from three dates were processed separately in a commercial UAV photogrammetry software Pix4Dmapper version 4.3.31 (Pix4D SA, Lausanne, Switzerland). For a more detailed description of the principle and processing steps of this type of sfm software, the reader can refer to [19,36]. To generate a dense point cloud from overlapping UAV images, we used the following processing parameters in the point cloud densification step: the image scale was half (the default value) with the multiscale option selected; point density was set to be optimal; the minimum number of matches was three.
After the processing of UAV images is finished, in addition to the dense point cloud, the software also generates a quality report. Based on the reports, we found that based on the GCPs, the RMSEs in both the X and Y directions were 0.01–0.07 m, the RMSEs in the Z direction were 0.03–0.12 m, and all values were within three times the value of the GSD. The generated dense points had average densities that varied between 35 and 50 points per square meter. This point dataset provided spatially accurate and sufficiently dense quality point cloud data for further processing and extracting of tree height information.

2.4. Tree Height Extraction and Analysis

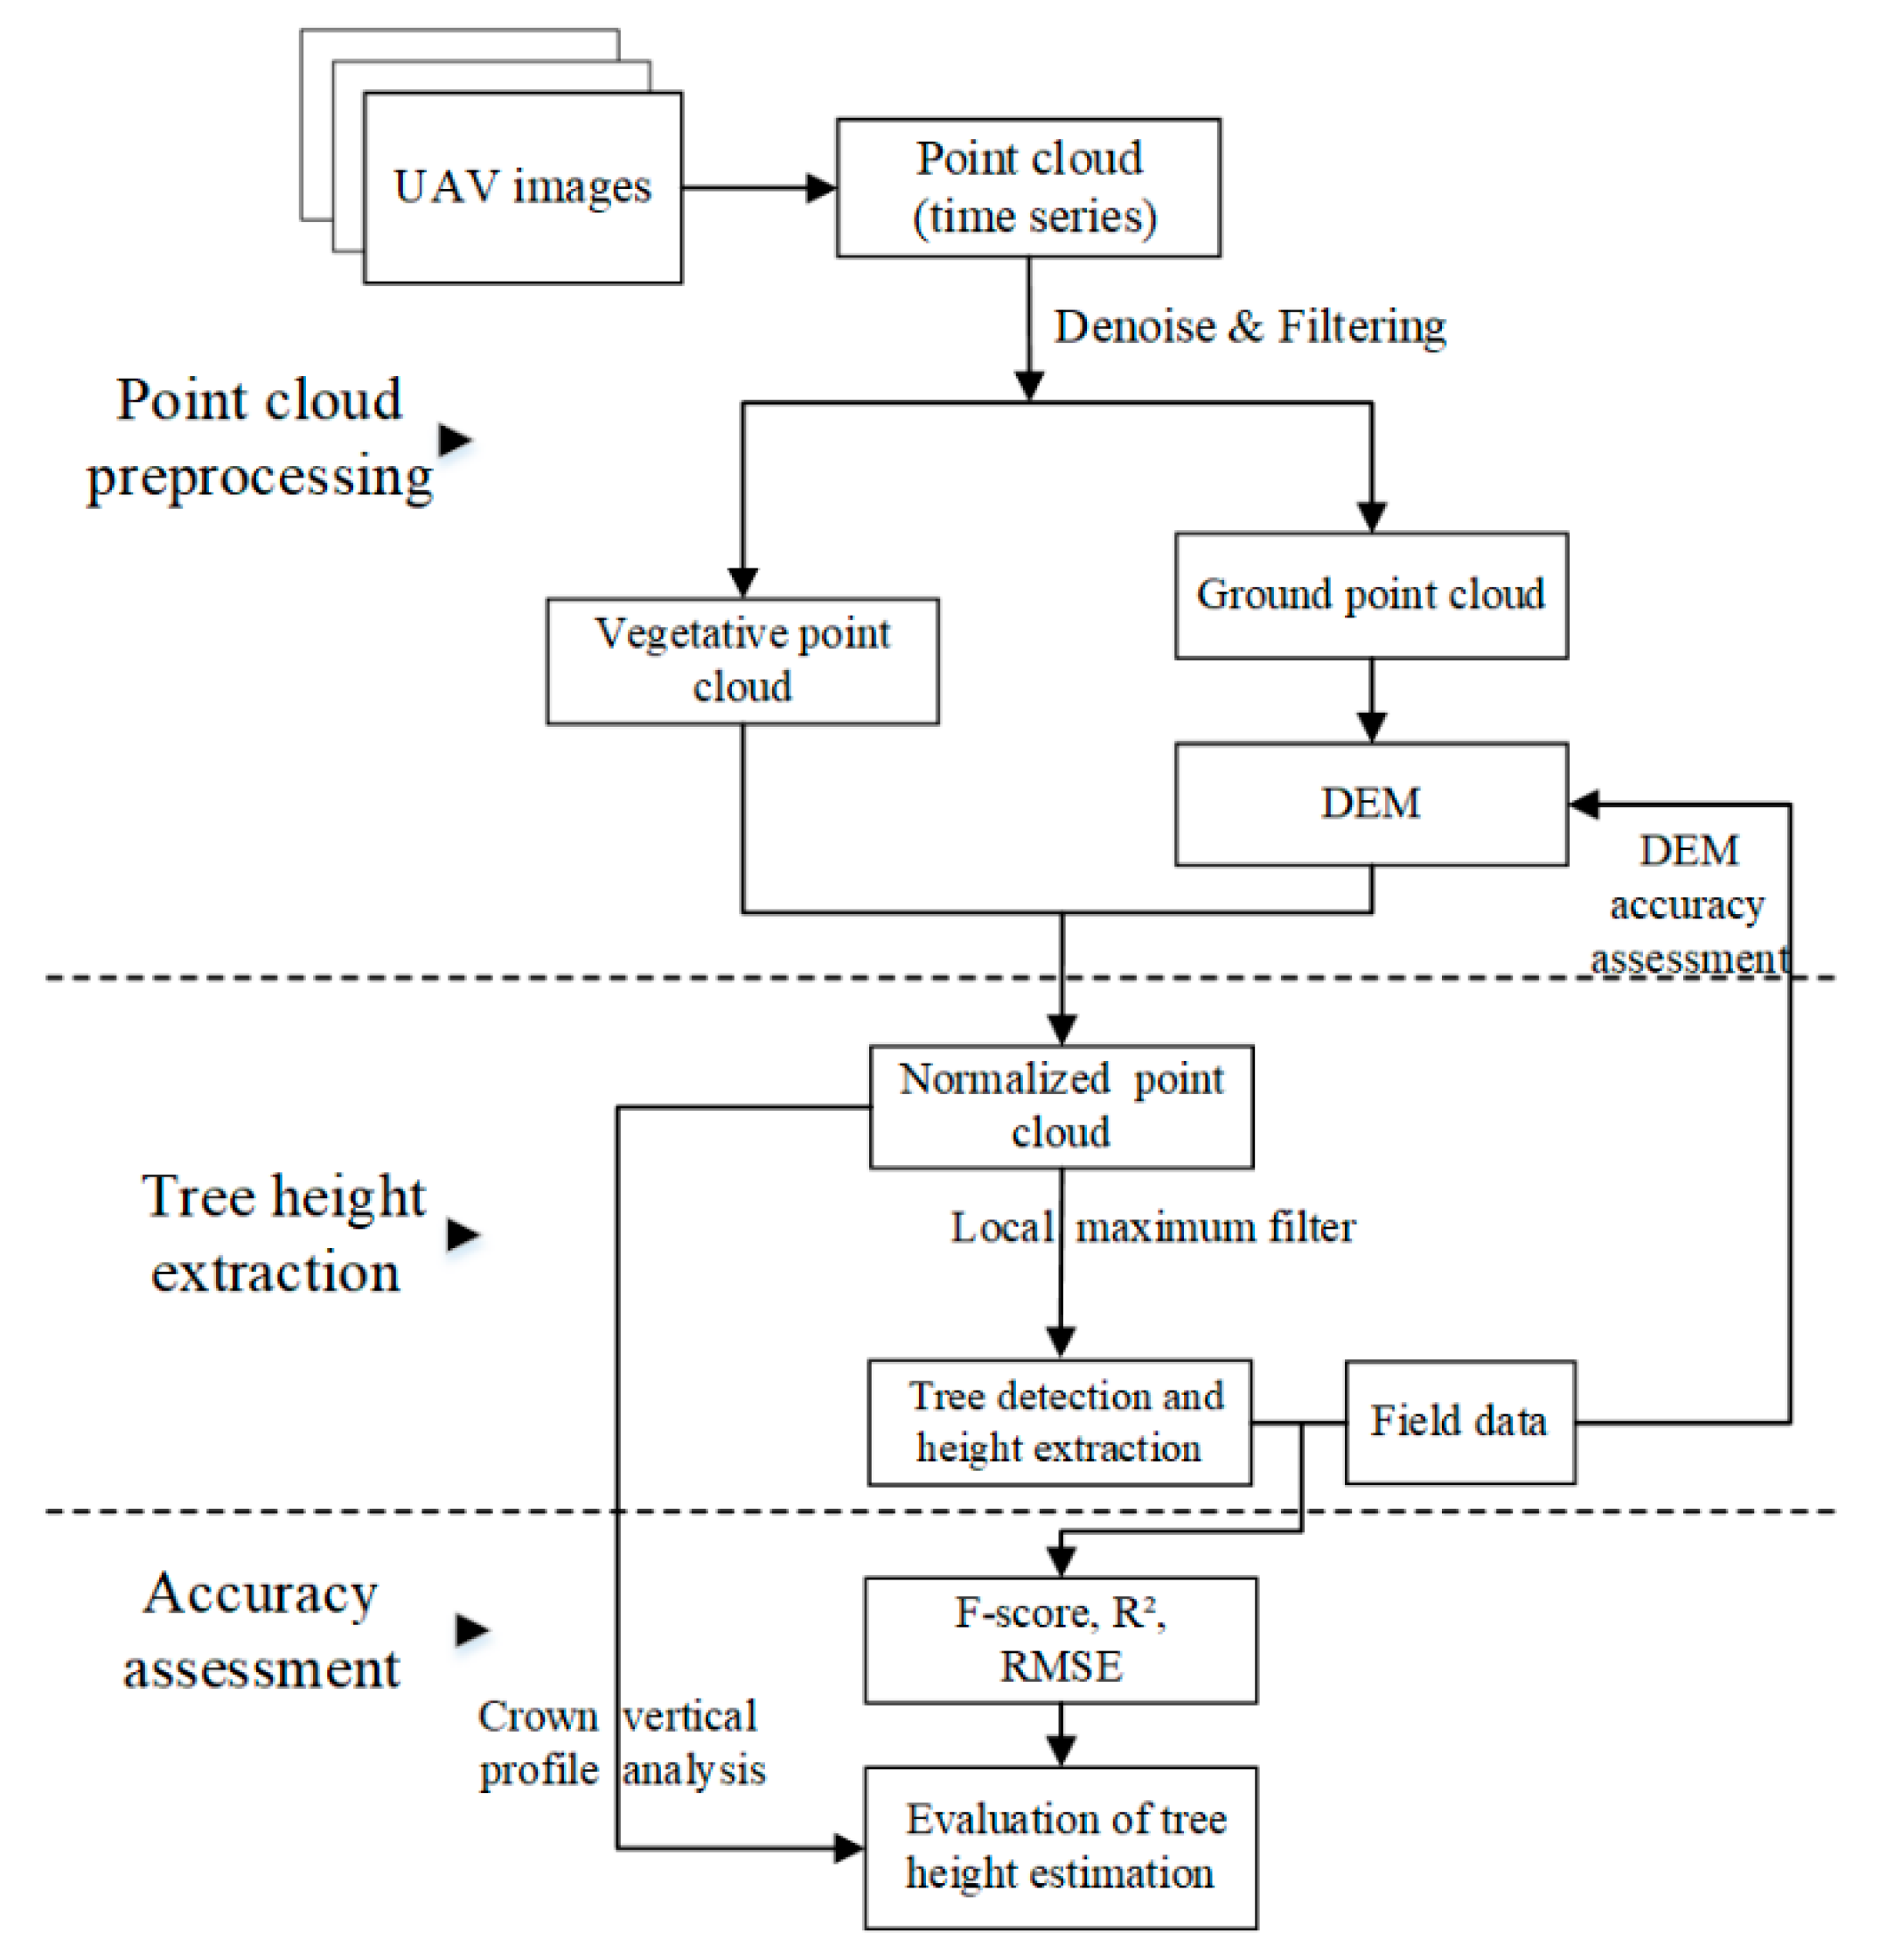
The tree height extraction and analysis approach developed in this study was comprised of three steps: point cloud processing, tree detection and height extraction, and an accuracy assessment for both the DEM and tree height. Figure 3 presents a conceptual workflow of this methodology. To minimize the influence of factors other than the leaf volume change during the phenological periods on the tree height estimation, the UAV image acquisition settings (GSD, image overlap, and weather conditions) and the image processing parameters were set to have the same values. In this section, in the following processing steps, we also keep the parameters in various algorithms the same or comparable for each data set.

2.4.1. Point Cloud Processing

A point cloud was first prepared using the lasnoise function from LAStools [37] to remove the noisy points and outliers in the image matching point cloud. The module looks for and removes or classifies isolated points based on point density in the neighborhood; the noise was removed by setting the "-isolated" parameter to be three in our study. Then, the point was filtered by the cloth simulation filter (CSF) algorithm proposed in [38], and the point cloud was classified into ground points and non-ground vegetative points. From the classified ground points, DEMs with a 20 cm resolution were generated by linear interpolation of the triangulated irregular network (TIN). Finally, the Z value of the point cloud was subtracted from the elevation value of the corresponding DEM to obtain the normalized elevation point cloud, thereby eliminating the influence of the ground fluctuation on the tree height estimation.

2.4.2. Individual Tree Detection and Tree Height Extraction

Both the UAV photogrammetric point cloud and LiDAR point cloud are spatially discrete 3D point sets. Currently, algorithms used for individual tree detection based on LiDAR data [13] have also been applied to UAV image point clouds for tree detection and height estimation. The local maximum filter (lmf) [39], which is implemented in the lidR package in the R software [40], was used in our study. We searched for the treetop in the normalized elevation point cloud with a circular, fixed-sized moving window whose size was slightly larger than the average crown width measured in the field. In addition, the minimum tree height threshold was set according to the minimum of the measured tree height for each species (see Table 3 for these values). If a point was the highest point locally and it was above that threshold, it was marked as a treetop candidate.
All tree tops with positions (X and Y coordinates) and heights (Z coordinate) were extracted and used for further accuracy assessment.

2.4.3. Accuracy Assessment

We evaluated tree detection results first by matching the treetop positions with their corresponding stem positions measured on the ground using the GNSS receiver. The location of each field measurement was taken as a reference, and the position of the treetop extracted by the lmf algorithm was matched with that of the reference tree. If there was only one treetop detected within the boundary defined by the field measurement position within a 2 m radius neighborhood, it was considered to be a correct match and counted as a true positive (TP); if there was no treetop detected, it was called a false negative (FN); if there was more than one treetop detected, it was called a false positive (FP).
We calculated recall (r), precision (p), and F-score (F) using the following equations [41]:
r = T P T P + F N × 100 % ,
p = T P T P + F P × 100 % ,
F = 2 × r × p r + p × 100 % ,
F was a comprehensive index that was used to evaluate the individual tree detection results.
The DEM and tree heights derived from photogrammetric point cloud processing were validated against the field-measured stem ground elevations and tree heights, respectively. ArcMap 10.2 (ESRI Inc., Redlands, CA, USA) was used to extract elevation values from DEM layers. Similar to [6,14], we calculated the RMSE and mean error (ME) to quantify the total error and systematic error, respectively, in the ground elevation and tree height estimations; we also calculated the coefficient of determination (R2) (also called the prediction strength) for the tree height evaluation.

3. Results

3.1. DEM Accuracy

The DEMs of the A. scholaris, T. mantaly, and F. virens plots were used for accuracy evaluation because the precision of the ground elevation measurement using the GNSS receiver was higher (within a few centimeters) at those sites than at other sites, where the canopy cover interfered with or obstructed the GNSS signal and a fixed solution was unavailable. From the computed ME values in Table 4, the ground was systematically overestimated by approximately 10–20 cm; based on the RMSE, the total error of the DEM was consistently approximately 20 to 35 cm. Because the terrains of the study sites for these tree species are mostly flat and gentle and a certain amount of the ground is visible, it is reasonable that some small errors were introduced during the interpolation when the DEM was generated from the processed point cloud and again when the elevation value was extracted from the DEM for comparison.

3.2. Tree Point Distribution Time Series

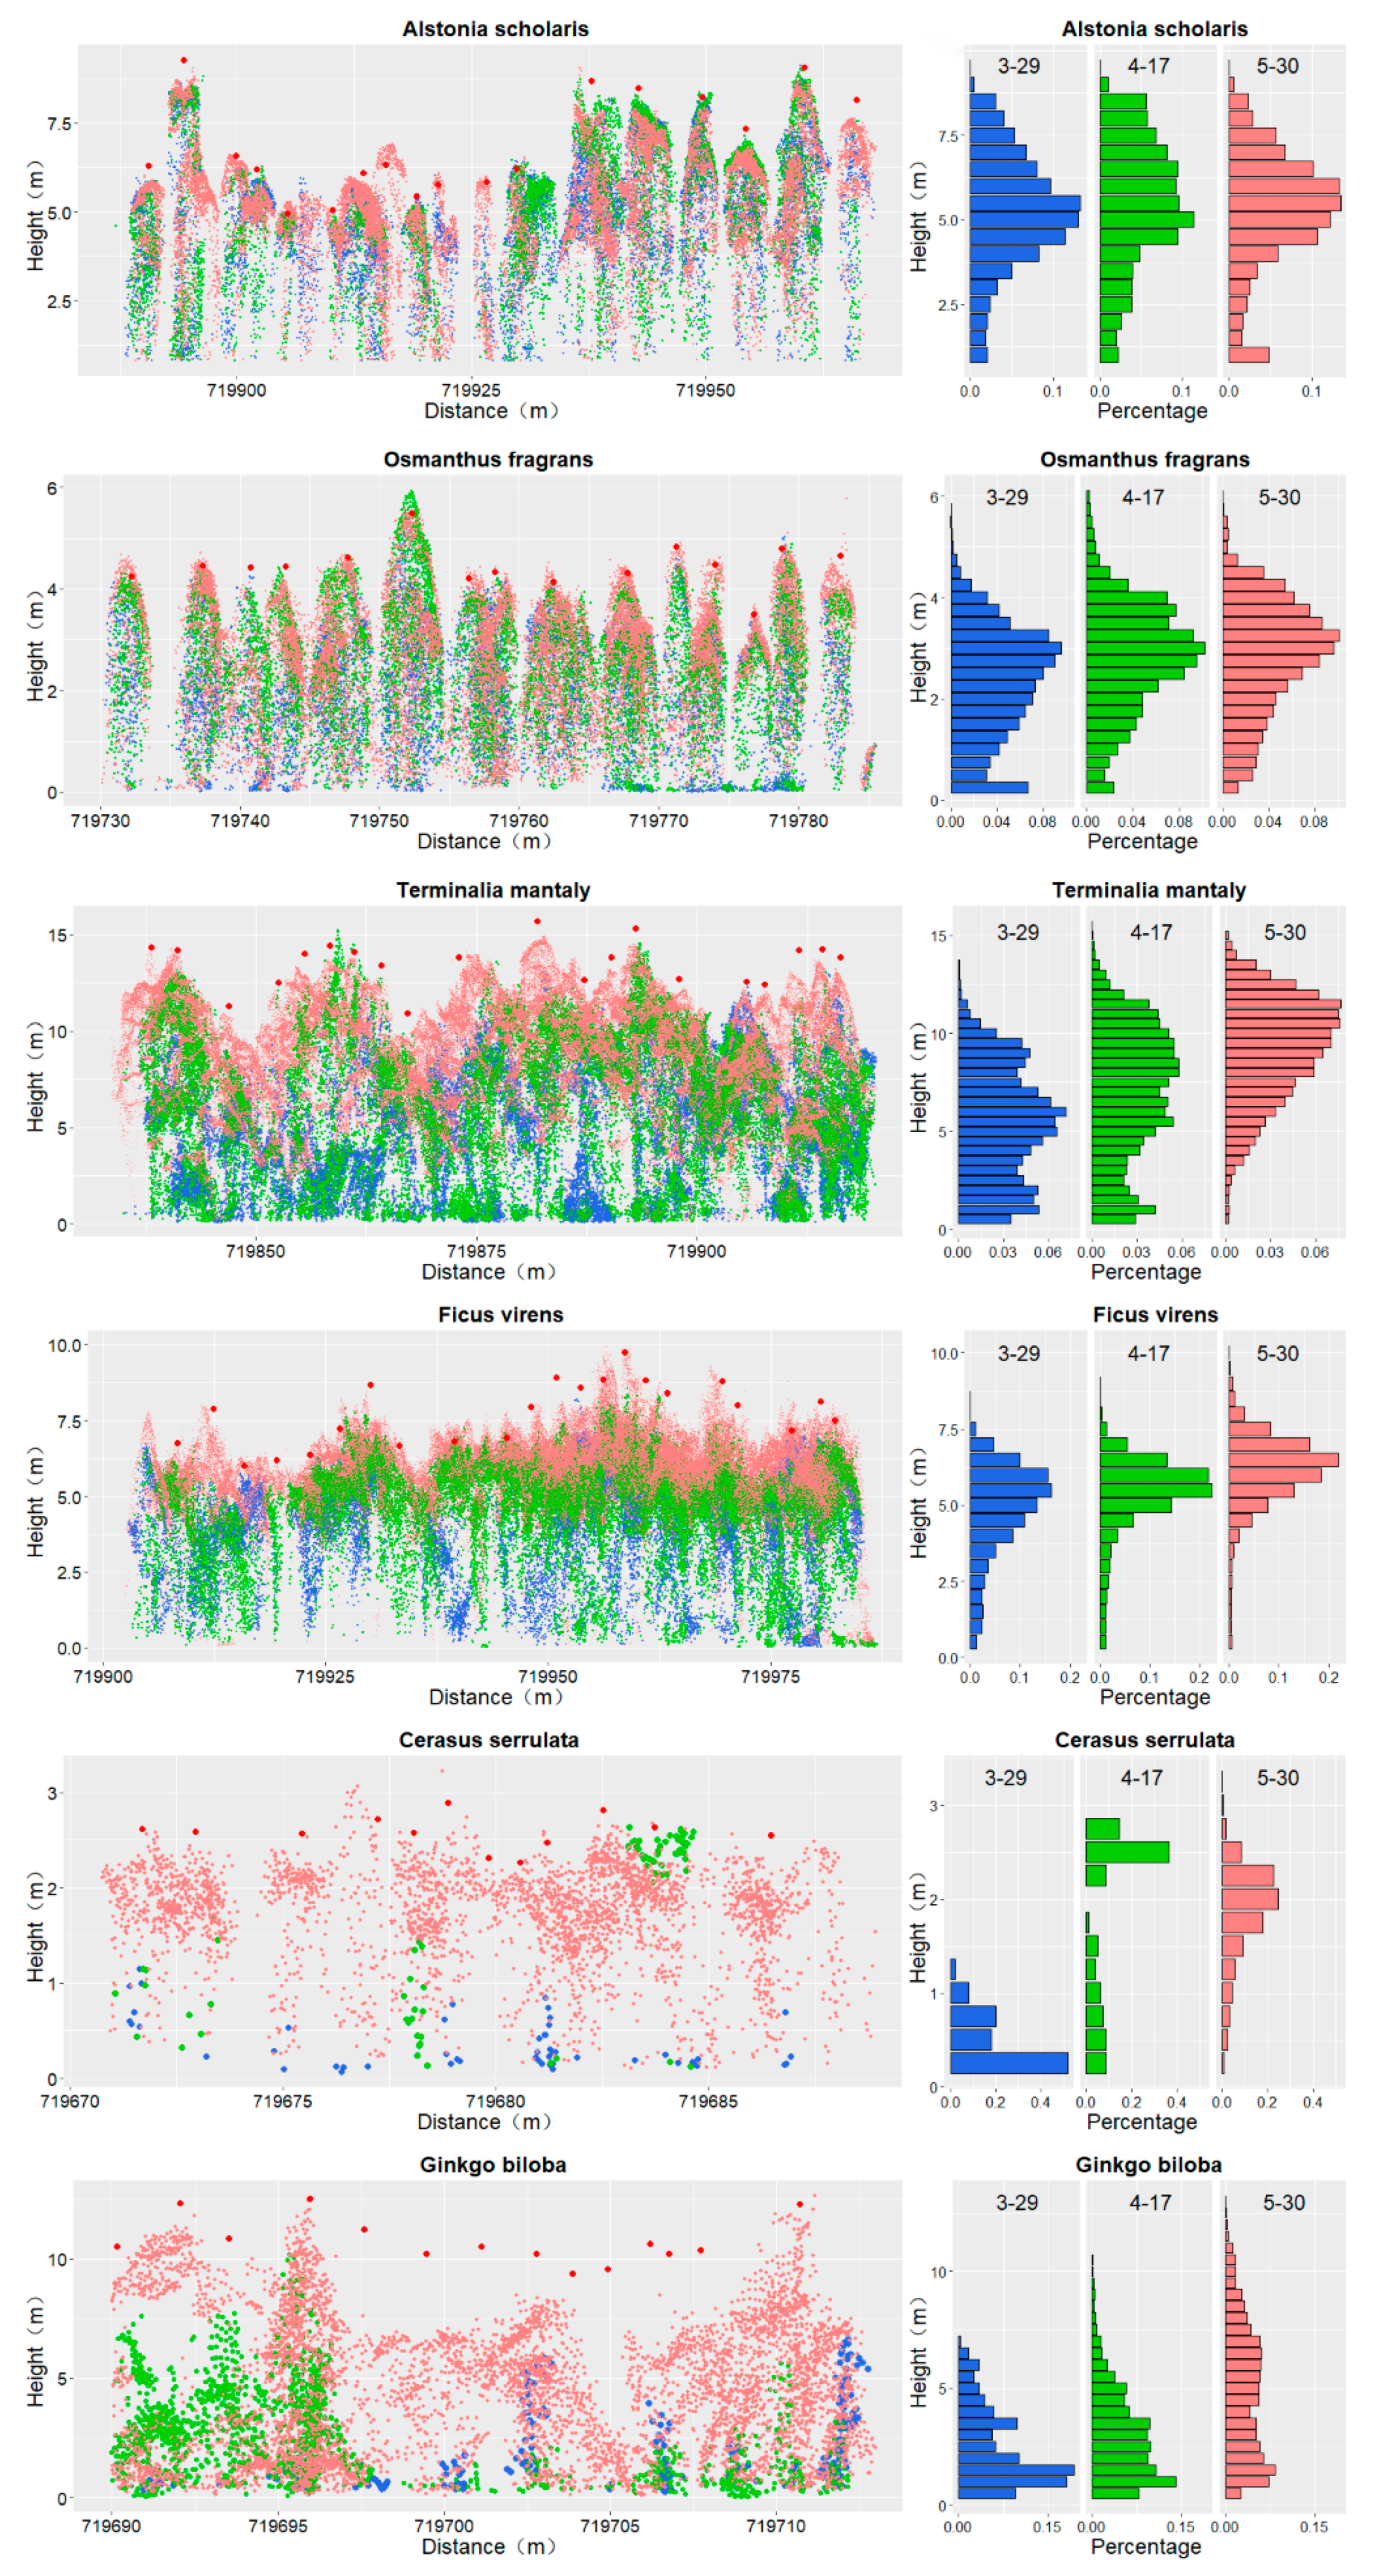
From the normalized elevation photogrammetric point cloud, tree sample areas were selected via clipping from each point cloud for multitemporal (time series) point cloud comparison; we manually removed the points of low shrubs and other irrelevant objects; thus, only the points of trees that we are interested in were left. Tree points from three periods were displayed in the same cross section using different colors (Figure 4, left column); tree height information was also presented in those cross sections: at each field-measured stem position, the field-measured tree height was added to show where the treetop was. That way, not only could one observe the differences in point distribution among them but also determine how well the canopies were reconstructed from the UAV images during the three time periods. In addition, similar to the canopy height profiles presented in [19], we generated a vertical profile of tree point count percentages (Figure 4, right column); points were stratified into height bins of either 0.5 m (for tree species higher than 5 m) or 0.25 m (for tree species whose mean height is less than 5 m) for analysis.
For evergreen species AS and OF, whose leaf amounts showed no visible change during the three periods, there was no significant difference in the vertical profiles of the canopy (Figure 4, first 2 rows). Moreover, the reconstructed canopy height was very close to the field-measured height, and the point cloud distribution trend was roughly the same for the data from all three periods.
For four deciduous species, the point distribution patterns shown in Figure 4 are quite different from the patterns of the evergreen trees. The leaf conditions of TM and FV during the three periods went from sparse, old leaves (for TM its leaves were all gone on March 29) to sparse, new leaves, to dense, full leaves. It is apparent that the vertical profiles of those trees changed. The histograms of the point distribution (Figure 4, middle section) show that the number of points in the crown increased gradually, with an apparent upward trend. Furthermore, the number of low points near the ground (less than 5 m) decreased steadily, and the reduction was particularly notable in the data from May 30. The point cloud of TM and FV shows a layer-like upward growth pattern from blue to green to light coral; in addition, the final reconstructed canopy structure is more complete, and the distance to the measured tree height is the smallest. However, for some trees, there is still a gap between the reconstructed canopy top and the corresponding red dots.
The leaf conditions of CS and GB during the three periods changed from leafless, to sparse, new leaves, to denser leaves. Most of the CS and GB trees were not reconstructed from the UAV images in the first two sets of data when their leaves were absent or very scarce. Some of the trees show up in the point cloud from May 30. In our study site, CSs are juvenile trees that are smaller in size than the other two deciduous tree species that we described previously. On May 30, even though the leaves were almost fully grown, the canopy density was still thin. Even to this day, for many Gingko trees, there was still a comparatively large gap between the measured tree height and the point cloud treetop.
For deciduous trees, one trend can be observed: as time progressed, there were more leaves in the tree canopies, which resulted in higher-density photogrammetric tree point clouds (Table 5, TM and FV) and better canopy reconstruction (Figure 4, left column, with the reconstructed canopy top closer to the real treetop). For evergreen trees whose leaves do not change much, the trend is not as significant (AS and OF in Table 5).

3.3. Tree Detection and Tree Height Evaluation

Comparing the treetop positions extracted by the lmf algorithm to the field measurements, the r, p, and F scores were calculated for the three periods, and the ME, R2, and RMSE values were computed for tree height estimation (Table 6).
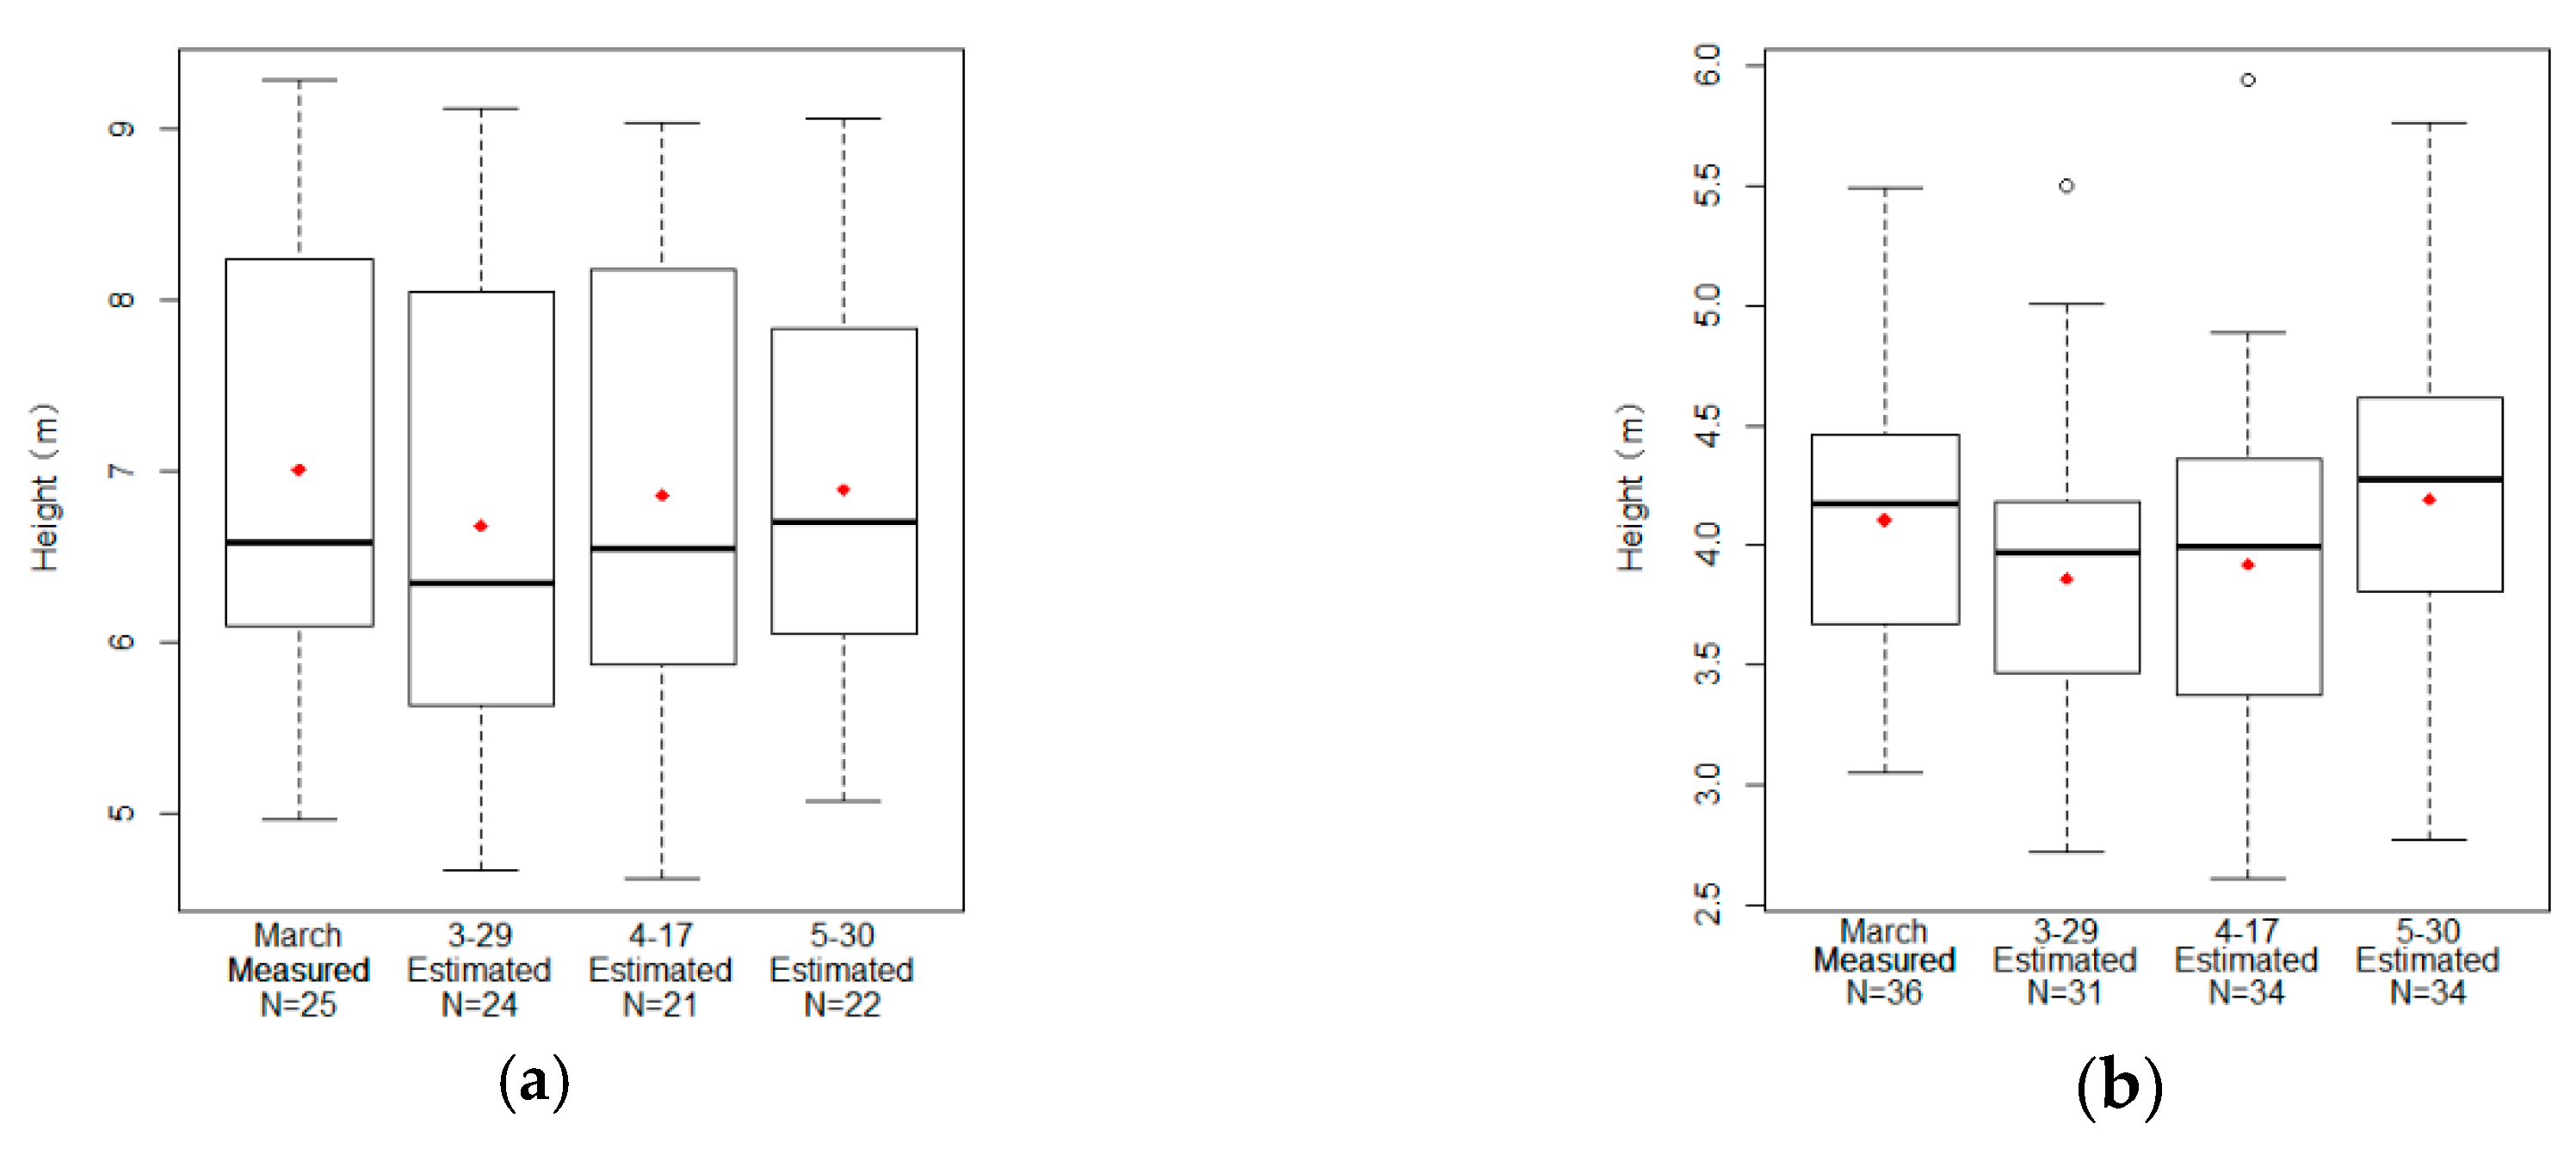
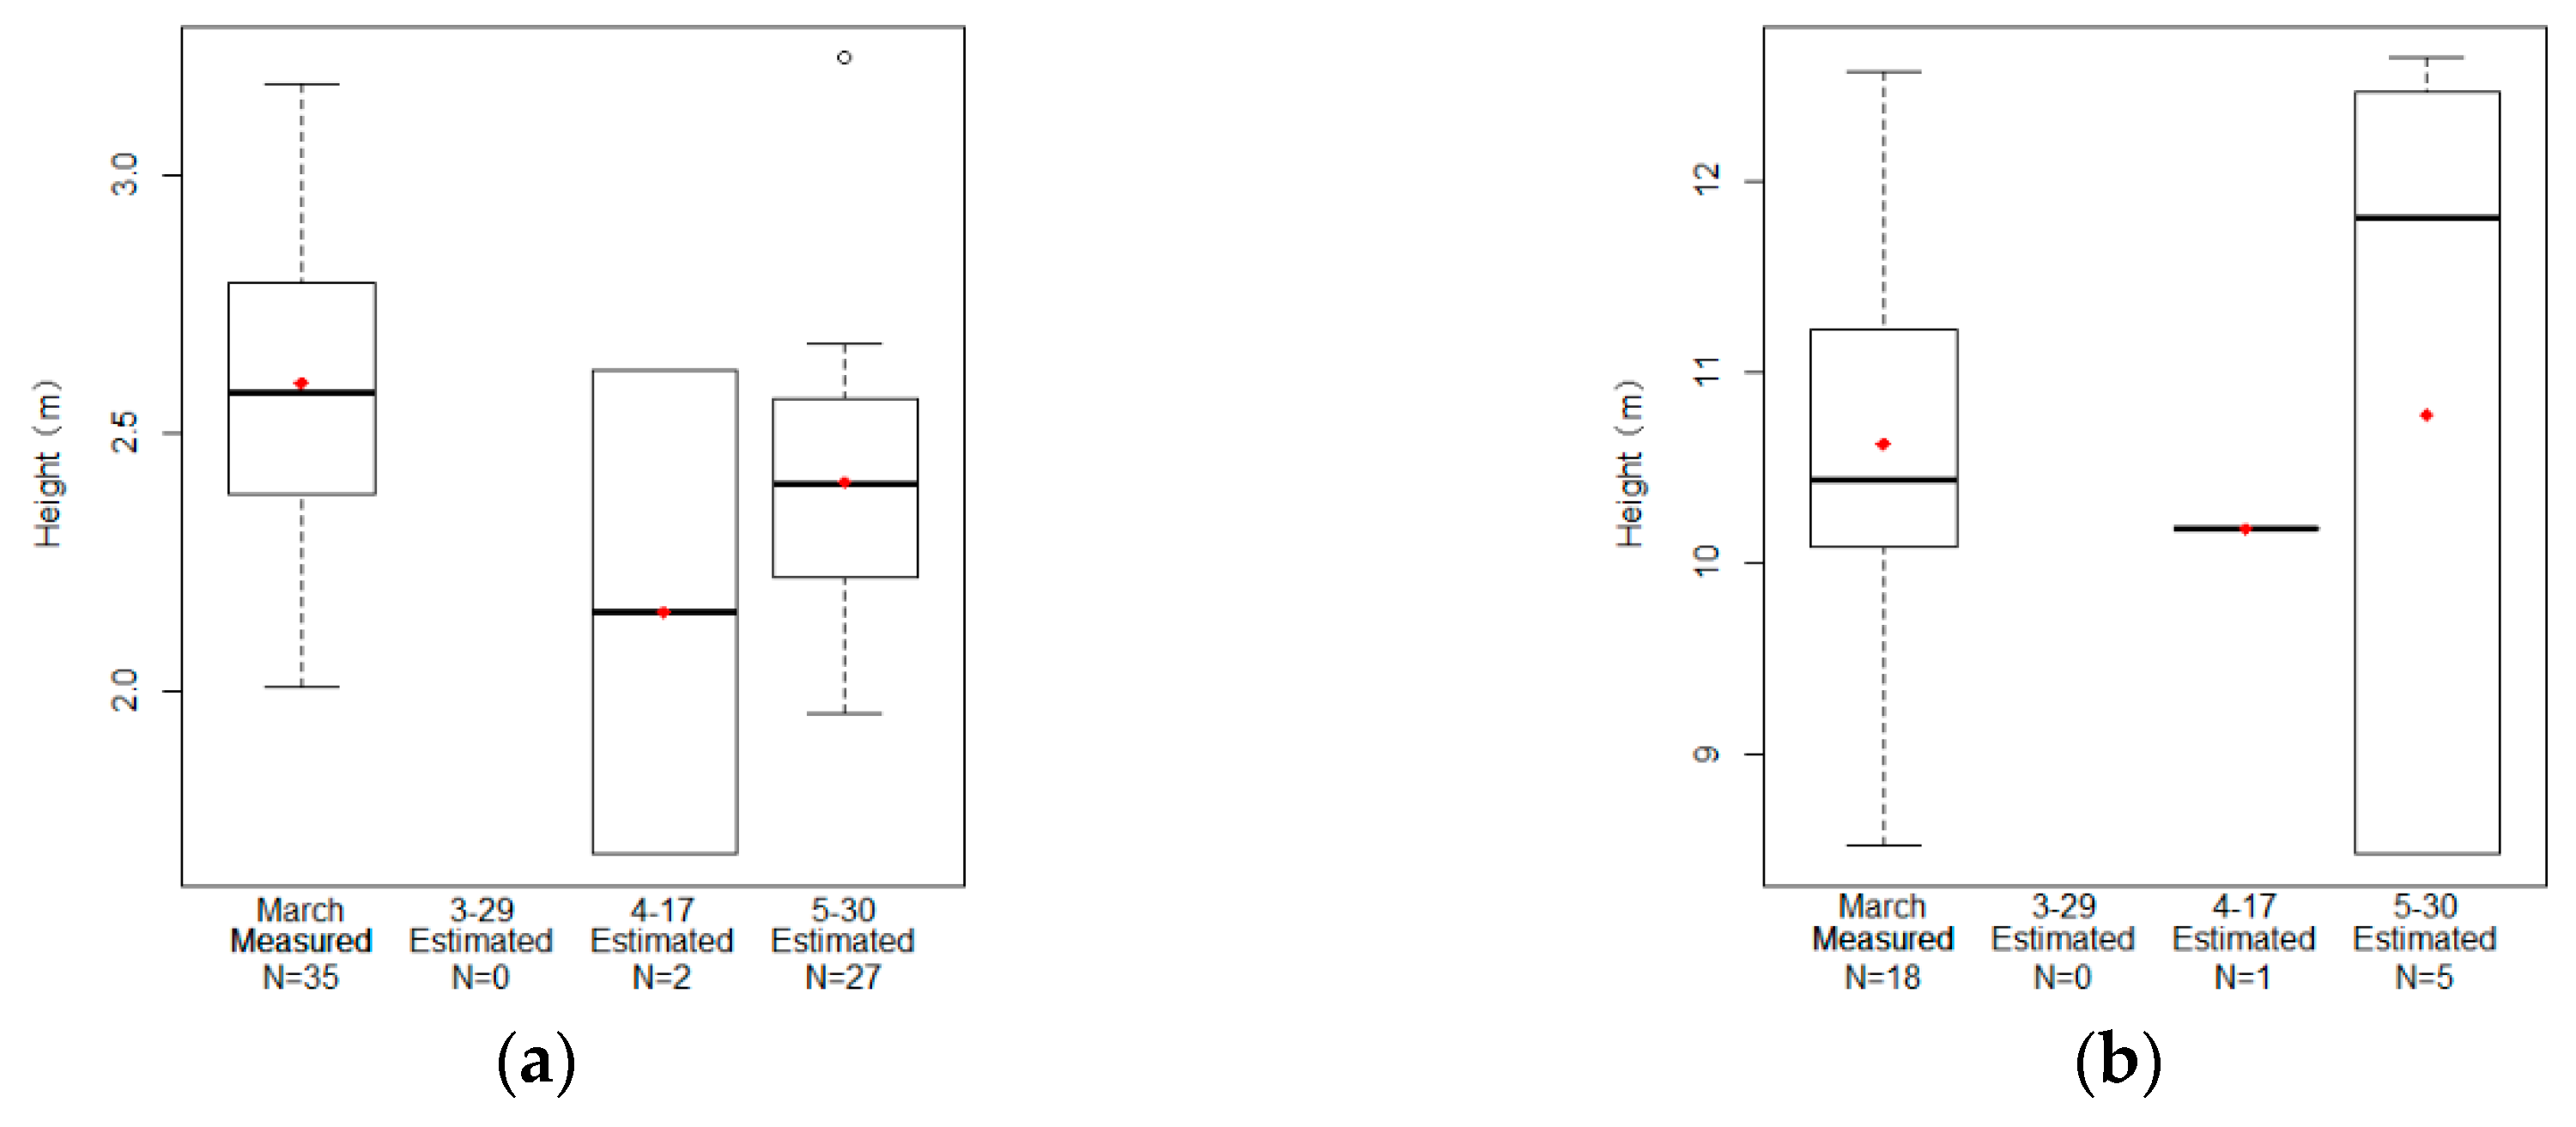
For evergreen species, the tree detection rate of the F score is always greater than 0.9 and shows little variation (0.98, 0.91, and 0.94 for AS and 0.91, 0.97, and 0.97 for OF during the three periods); the same is true for the RMSEs of the tree height estimation. The ranges of RMSEs were 0.43–0.59 m and 0.35-0.38 m for AS and OF, respectively. The estimated tree heights of AS and OF during the three periods were similar to the overall distribution of the field-measured tree height (Figure 5), and the R2 and RMSE change trends are shown in Figure 6. The mean error decreased gradually from −0.37 to −0.15 m and from −0.26 to 0.04 m for AS and OF, respectively.
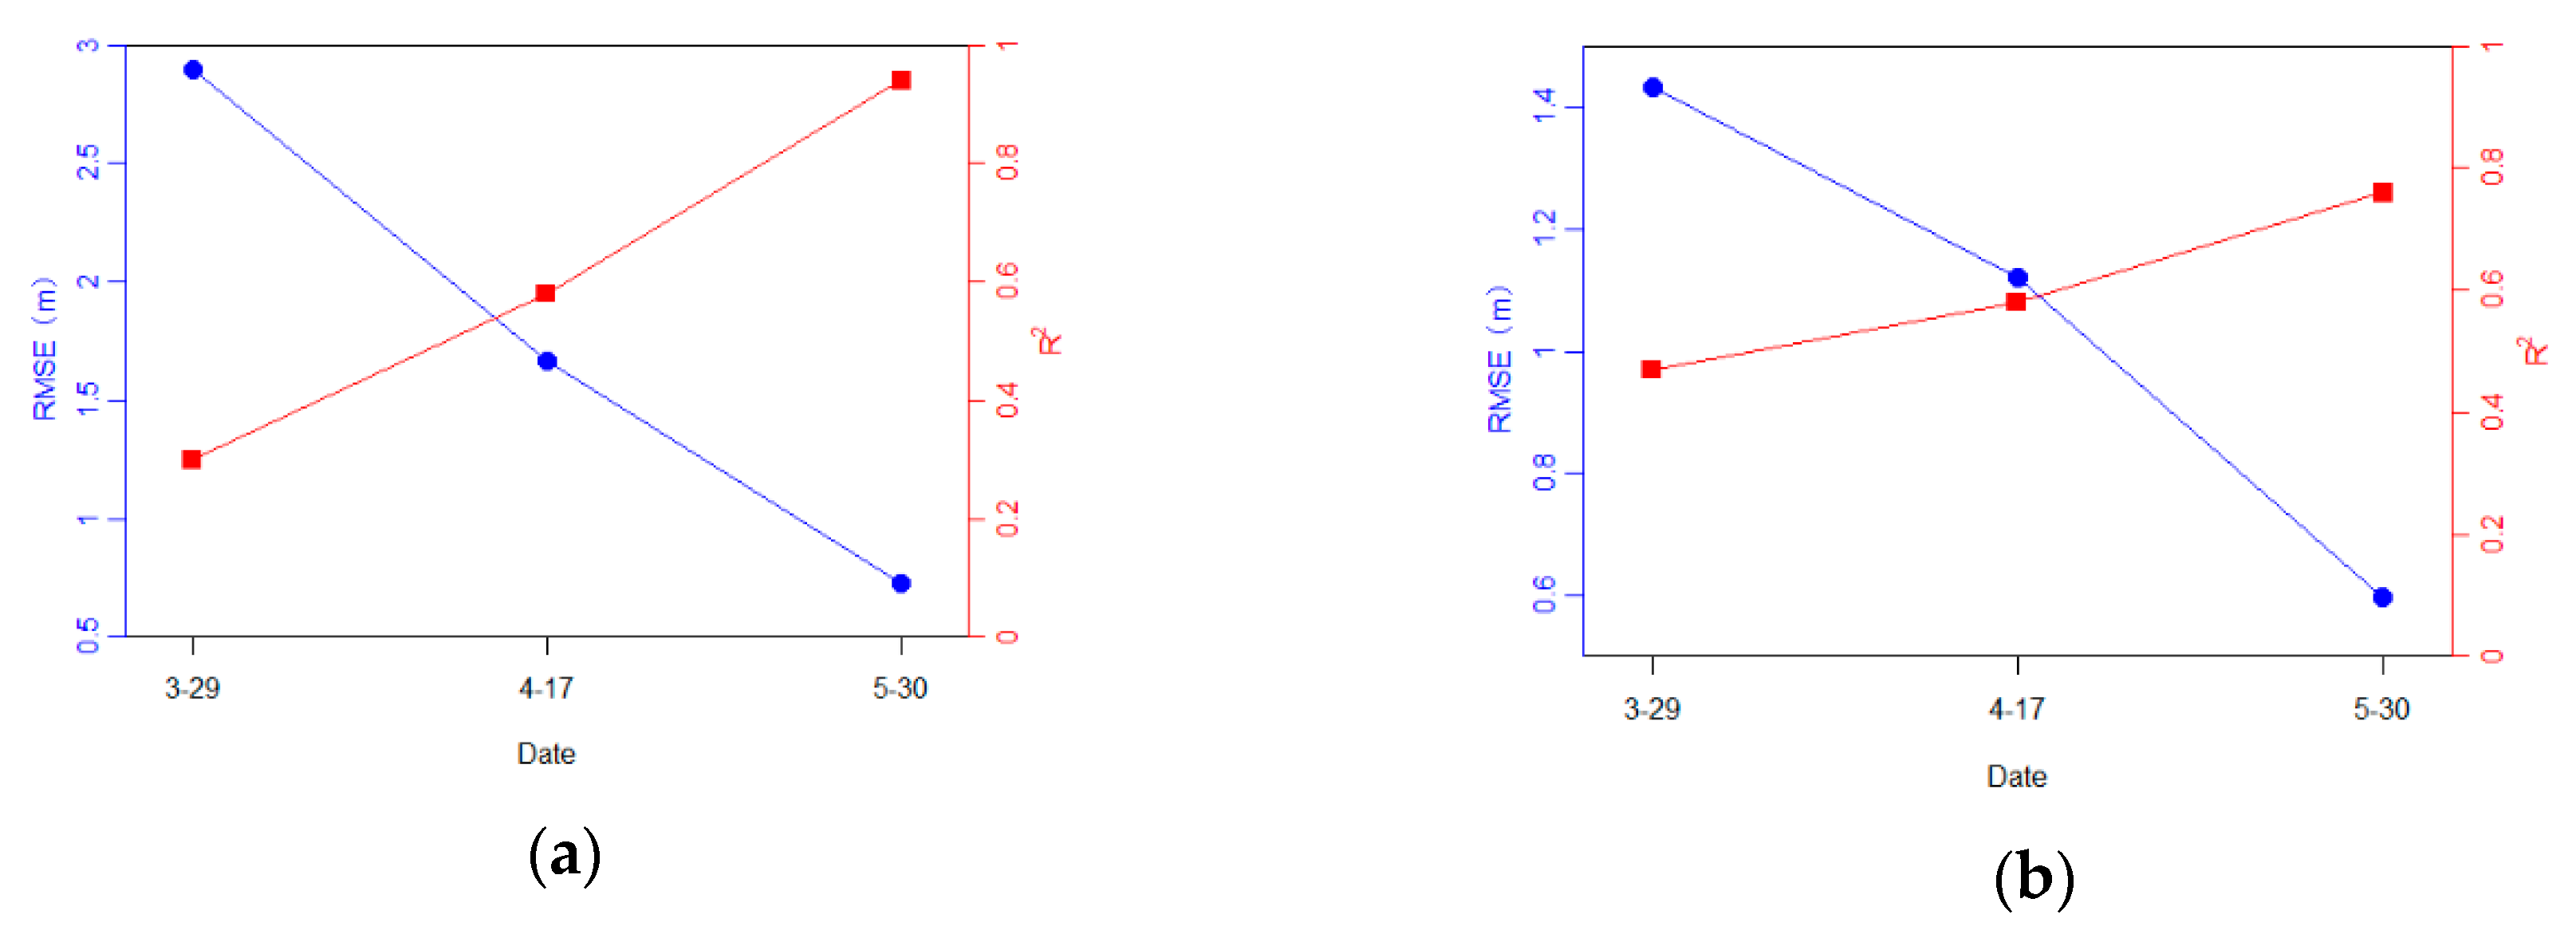
For deciduous trees TM and FV, clear change patterns emerged, as seen from the statistics in Table 6. From March to May, as leaves became thicker in the canopy, the tree detection rate of the F score increased steadily. The estimated tree height gradually increased and approached the field-measured tree height (Figure 7 and Figure 8); the tree height estimation errors (RMSE and ME) decreased significantly (Figure 9 illustrates the declining RMSE trends for TM and FV, while the R2 increased gradually).
There were no CS and GB trees detected from the March 29 data, when the trees were under leaf-off conditions, probably due to a smaller crown size and tree height, as well as an open crown shape, tree detection and height estimation were more difficult and error-prone than they were for the other two deciduous tree species. However, with the progress of leaf growth, more leaves in the canopy helped increase the detection rate and lower the tree height estimation error. Still, the detection rate and tree height estimation error of GB in leaf-on state is worse than other species.

4. Discussion

In this study of tree height estimation from UAV photogrammetric point cloud, we demonstrated the clear and distinct differences in the accuracies of height estimation among tree species and during phenological times for the same species. From late spring to early summer in the fast-growing season, the canopies of deciduous trees experienced a quick increase in leaf amount and volume. This change in the leaf abundance can have a direct effect on tree detection and height estimation: with more leaves in the canopy, denser photogrammetric point clouds can be reconstructed from UAV images, resulting in more detected trees, lower tree height estimation errors, and better results.
For tree height estimation using either LiDAR or photogrammetry point clouds, errors can be introduced from both ends (i.e., the ground elevation (DEM) and treetop positions). LiDAR technology is appealing and well-known for its unrivaled ability to penetrate canopies and reach the ground, thus obtaining accurate high-resolution ground elevations, even in forested areas [13]; for the photogrammetric point cloud, a large portion of ground information may be missing due to obstruction by the canopy cover, and the DEM derived from these data is usually not very reliable or useful [6]. DEM accuracy is generally affected by vegetation coverage, terrain slope, filtering, and the interpolation algorithms employed [19]. As we stated in the previous section, our DEM accuracy assessment results show that RMSEs are relatively stable during the three periods, with less than a 10 cm variation. While some studies [31,42] found that the accuracy of the DEM produced by UAV images varies with the season and it is most accurate in winter when the vegetation cover is low, we did not find that DEM accuracy changed notably with canopy cover or leaf amount in our study sites. This is most likely because the topography in our study area is generally flat with some gentle slopes, and some portion of the ground surface is still visible. Even if canopy occlusion occurs when the leaves are dense, it is still possible to rely on the terrain information of the surrounding area to fill the void under the tree. The DEM evaluation results in Table 4 also indicate a systematic overestimation error between 10 and 20 cm, which would have introduced a systematic underestimation error of 10–20 cm in the corresponding tree height.
Another key error source in height estimation from the point cloud is whether the treetop can be adequately sampled or reconstructed by the sensors. For the LiDAR sensor, the higher the point density is, the better the chance of capturing the treetop information; the same can be said for the photogrammetry point cloud reconstructed from digital aerial images. [14] observed that datasets with higher point densities provide higher tree height accuracy. However, the successful reconstruction of tree point clouds based on drone images is affected by many factors, some of which have been discussed in [6,19,20]. Among them are the UAV platform and camera, computer vision algorithms, image acquisition parameters (height and overlap) and natural conditions (wind and illumination), forest type (tree species, plant density, and crown shape), and phenology.
The focus of this study was on the effect of forest type and phenology on tree height estimation, with all other factors (i.e., image acquisition configurations, UAV images, and point cloud processing parameters) being under strict control (i.e., they were kept as consistent as possible). We have direct observations and evidence that tree species (evergreen and deciduous trees) and phenological phases can have various degrees of influence on tree height estimation and error contribution.
For evergreen broadleaved trees, such as AS and OF, the RMSEs of tree height estimation on the three dates were 0.43–0.59 and 0.35–0.38 m, respectively. These errors were rather stable during the three periods, especially for the OF trees, which have a more rounded and tightly clustered canopy or crown shape; most of the OF treetops were successfully reconstructed in the image point cloud (Figure 4, left column, second row). The main error source for tree height estimation was from the DEM error (more than 70% contribution); for AS trees with a tabular to spreading crown shape, there were some small distances between the measured treetops and reconstructed canopies. The error analysis indicates that the DEM error similarly contributes approximately 30 cm to the total error (approximately 50 cm). Both of those trees experienced no apparent phenological transition during the study, so the tree detection rate, RMSE, and R2 values remained relatively steady.
For the remaining four deciduous trees, our results show that phenological transition from leafless to full canopy plays an important role in the success of image reconstruction and accuracy of tree height estimation. When under leaf-off conditions, only some part of (e.g., TM and FV) or even none of the trees (e.g., CS and GB) could be correctly detected from the ill-reconstructed photogrammetric point cloud, and the majority of the height estimation error (RMSEs reached over 2.8 m and 1.4 m for TM and FV trees, respectively) came from the badly defined canopy in the point cloud, while the DEM errors played a minor role (consistently approximately 20 to 30 cm for TM and FV, respectively). With the increase in leaf amount, the quality of the reconstructed photogrammetric point cloud improved; there were more trees being detected from the point cloud, and the tree height estimation error decreased markedly. On May 30, the relative RMSE (RMSE over the mean tree height for the given species) for the TM and FV trees dropped to less than 10%, which was on par with that of the evergreen species AS and OF, while the relative RMSEs for CS and GB were still greater than 10%. Again, we observed similarities and differences among these deciduous species that have different crown shapes, leaf densities and branch patterns, and tree sizes. Leaf-on conditions are usually more advantageous for canopy reconstruction than leaf-off conditions; however, results with varied quality may be achieved for different tree species, such as those we discussed here.
Previously, some researchers observed the effect of leaf-off and leaf-on conditions on forest inventory attribute estimations. Dandois and Ellis [19] are among the first to mention this factor using an area-based approach. Miller et al. [25] observed that in the tropics during the dry season, drone point clouds cannot be used to accurately measure the plot-level height of small deciduous trees. Similarly, using an area-based approach, researchers from [22] observed a downward trend in tree height from early spring to fall, and they deduced that “leaf-on conditions may have a positive influence on measured tree height, and it is plausible that heights will be underestimated in leaf-off conditions.” In our study, using an individual tree-based approach, we present the first direct evidence to show that leaf-on conditions are conducive to accurate tree height estimation.
Leaf-on conditions are beneficial to precise tree height estimation because a higher density of photogrammetry point clouds can be derived from leaf-on UAV images than from leaf-off images. Higher density points are most likely the result of higher textural variations in image content (brightness and intensity) and features detectable by the photogrammetry software [19]. It is likely that under the leaf-off circumstances or when the leaves are sparse, the canopy is somewhat transparent, thus in UAV images the ground and canopy pixels are intermingled; there are no significant spectral or textural differences between ground and leafless trees, so the sfm software is ineffective or unable to identify tree features from the drone images in these regions. It is also probable that for smaller-sized trees, images with a higher spatial resolution may be needed to detect crown features that are otherwise invisible in coarser GSDs. With more leaves in the canopy, the spectral and textural contrast between the ground and trees increases, which results in more detected features and facilitates better canopy reconstruction.
The overall effects of leaf abundance or canopy cover on tree height estimation are more complicated in areas without reliable ground elevation data. More leaves in a canopy helps tree reconstruction from the images, which is advantageous for tree height estimation, but at the same time, higher canopy-cover reduces the quality of the digital terrain data derived from this method, as demonstrated in [31,42], which in turn adversely affects the accuracy of tree height’s estimation. An approach similar to the one proposed in [10] could be a solution to this dilemma.
There was a two-month time lapse between the date when tree height was first measured on the ground and the date of the last UAV image acquisition. During this period, there should have been some natural tree growth, thus height increments. From Table 2, for most of the trees, the average tree growth was from 5 to 19 cm, whereas the growth of gingko was almost negligible.
From the mean error values reported in Table 6, we found that tree height is generally underestimated from UAV photogrammetry point clouds; this is consistent with the findings from most other studies. In addition, the mean error decreased from March to May. For AS and OF, tree growth during this period certainly helped reduce the mean error to some extent, and the tree growth pattern was clearly visible in their point cloud distribution, as shown in Figure 4. On the other hand, the influence of tree growth on the mean error for TM and FV height estimation was trivial.
Time series UAV images have been used for forest inventory updates, change detection, intensive monitoring, and within-season tree growth determination [6,21,22]. The observations and conclusions drawn from our study can have some important implications for forest management and research applications using this type of data. Tree species composition, seasonality or phenological timing, and other factors (such as tree size and crown shape) must be taken into consideration in the process of project planning and data analysis. For example, appropriate thresholds need to be determined for each tree species individually while performing a tree height change detection analysis, because at a given GSD, various trees can have inherently different height estimation errors and accuracies.

5. Conclusions

The main objective of this study was to understand some vegetative factors that can affect the accuracies of tree height estimations derived from UAV-acquired images. Our focus was mainly on the leaf abundance, which changes with seasonality and phenology. Using multitemporal UAV image data collected on three dates from late spring to early summer during the growing season, we generated photogrammetric point clouds from the images using computer vision and photogrammetry software. The tree heights of six species, including both deciduous and evergreen species, were extracted from the image point cloud with an individual tree-based approach and evaluated against the ground measurement. Our results show that for evergreen trees and some leaf-on deciduous trees, reliable and consistent tree height information can be obtained from this technique. We found that leaf amount has a positive effect on height estimation, particularly for deciduous trees; as the leaf amount increases in the growing season, the sfm algorithm is able to detect more features from the UAV images and reconstruct more canopy point clouds; this helps improve the tree detection rate and lower the height estimation error.
We also noticed that for species with various crown shapes and sizes, the ability of the sfm software to reconstruct the canopy point cloud from images differs; additionally, tree height estimation errors are inherently different for different species. Some trees are more difficult to reconstruct fully and have higher fidelity than other trees. More studies are needed to quantify the relationships between crown shapes’, image textual or spectral variation contents’, detectable vegetative feature points’, and vegetative structural attributes’ (including tree height, crown width, etc.) estimation errors.
To obtain meaningful forest inventory attributes, including tree height information, in a UAV image acquisition campaign, we need to consider both phenology and plant vegetative structure (i.e., crown shape and tree size) carefully. Data of the studied species should be collected under leaf-on conditions, or it should be ensured that there is enough textural variation between the ground and the trees, and that proper image resolution can be defined beforehand to ensure that the objects studied can be reconstructed and detected from the data.

Author Contributions

Conceptualization, H.H.; methodology, H.H.; validation, S.H. and H.H.; resources, H.H. and C.C.; writing—original draft preparation, S.H. and H.H.; writing—review and editing, H.H.; visualization, S.H.; supervision, C.C.; project administration, C.C.; funding acquisition, C.C.

Funding

This work was supported in part by the National Key Research and Development Program of China under grant 2017YFB0504202, and in part by the Pilot Project of Fujian Province, China under grant 2016Y0058.

Acknowledgments

The authors would like to thank the editor who handled their paper and three anonymous reviewers for providing comments and suggestions that significantly helped to improve the technical quality and presentation of their paper.

Conflicts of Interest

The authors declare no conflict of interest.

References

  1. Anderson, J.; Martin, M.E.; Smith, M.; Dubayah, R.O.; Hofton, M.A.; Hyde, P.; Peterson, B.E.; Blair, J.B.; Knox, R.G. The use of waveform lidar to measure northern temperate mixed conifer and deciduous forest structure in New Hampshire. Remote Sens. Environ. 2006, 105, 248–261. [Google Scholar] [CrossRef]
  2. Erdody, T.L.; Moskal, L.M. Fusion of LiDAR and imagery for estimating forest canopy fuels. Remote Sens. Environ. 2010, 114, 725–737. [Google Scholar] [CrossRef]
  3. Selkowitz, D.J.; Green, G.; Peterson, B.; Wylie, B. A multi-sensor lidar, multi-spectral and multi-angular approach for mapping canopy height in boreal forest regions. Remote Sens. Environ. 2012, 121, 458–471. [Google Scholar] [CrossRef]
  4. Bohlin, J.; Wallerman, J.; Fransson, J.E.S. Forest variable estimation using photogrammetric matching of digital aerial images in combination with a high-resolution DEM. Scand. J. For. Res. 2012, 27, 692–699. [Google Scholar] [CrossRef]
  5. Dandois, J.P.; Ellis, E.C. Remote Sensing of Vegetation Structure Using Computer Vision. Remote Sens. 2010, 2, 1157–1176. [Google Scholar] [CrossRef] [Green Version]
  6. Krause, S.; Sanders, T.G.; Mund, J.-P.; Greve, K. UAV-Based Photogrammetric Tree Height Measurement for Intensive Forest Monitoring. Remote Sens. 2019, 11, 758. [Google Scholar] [CrossRef]
  7. Mlambo, R.; Woodhouse, I.H.; Gerard, F.; Anderson, K. Structure from Motion (SfM) Photogrammetry with Drone Data: A Low Cost Method for Monitoring Greenhouse Gas Emissions from Forests in Developing Countries. Forests 2017, 8, 68. [Google Scholar] [CrossRef]
  8. Goodbody, T.R.H.; Coops, N.C.; White, J.C. Digital Aerial Photogrammetry for Updating Area-Based Forest Inventories: A Review of Opportunities, Challenges, and Future Directions. Curr. For. Rep. 2019, 5, 55–75. [Google Scholar] [CrossRef] [Green Version]
  9. Wallace, L.; Lucieer, A.; Watson, C.S. Evaluating Tree Detection and Segmentation Routines on Very High Resolution UAV LiDAR Data. IEEE Trans. Geosci. Remote Sens. 2014, 52, 7619–7628. [Google Scholar] [CrossRef]
  10. Giannetti, F.; Chirici, G.; Gobakken, T.; Næsset, E.; Travaglini, D.; Puliti, S. A new approach with DTM-independent metrics for forest growing stock prediction using UAV photogrammetric data. Remote Sens. Environ. 2018, 213, 195–205. [Google Scholar] [CrossRef]
  11. White, J.C.; Tompalski, P.; Vastaranta, M.; Wulder, M.A.; Saarinen, S.; Stepper, C.; Coops, N.C. A Model Development and Application Guide for Generating an Enhanced Forest Inventory Using Airborne Laser Scanning Data and an Area-Based Approach; CWFC Information Report FI-X-018; Canadian Forest Service, Pacific Forestry Centre: Victoria, BC, Canada, 2017; p. 38. [Google Scholar]
  12. St-Onge, B.; Audet, F.; Bégin, J. Characterizing the Height Structure and Composition of a Boreal Forest Using an Individual Tree Crown Approach Applied to Photogrammetric Point Clouds. Forests 2015, 6, 3899–3922. [Google Scholar] [CrossRef]
  13. Wang, Y.; Hyyppa, J.; Liang, X.; Kaartinen, H.; Yu, X.; Lindberg, E.; Holmgren, J.; Qin, Y.; Mallet, C.; Ferraz, A.; et al. International Benchmarking of the Individual Tree Detection Methods for Modeling 3-D Canopy Structure for Silviculture and Forest Ecology Using Airborne Laser Scanning. IEEE Trans. Geosci. Remote Sens. 2016, 54, 5011–5027. [Google Scholar] [CrossRef] [Green Version]
  14. Ganz, S.; Käber, Y.; Adler, P. Measuring Tree Height with Remote Sensing—A Comparison of Photogrammetric and LiDAR Data with Different Field Measurements. Forests 2019, 10, 694. [Google Scholar] [CrossRef]
  15. Ullah, S.; Dees, M.; Datta, P.; Adler, P.; Schardt, M.; Koch, B. Potential of Modern Photogrammetry Versus Airborne Laser Scanning for Estimating Forest Variables in a Mountain Environment. Remote Sens. 2019, 11, 661. [Google Scholar] [CrossRef]
  16. White, J.C.; Coops, N.C.; Wulder, M.A.; Vastaranta, M.; Hilker, T.; Tompalski, P. Remote Sensing Technologies for Enhancing Forest Inventories: A Review. Can. J. Remote Sens. 2016, 42, 619–641. [Google Scholar] [CrossRef] [Green Version]
  17. Birdal, A.C.; Avdan, U.; Türk, T. Estimating tree heights with images from an unmanned aerial vehicle. Geomat. Nat. Hazards Risk 2017, 8, 1144–1156. [Google Scholar] [CrossRef] [Green Version]
  18. Chen, S.; McDermid, G.J.; Castilla, G.; Linke, J. Measuring Vegetation Height in Linear Disturbances in the Boreal Forest with UAV Photogrammetry. Remote Sens. 2017, 9, 1257. [Google Scholar] [CrossRef]
  19. Dandois, J.P.; Ellis, E.C. High spatial resolution three-dimensional mapping of vegetation spectral dynamics using computer vision. Remote Sens. Environ. 2013, 136, 259–276. [Google Scholar] [CrossRef] [Green Version]
  20. Dandois, J.; Olano, M.; Ellis, E. Optimal Altitude, Overlap, and Weather Conditions for Computer Vision UAV Estimates of Forest Structure. Remote Sens. 2015, 7, 13895–13920. [Google Scholar] [CrossRef] [Green Version]
  21. Dempewolf, J.; Nagol, J.; Hein, S.; Thiel, C.; Zimmermann, R. Measurement of Within-Season Tree Height Growth in a Mixed Forest Stand Using UAV Imagery. Forests 2017, 8, 231. [Google Scholar] [CrossRef]
  22. Nuijten, R.J.; Coops, N.C.; Goodbody, T.R.; Pelletier, G. Examining the Multi-Seasonal Consistency of Individual Tree Segmentation on Deciduous Stands Using Digital Aerial Photogrammetry (DAP) and Unmanned Aerial Systems (UAS). Remote Sens. 2019, 11, 739. [Google Scholar] [CrossRef]
  23. Mohan, M.; Silva, C.; Klauberg, C.; Jat, P.; Catts, G.; Cardil, A.; Hudak, A.T.; Dia, M. Individual Tree Detection from Unmanned Aerial Vehicle (UAV) Derived Canopy Height Model in an Open Canopy Mixed Conifer Forest. Forests 2017, 8, 340. [Google Scholar] [CrossRef]
  24. Ota, T.; Ogawa, M.; Mizoue, N.; Fukumoto, K.; Yoshida, S. Forest Structure Estimation from a UAV-Based Photogrammetric Point Cloud in Managed Temperate Coniferous Forests. Forests 2017, 8, 343. [Google Scholar] [CrossRef]
  25. Miller, E.; Dandois, J.P.; Detto, M.; Hall, J.S. Drones as a Tool for Monoculture Plantation Assessment in the Steepland Tropics. Forests 2017, 8, 168. [Google Scholar] [CrossRef]
  26. Kattenborn, T.; Sperlich, M.; Bataua, K.; Koch, B. Automatic Single Tree Detection in Plantations using UAV-based Photogrammetric Point clouds. ISPRS Int. Arch. Photogramm. Remote Sens. Spat. Inf. Sci. 2014, XL-3, 139–144. [Google Scholar] [CrossRef] [Green Version]
  27. Koc-San, D.; Selim, S.; Aslan, N.; San, B.T. Automatic citrus tree extraction from UAV images and digital surface models using circular Hough transform. Comput. Electron. Agric. 2018, 150, 289–301. [Google Scholar] [CrossRef]
  28. Zarco-Tejada, P.J.; Diaz-Varela, R.; Angileri, V.; Loudjani, P. Tree height quantification using very high resolution imagery acquired from an unmanned aerial vehicle (UAV) and automatic 3D photo-reconstruction methods. Eur. J. Agron. 2014, 55, 89–99. [Google Scholar] [CrossRef]
  29. Torres-Sánchez, J.; López-Granados, F.; Serrano, N.; Arquero, O.; Peña, J.M. High-Throughput 3-D Monitoring of Agricultural-Tree Plantations with Unmanned Aerial Vehicle (UAV) Technology. PLoS ONE 2015, 10, e130479. [Google Scholar] [CrossRef]
  30. Torres-Sánchez, J.; de Castro, A.; Peña, J.; Jiménez-Brenes, F.; Arquero, O.; Lovera, M.; López-Granados, F. Mapping the 3D structure of almond trees using UAV acquired photogrammetric point clouds and object-based image analysis. Biosyst. Eng. 2018, 176, 172–184. [Google Scholar] [CrossRef]
  31. Van Iersel, W.; Straatsma, M.; Addink, E.; Middelkoop, H. Monitoring height and greenness of non-woody floodplain vegetation with UAV time series. ISPRS J. Photogramm. Remote Sens. 2018, 141, 112–123. [Google Scholar] [CrossRef]
  32. Granholm, A.; Lindgren, N.; Olofsson, K.; Nyström, M.; Allard, A.; Olsson, H. Estimating vertical canopy cover using dense image-based point cloud data in four vegetation types in southern Sweden. Int. J. Remote Sens. 2017, 38, 1820–1838. [Google Scholar] [CrossRef]
  33. Panagiotidis, D.; Abdollahnejad, A.; Surový, P.; Chiteculo, V. Determining tree height and crown diameter from high-resolution UAV imagery. Int. J. Remote Sens. 2017, 38, 2392–2410. [Google Scholar] [CrossRef]
  34. Thiel, C.; Schmullius, C. Comparison of UAV photograph-based and airborne lidar-based point clouds over forest from a forestry application perspective. Int. J. Remote Sens. 2016, 38, 2411–2426. [Google Scholar] [CrossRef]
  35. Wang, Y.; Lehtomäki, M.; Liang, X.; Pyörälä, J.; Kukko, A.; Jaakkola, A.; Liu, J.; Feng, Z.; Chen, R.; Hyyppä, J. Is field-measured tree height as reliable as believed—A comparison study of tree height estimates from field measurement, airborne laser scanning and terrestrial laser scanning in a boreal forest. ISPRS J. Photogramm. Remote Sens. 2019, 147, 132–145. [Google Scholar] [CrossRef]
  36. Huang, H.; Zhang, H.; Chen, C.; Tang, L. Three-dimensional digitization of the arid land plant Haloxylon ammodendron using a consumer-grade camera. Ecol. Evol. 2018, 8, 5891–5899. [Google Scholar] [CrossRef]
  37. Isenburg, M. Lastools—Efficient Tools for Lidar Processing. Version 190114. 2019. Available online: http://lastools.org (accessed on 20 January 2019).
  38. Zhang, W.; Qi, J.; Wan, P.; Wang, H.; Xie, D.; Wang, X.; Yan, G. An Easy-to-Use Airborne LiDAR Data Filtering Method Based on Cloth Simulation. Remote Sens. 2016, 8, 501. [Google Scholar] [CrossRef]
  39. Popescu, S.C.; Wynne, R.H. Seeing the Trees in the Forest: Using Lidar and Multispectral Data Fusion with Local Filtering and Variable Window Size for Estimating Tree Height. Photogramm. Eng. Remote Sens. 2004, 70, 589–604. [Google Scholar] [CrossRef]
  40. Roussel, J.-R.; Auty, D. LidR: Airborne LiDAR Data Manipulation and Visualization for Forestry Applications. Available online: https://rdrr.io/cran/lidR/ (accessed on 28 May 2019).
  41. Li, W.; Guo, Q.; Jakubowski, M.K.; Kelly, M. A New Method for Segmenting Individual Trees from the Lidar Point Cloud. Photogramm. Eng. Remote Sens. 2012, 78, 75–84. [Google Scholar] [CrossRef] [Green Version]
  42. Goodbody, T.R.; Coops, N.C.; Hermosilla, T.; Tompalski, P.; Pelletier, G. Vegetation Phenology Driving Error Variation in Digital Aerial Photogrammetrically Derived Terrain Models. Remote Sens. 2018, 10, 1554. [Google Scholar] [CrossRef]
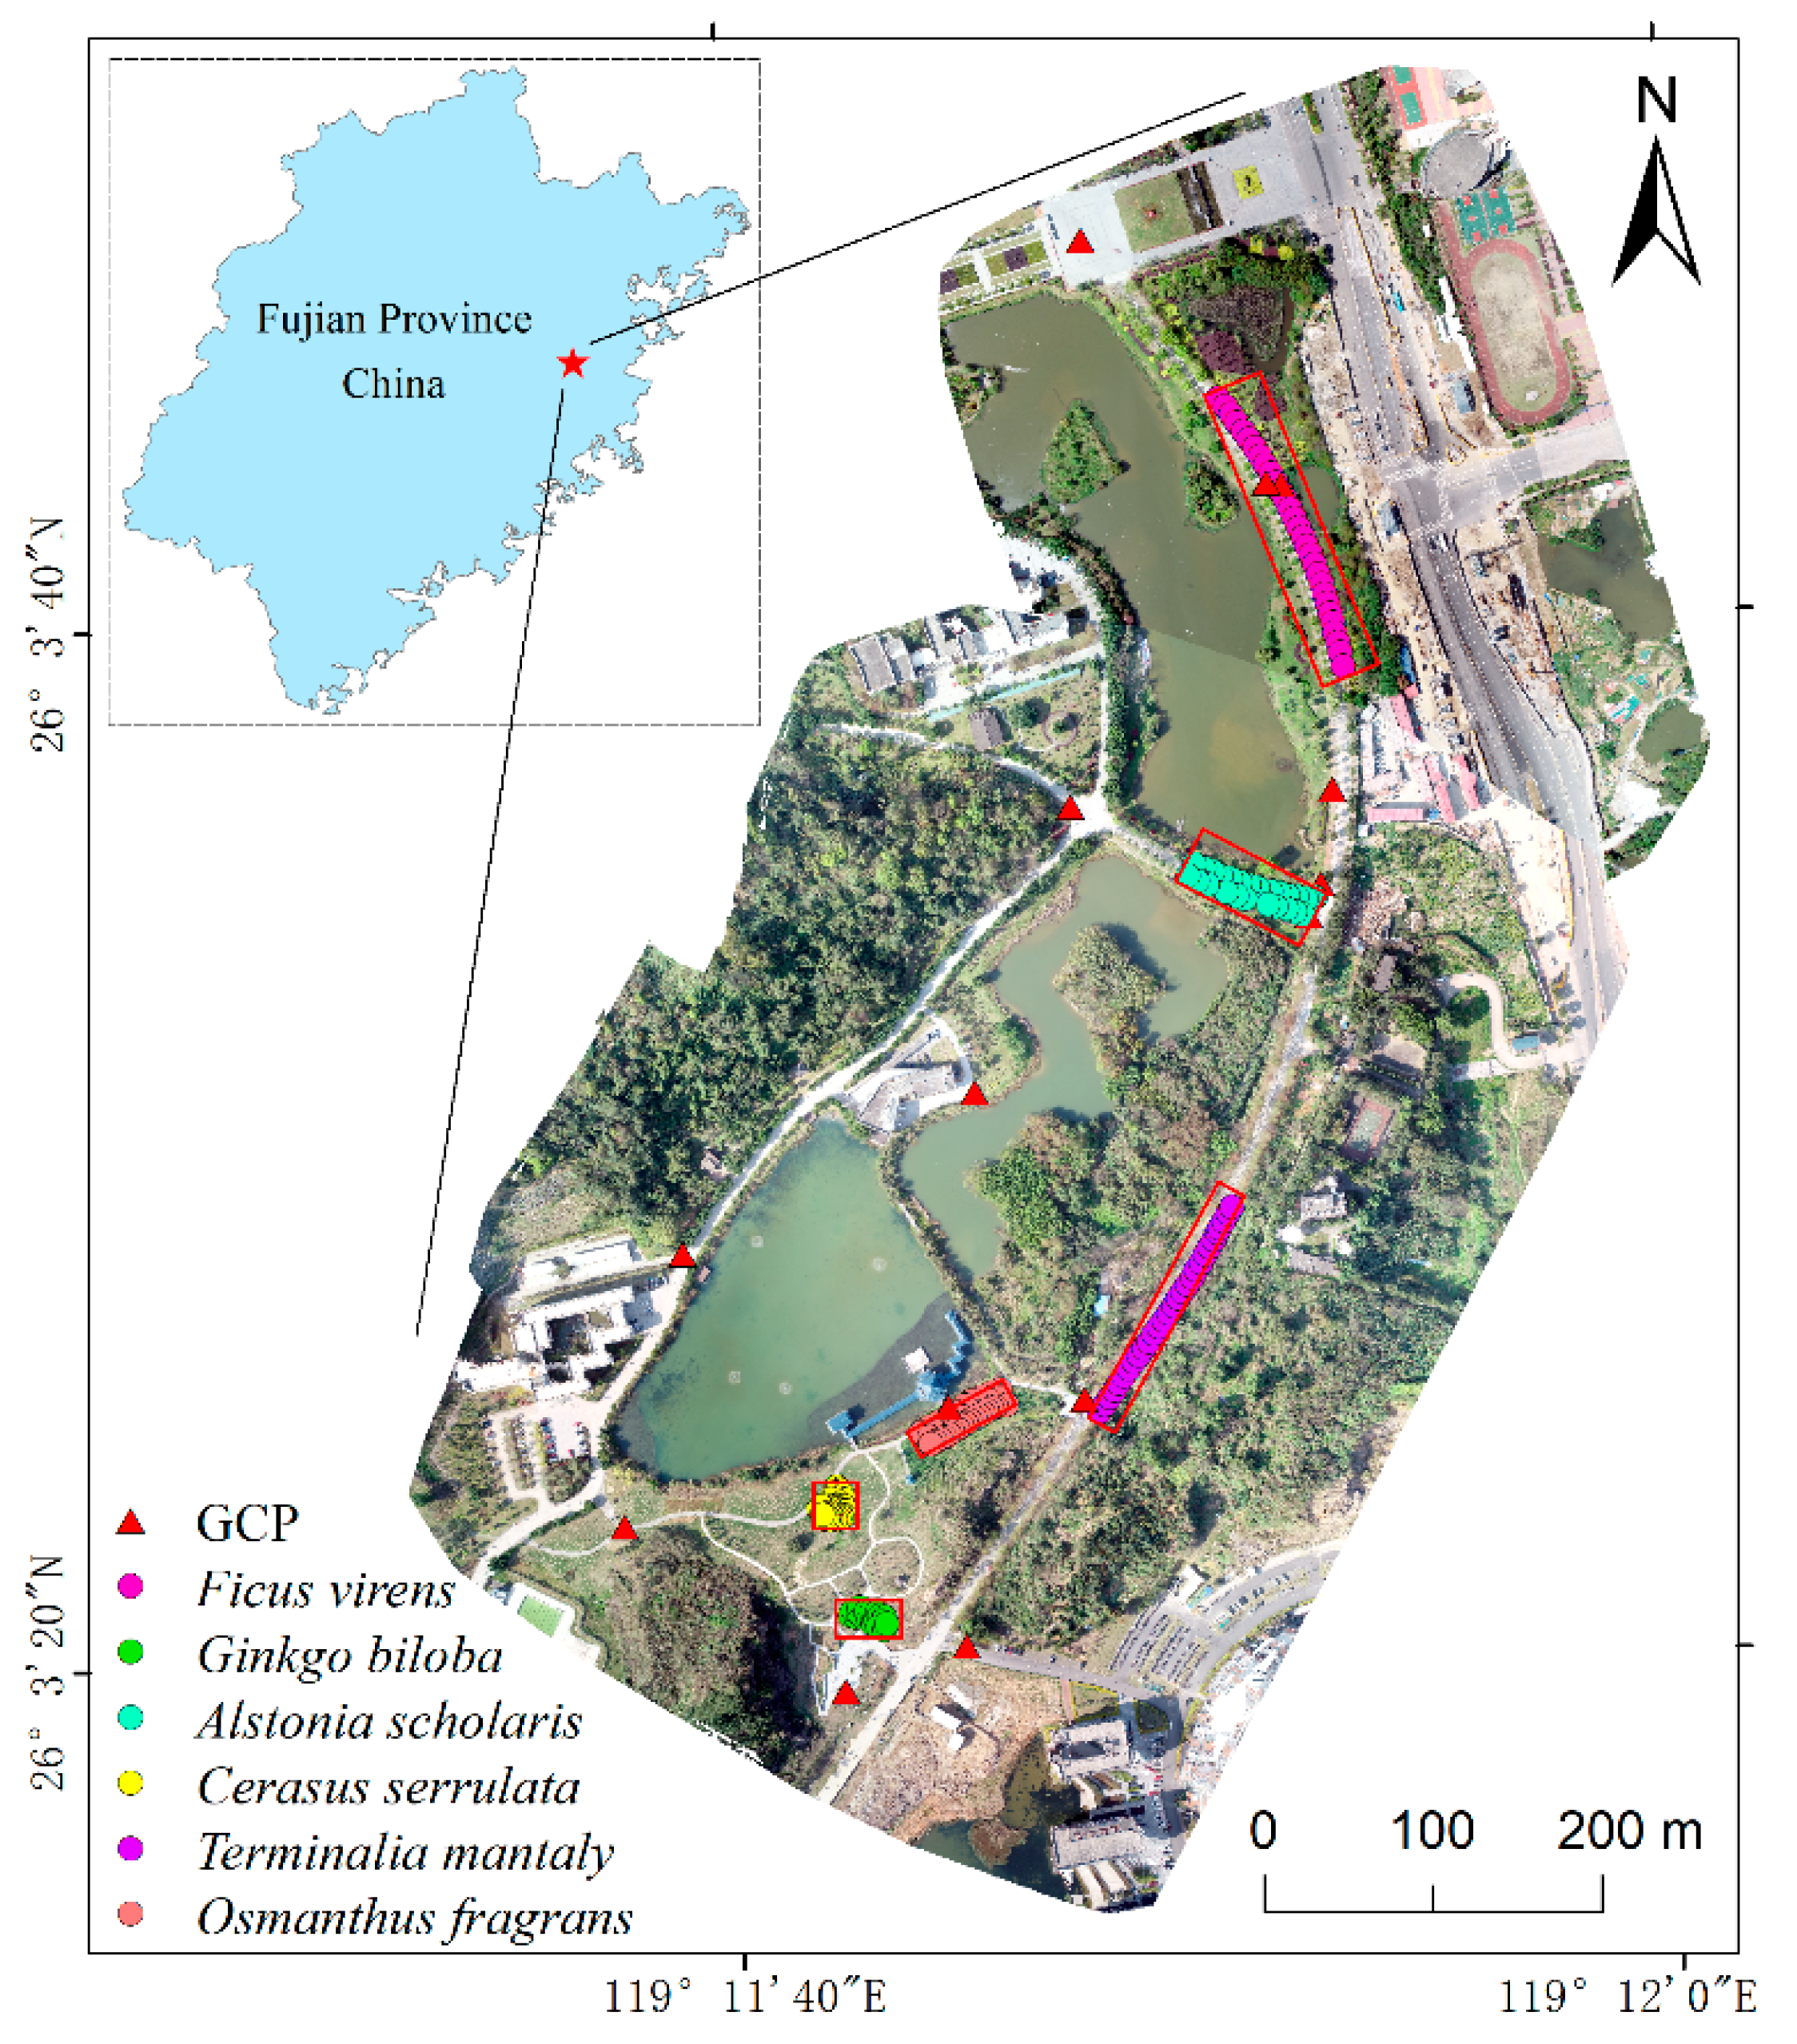
Figure 1. Study area in the Qishan Campus of Fuzhou University, China. The locations of the ground control points (GCPs) and tree samples are projected on the UAV orthophoto.
Forests 10 00931 g001
Figure 2. Ground perspective images of the six tree species. The first row shows Alstonia scholaris (AS) and Osmanthus fragrans (OF), which are evergreen trees that keep their leaves at all times; the 2nd (Terminalia mantaly—TM, and Ficus virens—FV) and 3rd (Cerasus serrulata—CS, and Ginkgo biloba—GB) rows show deciduous trees under leaf-off and leaf-on conditions during the UAV campaigns.
Forests 10 00931 g002
Figure 3. The conceptual workflow for UAV image processing and tree height extraction.
Forests 10 00931 g003
Figure 4. Photogrammetric point cloud time series of six tree species. The left column shows the point distributions during the three phenological periods (shown in different colors: March 29 is blue; April 17 is green; May 30 is light coral; the superimposed larger, solid red dots are field-measured tree heights for each tree plot). The right column shows the vertical profiles of the fractions of tree points from the given normalized point cloud. Note that for different tree plots, their sizes (distance is represented on the x-axis in the left column) are not the same; it is expected that there is some offset between the treetops and tree stem positions.
Forests 10 00931 g004
Figure 5. Box-and-whisker plot of the measured height and estimated height on the three dates for evergreen species AS (a) and OF (b). The red points indicate the tree height average; N is the sample size, which can be either the number of field-measured trees or the number of trees that were correctly detected from the photogrammetry point cloud.
Forests 10 00931 g005
Figure 6. Tree height estimation root mean square errors (RMSEs) and R2 values of evergreen species AS (a) and OF (b) on the three dates. The blue dots and lines are for the RMSEs, while the red dots and lines are for the R2 values.
Forests 10 00931 g006
Figure 7. Box-and-whisker plot of measured and estimated tree heights at three dates for deciduous species TM (a) and FV (b).
Forests 10 00931 g007
Figure 8. Box-and-whisker plot of the measured height and estimated height on the three dates for deciduous species CS (a) and GB (b).
Forests 10 00931 g008
Figure 9. Tree height estimated RMSE and R2 values of TM (a) and FV (b) on all three dates. The blue dots and lines are for the RMSEs, while the red dots and lines are for the R2 values.
Forests 10 00931 g009
Table 1. Tree height statistics of six species and their leaf conditions during the three UAV campaign periods (March 29, April 17, and May 30).
SpeciesNum.Tree Height (m)Canopy Condition
MinMaxMeanSTDMar. 29Apr. 17May 30
OF363.0545.4944.1070.532Leaf-onLeaf-onLeaf-on
AS254.9619.2857.0091.269
TM307.23515.79113.0771.774Some old leaves Sparse new leavesFull leaves
FV305.7299.7337.4321.604Leaf-off
CS352.0083.1762.5960.279Leaf-offSparsedenser
GB188.52712.57510.6261.150
Note: Num. is the number of samples; STD is the standard deviation.
Table 2. Tree height changes due to natural growth between March and May. The average and standard deviation in tree growth values during this period are listed. The negative value for gingko is unreasonable and may be caused by measurement error, as it was sometimes hard to determine the highest point in the canopy, especially for the leafless trees.
Species.Sample Number in MarchSample Number in JuneMean (m)STD (m)
AS2560.0450.025
OF36100.1900.095
TM30100.1750.147
FV30110.0870.118
CS35100.0700.083
GB189−0.0260.101
Table 3. Local maxima filter parameters (in meters) for different tree species used in this study.
SpeciesMean of Measured Crown Size of Fixed Window Minimum of Measured Tree Height hmin Threshold
AS3.955.04.9614
OF2.703.03.0542.5
TM3.845.08.5278
CS1.282.02.0081.5
GB6.737.07.2357
FV6.707.05.7295
Table 4. Digital elevation model (DEM) accuracy evaluation at three tree study sites on three dates. The R M S E H is the total error in the ground elevation; ME is the mean error.
Species.Number of Samples DateRMSEH (m)ME (m)
AS25Mar. 290.3540.213
Apr. 170.3440.206
May 300.2900.012
TM30Mar. 290.1740.129
Apr. 170.2330.185
May 300.1870.009
FV30Mar. 290.2740.172
Apr. 170.3360.232
May 300.2400.009
Table 5. Point density of trees detected from the photogrammetric point cloud on three dates. From the algorithm, the number of detected trees and their corresponding point clouds can be determined; thus, the average number of points per tree for the given period was calculated. The last column shows how the point density per tree changes with time. (NA: not available).
SpeciesDateNum. of Detected TreesNum. of Points per TreePoint Density Ratio
ASMar. 2924560 1:0.71:1.59
Apr. 1721400
May 3022893
OFMar. 29312461:1.43:1.87
Apr. 1734352
May 3034460
TMMar. 29186431:1.55:4.52
Apr. 1720997
May 30242905
FVMar. 291010401:1.58:2.86
Apr. 17191644
May 30202977
CSMar. 290NANA:1:3.16
Apr. 17224
May 302776
GBMar. 290NANA:1:1.15
Apr. 171700
May 305808
Table 6. Individual tree detection results and height estimation accuracy on the three dates. TP (true positive), FN (false negative), FP (false positive), recall (r), precision (p), F (F score), RMSE, and ME are presented using the field measurements as references.
Species.Date.Num. of MeasuredNum. of DetectedTPFNFPrpFRMSE (m)ME (m)R2
ASMar. 29252424100.961.000.980.591−0.368 0.88
Apr. 172121400.841.000.910.434−0.257 0.92
May 302222300.881.000.940.486−0.153 0.87
OFMar. 29363231510.860.970.910.378−0.256 0.79
Apr. 173434200.941.000.970.359−0.214 0.81
May 303434200.941.000.970.3540.037 0.74
TMMar. 293019181210.600.950.732.894−2.615 0.30
Apr. 1720201000.671.000.801.665−1.367 0.58
May 302924650.800.830.810.729−0.632 0.94
FVMar. 2930311020210.330.320.331.433−1.339 0.47
Apr. 17341911150.630.560.591.110−0.882 0.58
May 3028201080.670.710.690.5970.215 0.76
CSMar. 293500350NANANANANANA
Apr. 17223300.061.000.110.644−0.462 NA
May 303427870.770.790.780.309−0.182 0.33
GBMar. 291800180NANANANANANA
Apr. 17111700.061.000.112.393NANA
May 30551300.281.000.431.132−0.749 NA