Relationship Between Fire and Forest Cover Loss in Riau Province, Indonesia Between 2001 and 2012


1
School of Earth and Environment, University of Leeds, LS2 9JT Leeds, UK
2
Computer Science Department, IPB University, Bogor 16680, Indonesia
*
Author to whom correspondence should be addressed.
Forests 2019, 10(10), 889; https://doi.org/10.3390/f10100889
Submission received: 8 August 2019
/
Revised: 30 September 2019
/
Accepted: 2 October 2019
/
Published: 8 October 2019
(This article belongs to the Special Issue Forest Land Use Cover Changes (LUCC) and Impacts on Environment in South/Southeast Asian Countries)
Abstract
:Forest and peatland fires occur regularly across Indonesia, resulting in large greenhouse gas emissions and causing major air quality issues. Over the last few decades, Indonesia has also experienced extensive forest loss and conversion of natural forest to oil palm and timber plantations. Here we used data on fire hotspots and tree-cover loss, as well as information on the extent of peat land, protected areas, and concessions to explore spatial and temporal relationships among forest, forest loss, and fire frequency. We focus on the Riau Province in Central Sumatra, one of the most active regions of fire in Indonesia. We find strong relationships between forest loss and fire at the local scale. Regions with forest loss experienced six times as many fire hotspots compared to regions with no forest loss. Forest loss and maximum fire frequency occurred within the same year, or one year apart, in 70% of the 1 km2 cells experiencing both forest loss and fire. Frequency of fire was lower both before and after forest loss, suggesting that most fire is associated with the forest loss process. On peat soils, fire frequency was a factor 10 to 100 lower in protected areas and natural forest logging concessions compared to oil palm and wood fiber (timber) concessions. Efforts to reduce fire need to address the underlying role of land-use and land-cover change in the occurrence of fire. Increased support for protected areas and natural forest logging concessions and restoration of degraded peatlands may reduce future fire risk. During times of high fire risk, fire suppression resources should be targeted to regions that are experiencing recent forest loss, as these regions are most likely to experience fire.
1. Introduction
Forest and peatland fires occur annually across Indonesia, resulting in large greenhouse gas emissions [1] and causing major regional air quality issues [2,3]. The occurrence of fire in Indonesia is influenced both by climate [4,5] and by extensive land-cover change [6]. There is an urgent need to better understand how agricultural and plantation management can be altered to minimize fire and associated environmental impacts [7,8]. Here we analyze twelve years of data on the occurrence of fire and data on tree cover loss to better understand links between fire and land-cover change in Riau Province, Indonesia.
Emissions from vegetation and peat fires in Indonesia contribute to climate change and cause severe regional air quality issues [2,3]. The large fires across Indonesia in September–October 2015, emitted 700–800 Tg CO2 [9,10], and exposed 69 million people to poor air quality [3]. Exposure to particulate pollution is estimated to have caused 11,880 mortalities in the short term [3] with as many as 100,300 premature mortalities over the longer term [11]. Peatland regions experiencing rapid land cover change and frequent fires in central and southern Sumatra and southwest Kalimantan contribute the most to regional air quality issues [12].
Extensive fires in Indonesia mainly occur during dry years linked to the El Niño Southern Oscillation and the Indian Ocean Dipole (IOD) [4], with a nonlinear sensitivity of fire to dry conditions [13]. However, despite the occurrence of drought years, large fire events did not occur prior to the 1960s in Sumatra and the 1980s in Kalimantan, periods when extensive land-cover change began [14]. Undisturbed tropical forests and peatlands are typically sufficiently wet to be resistant to fire [1,15]. Deforestation and forest degradation provide abundant fuels, and drainage of peatland soils accelerates groundwater drawdown increasing the flammability of peat [16]. This demonstrates how anthropogenic land-cover change has modified the occurrence of fire across Indonesia.
Fires now occur annually across extensive regions of Indonesia, even in years without drought [17]. Satellite studies of active fire detections [4,5,9] well as the area burned by fire [18] provide new information on the occurrence of fire and the relationship with climate and land-use change. Over a 10-year period, fires burned 16.2 Mha of Borneo, or 21% of the land surface [19].
Over the last few decades, Indonesia has also experienced extensive forest loss and conversion of forest to oil palm and wood fiber plantations [20], Harris, Goldman [21]. Satellite remote sensing has provided new understanding of the spatial and temporal rate of forest loss [22]. Between 1973 and 2015, 14.4 Mha of primary natural forest in Borneo was cleared [15]. The rate of tree cover loss in Indonesia increased from less than 10,000 km2 year−1 in 2000–2003 to over 20,000 km2 year−1 in 2011–2012, resulting in one of the largest increments of tree cover loss rate worldwide [23], although forest loss rates include clearance of timber plantations and oil palm estates. In total, 60,200 km2 of primary natural forest loss occurred across Indonesia over the period 2000 to 2012, increasing by 476 km2 year−1 Margono, Potapov [24]. The largest increase of primary tree cover loss occurred in wetland (peat) areas and almost all clearing of forests occurred on previously degraded land, meaning logging preceded land conversion. Forests in Indonesia contain important aboveground and below ground carbon stocks [25,26], meaning forest loss will alter the carbon balance in the region. Indonesia’s largest single driver of deforestation in 2001–2016 was oil palm plantations, which contributed 23% of deforestation nation-wide [27]. Recently, the dominant role of logging in the transformation of peat swamp forests in Southeast Asia has also been emphasized [28].
Land-cover change is connected to fire through a multi-year processes involving road building, logging, and forest fragmentation [29,30]. Since fire and deforestation have direct interactions, understanding the relationship between them is very important [31]. There are four major direct causes of fires in Indonesia: fire used as a tool in land clearance; accidental or escaped fires; fire used as a weapon in land tenure or land-use disputes; and fire connected with resource extraction [32]. The same study identified five underlying causes of fire: land tenure and land use allocation conflicts and competition, forest degradation practices, economic incentives/disincentives, population growth and migration, and inadequate firefighting and management capacity.
Forest fires are closely related to land cover dynamics in Indonesia. Fire activity is mostly detected in wood fiber (timber) concessions, both in Sumatra [33] and Kalimantan [19]. In Sumatra, 58% of the fires in 2013 occurred on land that had been forest five years previously [17]. In Riau, more than 90% of the area of severely burnt primary vegetation eventually changed land cover type over the period 1998–2002 [34]. At a study site in Riau Province, fire was used as a tool for land preparation by oil palm companies, industrial timber plantation, and smallholders, with crop planting often occurring shortly after burning, suggesting a link between fire and land-use change [35]. Albar [36] found that 72% of fire hotspots in Riau Province during 2006 to 2013 occurred within non-forest areas, with the number of fire hotspots increasing over this period. Comparing land-use and land-cover between one year before and three years after fire occurrences in Jambi, a province adjacent to Riau, shows that 20% of the area burned by fires became forest plantation, 27% became oil plantation and 52% was converted into small holder/community land area [37]. In Kalimantan, enhanced fire frequency occurs within 10 km of oil palm, with oil palm extent associated with increased fire frequency until covering 20% of an area [38].
Although these studies demonstrate that fire and land-cover change are closely linked, there is still limited information on the spatial and temporal relationship between fire and land-cover change for peatland regions of Indonesia. Specifically, there have been no detailed studies of how tree cover loss and fire frequency are related spatially and temporally across different land-cover and land-use types. We focus our analysis on hotspot dynamics related to tree cover loss for peat and mineral soils with a range of land-use types in Riau province, Sumatra, one of the most active fire regions in Indonesia. Our aim is to explore the spatial and temporal connections between fire and tree cover loss, providing new information to help forest management, peat restoration, and fire suppression efforts.
2. Materials and Methods
Our study area is Riau Province, Indonesia, situated in central eastern coast of Sumatra Island, facing the Strait of Malacca and adjacent to Singapore and Malaysia. Riau covers a geographic area of 89,691 km2 extending between 100°00′–105°05′ E and 01°05′ and 02°25′ S. In the early 1970s, Riau was still covered with extensive forest areas with over 95% of the province classified as state forest area at that time (Ministry of Forestry of the Republic of Indonesia 1986). Since the 1970s, Riau has experienced rapid expansion of plantation forestry. Agriculture (including forestry) is now a very important sector in this province, contributing approximately 20% of Gross Regional Domestic Product and accounting for 46% of the workforce. Oil palm plantations are important for development as they may decrease poverty in rural areas [39], providing economic benefits for around 2.6 million Indonesians [40].
We used data on fire hotspots and tree-cover loss, as well as information on the extent of peat land, protected areas, and concession areas of wood fiber, logging, and oil palm plantation (Figure 1). Peatland, concession area, and protected area extents in 2010 are from the World Resources Institute and accessed through Global Forest Watch (http://data.globalforestwatch.org/datasets). Concessions include oil palm, wood fiber, and logging concessions. Oil palm concessions are used for industrial-scale oil palm plantations. Wood fiber concessions are used for plantations of fast-growing tree species for wood pulp and paper production. Logging concessions are natural forest areas used for selective timber extraction [33]. Regions outside concessions and protected areas, are defined as “Other”. This “Other” land use is stated as a non-forest area (Area Penggunaan Lain/APL) by the Ministry of Forestry (Regulation No 50 Year 2009).
To study the effect of fire on land cover, such as in tropical deforestation [41], information on when and where fires burn is more useful than the exact area burnt. Active fire detection instruments are important in determining fire seasonality, timing, and interannual variations [42]. Information on the timing and location of fires was obtained from Moderate Resolution Imaging Spectro-radiometer (MODIS, NASA, USA) MCD14ML Global Monthly Fire Location Product Collection 6, which contains the geographic coordinates of individual active fire hotspots. Hotspot pixels are detected by the MODIS instrument on Terra and Aqua satellites. The Terra satellite passes the same region of Earth every 1–2 days at approximately 10:30 A.M. local time, while Aqua overpasses at 1:30 P.M. local time. The restricted satellite overpass time may result in missed fire detections due to cloud cover or fire occurring when the satellites are not overhead. For example, morning or evening fires will remain undetected.
The MODIS instrument has 36 bands with three spatial resolutions: 250 m (bands 1–2), 500 m (bands 3–7), 1000 m (bands 8–36). Fire pixels are detected based on the radiation emission of T4 mid-infrared (band 21 and 22) and T11 far-infrared (band 31) channels. Therefore, the spatial resolution of MODIS hotspots is 1 km. Other attributes include acquisition time, confidence level, and fire radiative power (FRP). The ranges for confidence class of fire pixel are low (0–30), nominal (30–80), or high (80–100) [43]. Previous work found a high commission error in areas of low fire activity [44], so we restrict our analysis to high confidence hotspots. The hotspot dataset is downloaded from https://firms.modaps.eosdis.nasa.gov/download/ and then subsequent analysis completed using R.
For information on tree cover loss we use the Global Forest Change (GFC) dataset [23] derived from band 3, 4, 5, and 7 of Landsat 7 Enhanced Thematic Mapper Plus (ETM+) images, with 30 m resolution. We use the Hansen_GFC-2017-v1.5 dataset, which contains information on tree canopy cover for year 2000 (treecover2000) and year of gross forest cover loss over the period 2000–2017 (lossyear). Tree cover loss over 2000 to 2017 period has not been produced in a consistent way, so we restrict our analysis to 2000 to 2012, when a consistent analysis of forest loss is available. Data was downloaded from https://earthenginepartners.appspot.com/science-2013-global-forest/download_v1.5.html. GFC defines trees as all vegetation taller than 5 m in height. Forest loss occurs when tree cover declines to <50%, and includes loss of forest as a result of fire. Forest loss includes clearance of plantations and oil palm estates as well as loss of natural forest.
3. Results
Table 1 summarises fire hotspot frequency and tree cover loss in Riau Province between 2001 and 2012. Over that period, there were 44,043 high confidence hotspots and 33,334 km2 of tree cover loss, accounting for 37% of the province. In the year 2000, 88% of Riau was covered with forest (defined as tree cover ≥ 50%) with 42% of this forest lost between 2001 and 2012. On average, there are 0.49 hotspot km−2, or 1.32 hotspots per km2 of tree cover loss. Over the 2001 to 2012 period, 58% of 1 km2 cells experienced tree loss greater than 10% and 18% of cells experienced at least one fire hotspot.
Table 1 also gives the fire hotspot frequency and tree cover loss for peatland and non-peatland areas. Riau consists of 57% non-peatland and 43% peatland areas. Both peatland and non-peatland areas experienced a similar area tree cover loss of around 16,500 km2, accounting for 43% of peatland and 32% of non-peatland areas. Hotspot density is a factor of three greater on peatlands compared to non-peatlands, being on average 0.06 km−2 year−1 in peatland areas and 0.02 km−2 year−1 in non-peatlands.
Figure 2 shows the relationship between annual rates of forest loss and annual number of fire hotspots between 2001 and 2012 across Riau. Both tree cover loss and the number of fire hotspots were greatest in 2005. The correlation between total annual number of hotspots and annual rate of tree cover loss is not significant at the provincial level (Figure 2a, r2 = 0.158). Over the period 2001 to 2012, there was an insignificant change in the annual number of fire hotspots (−35 hot spots year−1), whilst the rate of tree cover loss increased significantly (p < 0.05) by 186 km2 year−1 (Figure 2b). The increase in forest loss rate despite no increase in fire may be partly due to large companies transitioning from using fire to using mechanical methods to clear land [45]. We explore this possibility in more detail later in the paper.
Figure 3 shows hotspot density as a function of tree cover in the year 2000 and tree cover loss (2000 to 2012). In both peat and non-peat regions, annual hotspot densities are relatively low in intact areas with high fractional tree cover in 2000 and low fractional tree cover loss as well as in heavily developed areas with low tree cover in 2000. Highest hotspot densities are found in regions which lost all their tree cover, either areas with high tree cover in 2000 and high fractional loss or regions with intermediate tree cover in 2000 and intermediate tree cover loss.
Table 2 shows average hot spot densities for regions categorised by their tree cover in 2000 and by the fractional tree cover loss over the period 2000 to 2012. We found the hotspot density to be 0.042 km−2 year−1 in regions with forest cover in the year 2000 (>50% canopy cover in year 2000) compared to 0.023 km−2 year−1 in regions with no forest cover in the year 2000. The hotspot density in regions of forest loss (>10% loss) was 0.138 km−2 year−1, a factor 6.5 greater than the hotspot density of 0.021 km−2 year−1 in regions with no forest loss.
Figure 4 shows these results separately for peat and non-peat areas. Peatland areas experienced higher hotspot density than non-peat areas in all forest and loss status categories. In forested peatland areas, regions with tree cover loss experienced 8 times more fire hotspots that regions without tree cover loss.
Table 3 shows fire hotspot frequency and tree cover loss for the different land-use types. Wood fiber concession areas had the highest proportional forest loss (5.8% year−1) and hotspot density (0.06 km−2 year−1). Previous studies have also found that fire was greatest in wood fiber concessions in Sumatra [46]. Protected areas experienced the lowest proportional forest loss rate (1% year−1) and hotspot density (0.018 km−2 year−1). We calculate that the average forest loss rate in oil palm plantations in Riau was 2.8% year−1, less than the mean rate of 7.5% year−1 in oil palm plantations across Sumatra [47]. Further analysis is required to understand whether this discrepancy is due to a different oil palm plantation development stage between Riau and another regions in Sumatra [48]. As reported previously [33], areas outside protected areas and concessions, here categorized as “Other”, experienced similar rates of proportional forest loss (2.6% year−1) and hotspot density (0.038 km−2 year−1) compared to concessions.
To explore relationships between fire hotspots and tree cover loss, we analyzed the fire dynamics based on both land-use and land type (peatland or non-peatland). Figure 5a shows the area of each land-use type in Riau, separately shown for peatland and non-peatland areas. Non-peatland areas are dominated by “other” (51%) and oil palm (25%), whereas peatlands are dominated by “other” (43%), wood fiber (27%) and oil palm (19%). In both peatlands and non-peatlands, the smallest areas was taken by logging concessions.
Since “other” areas cover the majority of the region, then, not surprisingly, these also suffered the largest extent of tree cover loss, accounting for 40% of provincial forest loss (Figure 5b). Although wood fiber concessions only accounted for 11% of land area in non-peatlands and 27 % in peatland area, they had 26% and 41% of tree cover loss, respectively. In contrast, protected areas accounted for 11% of non-peatland areas and 6% of peatland areas experienced only 5.8% and 0.6% of the tree cover loss, respectively.
In peatland areas, the majority of hotspots occurred on “other”, wood fiber, and oil palm concession, with very few hotspots in protected areas or logging concessions (Figure 5c). In non-peatland areas, hotspots occurred mostly in “other” land use (44%), with 27% in wood fiber, 24% in oil palm, 4% in protected area, and 1 % in logging concession area.
Figure 6 illustrates hotspot density and fractional tree cover loss within each land-use type separately for peatland and non-peatland areas (Table 4). The greatest fractional forest loss occurred in logging concessions in non-peatland areas (81%) and in wood fiber concessions in both peatland (67%) and non-peatland (71%) areas. Oil palm concessions experienced 25% forest loss in non-peatlands and 51% in peatlands. In contrast, logging concessions experienced a very high rate of tree cover loss in non-peatlands (81%), but only 13% in peatlands. Protected areas experienced the lowest fractional tree cover loss of 5% in peatlands and 17% in non-peatland areas.
For each concession type, peatland areas had higher hotspot density compared to non-peatland areas, except for logging and protected areas, where this pattern reversed. In peatland areas, hot spot density is greatest on oil palm (0.09 km−2 year−1) and wood fiber (0.08 km−2 year−1) concessions. From 2002 to 2015, an average fire rate over oil palm plantations in Sumatra and Kalimantan of 0.078 hotspot km−2 year−1 has been reported [47], similar to the rate we report for oil palm on peatlands. On non-peatlands, hot spot density is greatest on logging concessions (0.08 km−2 year−1), but less than 0.03 km−2 year−1 in all other land cover types. On peatlands, the lowest hotspot density is observed in logging concessions (0.0008 km−2 year−1) and protected areas (0.008 km−2 year−1), possibly due to the lack of drainage and higher forest cover in these land covers making them less susceptible to fire. Protected areas also have low hotspot density on non-peat soils (0.02 km−2 year−1). In peatland areas, we found that the hotspot density in oil palm and wood fiber concessions is more than a factor 100 greater than in logging concessions and a factor 10 greater than in protected areas. A previous study also found fire ignition density in Kalimantan was substantially greater in non-forest (0.06 km−2) and oil palm (0.055 km−2) compared to forest (0.006 km−2) areas [49].
Across these different land-covers, there is a significant correlation between fire hotspot density and proportional forest loss rates (r2 = 0.55, p = 0.01, Figure 6b). Across all land use types, stronger correlations exist for peat areas (r2 = 0.84, p = 0.03) compared to non-peat areas (r2 = 0.6, p = 0.1). Analyzing land-use over peatland and non-peatland separately shows that peatlands experience double the number of fire hotspots in relation to forest loss compared to non-peatland areas (see gradients of linear regressions in Figure 4b). On non-peat areas, wood fiber concessions experience relatively little fire in relation to the rate of forest loss. On peat areas, oil palm concessions experience a lot of fire in relation to the rate of forest loss.
Figure 7 shows the relationship between annual forest loss and number of hotspots within each land-use type. Relationships between annual forest loss and annual number of hotspots are generally positive. Logging concessions and protected areas exhibit strong correlations (r2 > 0.45) between annual forest loss and fire in both peat and non-peat areas. In contrast, relationships in wood fiber and oil palm concessions are weak (r2 < 0.2) in both peat and non-peat areas. Across all land-use types, correlations are stronger in peatland compared to non-peatland areas.
Figure 8 shows the rate of change of annual number of fire hotspots and annual tree cover loss over the period 2001 to 2012 for different concession types in peatland and non-peat regions. The rate of tree cover loss increased in all areas, but particularly in wood fiber concessions and Other, which account for 40% and 43% of the province-wide increment in tree cover loss. Fire shows different behavior, with little significant change in the number of fire hotspots. On peatlands, oil palm and wood fiber concessions exhibit non-significant declines in the number of fire hotspots.
In Table 5 we explored the relationships between tree cover loss and hotspots at the local scale. Of the 1 km2 cells that experienced > 10% forest loss, 45% experienced at least one fire hotspot. In contrast, of the 1 km2 cells that did not experience forest loss, only 13% experienced at least one fire hotspot. We found that 92% of fire hotspots occurred in pixels that were forest in 2001 (> 50% forest cover in 2000) and 8% occurred in non-forest pixels. In Kalimantan, most fires occur in non-forest areas [49], but the relationship with former land cover was not explored.
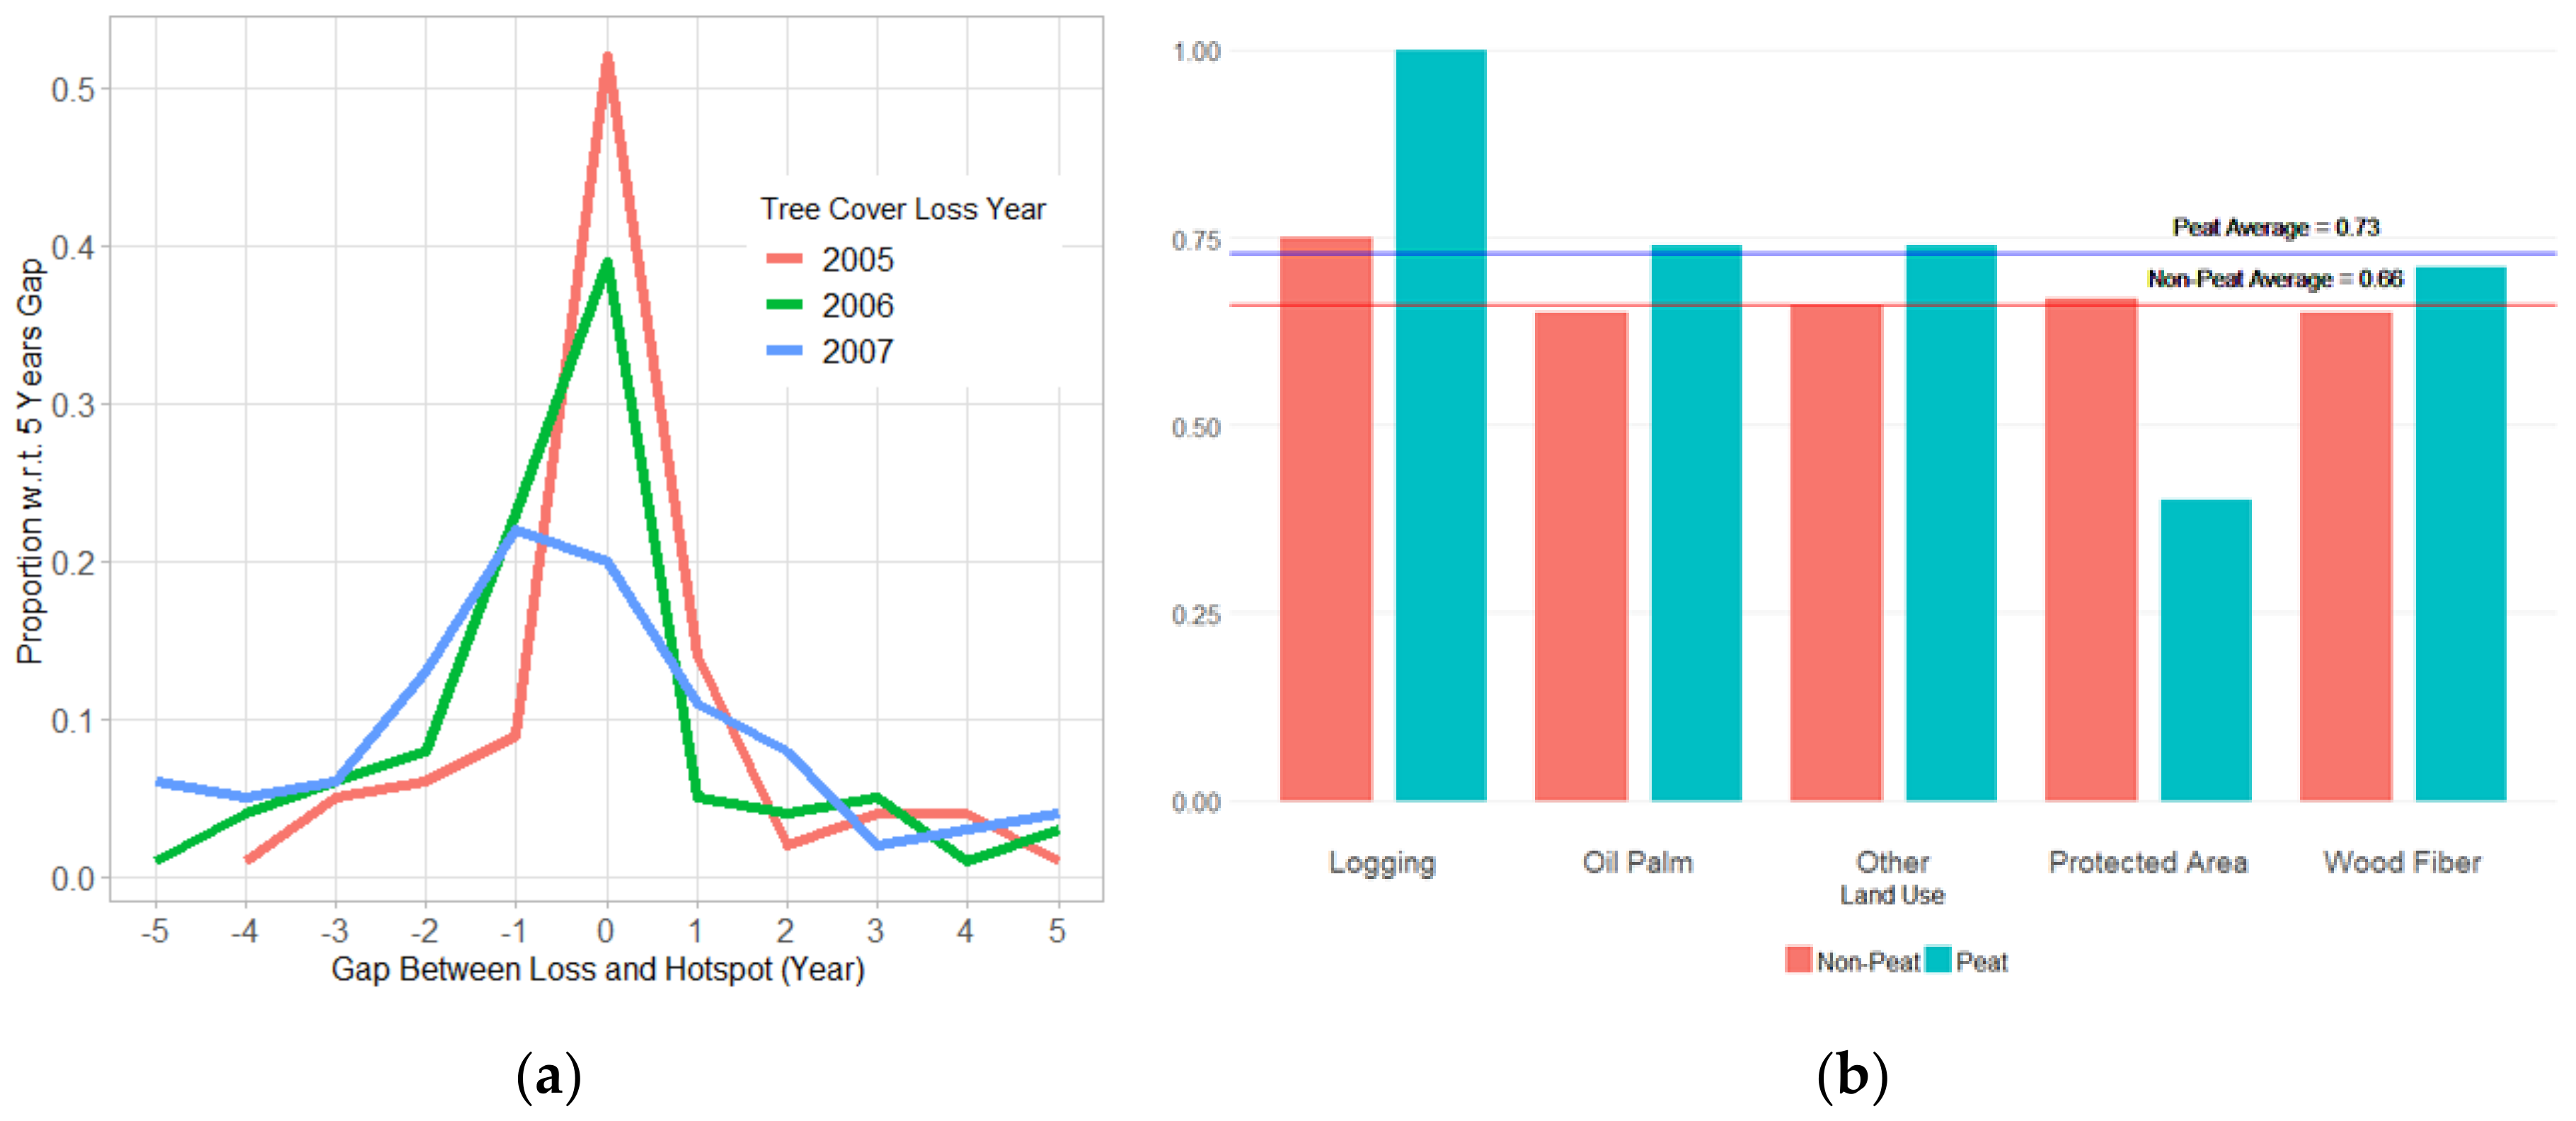
Figure 9 shows the time difference between the year of tree cover loss and the year with maximum number of hotspots. We restrict this analysis to tree cover loss occurring during 2005 to 2007, which are the central years in our datasets and allow for an equal number of years before and after any tree cover loss. Across all of Riau, the year with the maximum number of fire hotspots occurred within one year of the year tree cover loss in 70% of 1 km2 cells. That indicates that in these regions, tree cover loss and fire are closely linked. In 17% of cells, the year with the maximum number of fire hotspots occurred 2 to 5 years before tree cover loss, whilst in 14% of cells, the maximum number of fire hotspots occurs between two and five years after the year of forest loss. Figure 9b shows the fraction of cells in which the year with maximum number of hotspots occurred within one year of tree cover loss. In peat lands, hotspots occurs in the same year as tree cover loss in 73% of cells, compared to 66% in non-peatlands. It was estimated that 25% of forest loss in Indonesia involved fire (co-located fire occurred in the same year or the year before forest loss) [50].
4. Discussion
We find that fire in Riau is closely linked to forest loss, both temporally and spatially. We show that the number of fire hotspots is a factor of 6 greater in regions of forest loss compared to regions of no loss. Fire frequency was greatest in regions that were covered in forest in 2000 and lost all their forest cover between 2001 and 2012 (Figure 3). We also show that forest loss and fire occur within one year of each other in 70% of 1 km2 cells, with the frequency of hotspots substantially lower before and after forest loss (Figure 9).
There are two possible reasons for this observed relationship between fire and forest loss. Either the fire causes the forest loss, or forest loss makes the landscape more susceptible to fire. Since fire frequency is lower after forest loss and similar to the rate before forest loss occurred (Figure 9), we suggest that the loss of forest canopy is not the main cause of increased fire during the period of forest loss. Instead, it appears that the fires contribute to loss of canopy cover. In tropical regions with naturally high tree cover, fires can cause substantial tree mortality [51,52]. A study in Kalimantan found fires cause complete mortality for small trees, but less mortality for larger trees [53]. Fires are frequently ignited to clear vegetation and prepare land for agriculture and plantations [54]. Across Indonesian oil palm concessions, 25% of forest loss experienced coincident fire the same year or one year before forest loss [50]. A detailed analysis of fires occurring in Riau during 1st January 2013 to 30 June 2017, found that fires in natural forests occurred on average 59 ± 10 days before forest loss [55]. Land in Riau that had been cleared and burnt (slashed and burnt) is worth substantially more than land that had only been cleared [56], explaining a strong economic driver for the patterns we observed. The close link between forest loss and fire suggests that fire may start to decline in areas where all-natural forest has already been converted. Indeed, previous studies have shown that when oil palm extent increases to greater than 20% of a region, fire frequency declines, possibly because most areas of natural forest areas have already been lost and so forest loss rates decline [38].
Our analysis shows that peatlands in Riau experience more frequent fire compared to non-peat regions. Forested peatlands that experienced no forest loss had the lowest frequency of fire, whilst peatland areas experiencing forest loss experienced 8 times as frequent fire. This confirms numerous studies showing the prevalence of fire on degraded peatlands [1,57,58]. Peatlands would naturally be mostly too wet to burn. Drainage canals dug to extract timber and for establishment of oil palm plantations lower the water table and make the peat more flammable and susceptible to fire [57]. Reducing the frequency of fire on peatlands needs to be a priority and will require restoration, involving rewetting and re-vegetating degraded peatlands, to reduce the flammability of the landscape [57,59]. However, fire management involves a diverse range of stakeholders, meaning management interventions that aim to reduce fire are difficult to deliver [60].
We find that areas with high forest cover and low forest loss experience little fire. An analysis of the fires in 2015 confirms that pristine peatland forests experienced few fires even during a strong El Nino year [61]. Pan-tropical studies confirm that regions with high forest cover typically have low fire frequency [51,62]. However, in contrast to relationships seen at the pan-tropical scale, we find that areas with low tree cover and little forest loss also experience little fire. We found the greatest frequency of fire in Riau, both spatially and temporally, was connected to tree cover loss. Similarly, previous studies reported that heavily degraded forest areas in Sumatra experienced 20 times the number of fire hotspots compared to intact peatland forests [63].
Regions that are classified as forest in our analysis may have been heavily degraded by logging or fire before forest loss occurs. In our analysis, areas are still defined as forest as long as they retain >50% canopy cover with vegetation > 5 m in height. Forests that have burned once are more likely to burn again [64]. Forest degradation caused by logging or forest fragmentation can increase the flammability of the forest and the likelihood of fire [65,66]. In support of this, we found natural forest logging concessions on non-peat soils had a high frequency of fire. In contrast, we found natural forest logging concessions on peat soils had a very low frequency of fire, suggesting these forests were not heavily degraded. Another study on Borneo did not find any association between logging and fire [38]. Further understanding of potential feedbacks between forest degradation and fire are important, but are not well captured in our analysis, since we do not have information of the extent of forest degradation.
On peatland areas, we find that rates of forest loss and frequency of fire are typically lower in natural forest logging concessions and protected areas than other land-use types. Previous work has also found protected areas reduce deforestation in Sumatra [67], although lower rates of deforestation inside protected areas may partly be due to topography rather than a result of legal protection [68]. Policies that help support effective protected area management and efforts to grant protected area status to remaining peatland forests, 45% of which are currently unprotected [69], may reduce future forest loss and fire. Other forest management strategies may be able to play an important role. For example, community forest management in Sumatra and Kalimantan (Hutan Desa) reduces deforestation rates [70], though there are currently only very limited regions under this management scheme in Riau, so it is not possible to determine whether this could help reduce forest loss or fire in this province.
High rates of forest loss and frequent fire occur in peatland regions covered by oil palm and wood fiber concession, as well as areas outside industrial concessions, where smallholder agriculture is important (“Other”). The importance of areas outside of industrial concessions has been found by previous studies [38,69]. Wood fiber concessions and these areas outside of industrial concessions account for 80% of the increased rate of forest loss observed in Riau between 2001 and 2012. Most existing efforts to improve management of concessions focus on oil palm. Our work demonstrates a need for fire management to focus on wood fiber concessions, smallholders, and local communities. Previous studies have found a varying impact of Roundtable on Sustainable Palm Oil (RSPO) certification on forest loss and fire in oil palm concessions [47,50,71]. Our analysis shows that oil palm and wood fiber concessions exhibit increasing rates of forest loss but little increase in fire over the period 2001 to 2012, suggesting that conversion practices may slowly be shifting from using fire to mechanical methods for removal of forest vegetation. Some plantation companies have committed to preserve remaining natural forest in their concessions, however, we do not see any reduction in forest loss rates over the period we analyze, though we acknowledge that our analysis finishes in 2012. Ecosystem restoration licences have been obtained for two large wood fiber concession areas in Riau, allowing restoration of logged forests and degraded peatlands [69]. Future work is required to demonstrate that restoration efforts can reduce fire.
Our analysis is limited by available data on concession types; overlapping concessions cause issues for relating fire and forest loss to specific concession types [72]. The satellite data we use on forest loss cannot distinguish between loss of natural forest and clearance of oil palm and wood plantations. Future work needs to explore specific land-use transitions and relate these to occurrence of fire.
5. Conclusions
We have explored the relationship among fire, land-use, and land-cover change in Riau Province, Indonesia, over the period 2001 to 2012. We found that at the local (1 km) scale, fire and forest loss were closely related both spatially and temporally. The majority of fire in Riau occurs in regions that are also experiencing forest loss. This finding has important implications for forest management and fire suppression efforts in Riau.
On the local scale, we found strong spatial and temporal associations between forest loss and fire. The frequency of fire was a factor of 6 greater in regions that had experienced forest loss compared to regions that had not experienced forest loss. For 70% of the 1 km2 cells experiencing forest loss, the year with the maximum number of hotspots coincided within one year of forest loss. The frequency of fire declined in the years after forest loss, confirming that fire and forest loss are closely linked.
Peatland areas experienced greater fire frequency and faster rates of forest loss compared to non-peatland areas. Hotspot density was a factor of 3 greater on peatlands compared to non-peatlands, and rates of forest loss were 30% faster on peatlands compared to those on mineral soils. There was also a close association between forest loss and fire - the frequency of fire was a factor of 8 greater in peatland areas that experienced forest loss compared to peatland regions that did not experience forest loss. Drainage of peatlands and loss of tree cover increases the flammability of peat and the likelihood of fire.
We found that different land-use types experienced widely varying rates of fire and forest loss. Of all the different land-use types, wood fiber concessions had the highest proportional rate of forest loss (5.8% year−1) and the highest hotspot density (0.06 km−2 year−1), whereas protected areas experienced the lowest proportional forest loss (1% year−1) and hotspot density (0.018 km−2 year−1). On peatlands, hotspot frequency in protected areas and logging concessions was a factor 10 to 100 lower than the hotspot frequency in oil palm and wood fiber concessions. Protected areas exhibited the lowest rates of forest loss and hotspot density on both peat and non-peat soils. Lower fire rates in protected areas and logging concessions on peatlands may be due to limited drainage and high canopy cover increasing soil moisture and reducing the potential for fire as well as a reduction in the potential for anthropogenic ignitions.
Efforts to reduce fire need to address this underlying role of land-use and land-cover change in the occurrence of fire. Supporting effective management of existing protected areas and logging concessions and expanding the protected area network to include unprotected forested peatlands may be an effective way to reduce future fire risk and forest loss. Reducing the risk of future fire will also require extensive peatland restoration, involving rewetting and revegetation of degraded peatlands [57]. The Indonesian Peatland Restoration Agency has a mandate to restore 2 million hectares of fire-damaged peatlands by 2020, and needs to be adequately resourced. Targeting fire suppression activities to areas of natural forest adjacent to areas with recent forest loss maybe be an effective way to prioritize fire suppression capacity in period of high fire risk.
Author Contributions
Project design—H.A.A., D.V.S., S.R.A. Analysis—H.A.A. Writing—original draft, H.A.A.; Writing—review & editing, D.V.S., S.R.A.
Funding
This research is part of PhD study funded by Indonesian Endowment Fund for Education (LPDP) and partly funded by the TransFoRM (Transboundary Fire Haze: Regional Characterization, Prediction and Mitigation in South-East Asia) project through the British Council Institutional Links (grant no. 332397925).
Conflicts of Interest
The authors declare no conflict of interest.
References
- Page, S.E.; Siegert, F.; Rieley, J.O.; Boehm, H.-D.V.; Jaya, A.; Limin, S. The amount of carbon released from peat and forest fires in Indonesia during 1997. Nature 2002, 420, 61–65. [Google Scholar] [CrossRef] [PubMed]
- Marlier, M.E.; Ruth, S.D.; Apostolos, V.; Patrick, L.K.; James, T.R.; Drew, T.S.; Yang, C.; Greg, F. El Niño and health risks from landscape fire emissions in Southeast Asia. Nat. Clim. Chang. 2013, 3, 131–136. [Google Scholar] [CrossRef] [PubMed]
- Crippa, P.; Castruccio, S.; Archer-Nicholls, S.; Lebron, G.B.; Kuwata, M.; Thota, A.; Sumin, S.; Butt, E.; Wiedinmyer, C.; Spracklen, D.V. Population exposure to hazardous air quality due to the 2015 fires in Equatorial Asia. Sci. Rep. 2016, 6, 37074. [Google Scholar] [CrossRef] [PubMed] [Green Version]
- Fanin, T.; Van Der Werf, G.R. Precipitation–fire linkages in Indonesia (1997–2015). Biogeosciences 2017, 14, 3995–4008. [Google Scholar] [CrossRef]
- Van der Werf, G.R.; Dempewolf, J.; Trigg, S.N.; Randerson, J.T.; Kasibhatla, P.S.; Giglio, L.; Murdiyarso, D.; Peters, W.; Morton, D.C.; Collatz, G.J.; et al. Climate regulation of fire emissions and deforestation in equatorial Asia. Proc. Natl. Acad. Sci. USA 2008, 105, 20350–20355. [Google Scholar] [CrossRef] [Green Version]
- Langner, A.; Miettinen, J.; Siegert, F. Land cover change 2002–2005 in Borneo and the role of fire derived from MODIS imagery. Glob. Chang. Boil. 2007, 13, 2329–2340. [Google Scholar] [CrossRef]
- Meijaard, E.; Sheil, D. The Moral Minefield of Ethical Oil Palm and Sustainable Development. Front. For. Glob. Chang. 2019, 2, 22. [Google Scholar] [CrossRef]
- Wijedasa, L.S.; Jauhiainen, J.; Könönen, M.; Lampela, M.; Vasander, H.; Evers, S.; Yule, C.M.; Varkkey, H.; Lupascu, M.; Parish, F.; et al. Denial of long-term issues with agriculture on tropical peatlands will have devastating consequences. Glob. Chang. Boil. 2017, 23, 977–982. [Google Scholar] [CrossRef] [Green Version]
- Kiely, L.; Spracklen, D.V.; Wiedinmyer, C.; Conibear, L.; Reddington, C.L.; Archer-Nicholls, S.; Lowe, D.; Arnold, S.R.; Knote, C.; Khan, M.F.; et al. New estimate of particulate emissions from Indonesian peat fires in 2015. Atmos. Chem. Phys. Discuss. 2019, 19, 11105–11121. [Google Scholar] [CrossRef] [Green Version]
- Huijnen, V.; Wooster, M.J.; Kaiser, J.W.; Gaveau, D.L.A.; Flemming, J.; Parrington, M.; Inness, A.; Murdiyarso, D.; Main, B.; Van Weele, M. Fire carbon emissions over maritime southeast Asia in 2015 largest since 1997. Sci. Rep. 2016, 6, 26886. [Google Scholar] [CrossRef] [Green Version]
- Koplitz, S.N.; Mickley, L.J.; E Marlier, M.; Buonocore, J.J.; Kim, P.S.; Liu, T.; Sulprizio, M.P.; DeFries, R.S.; Jacob, D.J.; Schwartz, J.; et al. Public health impacts of the severe haze in Equatorial Asia in September–October 2015: demonstration of a new framework for informing fire management strategies to reduce downwind smoke exposure. Environ. Res. Lett. 2016, 11, 94023. [Google Scholar] [CrossRef]
- Reddington, C.L.; Yoshioka, M.; Balasubramanian, R.; Ridley, D.; Toh, Y.Y.; Arnold, S.; Spracklen, D.V. Contribution of vegetation and peat fires to particulate air pollution in Southeast Asia. Environ. Res. Lett. 2014, 9, 094006. [Google Scholar] [CrossRef] [Green Version]
- Field, R.D.; Van Der Werf, G.R.; Fanin, T.; Fetzer, E.J.; Fuller, R.; Jethva, H.; Levy, R.; Livesey, N.J.; Luo, M.; Torres, O.; et al. Indonesian fire activity and smoke pollution in 2015 show persistent nonlinear sensitivity to El Niño-induced drought. Proc. Natl. Acad. Sci. USA 2016, 113, 9204–9209. [Google Scholar] [CrossRef] [PubMed]
- Field, R.D.; Van Der Werf, G.R.; Shen, S.S.P. Human amplification of drought-induced biomass burning in Indonesia since 1960. Nat. Geosci. 2009, 2, 185–188. [Google Scholar] [CrossRef]
- Cochrane, M.A.; Schulze, M.D. Fire as a Recurrent Event in Tropical Forests of the Eastern Amazon: Effects on Forest Structure, Biomass, and Species Composition. Biotropica 1999, 31, 2. [Google Scholar] [CrossRef]
- Taufik, M.; Torfs, P.J.J.F.; Uijlenhoet, R.; Jones, P.D.; Murdiyarso, D.; Van Lanen, H.A.J. Amplification of wildfire area burnt by hydrological drought in the humid tropics. Nat. Clim. Chang. 2017, 7, 428–431. [Google Scholar] [CrossRef] [Green Version]
- Gaveau, D.L.A.; Salim, M.A.; Hergoualc’H, K.; Locatelli, B.; Sloan, S.; Wooster, M.; Marlier, M.E.; Molidena, E.; Yaen, H.; DeFries, R.; et al. Major atmospheric emissions from peat fires in Southeast Asia during non-drought years: evidence from the 2013 Sumatran fires. Sci. Rep. 2014, 4, 6112. [Google Scholar] [CrossRef]
- Giglio, L.; Boschetti, L.; Roy, D.P.; Humber, M.L.; Justice, C.O. The Collection 6 MODIS burned area mapping algorithm and product. Remote Sens. Environ. 2018, 217, 72–85. [Google Scholar] [CrossRef]
- Langner, A.; Siegert, F. Spatiotemporal fire occurrence in Borneo over a period of 10 years. Glob. Chang. Boil. 2009, 15, 48–62. [Google Scholar] [CrossRef]
- Gaveau, D.L.A.; Sheil, D.; Husnayaen; Salim, M.A.; Arjasakusuma, S.; Ancrenaz, M.; Pacheco, P.; Meijaard, E. Rapid conversions and avoided deforestation: examining four decades of industrial plantation expansion in Borneo. Sci. Rep. 2016, 6, 32017. [Google Scholar] [CrossRef]
- Harris, N.L.; Goldman, E.; Gabris, C.; Nordling, J.; Minnemeyer, S.; Ansari, S.; Lippmann, M.; Bennett, L.; Raad, M.; Hansen, M.; et al. Using spatial statistics to identify emerging hot spots of forest loss. Environ. Res. Lett. 2017, 12, 24012. [Google Scholar] [CrossRef]
- Hansen, M.C.; Stehman, S.V.; Potapov, P.V.; Arunarwati, B.; Stolle, F.; Pittman, K. Quantifying changes in the rates of forest clearing in Indonesia from 1990 to 2005 using remotely sensed data sets. Environ. Res. Lett. 2009, 4, 034001. [Google Scholar] [CrossRef]
- Hansen, M.C.; Potapov, P.V.; Moore, R.; Hancher, M.; Turubanova, S.A.; Tyukavina, A.; Thau, D.; Stehman, S.V.; Goetz, S.J.; Loveland, T.R.; et al. High-Resolution Global Maps of 21st-Century Forest Cover Change. Science 2013, 342, 850–853. [Google Scholar] [CrossRef] [PubMed] [Green Version]
- Margono, B.A.; Potapov, P.V.; Turubanova, S.; Stolle, F.; Hansen, M.C. Primary forest cover loss in Indonesia over 2000–2012. Nat. Clim. Chang. 2014, 4, 730–735. [Google Scholar] [CrossRef]
- Forest Carbon-Stock Estimates Based on National Forest Inventory Data. Available online: http://www.worldagroforestry.org/publication/forest-carbon-stock-estimates-based-national-forest-inventory-data (accessed on 1 October 2019).
- Ekadinata, A.E.; Dewi, S. Estimating Losses in Aboveground Carbon Stock from Land-Use and Land-Cover Changes in Indonesia (1990, 2000, 2005). Available online: http://www.worldagroforestry.org/publication/estimating-losses-aboveground-carbon-stock-land-use-and-land-cover-changes-indonesia. (accessed on 1 October 2019).
- Austin, K.G.; Schwantes, A.M.; Gu, Y.; Kasibhatla, P.S. What causes deforestation in Indonesia? Environ. Res. Lett. 2019, 14, 024007. [Google Scholar] [CrossRef]
- Dohong, A.; Aziz, A.A.; Dargusch, P. A review of the drivers of tropical peatland degradation in South-East Asia. Land Use Policy 2017, 69, 349–360. [Google Scholar] [CrossRef]
- Juárez-Orozco, S.M.; Siebe, C.; Fernández, D.F.Y. Causes and Effects of Forest Fires in Tropical Rainforests: A Bibliometric Approach. Trop. Conserv. Sci. 2017, 10. [Google Scholar] [CrossRef]
- Cochrane, M.A. Fire science for rainforests. Nature 2003, 421, 913–919. [Google Scholar] [CrossRef]
- Lavorel, S.; Flannigan, M.D.; Lambin, E.F.; Scholes, M.C. Vulnerability of land systems to fire: Interactions among humans, climate, the atmosphere, and ecosystems. Mitig. Adapt. Strat. Glob. Chang. 2006, 12, 33–53. [Google Scholar] [CrossRef]
- Dennis, R.A.; Mayer, J.; Applegate, G.; Chokkalingam, U.; Colfer, C.J.P.; Kurniawan, I.; Lachowski, H.; Maus, P.; Permana, R.P.; Ruchiat, Y.; et al. Fire, People and Pixels: Linking Social Science and Remote Sensing to Understand Underlying Causes and Impacts of Fires in Indonesia. Hum. Ecol. 2005, 33, 465–504. [Google Scholar] [CrossRef]
- E Marlier, M.; DeFries, R.S.; Kim, P.S.; Koplitz, S.N.; Jacob, D.J.; Mickley, L.J.; Myers, S.S. Fire emissions and regional air quality impacts from fires in oil palm, timber, and logging concessions in Indonesia. Environ. Res. Lett. 2015, 10, 85005. [Google Scholar] [CrossRef]
- Miettinen, J.; Liew, S.C. Connection between fire and land cover change in Southeast Asia: A remote sensing case study in Riau, Sumatra. Int. J. Remote Sens. 2005, 26, 1109–1126. [Google Scholar] [CrossRef]
- Suyanto, S.; Applegate, G.; Permana, R.P.; Khususiyah, N.; Kurniawan, I. The Role of Fire in Changing Land Use and Livelihoods in Riau-Sumatera.pdf. Eco. Soc. 2004, 9, 15. [Google Scholar] [CrossRef]
- Albar, I. Typology Analysis of Land and Forest Fire in Riau Province, Indonesia. International Workshop on Land Use/Cover Change and Air Pollution. In Proceedings of the International Workshop on Land Use/Cover Change and Air Pollution, Bogor, Indonesia, 4–7 August 2015. [Google Scholar]
- Prasetyo, L.B.; Dharmawan, A.H.; Nasdian, F.T.; Ramdhoni, S. Historical Forest fire Occurrence Analysis in Jambi Province During the Period of 2000–2015: Its Distribution & Land Cover Trajectories. Procedia Environ. Sci. 2016, 33, 450–459. [Google Scholar]
- Sloan, S.; Locatelli, B.; Wooster, M.J.; Gaveau, D.L. Fire activity in Borneo driven by industrial land conversion and drought during El Niño periods, 1982–2010. Glob. Environ. Chang. 2017, 47, 95–109. [Google Scholar] [CrossRef]
- Bappenas, Analisis Provinsi Riau. Available online: https://static1.squarespace.com/static/57d5edcf197aea51693538dc/t/5c6cbb1aa4222f75067de956/1550629671736/eard_v9_1901-merged.pdf (accessed on 28 September 2019).
- Edwards, R.B. Export Agriculture and Rural Poverty: Evidence from Indonesian Palm Oil; Dartmouth College: Hanover, Germany, 2019. [Google Scholar]
- Lambin, E.F.; Ehrlich, D. The identification of tropical deforestation fronts at broad spatial scales. Int. J. Remote. Sens. 1997, 18, 3551–3568. [Google Scholar] [CrossRef]
- Eva, H.; Lambin, E.F. Remote Sensing of Biomass Burning in Tropical Regions. Remote. Sens. Environ. 1998, 64, 292–315. [Google Scholar] [CrossRef]
- Giglio, L. MODIS Collection 5 Active Fire Product User’s Guide Version 2.4; University of Maryland: College Park, MD, USA, 2010. [Google Scholar]
- Hantson, S.; Padilla, M.; Corti, D.; Chuvieco, E. Strengths and weaknesses of MODIS hotspots to characterize global fire occurrence. Remote. Sens. Environ. 2013, 131, 152–159. [Google Scholar] [CrossRef]
- Chisholm, R.A.L.; Wijedasa, S.; Swinfield, T. The need for long-term remedies for Indonesia’s forest fires. Conserv. Biol. 2015, 30, 5–6. [Google Scholar] [CrossRef]
- E Marlier, M.; DeFries, R.S.; Kim, P.S.; A Gaveau, D.L.; Koplitz, S.N.; Jacob, D.J.; Mickley, L.J.; A Margono, B.; Myers, S.S. Regional air quality impacts of future fire emissions in Sumatra and Kalimantan. Environ. Res. Lett. 2015, 10, 54010. [Google Scholar] [CrossRef]
- Carlson, K.M.; Heilmayr, R.; Gibbs, H.K.; Noojipady, P.; Burns, D.N.; Morton, D.C.; Walker, N.F.; Paoli, G.D.; Kremen, C. Effect of oil palm sustainability certification on deforestation and fire in Indonesia. Proc. Natl. Acad. Sci. USA 2017, 115, 121–126. [Google Scholar] [CrossRef] [PubMed] [Green Version]
- Pramudya, E.P.; Hospes, O.; Termeer, C.J.A.M. The disciplining of illegal palm oil plantations in Sumatra. Third World Q. 2018, 39, 920–940. [Google Scholar] [CrossRef]
- Noojipady, P.; Morton, D.C.; Schroeder, W.; Carlson, K.M.; Huang, C.; Gibbs, H.K.; Burns, D.; Walker, N.F.; Prince, S.D. Managing fire risk during drought: the influence of certification and El Niño on fire-driven forest conversion for oil palm in Southeast Asia. Earth Syst. Dyn. Discuss. 2017, 8, 1–23. [Google Scholar] [CrossRef]
- Staal, A.; Van Nes, E.H.; Hantson, S.; Holmgren, M.; Dekker, S.C.; Pueyo, S.; Xu, C.; Scheffer, M. Resilience of tropical tree cover: The roles of climate, fire, and herbivory. Glob. Chang. Boil. 2018, 24, 5096–5109. [Google Scholar] [CrossRef] [Green Version]
- Slik, J.F.; Verburg, R.W.; Keßler, P.J. Effects of fire and selective logging on the tree species composition of lowland dipterocarp forest in East Kalimantan, Indonesia. Biodivers. Conserv. 2002, 11, 85–98. [Google Scholar] [CrossRef]
- Van Nieuwstadt, M.G.L.; Sheil, D. Drought, fire and tree survival in a Borneo rain forest, East Kalimantan, Indonesia. J. Ecol. 2005, 93, 191–201. [Google Scholar] [CrossRef]
- Sumarga, E. Spatial Indicators for Human Activities May Explain the 2015 Fire Hotspot Distribution in Central Kalimantan Indonesia. Trop. Conserv. Sci. 2017, 10, 1940082917706168. [Google Scholar] [CrossRef]
- Reiche, J.; Verhoeven, R.; Verbesselt, J.; Hamunyela, E.; Wielaard, N.; Herold, M. Characterizing Tropical Forest Cover Loss Using Dense Sentinel-1 Data and Active Fire Alerts. Remote Sens. 2018, 10, 777. [Google Scholar] [CrossRef]
- Purnomo, H.; Shantiko, B.; Sitorus, S.; Gunawan, H.; Achdiawan, R.; Kartodihardjo, H.; Dewayani, A.A. Fire economy and actor network of forest and land fires in Indonesia. For. Policy Econ. 2017, 78, 21–31. [Google Scholar] [CrossRef]
- Page, S.E.; Hooijer, A. In the line of fire: the peatlands of Southeast Asia. Philos. Trans. R. Soc. B Boil. Sci. 2016, 371, 20150176. [Google Scholar] [CrossRef] [PubMed] [Green Version]
- Page, S.E.; Rieley, J.O.; Banks, C.J. Global and regional importance of the tropical peatland carbon pool. Glob. Chang. Boil. 2011, 17, 798–818. [Google Scholar] [CrossRef] [Green Version]
- Tacconi, L. Preventing fires and haze in Southeast Asia. Nat. Clim. Chang. 2016, 6, 640–643. [Google Scholar] [CrossRef]
- Carmenta, R.; Zabala, A.; Daeli, W.; Phelps, J. Perceptions across scales of governance and the Indonesian peatland fires. Glob. Environ. Chang. 2017, 46, 50–59. [Google Scholar] [CrossRef]
- Miettinen, J.; Shi, C.; Liew, S.C. Fire Distribution in Peninsular Malaysia, Sumatra and Borneo in 2015 with Special Emphasis on Peatland Fires. Environ. Manag. 2017, 60, 747–757. [Google Scholar] [CrossRef]
- Staver, A.C.; Archibald, S.; Levin, S.A. The Global Extent and Determinants of Savanna and Forest as Alternative Biome States. Science 2011, 334, 230–232. [Google Scholar] [CrossRef] [PubMed] [Green Version]
- Miettinen, J.; Hooijer, A.; Wang, J.; Shi, C.; Liew, S.C. Peatland degradation and conversion sequences and interrelations in Sumatra. Reg. Environ. Chang. 2012, 12, 729–737. [Google Scholar] [CrossRef]
- Hoscilo, A.; Page, S.E.; Tansey, K.J.; Rieley, J.O. Effect of repeated fires on land-cover change on peatland in southern Central Kalimantan, Indonesia, from 1973 to 2005. Int. J. Wildland Fire 2011, 20, 578–588. [Google Scholar] [CrossRef]
- Cochrane, M.A.; Alencar, A.; Schulze, M.D.; Souza, C.M.; Nepstad, D.C.; Lefebvre, P.; Davidson, E.A. Positive Feedbacks in the Fire Dynamic of Closed Canopy Tropical Forests. Science 1999, 284, 1832–1835. [Google Scholar] [CrossRef]
- Siegert, F.; Ruecker, G.; Hinrichs, A.; Hoffmann, A.A. Increased damage from fires in logged forests during droughts caused by El Niño. Nature 2001, 414, 437–440. [Google Scholar] [CrossRef]
- Gaveau, D.L.A.; Epting, J.; Lyne, O.; Linkie, M.; Kumara, I.; Kanninen, M.; Leader-Williams, N.; Leader-Williams, N. Evaluating whether protected areas reduce tropical deforestation in Sumatra. J. Biogeogr. 2009, 36, 2165–2175. [Google Scholar] [CrossRef]
- Spracklen, B.D.; Kalamandeen, M.; Galbraith, D.; Gloor, E. A Global Analysis of Deforestation in Moist Tropical Forest Protected Areas. PLoS ONE 2015, 10, 0143886. [Google Scholar] [CrossRef] [PubMed]
- Wijedasa, L.S.; Sloan, S.; Page, S.E.; Clements, G.R.; Lupascu, M.; Evans, T.A. Carbon emissions from South-East Asian peatlands will increase despite emission-reduction schemes. Glob. Chang. Boil. 2018, 24, 4598–4613. [Google Scholar] [CrossRef] [PubMed]
- Santika, T.; Meijaard, E.; Budiharta, S.; Law, E.A.; Kusworo, A.; Hutabarat, J.A.; Indrawan, T.P.; Struebig, M.; Raharjo, S.; Huda, I.; et al. Community forest management in Indonesia: Avoided deforestation in the context of anthropogenic and climate complexities. Glob. Environ. Chang. 2017, 46, 60–71. [Google Scholar] [CrossRef]
- Cattau, M.E.; E Marlier, M.; DeFries, R. Effectiveness of Roundtable on Sustainable Palm Oil (RSPO) for reducing fires on oil palm concessions in Indonesia from 2012 to 2015. Environ. Res. Lett. 2016, 11, 105007. [Google Scholar] [CrossRef]
- Gaveau, D.L.A.; Pirard, R.; Salim, M.A.; Tonoto, P.; Yaen, H.; Parks, S.A.; Carmenta, R. Overlapping Land Claims Limit the Use of Satellites to Monitor No-Deforestation Commitments and No-Burning Compliance. Conserv. Lett. 2017, 10, 257–264. [Google Scholar] [CrossRef]
- Hansson, A.; Dargusch, P. An Estimate of the Financial Cost of Peatland Restoration in Indonesia. Case Stud. Env. 2017. [Google Scholar] [CrossRef]
Figure 1.
Land-cover and land-use in Riau Province, Sumatra, Indonesia. (a) Percentage canopy cover in year 2000; (b) Total number of high confidence fire hotspots detected between 2001 and 2012; (c) Fractional tree cover loss between 2001 and 2012; (d) Concession areas (see text for full description).

Figure 2.
(a) Relationship between annual number of hotspots and tree cover loss in Riau Province; (b) Annual tree cover loss (blue lines, left axis) and number of fire hotspots (red lines, right axis) in Riau. The solid lines represent actual number and the dashed lines show the estimated linear trend lines. The equation of the best fit line and the correlation coefficient (r2) is shown.
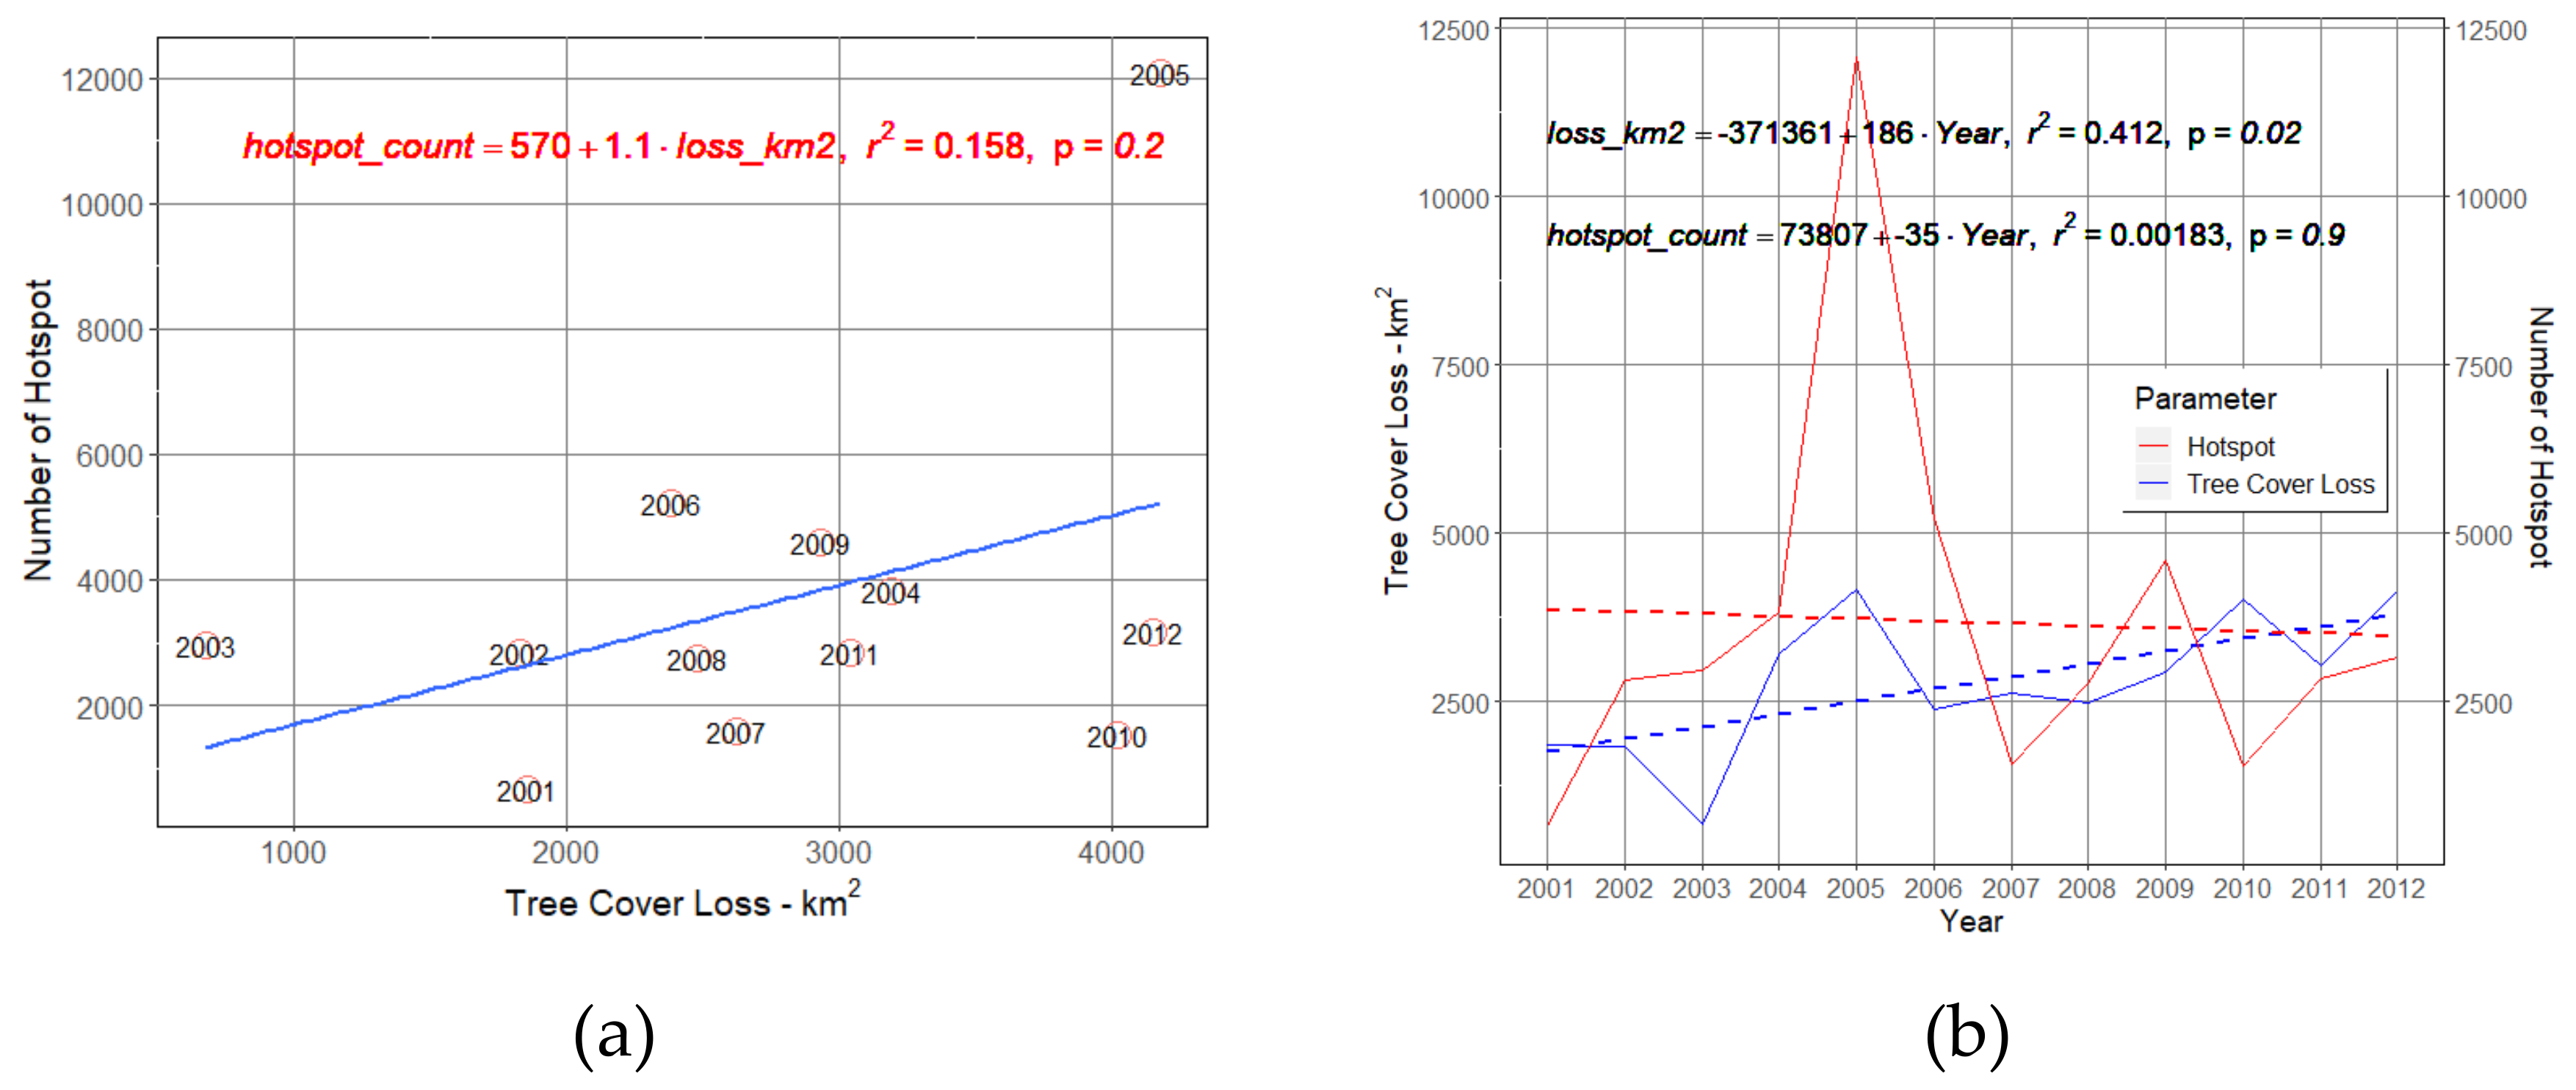
Figure 3.
Annual hotspot density (km−2 year−1) as a function of percentage of tree cover loss (2000 to 2012) and percentage tree cover in the year 2000. Results are shown separately for non-peat and peat regions.
Figure 3.
Annual hotspot density (km−2 year−1) as a function of percentage of tree cover loss (2000 to 2012) and percentage tree cover in the year 2000. Results are shown separately for non-peat and peat regions.
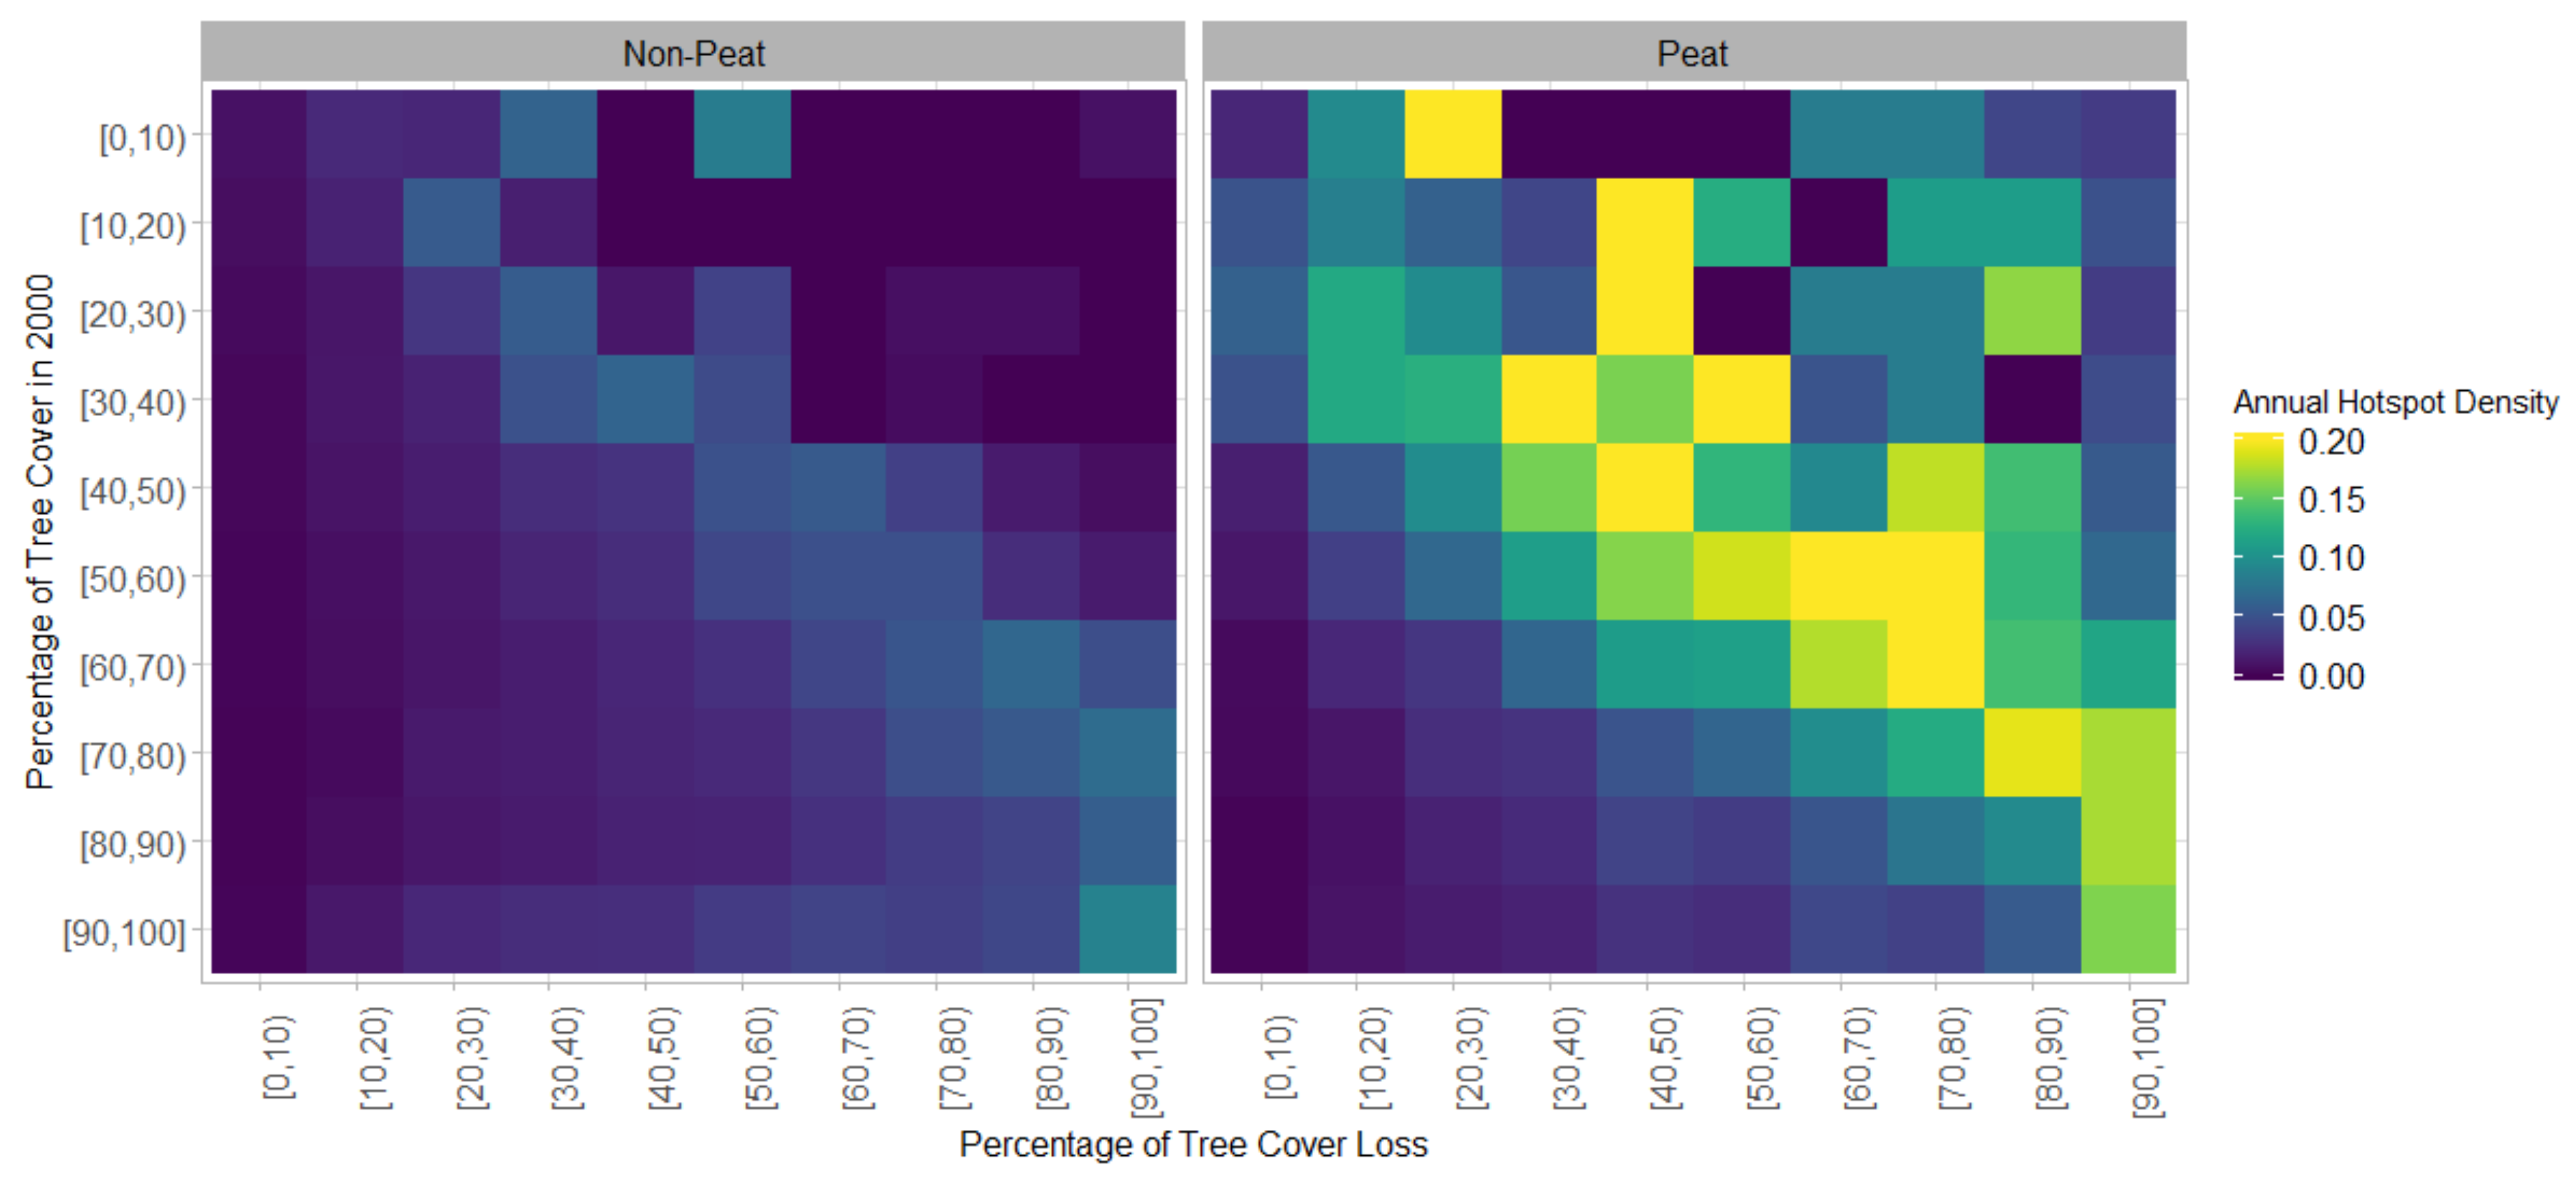
Figure 4.
Annual hotspot density according to forest cover and forest loss status. Forest is defined as areas which have a tree cover in 2000 > 50%; areas of forest loss are defined as areas with tree cover loss > 10%.
Figure 4.
Annual hotspot density according to forest cover and forest loss status. Forest is defined as areas which have a tree cover in 2000 > 50%; areas of forest loss are defined as areas with tree cover loss > 10%.
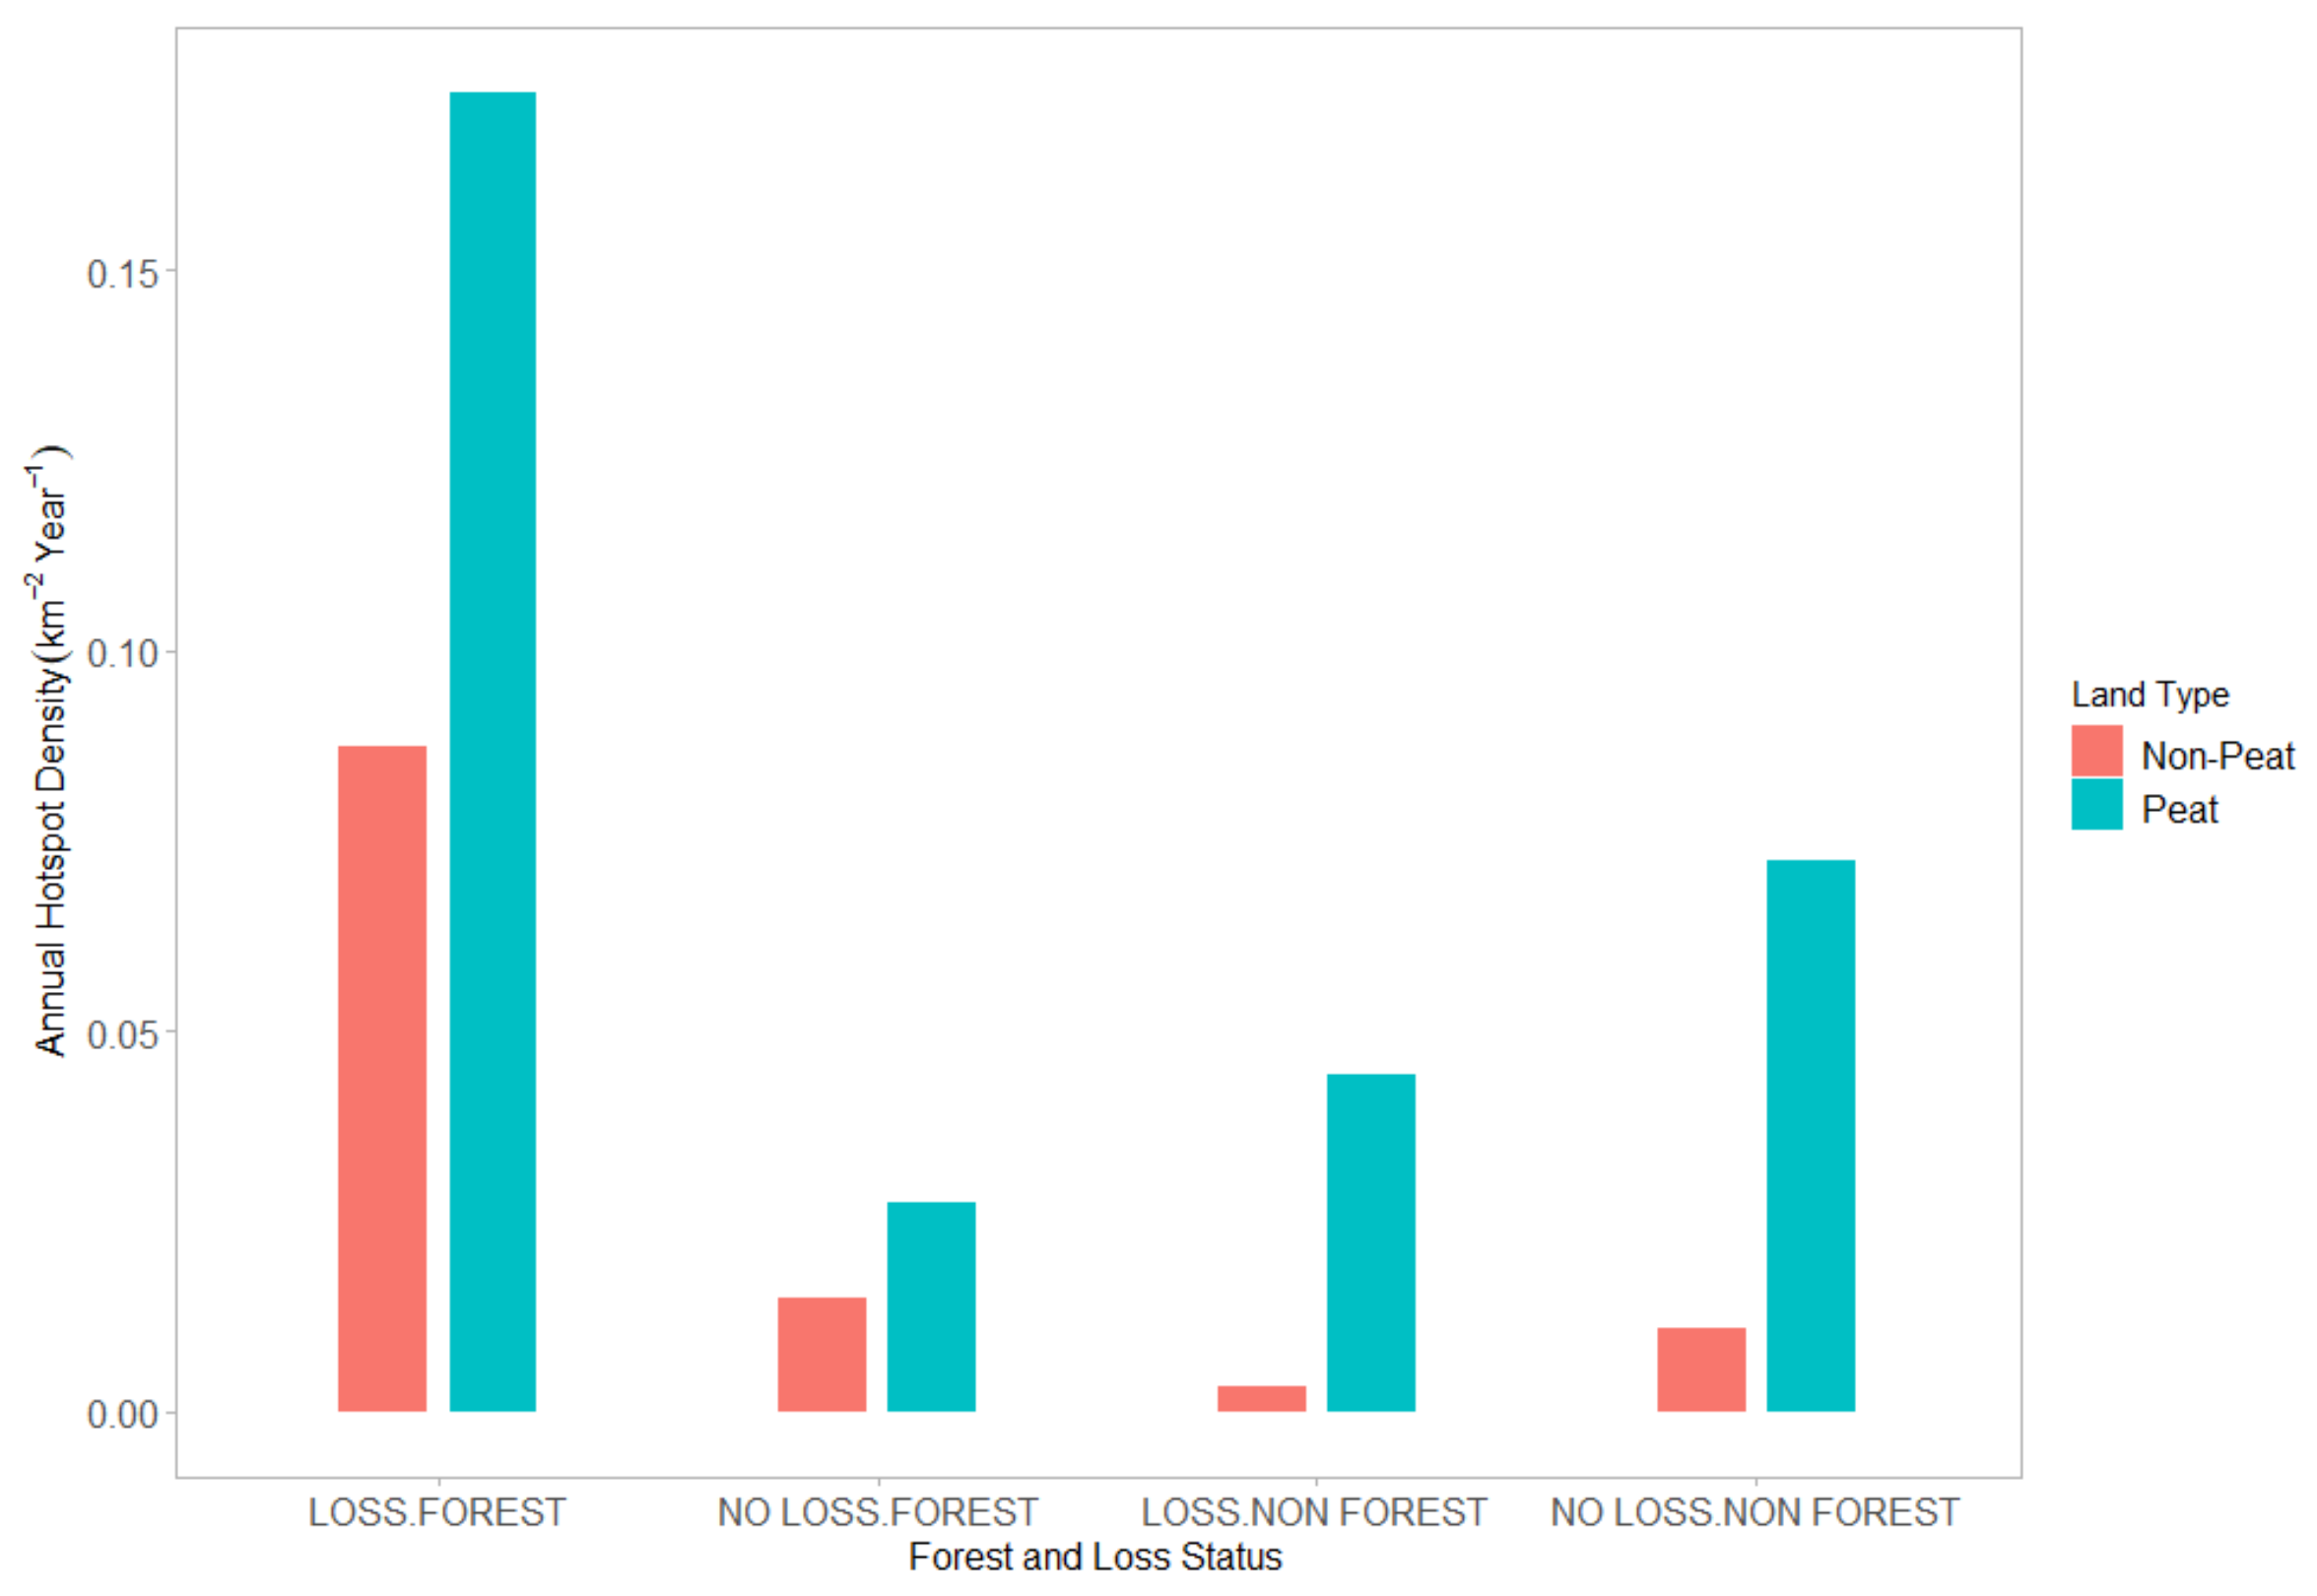
Figure 5.
Land area, forest loss, and hot spots by land-use in peat and non-peat regions (a) Area; (b) Proportion of tree cover loss; (c) Proportion of hotspot number.
Figure 5.
Land area, forest loss, and hot spots by land-use in peat and non-peat regions (a) Area; (b) Proportion of tree cover loss; (c) Proportion of hotspot number.
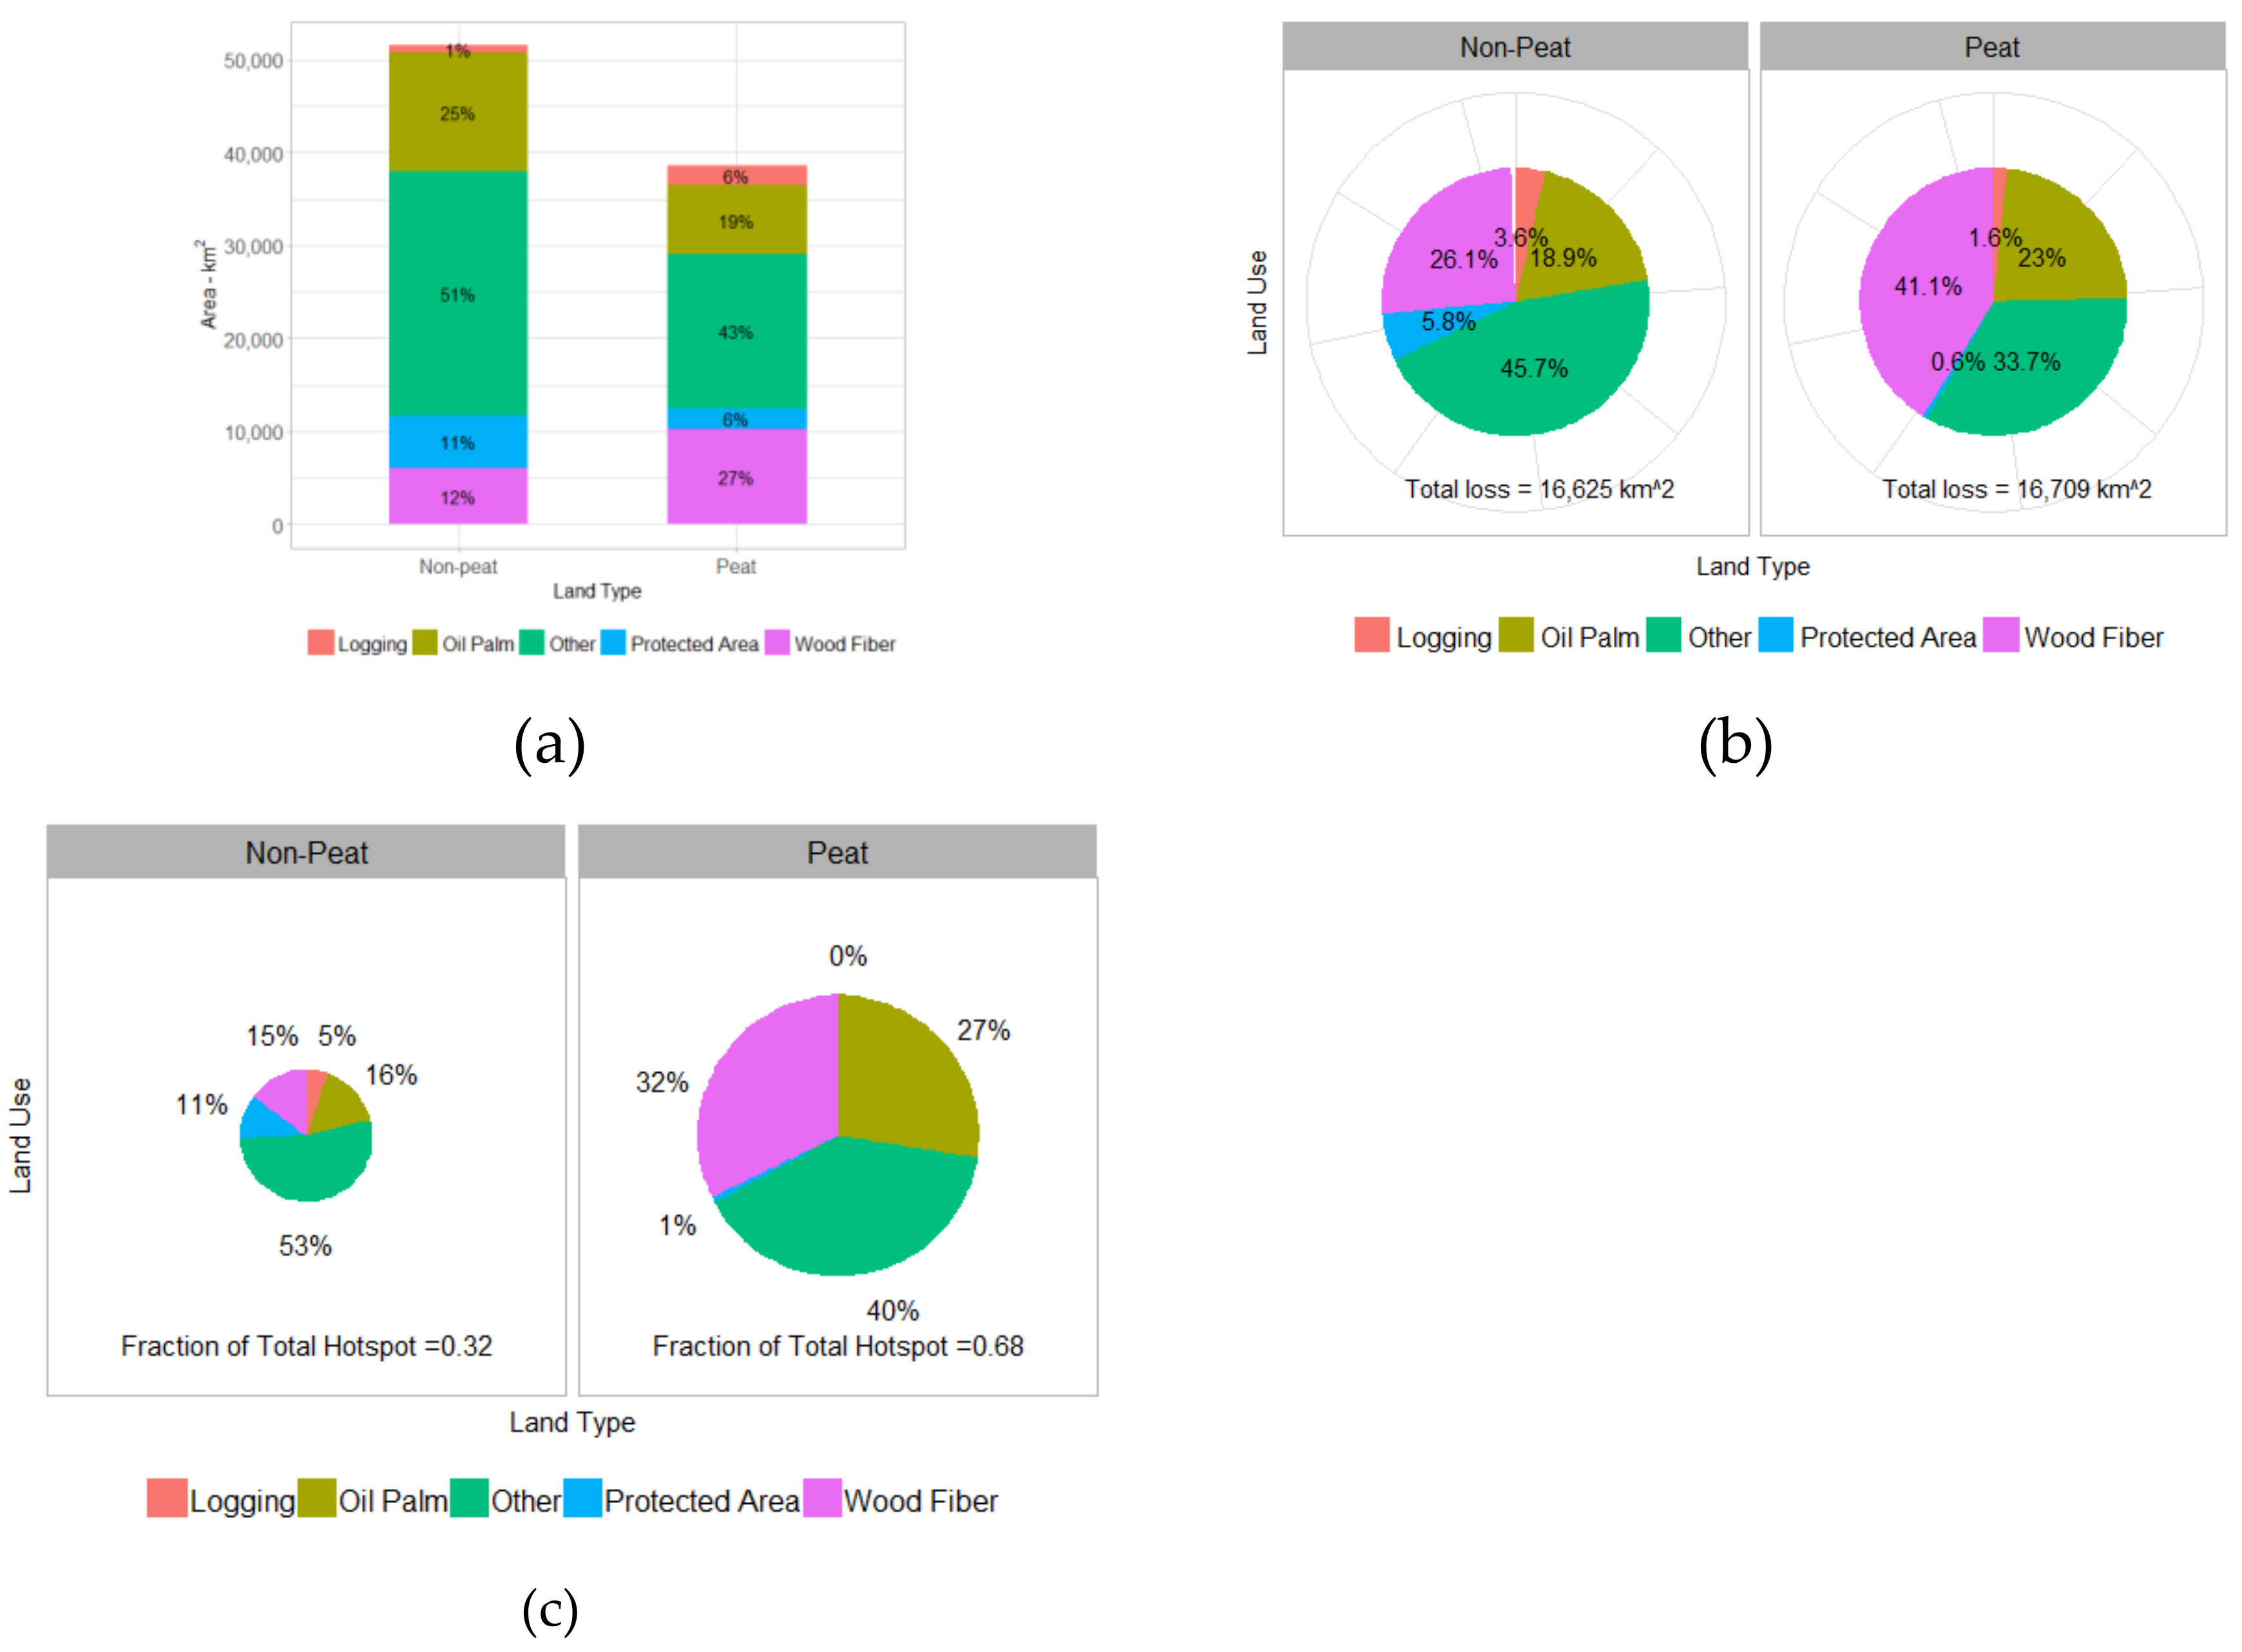
Figure 6.
Comparison of forest loss rates and hotspot density across different land-uses. (a) Proportional forest loss (green) and hotspot density (red, km−2); (b) Correlation between annual proportional forest loss and annual hotspot density. Dashed lines show regression lines for peat (blue), non-peat (red) and both (black).
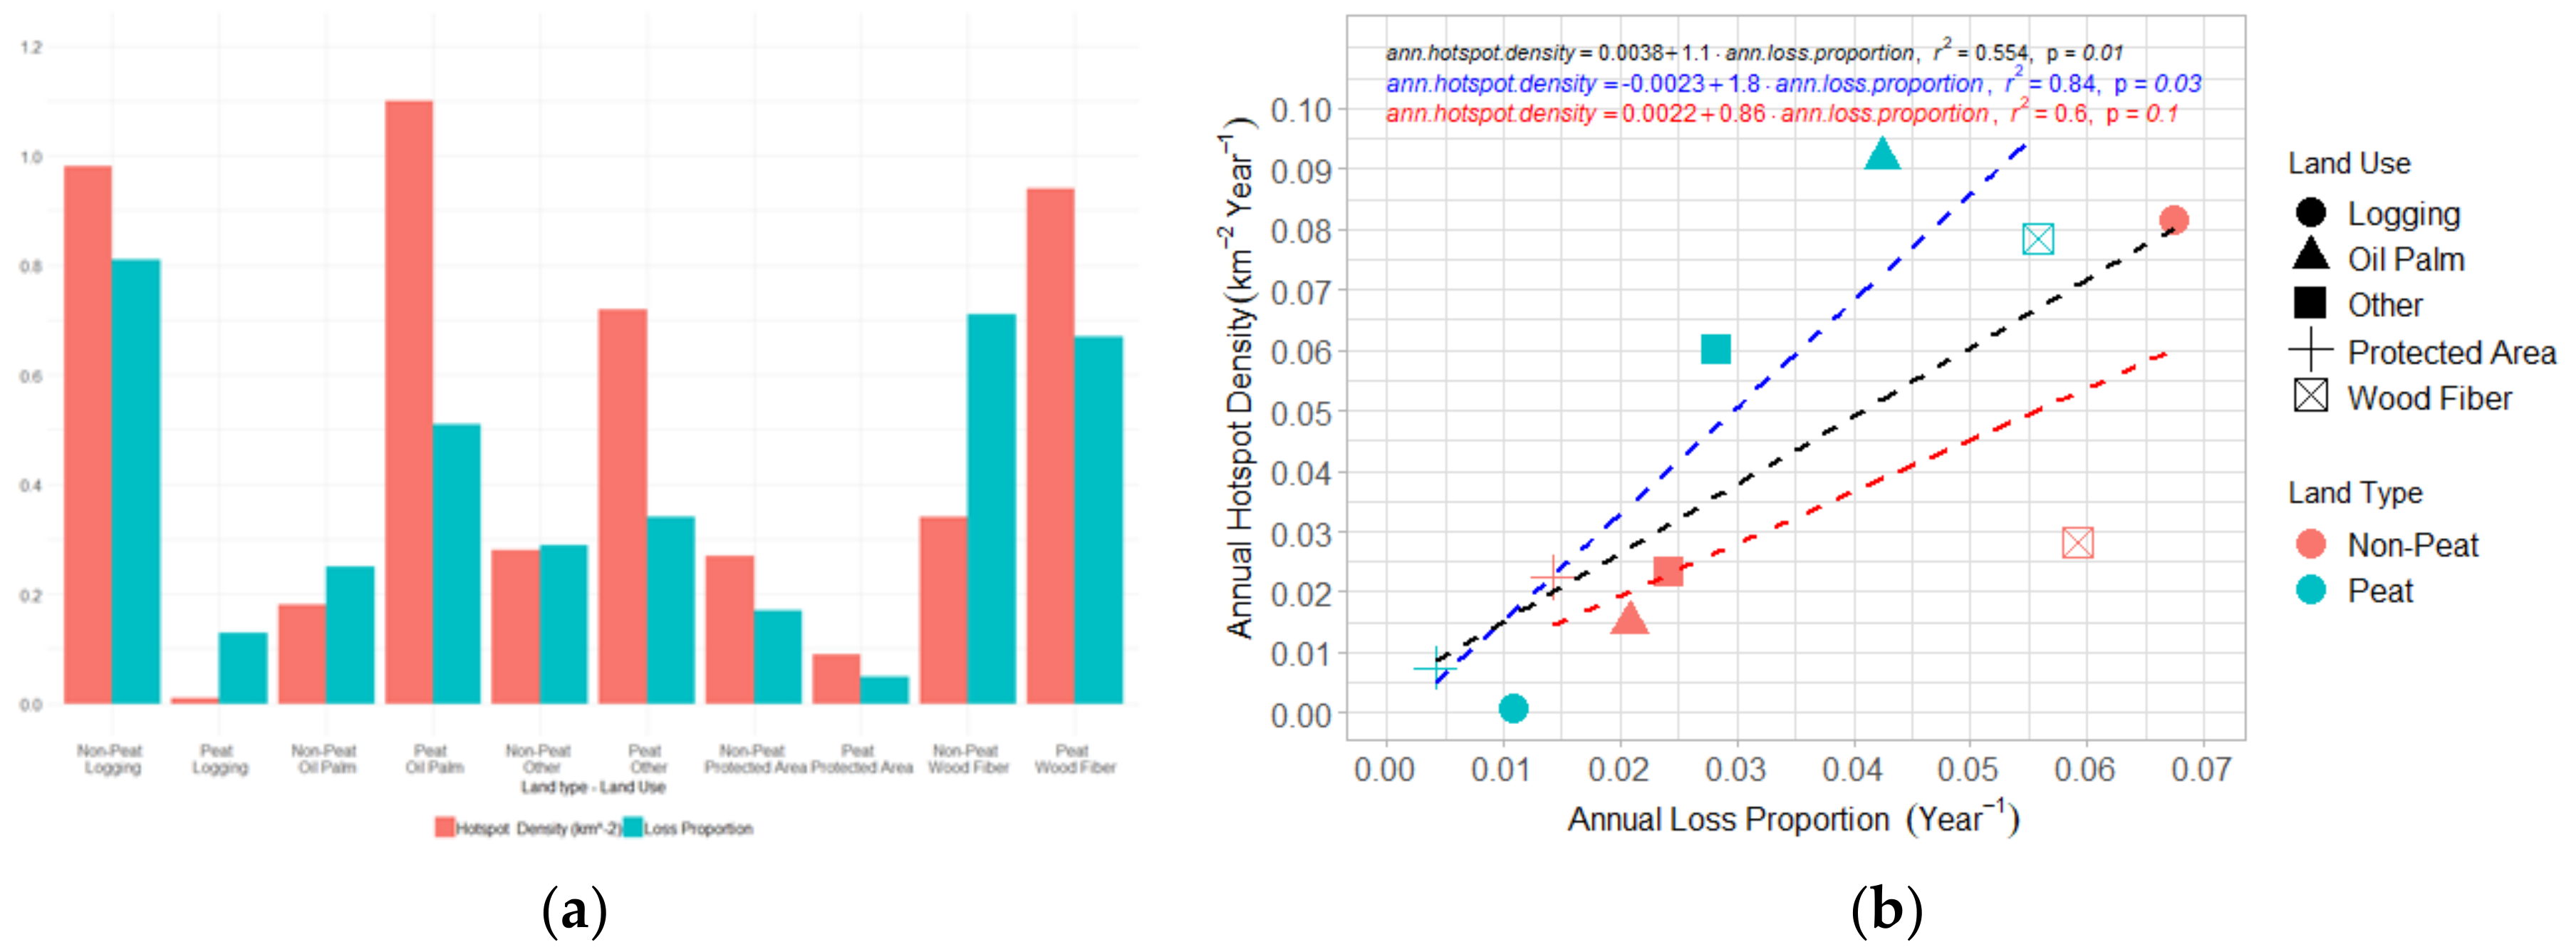
Figure 7.
Relationship between tree cover loss and number of hotspots by land type and land use. Solid lines show linear regressions lines.
Figure 7.
Relationship between tree cover loss and number of hotspots by land type and land use. Solid lines show linear regressions lines.
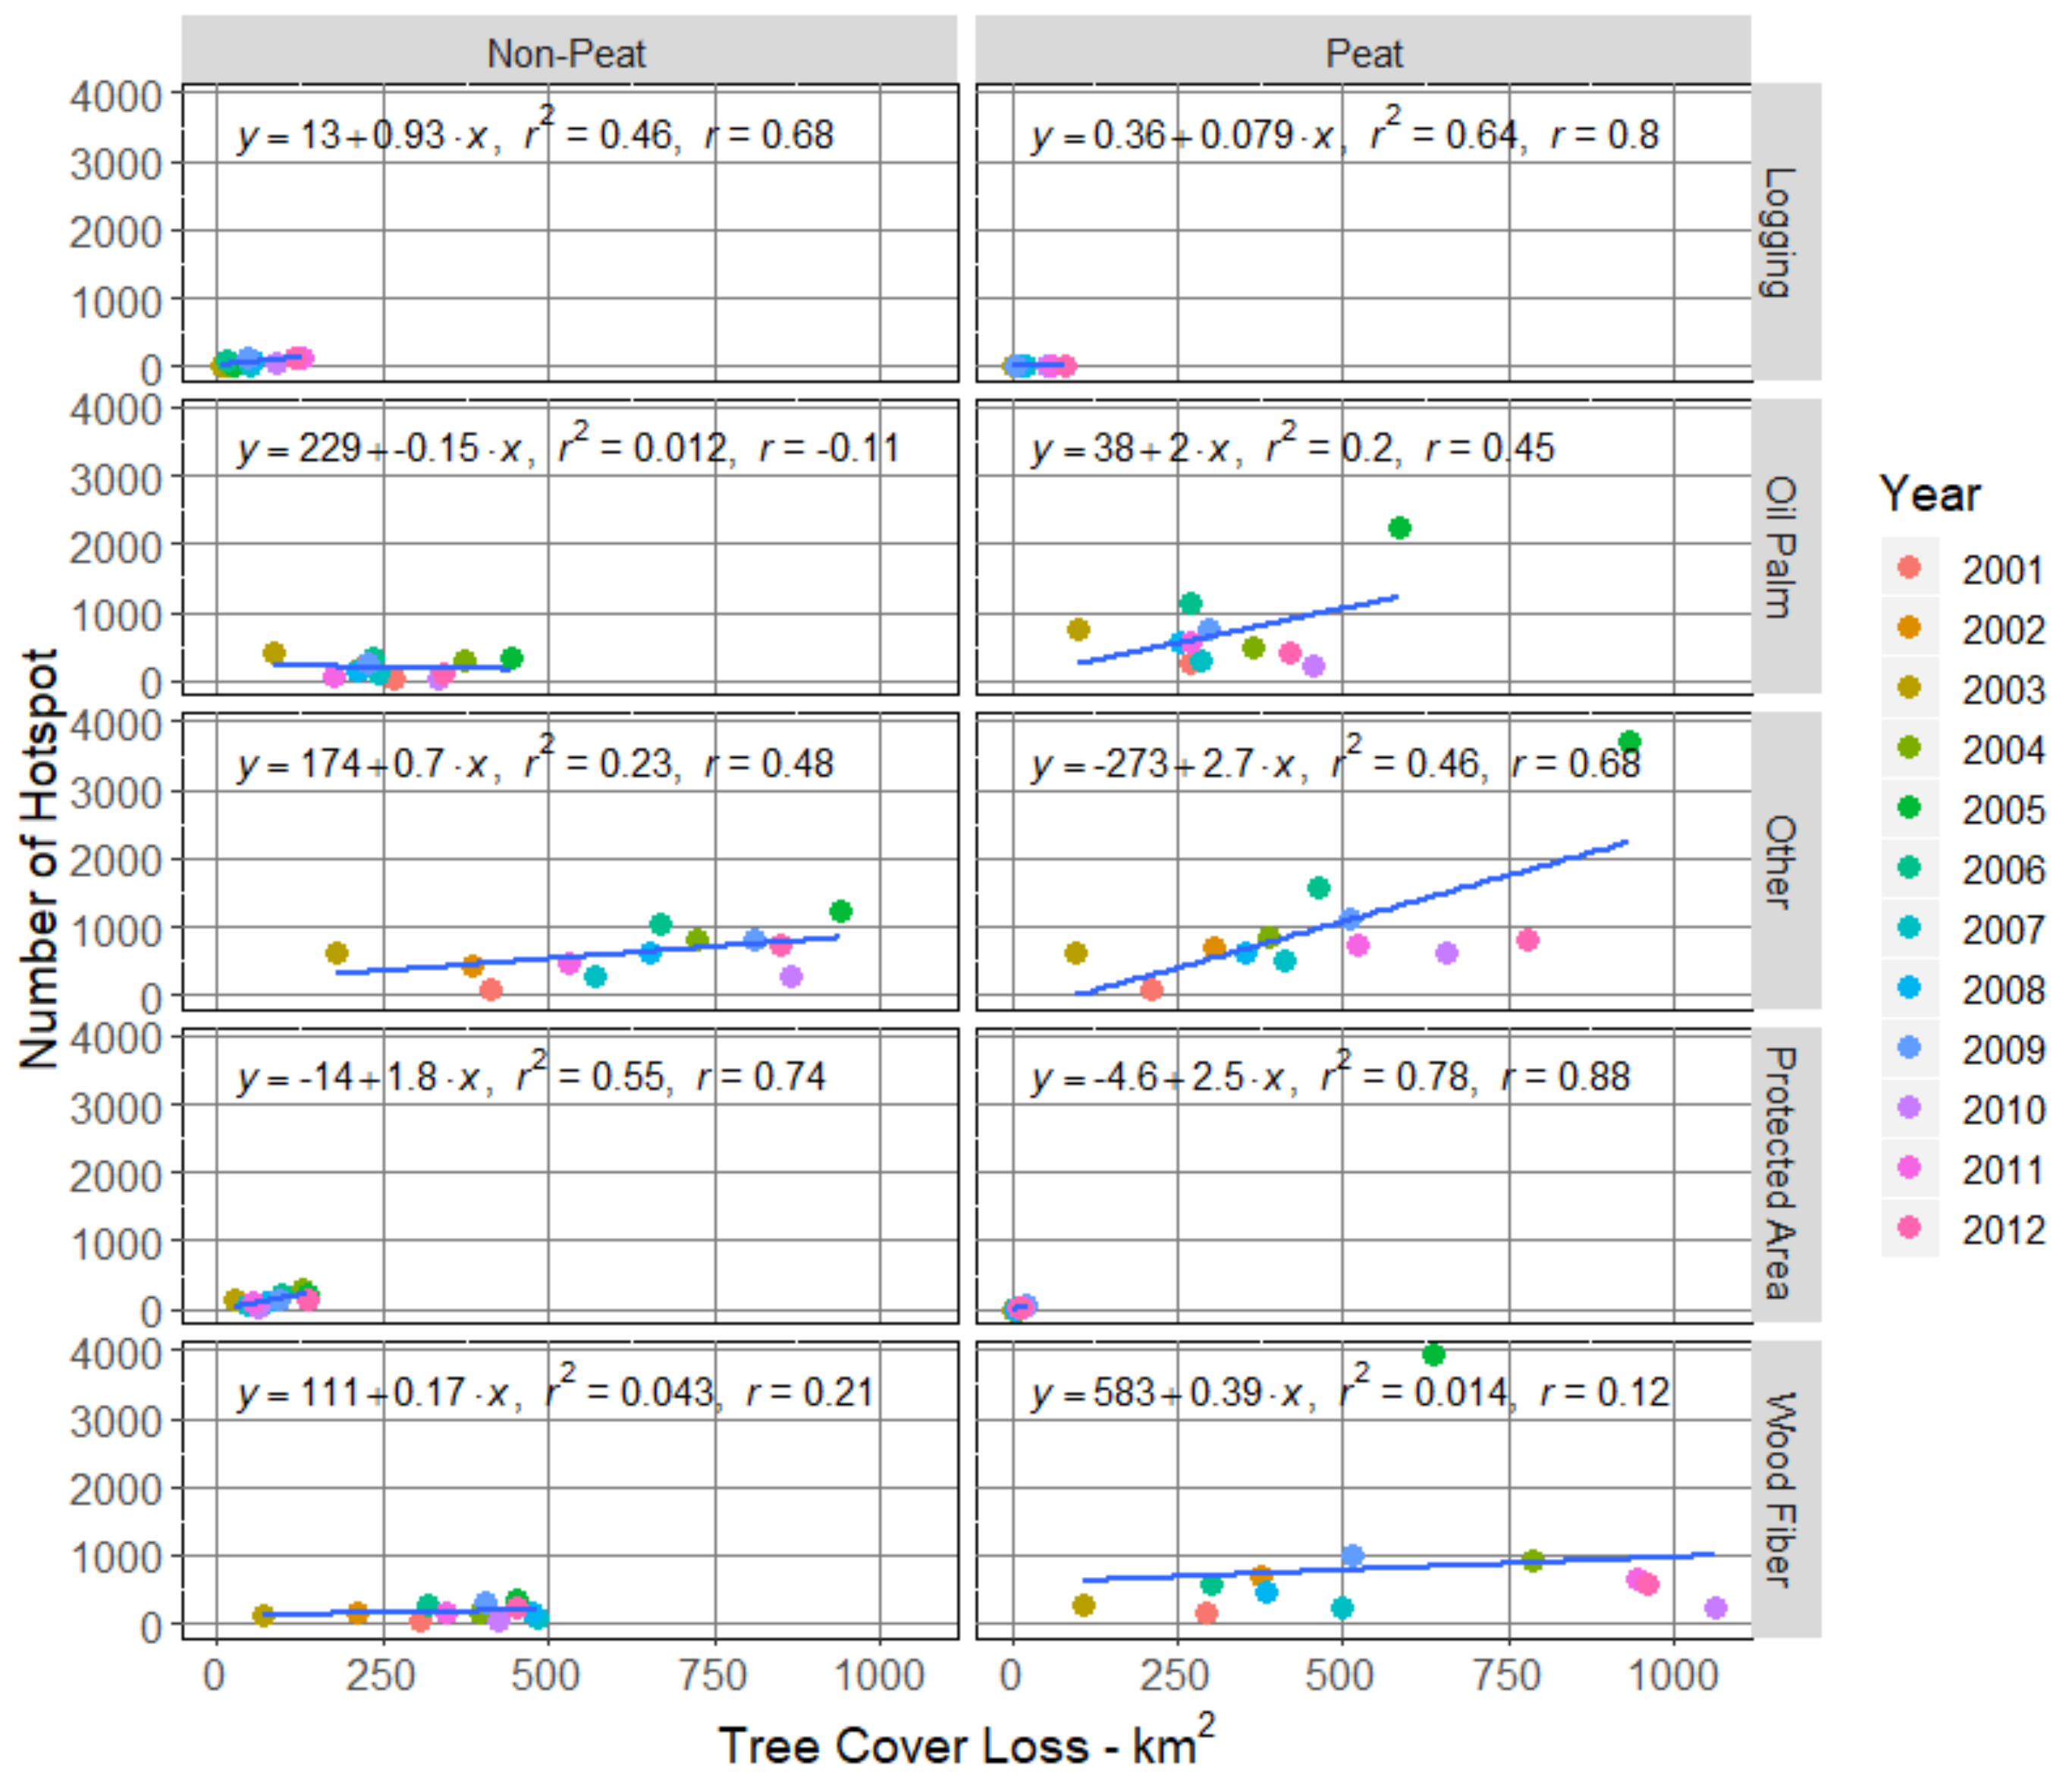
Figure 8.
Annual increment in the number of fire hotspots (year−1) and the rate of forest loss (km2 year−1) in non-peat and peat regions.
Figure 8.
Annual increment in the number of fire hotspots (year−1) and the rate of forest loss (km2 year−1) in non-peat and peat regions.
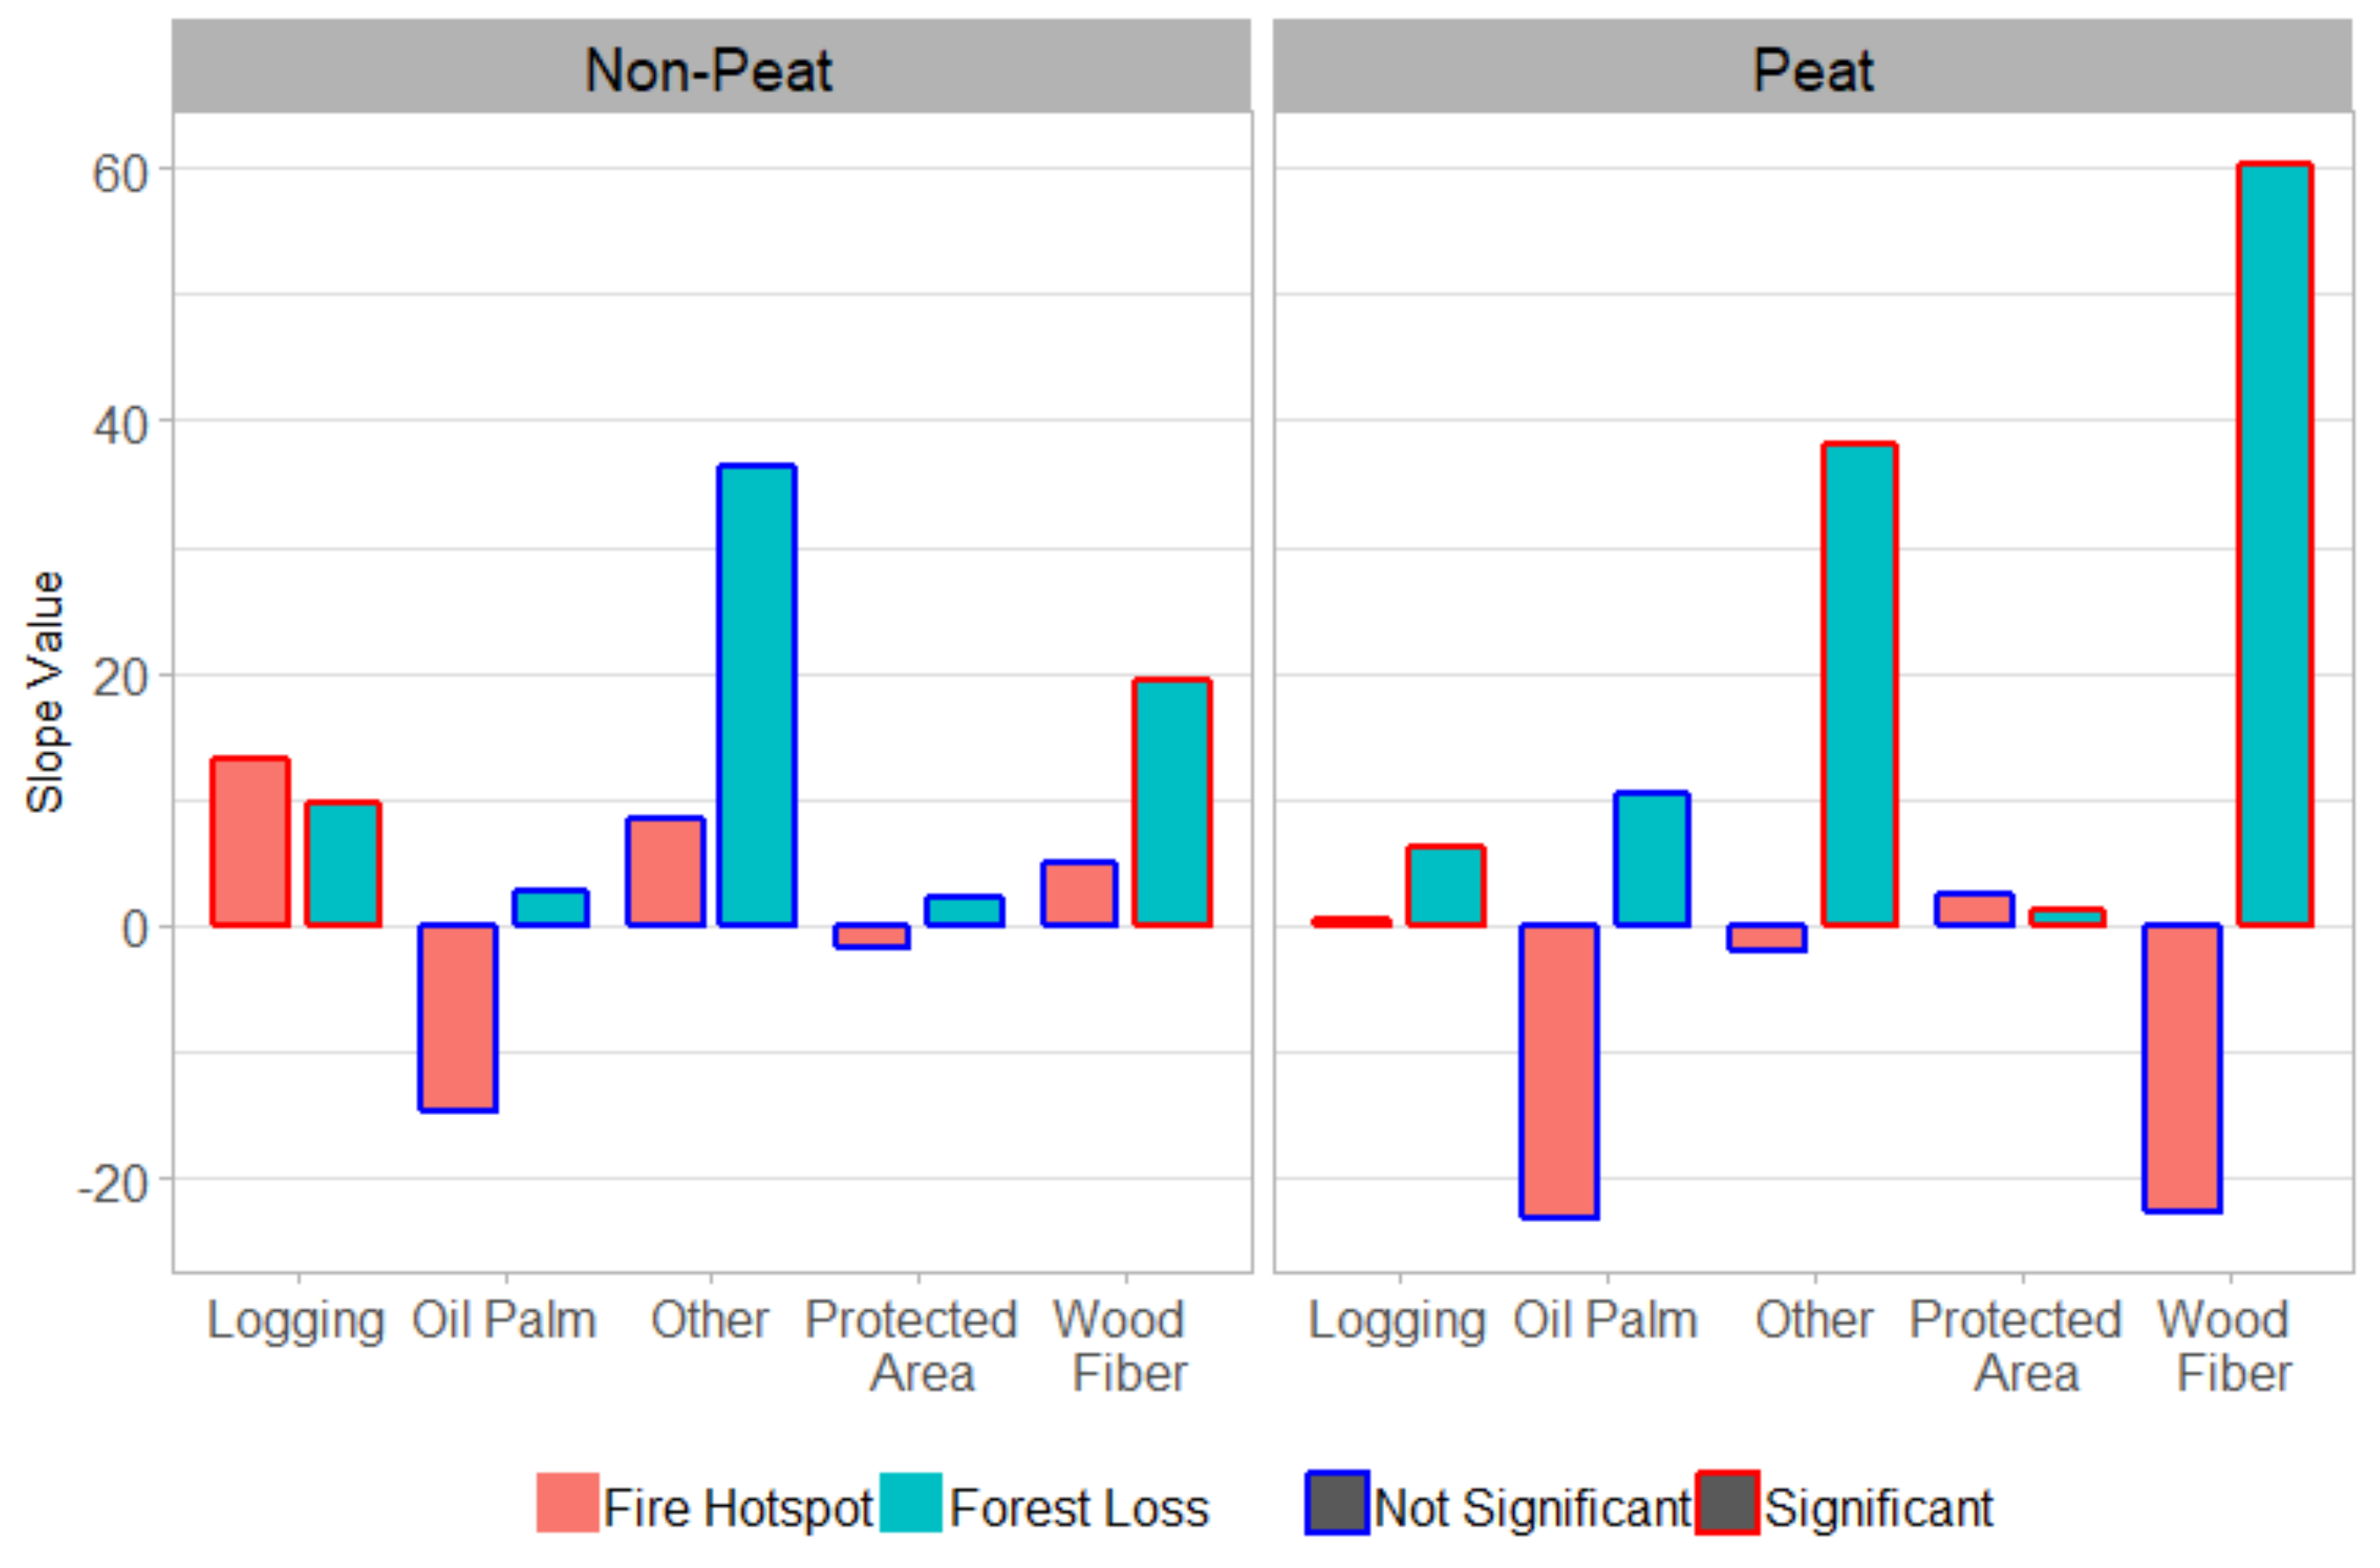
Figure 9.
Time difference between forest loss and occurrence of fire hotspot in 1 km2 cells for forest loss occurring between 2005 and 2007. (a) Number of years between forest loss and the year with the maximum number of fire hotspots; (b) The fraction of cells where year with maximum number of hotspots occurs within +/− 1 year of forest loss.

Table 1.
Annual forest loss and hotspot density in peat and non-peatland areas.
| Land Type | Area (km2) | Loss (km2) | Hotspot Count | Loss Proportion | Hotspot Density (km−2) | Hotspot Density per Loss (km−2) | Annual Loss Proportion (year−1) | Annual Hotspot Density (km−2 year−1) | Cells with Hotspot | Cells with Loss > 10% |
|---|---|---|---|---|---|---|---|---|---|---|
| a | b | c | d | e = c/b | f = d/b | g = d/c | h = e/12 | i = f/12 | j | k |
| Non-Peat | 51,492 | 16,625 | 14,006 | 0.32 | 0.27 | 0.84 | 0.027 | 0.02 | 7991 | 30,178 |
| Peat | 38,639 | 16,709 | 30,037 | 0.43 | 0.78 | 1.80 | 0.036 | 0.06 | 8592 | 23,633 |
| All Land Type | Σ = 90,131 | Σ = 33,334 | Σ = 44,043 | ∏ = sum(c)/sum(b) | ∏ = sum(d)/sum(b) | ∏ = sum(d)/sum(c) | ∏ = 0.031 | ∏ = 0.041 | Σ = 16,583 | Σ = 53,811 |
| =0.37 | =0.49 | =1.32 |
Table 2.
Annual hotspot density by loss status 1.
| Loss Status | Forest Status | Number Cells | Hotspot Total | Hotspot Density (km−2) | Annual Hotspot Density (km−2 year−1) |
|---|---|---|---|---|---|
| a | b | c | D | e = d/c | f = e/12 |
| All | Forest | 79844 | 40533 | 0.51 | 0.042 |
| All | Non forest | 12656 | 3510 | 0.28 | 0.023 |
| Loss | All | 14902 | 24663 | 1.65 | 0.138 |
| No loss | All | 77598 | 19380 | 0.25 | 0.021 |
| Loss | Forest | 14654 | 24554 | 1.68 | 0.14 |
| Loss | Non forest | 248 | 109 | 0.44 | 0.037 |
| No loss | Forest | 65190 | 15979 | 0.25 | 0.021 |
1 Forest if tree cover in 2000 > 50%, Loss if tree cover loss > 10%.
Table 3.
Annual forest loss and hotspot density as a function of land-use.
| Land Use | Area (km2) | Loss (km2) | Hotspot Count | Loss Proportion | Hotspot Density (km−2) | Hotspot Density per Loss (km−2) | Annual Loss Proportion (Year−1) | Annual Hotspot Density (km−2 Year−1) |
|---|---|---|---|---|---|---|---|---|
| a | b | c | d | e = c/b | f = d/b | g=d/c | h = e/12 | i = f/12 |
| Logging | 2860 | 864 | 737 | 0.3 | 0.26 | 0.85 | 0.025 | 0.022 |
| Oil palm | 20,266 | 6987 | 10,502 | 0.34 | 0.52 | 1.50 | 0.028 | 0.042 |
| Other | 42,745 | 13,213 | 19,334 | 0.31 | 0.45 | 1.46 | 0.026 | 0.038 |
| Protected | 7920 | 1065 | 1740 | 0.13 | 0.22 | 1.63 | 0.011 | 0.018 |
| Wood Fiber | 16,340 | 11,205 | 11,730 | 0.69 | 0.72 | 1.05 | 0.058 | 0.06 |
Table 4.
Summary of tree cover loss and fire hotspot by land-use and land type 1.
| Land Use | Land Type | Area (km2) | Loss (km2) | Hotspot Count | Tree Cover 2000 | Loss Prop. | Loss w.r.t. 2000 | Hotspot Density (km−2 Year−1) | Hotspot Density by Loss (km−2) | Cells with Hotspot | Cells with Loss > 10% |
|---|---|---|---|---|---|---|---|---|---|---|---|
| a | b | c | d | e | f | g | h | i | j | K | l |
| Logging | Non-peat | 726 | 591 | 711 | 735 | 0.81 | 0.8 | 0.98 | 1.2 | 374 | 662 |
| Logging | Peat | 2134 | 273 | 26 | 2199 | 0.13 | 0.12 | 0.01 | 0.1 | 25 | 480 |
| Oil palm | Non-peat | 12,769 | 3150 | 2259 | 10,075 | 0.25 | 0.31 | 0.18 | 0.72 | 1386 | 6324 |
| Oil palm | Peat | 7497 | 3837 | 8243 | 6449 | 0.51 | 0.59 | 1.1 | 2.15 | 2478 | 5652 |
| Other | Non-peat | 26,266 | 7589 | 7435 | 21,172 | 0.29 | 0.36 | 0.28 | 0.98 | 4195 | 15,707 |
| Other | Peat | 16,479 | 5624 | 11,899 | 16,070 | 0.34 | 0.35 | 0.72 | 2.12 | 3464 | 9182 |
| Protected Area | Non-peat | 5652 | 960 | 1534 | 5468 | 0.17 | 0.18 | 0.27 | 1.6 | 799 | 1717 |
| Protected Area | Peat | 2268 | 105 | 206 | 2276 | 0.05 | 0.05 | 0.09 | 1.97 | 92 | 227 |
| Wood fiber | Non-peat | 6080 | 4335 | 2067 | 5348 | 0.71 | 0.81 | 0.34 | 0.48 | 1237 | 5768 |
| Wood fiber | Peat | 10,260 | 6870 | 9663 | 10,052 | 0.67 | 0.68 | 0.94 | 1.41 | 2533 | 8092 |
| Summary | Σ = 90,131 | Σ = 33,334 | Σ = 44,043 | Σ = 79,844 | ∏ = sum (d)/sum(c) = 0.37 | ∏ = 0.425 | ∏ = sum(e)/sum(c) = 0.49 | ∏ = sum(e)/sum(d) = 1.32 | n = 16,583 | n = 53,811 |
1 Column g shows loss proportion for each area types (e/d), hotspot densities show hotspot number per km2 related to of area (i = e/c) and loss area (j = e/d). Treecover2000 is number of 1 km2 cells with percentage of tree cover > 50% in year 2000.
Table 5.
Occurrence of hotspots in 1 km2 cells according to loss, forest cover (2000), and fire status. Cells are categorized as loss if they experienced > 10% forest loss, and as forest if canopy cover in 2000 > 50%.
Table 5.
Occurrence of hotspots in 1 km2 cells according to loss, forest cover (2000), and fire status. Cells are categorized as loss if they experienced > 10% forest loss, and as forest if canopy cover in 2000 > 50%.
| Loss Status (Number of Cells) | Forest Status | Fire Status | Number of Cells | % of Cells | Hotspot Sum | % of Hotspot |
|---|---|---|---|---|---|---|
| Loss (14,902) | Forest | Has fire | 6632 | 45% | 24,554 | 56% |
| Forest | No fire | 8022 | 55% | 0 | ||
| Sub-total (Loss-Forest): 14,654 | ||||||
| Non forest | Has fire | 45 | 18% | 109 | 0.2% | |
| Non forest | No fire | 203 | 82% | 0 | ||
| Sub-total (Loss-Non Forest): 248 | ||||||
| No Loss (77,598) | Forest | Has fire | 8439 | 13% | 15,979 | 36% |
| Forest | No fire | 56,751 | 87% | 0 | ||
| Sub-total (No loss – Forest): 65,190 | ||||||
| Non forest | Has fire | 1467 | 12% | 3401 | 8% | |
| Non forest | No fire | 10,941 | 88% | 0 | ||
| Sub-total (No loss – Non Forest): 12,408 | ||||||
| 92,500 | 44,043 | |||||
© 2019 by the authors. Licensee MDPI, Basel, Switzerland. This article is an open access article distributed under the terms and conditions of the Creative Commons Attribution (CC BY) license (http://creativecommons.org/licenses/by/4.0/).
Share and Cite
MDPI and ACS Style
Adrianto, H.A.; Spracklen, D.V.; Arnold, S.R. Relationship Between Fire and Forest Cover Loss in Riau Province, Indonesia Between 2001 and 2012. Forests 2019, 10, 889. https://doi.org/10.3390/f10100889
AMA Style
Adrianto HA, Spracklen DV, Arnold SR. Relationship Between Fire and Forest Cover Loss in Riau Province, Indonesia Between 2001 and 2012. Forests. 2019; 10(10):889. https://doi.org/10.3390/f10100889
Chicago/Turabian StyleAdrianto, H. A., D. V. Spracklen, and S. R. Arnold. 2019. "Relationship Between Fire and Forest Cover Loss in Riau Province, Indonesia Between 2001 and 2012" Forests 10, no. 10: 889. https://doi.org/10.3390/f10100889
Note that from the first issue of 2016, this journal uses article numbers instead of page numbers. See further details here.