Article

Canopy Temperature Differences between Liana-Infested and Non-Liana Infested Areas in a Neotropical Dry Forest

1
State Key Laboratory of Subtropical Building Science, South China University of Technology, Guangzhou 510641, China
2
Centre for Earth Observation Sciences (CEOS), Department of Earth and Atmospheric Sciences, University of Alberta, Edmonton, AB T6G 2E3, Canada
3
Department of Geography, Ludwig-Maximilians-Universität, 80333 Munich, Germany
*
Author to whom correspondence should be addressed.
Forests 2019, 10(10), 890; https://doi.org/10.3390/f10100890
Submission received: 26 July 2019 / Revised: 21 September 2019 / Accepted: 5 October 2019 / Published: 9 October 2019
(This article belongs to the Section Forest Ecology and Management)

Abstract

:
Lianas (woody vines) are important non-structural elements of all tropical forests. Current field observations across the Neotropics suggest that liana abundance is rising as a result of forest disturbance, increasing atmospheric CO2, and more frequent extreme climate events. Lianas can cause mechanical stress on their host trees, thus increasing mortality, in addition to potentially reducing carbon storage capacity. Furthermore, previous studies have suggested that liana leaves have an overall higher temperature than tree leaves, which presents the question of whether these differences can be extended from the leaf to the canopy. In this context, the ability to detect these temperature differences from a remote sensing platform has so far not been put into test, despite the importance such knowledge can have in large-scale land surface modeling studies and liana extent monitoring. To partially fill this knowledge gap, we acquired thermal infrared data using an unmanned aerial vehicle (UAV) system over an intermediate tropical dry forest in Costa Rica, Central America. Classification results from a previous study in the same area were used to subset the thermal infrared images into liana-infested areas, non-liana infested areas, and forest gaps. The temperature differences between these three image components were then investigated using the Welch and Games–Howell post-hoc statistical tests. Our results suggest that liana-infested areas have, on average, a statistically significant higher temperature than non-liana infested areas. Shadowed forest gaps, used as reference, have a cooler temperature than forest canopies. Our findings on the temperature differences between liana-infested and non-liana infested areas support previous leaf-level observations and open the door to the use of new approaches for the classification and modeling of liana infestation in tropical ecosystems.

1. Introduction

Tropical forests contain more than half of all terrestrial species and are considered as regions of high biological diversity [1,2]. Today, the structure of these important ecosystems is changing fast as a result of direct and indirect consequences of forest clearance and other anthropogenic activities [3]. Increasing amplitude and frequency of extreme climate events such as local and regional-scale droughts, linked to the global climate change and increasing CO2 levels in the atmosphere, have already made tropical forests more vulnerable to large-scale die-offs [4]. These consequences of anthropogenic activities have led to structural changes, one of the most prominent being an increase in the abundance of lianas [1].
Lianas are a diverse group of polyphyletic non-self-supporting woody climbing plants found in forests throughout the world but are most abundant and diverse in tropical forests, especially in those ecosystems where the mean annual precipitation is less than 2000 mm [5,6]. Liana infestation is a dynamic phenomenon [7] that plays an important role in ecosystem-level processes such as forest regeneration and species diversity [8]. Liana infestation can stunt the growth and regeneration of their host trees [9,10,11]. In its most severe form, liana infestation can increase tree mortality [7,12,13].
Lianas appear to restrain non-pioneer tree survival, while enhancing pioneer tree survival indirectly [14] and as such limit tree diversity in gaps [15]. Moreover, liana-infested trees produce significantly fewer fruits and have reduced nut fresh weights when compared to non-liana infested trees [16]. In addition to affecting the biodiversity of tropical forests in complex ways, lianas are considered to be major silvicultural pests for the tropical timber industry [17,18] as a result of reducing tree growth, with a direct impact on timber production [19]. A deep understanding of the properties of lianas has particular relevance in tropical areas where lianas can be present on over 50% of individual trees [7].
Lianas are readily responding to increased atmospheric CO2 concentrations [20] and forest disturbance [8]. From a global perspective and considering that tropical forests contribute approximately one-third of the global terrestrial carbon stocks [21], the increasing abundance of lianas in tropical forests may also result in serious repercussions to the global carbon cycle by reducing their carbon storage capacity [9,13,21,22] and altering the mechanisms of aboveground carbon storing through increased mortality and reduced tree growth [23].
Despite the recognition of the ecological and economic effects of the increasing liana abundance in tropical forests, there is thus far little research on the effects of lianas on the tropical canopy temperature. One of the first studies to document the impact of lianas on the temperature of tropical canopies was conducted by Sanchez-Azofeifa et al. who documented that liana leaves have a generally higher temperature than their host tree leaves [24]. Following this finding, Guzmán et al. acquired thermal infrared data in Panama to study the temperature differences between lianas and their host trees [25]. Their studies suggest that liana leaves have higher average temperatures than tree leaves, but no clear effects (either negative or positive), induced by the presence of lianas, could be observed in the temperature of the host trees.
The question of why liana leaves have higher temperatures than tree leaves can appear counterintuitive in the light of the study by Schnitzer et al. who found that lianas thrive under conditions of high evapotranspiration demand [1], e.g., during a dry season. Lianas are known to demonstrate a high stomatal control and thus, a limited water loss during drought events [26]. As argued by McDowell et al. [27], stomatal closure can help the plant avoid mortality by hydraulic failure but in the long term, lead to carbon starvation and decreased resistance. Thus, stomata eventually need to be reopened to avoid carbon starvation and also to avoid the overheating of the leaves [28,29]. Given that lianas are well adapted to grow under drought [30], they could be expected to be cooler and not hotter than their surrounding plants. However, leaf temperatures are effectively determined by a complex interplay of factors such as the ambient temperature and transpiration [31]. Moisture depletion in plants leads to stomatal closure, reduced transpiration, and eventually higher canopy temperatures [32]. Thus, the higher temperatures of lianas can result from a short-term survival strategy of stomatal closure during the hottest time of the day.
The association between plant temperature and vigor has long been recognized and studied by using, initially, thermal contact sensors ([33] and references therein) and, later, infrared thermometry (e.g., [34,35]). Carlson et al. were one of the first to suggest that the moisture content of vegetated areas can be inferred from satellite thermal infrared imagery [36], a finding that was applied into practice, e.g., by Taconet et al. who used the imagery of National Oceanic and Atmospheric Administration (NOAA) to infer the relationship between the surface temperatures and the water supply (soil moisture content) of vegetation [37]. Heilman et al. were among the first to estimate the evapotranspiration of vegetation using an airborne thermal scanner [38]. With the advent of more lightweight imaging sensors and, more recently, with the proliferation of unmanned aerial vehicle (UAV) systems, thermal scanners have become a popular choice for thermal infrared monitoring and analysis of the health and vigor of vegetation (see e.g., [39] and references therein).
Irrespective of the increasing abundance, and thus of the importance of lianas in the tropics, the ability to detect lianas has not yet been studied using thermal infrared data acquired from a remote sensing platform. The question of whether the potential temperature differences between liana and tree leaves can be detected using remote sensing UAV data is important because it can enhance the current ability to detect lianas. To this end, we mounted a thermal infrared camera on a UAV and used this setup to acquire data over a study area located in a tropical dry forest in Costa Rica, Central America, during the peak of the growing season. The analysis of the thermal infrared data used in this paper builds on a previous study and results by Li et al. [40], who analyzed multispectral imagery from the same study area and in this process, separated the imagery into its various components: liana-infested areas, non-liana infested areas, gaps (areas within the forest with canopies (leaf height of the tallest stems) noticeably lower than in adjacent areas [41]), and dead trees.
The fundamental purpose of this study is to partially fill the knowledge gap on the potential to detect lianas using thermal infrared imagery acquired through a remote sensing platform.

2. Materials and Methods

2.1. Study Area

This study was conducted at the Santa Rosa National Park Environmental Monitoring Super Site (SRNP-EMSS; 10°50’ N, 85°42’ W), located in the Province of Guanacaste, Costa Rica (Figure 1). The SRNP-EMSS covers an area of approximately 495 km2. The average annual temperature is 25 °C, and the average annual precipitation is 1575 mm [42], falling in the form of rain over an average of 256.3 days per year. The wet season extends from May to November, and the dry season extends from November to April. This site conforms to the definition of tropical dry forests by Sánchez-Azofeifa et al. [43]: The mean annual temperature is ≥25 °C, the total annual precipitation ranges between 700 and 2000 mm, and there are three or more dry months every year.
The study area is covered by a tropical dry forest classified into three successional stages based on their time since abandonment: early (1 year to 20 years), intermediate (20 years to 55 years), and old (more than 55 years) stages (estimated after Kalacska et al. and Li et al. [40,44]). When compared to the early and old stages, the intermediate stage has a relatively high abundance of lianas, and thus this study was conducted in an area that predominantly comprises intermediate-stage forest patches.

2.2. Data Acquisition

The UAV data were acquired on 28 June, 2016 using a RotorKonzept® RK-8x multicopter UAV (RKM - RotorKonzept Multikoptermanufaktur GmbH, Abtsteinach, Hessen, Germany) platform. Two successive flights were conducted to cover the whole study area. The first flight took place between 16:39 and 16:43, and the second flight took place between 16:53 and 16:57. The data acquisition was delayed from the planned time (noon) due to inclement weather conditions (occasional showers). The side overlapping rate of the flight routes was 85%, and the forward overlapping rate was ~75%–85%. The data were acquired at 120 m height above ground level under mostly sunny conditions.
Two cameras were mounted on the UAV platform for simultaneous data acquisition: (i) A thermal infrared camera and (ii) a multispectral camera. The thermal infrared data were acquired at 60 Hz, using a FLIR TAU® 2 (FLIR Systems, Wilsonville, OR, USA) 640 broadband camera that collects snapshot images of 640 × 512 pixels in the (7.5 to 13.5) µm wavelength range and registers the thermal response with 14 bit depth. This uncooled camera has a temperature range from −40 to 550 °C and an operating temperature range from −40 to 80 °C. The camera system is calibrated out of the shelf by FLIR with an accuracy of 0.05 K. The multispectral data were acquired using a MicaSense® RedEdgeTM camera (MicaSense Inc., Seattle, WA, USA), which collects data in the 400–900 nm wavelength range in five bands (blue = 475 nm, green = 560 nm, red = 668 nm, “red edge” = 717 nm, and near-infrared = 840 nm). These bands have the following spectral resolutions: 20 nm (blue and green bands), 10 nm (red and red edge bands), and 40 nm (near-infrared bands). The multispectral data analysis is described in detail by Li et al. [40] and summarized here. Li et al. applied deep self-encoding network (DSEN) classification algorithms to multispectral UAV data to estimate the relative coverage of dead, liana-infested, non-liana infested trees, and gaps in the study area. In practice, this was conducted by generating a set of multi-spectral data-derived features (e.g., spectral value features, principal components, and texture features) and providing them to the DSEN to classify the study area into the following image components: Dead trees, liana-infested areas, non-liana infested areas, and gaps [40]. Li et al. further used a set of 57 field observations to guide and validate their data analysis [40].
Due to the different instantaneous field of views (IFOVs) of the cameras, the multispectral and thermal infrared images have different spatial resolutions (0.15 m for the thermal infrared data and 0.08 m for the multispectral data).

2.3. Methods

We conducted the data preprocessing in three steps. First, the individual multispectral and thermal infrared images were separately aligned, and from these images, georeferenced orthomosaics were built using ArcGIS 10.5.0 (Esri, Redlands, CA, USA). In practice, the thermal orthomosaics were georeferenced using 10 ground control points acquired using a precise differential GPS system (Trimble® GeoXT6000; Trimble Inc., Sunnyvale, CA, USA) with an average horizontal precision of 0.5 m and a vertical precision of 0.54 m. These ground control points (GCPs) were obtained during two field campaigns, as detailed in Li et al. [40]. The spatial resolution of the multispectral image was resampled from 0.08 m to 0.15 m (the resolution of the thermal infrared image). Second, using the georeferenced multispectral orthomosaics, a smaller subset area (2.7 ha) of the larger area flown by the UAV (9.8 ha) was chosen for further data analysis because of its predominance of intermediate-stage forest. The successional stage was determined by Li et al. [40]. The thermal infrared data were then spatially subset to coincide with this area. Third, areas classified as liana-infested, non-liana infested, and gaps were extracted using ENVI® 5.0 (L3HarrisTM, Melbourne, FL, USA) from the thermal infrared image, using the classification results by Li et al. [40]. Here, liana-infested areas refer to pixels that have different levels of liana infestation. The study was conducted during the rainy season (the peak of the growing season) because in the study area trees commonly shed their foliage during the dry season, and hence, no reliable results could have been obtained using the methodology by Li et al. [40].
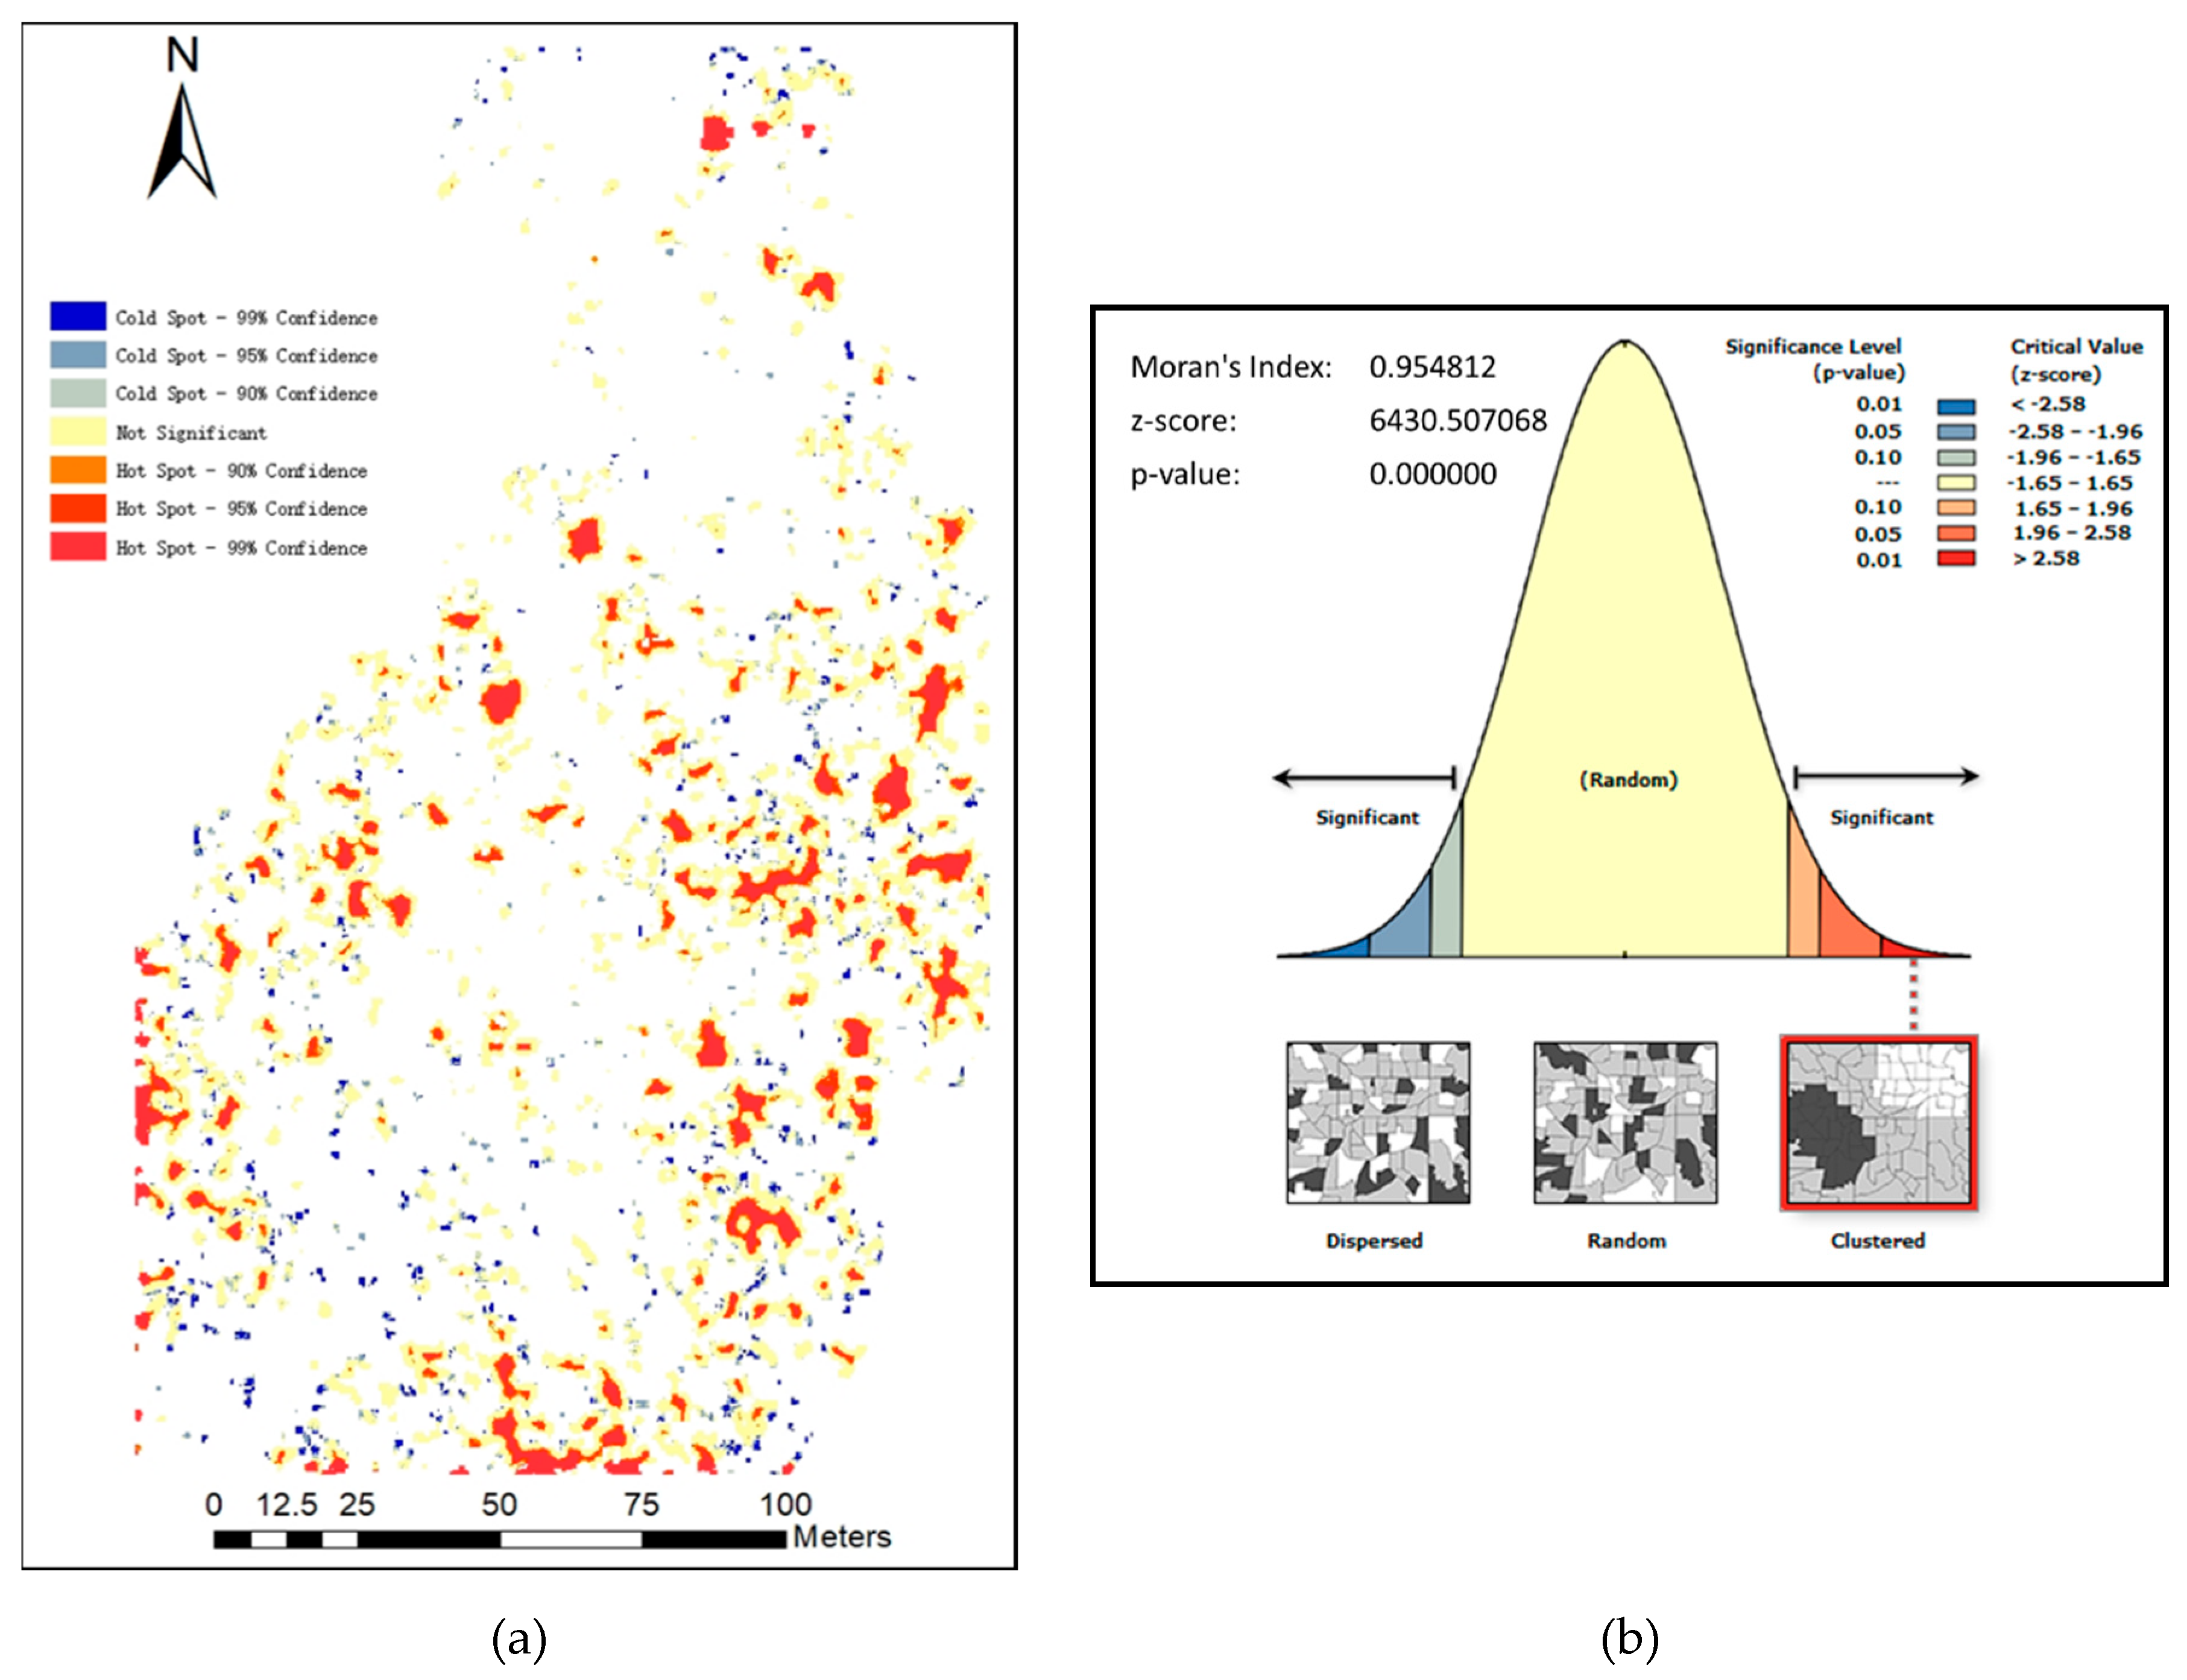
Afterward, a spatial statistics analysis, including the optimized hotspot analysis and the spatial autocorrelation analysis, was conducted on the extracted thermal infrared image of liana-infested area to study how the lianas were distributed. The optimized hotspot analysis was used to show the significant “hot” and “cold” spots, indicating clustered and dispersed areas, respectively. The spatial autocorrelation analysis was used to calculate the Moran’s index I and the p value in order to assess the overall distribution pattern of the lianas. All spatial statistics analyses mentioned were conducted using ArcGIS 10.5.0 (Esri, Redlands, CA, USA).
In the study area, the average tree height is 10 m [44]. As the flight height of the study was 120 m, the atmospheric column was, on average, 110 m between the sensor and the canopy. When the atmospheric column is approximately 100 m, the differences between surface and sensor radiances are minimal as a result of the narrow atmospheric column that minimizes the scattering and absorption effects induced by atmospheric gases and aerosols [45]. Thus, it was not deemed necessary to atmospherically correct the thermal infrared data. In addition, due to the short flight time of less than 5 min, no change in air temperature could be observed, as indicated by simultaneous field measurements.
Next, on the basis of the FLIR documentation, a linear equation (1) was used to convert the raw intensity digital number (DN) values registered by the FLIR TAU® 2 camera into degrees Celsius (FLIR 2016). The export of the single FLIR files was done by using 16bit TIFF-files, a conversion factor that was integrated in Equation (1).
L S T = D N 2 16 1 2 14 1 × 0.04 273.15
To account for the large sample size and known positive autocorrelation (I Moran = 0.954), statistical analyses (Levene’s test, Kolmogorov–Smirnov test, Welch’s test, and Games–Howell post-hoc test, see below for details) were conducted on a random sample taken from the entire dataset. In practice, this random sample comprised 384 observations per image component (liana-infested areas, non-liana infested areas, and gaps). The sample size was selected considering the pixel size of each image component (liana-infested, liana-free, and gaps). Since the sample size was relatively large, theoretically the sample means of each of our image components would follow a normal distribution (see Central Limit Theorem). As such, we selected a random sample from each class (using a 50% response distribution assumption), which would provide us a confidence interval of 95% (α = 0.05).
Finally, statistical analyses were conducted to study the inherent properties of the dataset. These analyses were conducted using the subset sample consisting of 384 samples per image component, as discussed above. First, Levene’s test of homogeneity of variances [46] was used to compare the variances of the image components. Second, the Kolmogorov–Smirnov [47] test was used to compare the residuals of the subset sample against a reference probability distribution. Third, the Welch’s test [48,49] and the Games–Howell post-hoc test [50] were used to test if there were differences among the temperatures of the image components. These statistical tests (Welch’s and Games–Howell) were selected on the basis of the results from Levene’s test and Kolmogorov–Smirnov test (non-normal data distribution). Both tests are robust against non-normal data distributions [50,51]. More specifically the Games–Howell post-hoc test was utilized to test if there were special groups differing from the overall results. All statistical analyses were conducted using IBM® SPSS® (IBM, Armonk, NY, USA) statistics 25 at a 95% confidence interval.

3. Results

3.1. Spatial Distribution of the Image Components

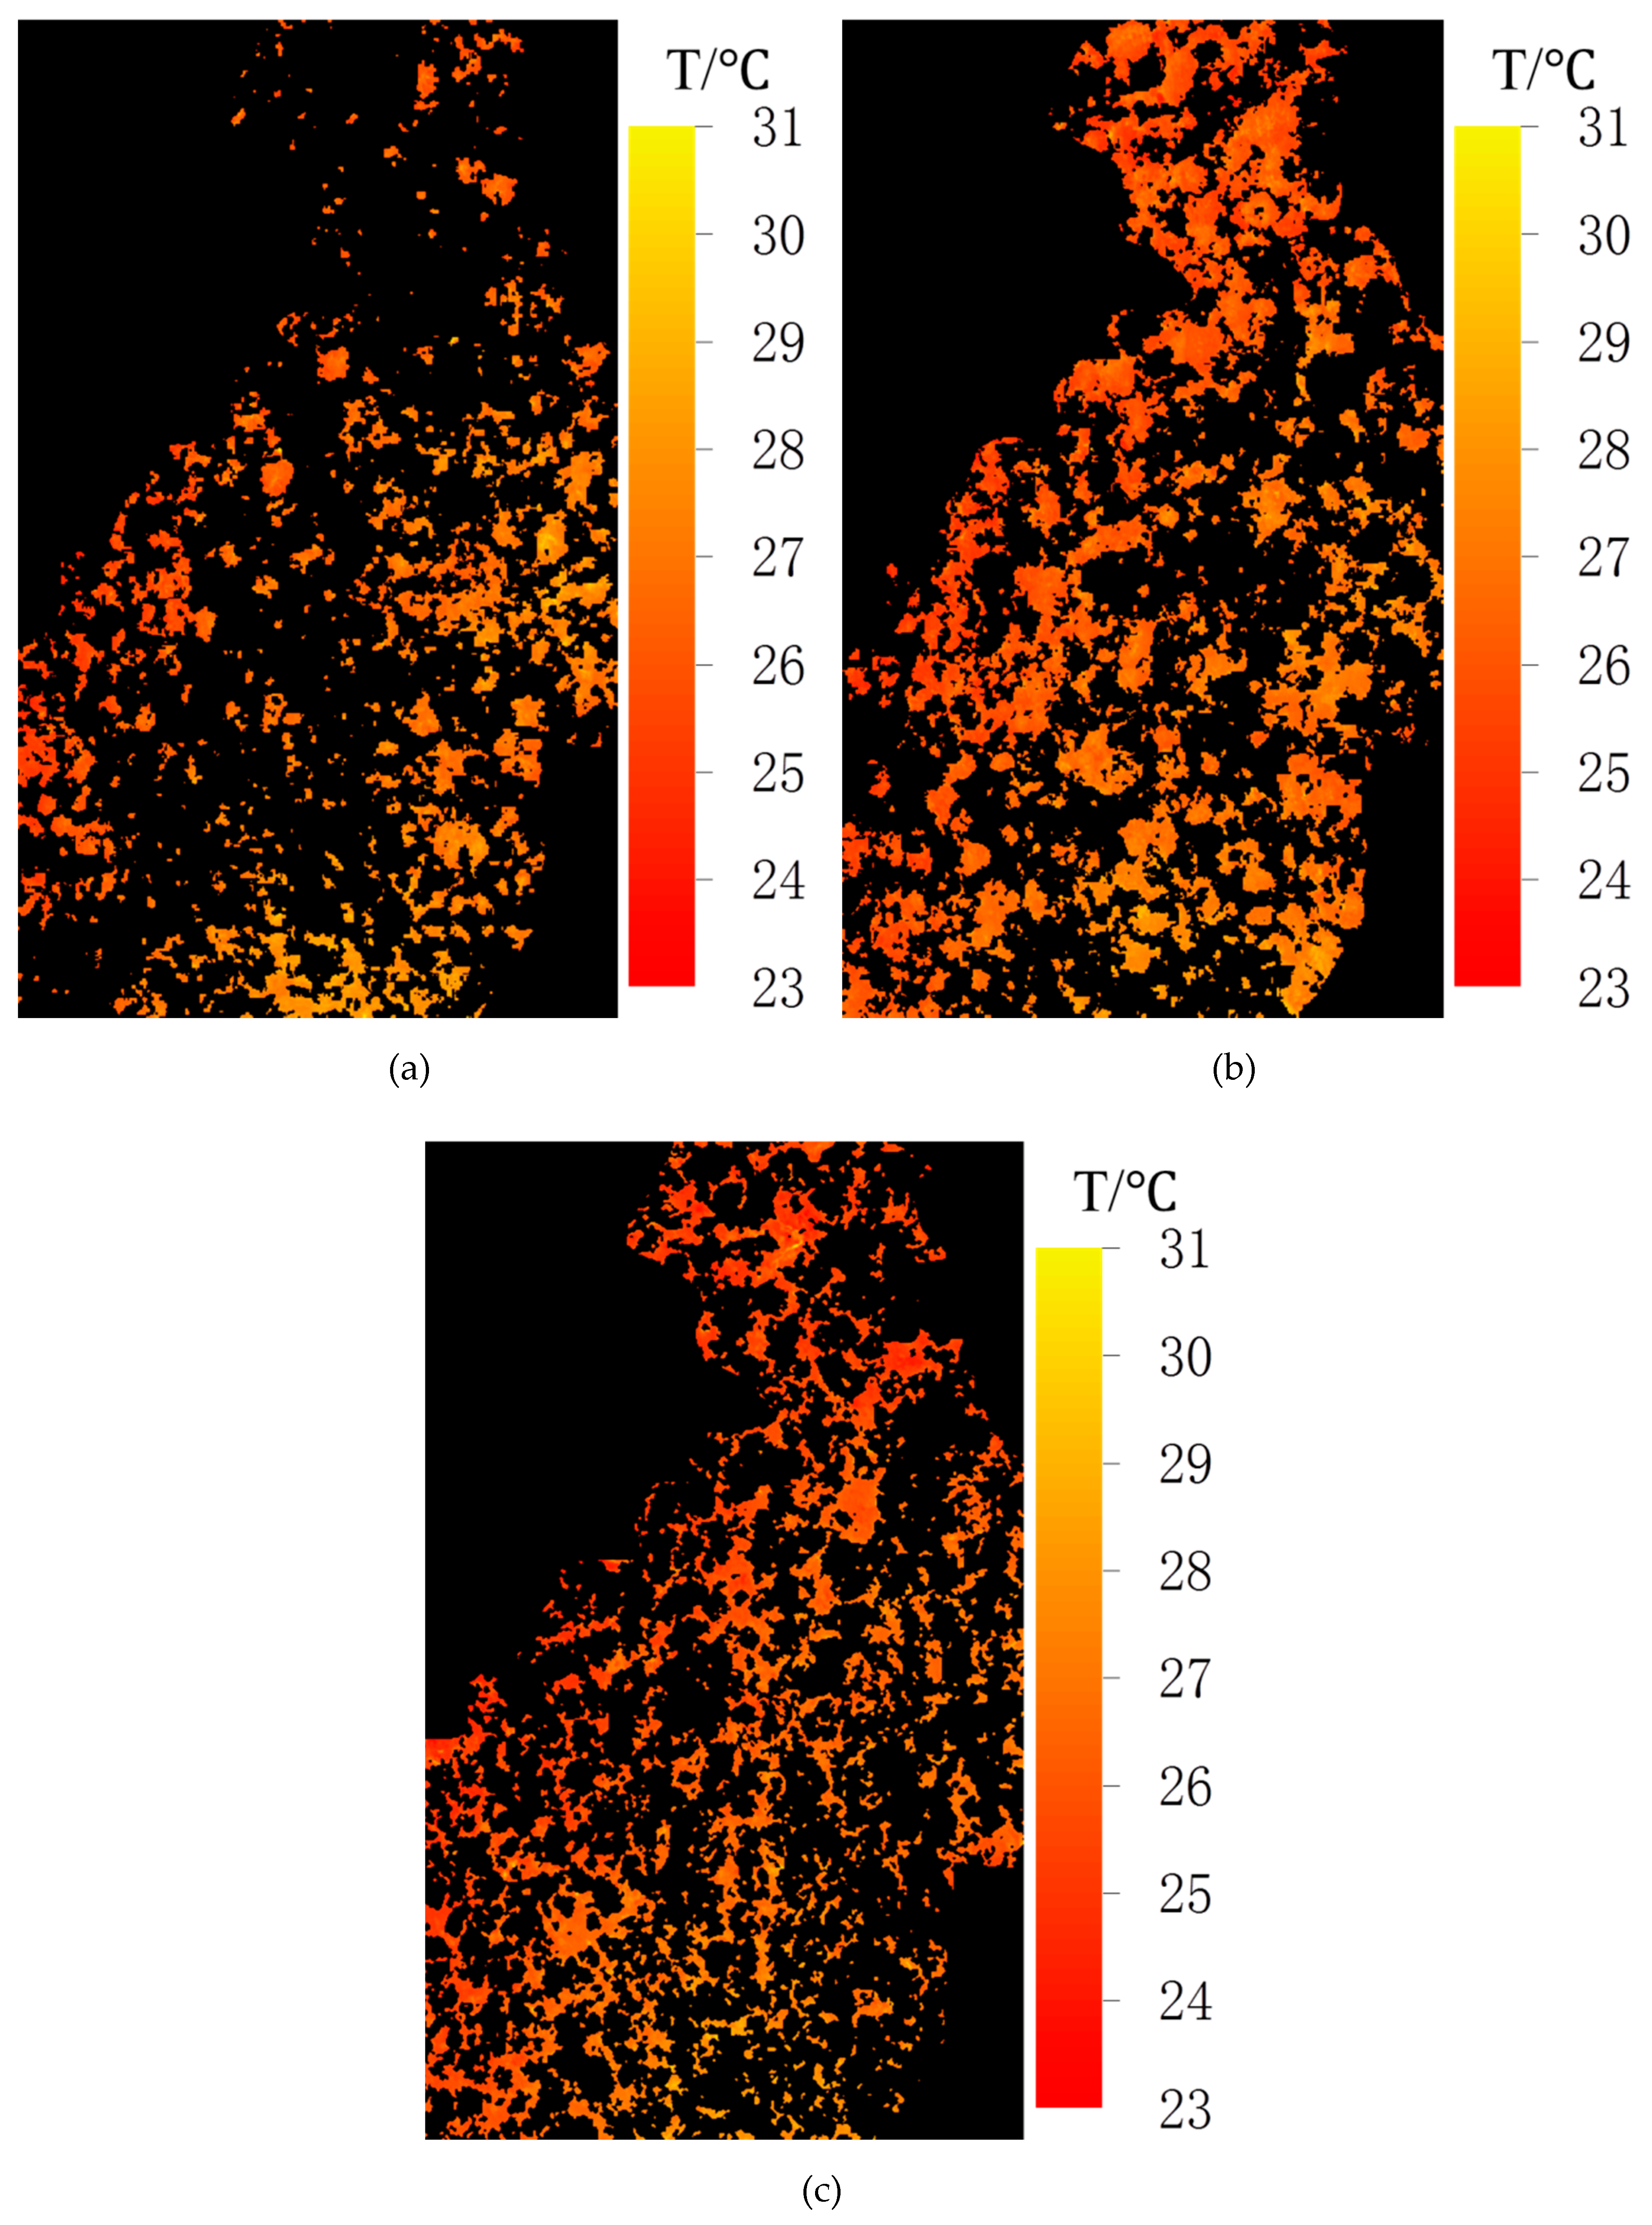
Among the image components, extracted from the thermal infrared imagery and shown in Figure 2a–c, the liana-infested areas (Figure 2a, 225,647 pixels, 19.1%) covered the smallest surface area, whereas the non-liana infested areas covered the largest surface area (Figure 2b, 420,811 pixels, 35.6%). Gaps (Figure 2c, 307,126 pixels) covered the second largest surface area (26.0%). In addition, 19.2% of the pixels inside the study area were unclassified. These pixels belonged to the category of dead trees according to Li et al. [40], a category that was left out, since studying and comparing dead tree surface temperatures was not part of this study.
The results of the spatial statistics analysis (Figure 3a,b) showed the clustered and dispersed areas and the values of Moran’s index I (0.95) and p (0). Thus, it was documented that the lianas were not randomly distributed.

3.2. Temperature Distributions of the Image Components

Our study suggests that forest gaps have the biggest skewness in temperature distribution (0.34), followed by non-liana infested areas (0.31), and liana-infested areas (−0.02), but overall the data were fairly symmetric (skewness < 0.5; interpretation: [52]). Furthermore, the data were either platykurtic, or “flat” (liana-infested areas: −0.28; non-liana infested areas: −0.24) or very close to normal (gaps: 0.03; interpretation: [53]).
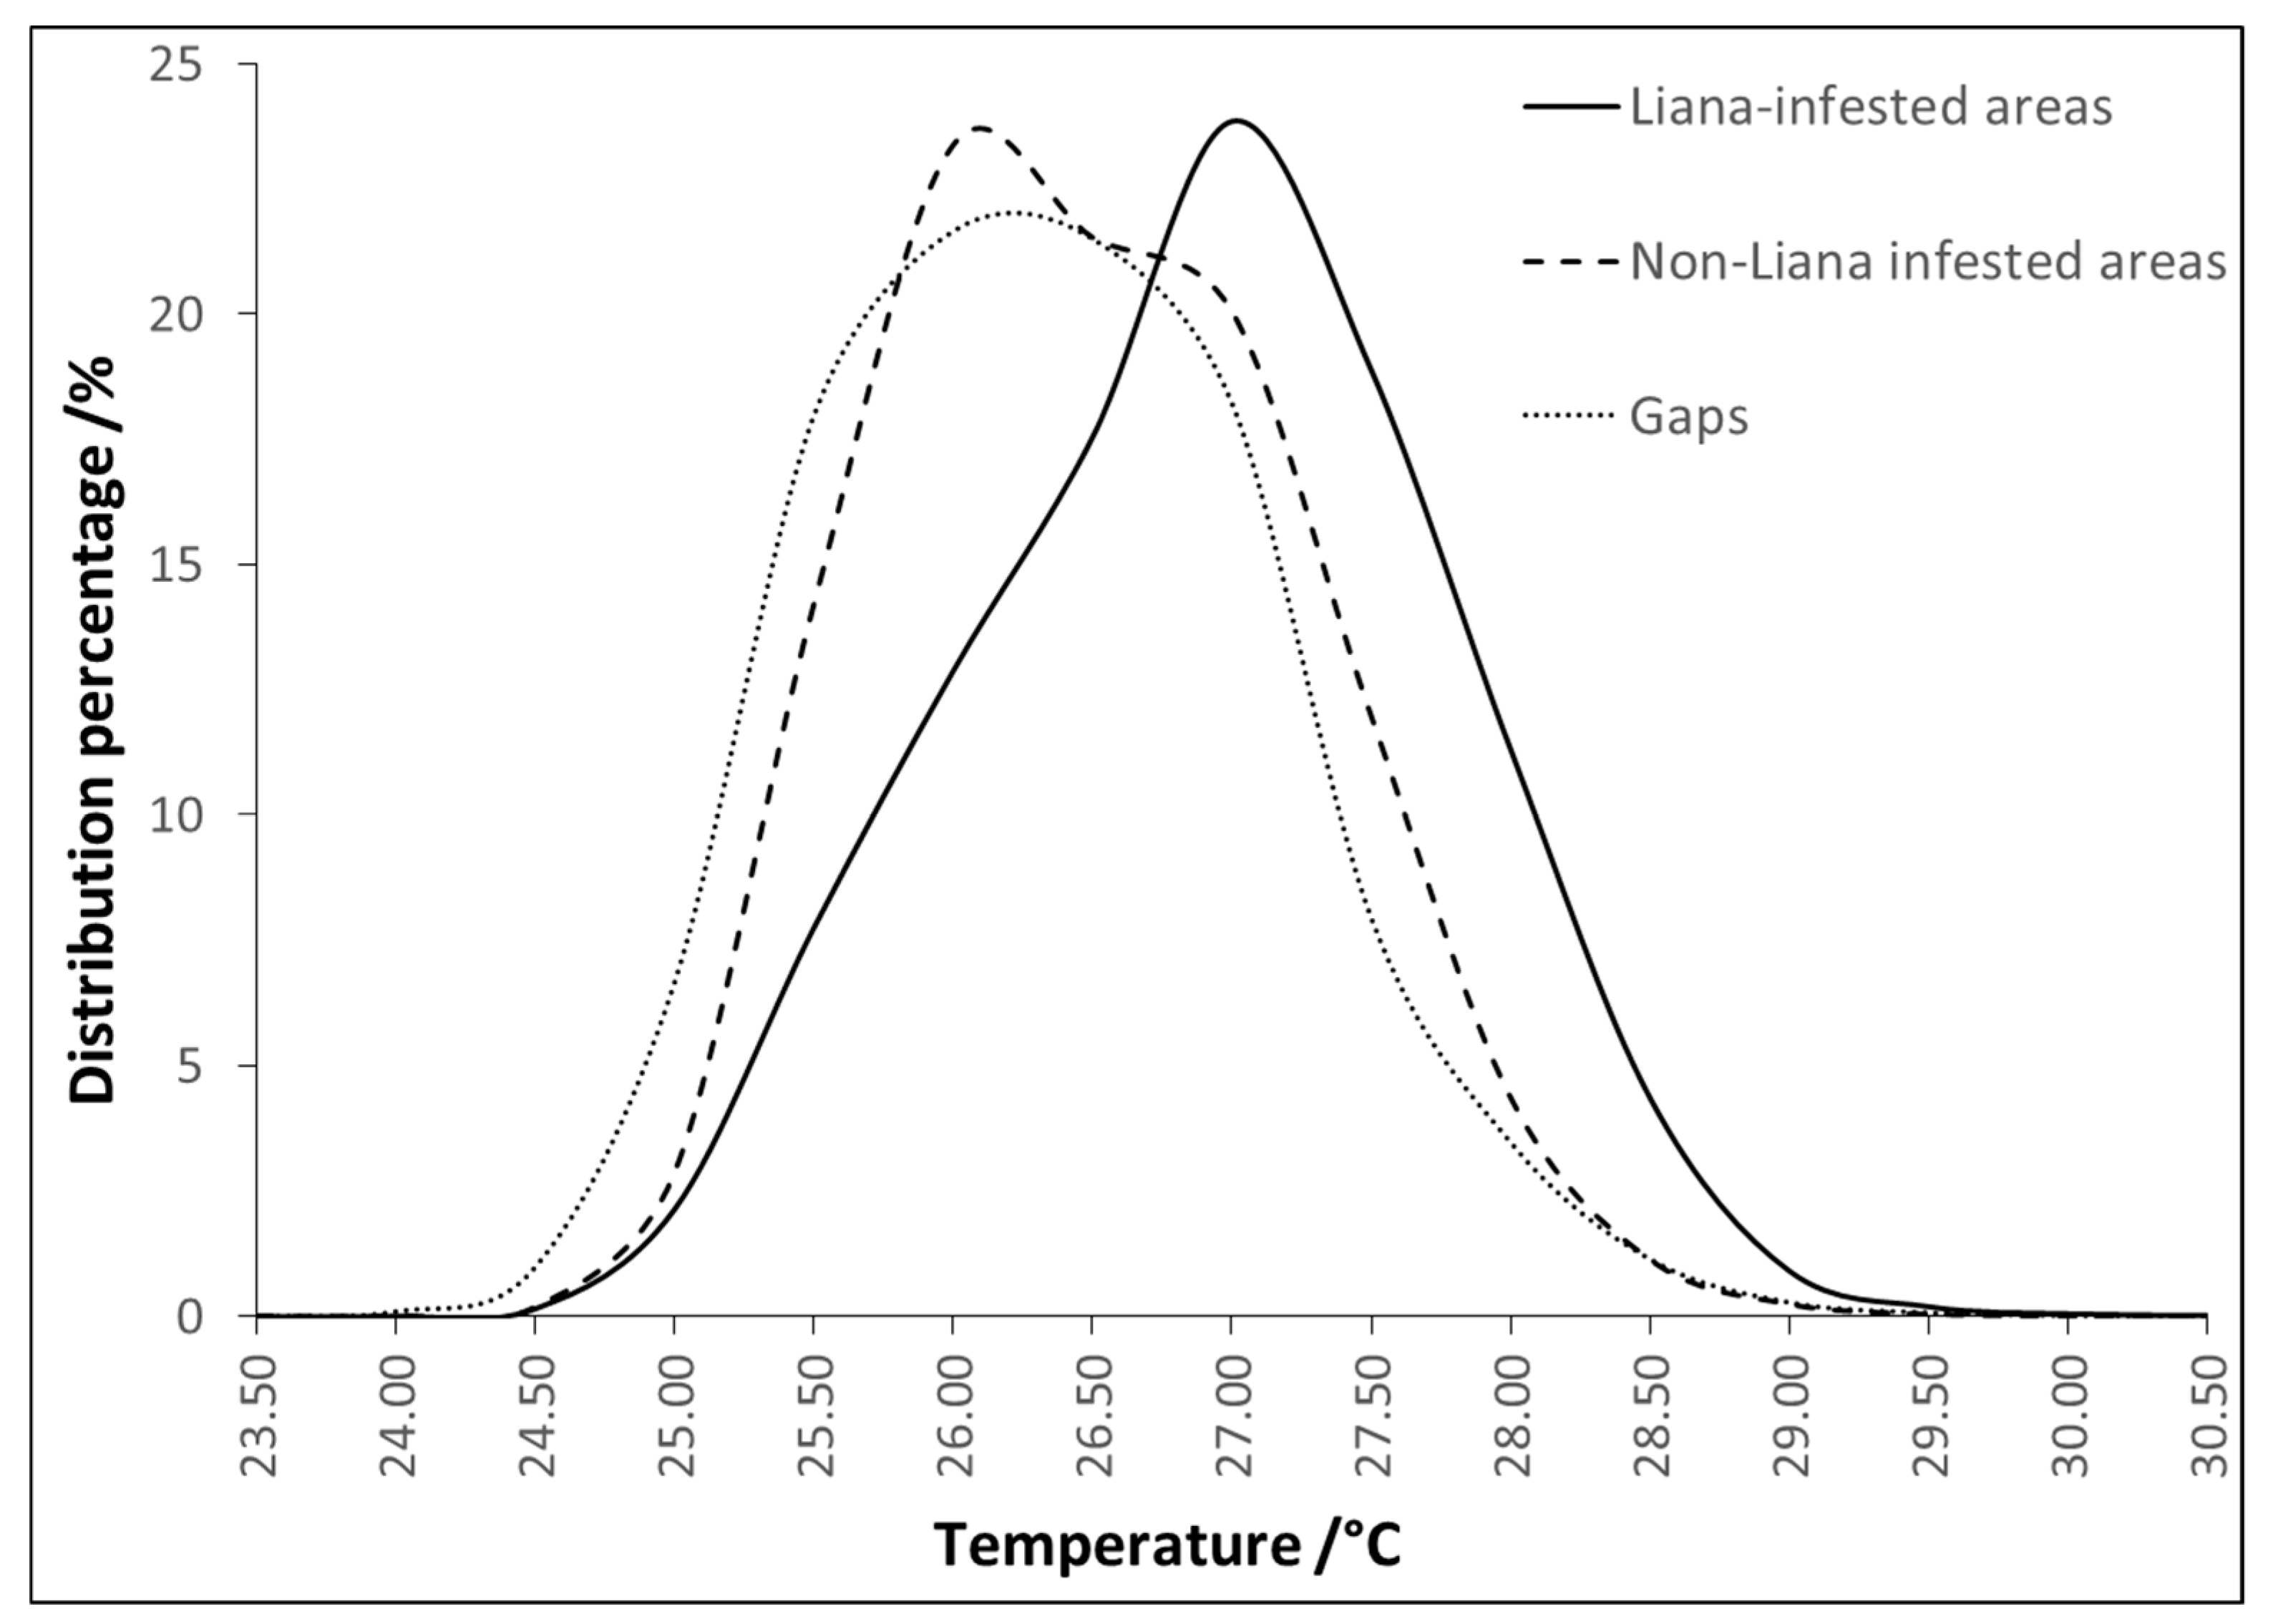
The mean values of the image components, shown in Table 1, ranged between 26.10 (gaps) and 26.67 °C (liana-infested areas), whereas the mean value of the non-liana infested areas fell in between the extremes, being 26.26 °C. Furthermore, the temperature distribution of the different areas indicated that the minimum and maximum temperatures of each component fell into a range from 23.52 to 30.89 °C (mean of 26.41 °C).
When assessing the temperature differences using the median values, displayed in Figure 4 and Table 1, the same trend of liana-infested areas having a higher temperature (26.71 °C) than non-liana infested area (26.22 °C) could be observed. Again, gaps had the lowest median temperature (26.07 °C). Liana-infested areas showed the greatest temperature variance (0.85) of all the image components, followed by gaps (0.81) and non-liana infested areas (0.77).
The statistical analysis conducted using the smaller subsample of 384 temperature observations per image component revealed that, according to the Levene’s test of homogeneity of variances, the data were homoscedastic (F(2, 1149) = 1.899, p = 0.15, Table S1). Furthermore, based on the Kolmogorov–Smirnov test (Table S2), the residuals of the data from each category were not normally distributed (p = 0). Because of the non-normal data distribution, we chose the the Welch’s and Games–Howell post-hoc test. The results of the Welch’s test showed that there were statistically significant differences in the temperature data set of the three categories (p = 0; Table 2). The Games–Howell post-hoc test further suggested that these differences were significant across all combinations of temperature, except for non-liana infested areas and gaps (Table 3). We thus rejected the null hypothesis of the tests that the population means of the three categories were equal and accepted the alternative hypothesis of statistically significant differences between the levels of the independent variables (liana-infested areas, non-liana infested areas, and gaps).

4. Discussion

Our study has documented that in general, liana-infested areas have a higher mean temperature than non-liana infested areas in the Santa Rosa National Park Environmental Monitoring Super Site. This temperature difference corroborates field-based observations by Sanchez-Azofeifa et al. [24] and Guzmán et al. [25], who also observed that, on average, liana leaves have a higher temperature than tree leaves in a Panamanian tropical dry forest.
The mean temperature difference between the liana-infested and the non-liana infested areas in our study is smaller than what was observed in previous studies by Sanchez-Azofeifa et al. [24] and Guzmán et al. [25]. Despite the observed small temperature differences, such differences can be important to enhance the current ability to detect the presence of lianas by remote sensing. Also, environmental temperature is a primary variable important for biological function at all organizational scales. Even slight temperature changes can dramatically affect biological processes from cells to populations, with ecological consequences [54].
Two factors can potentially contribute to the smaller temperature difference detected in this study and thus merit discussion.
First, our study was conducted using a UAV remote sensing platform with a distance of approximately 110 m between the canopy and the sensor, unlike the previous studies by Sanchez-Azofeifa et al. [24] and Guzmán et al. [25] who acquired their data as contact measurements or from a distance of 1.8 m, respectively. Despite the high spatial resolution of 0.15 m of the thermal infrared data, it is possible that there is some spectral mixing between liana leaves and tree leaves [55], thus normalizing the differences that could be observed at the level of individual leaves or from a shorter distance. Also, potential spectral thermal mixing (similar to multi- and hyperspectral mixing based on optical remote sensing) between the canopy and the other components at higher temperatures can influence the remotely detected temperature values of the mixed pixels. As reported by Pau et al. [56], since there can be inter-species temperature variation within canopy and between canopy and bark, bark being generally the warmest of these elements, it is clear that with a spatial resolution of 0.15 m, spectral thermal mixing will take place. Under direct solar irradiation, the most extreme temperatures can be observed in soils [57], a factor that can influence the temperatures of mixed pixels, in particular in transitions zones between different land-cover types (e.g., anthropogenic infrastructure or fire-break areas in a forest). Taken together, spectral thermal mixing between different categories can influence the temperatures observed in each pixel in a complex, wavelength-dependent, and non-linear manner, even when the spatial resolution of the data is high.
Second, unlike the study by Guzmán et al. [25], who conducted their research around midday, the thermal infrared data used in our study were acquired in the late afternoon (16:39 to 16:57), nearly five hours after midday. The data acquisition time is significant, since lianas have been reported to have a low stomatal conductance around midday [58]. Chen et al. concluded that the closing of the stomata around the hottest time of the day can help lianas maintain their stem water potential, a feature particularly important for species located at the top of the canopy and thus fully exposed to irradiance [58]. As also suggested by Guzmán et al. [25], this can partially explain the observations of lianas leaves being at higher temperatures than tree leaves. Hence, since the data used in our study were not acquired at the hottest time of the day, the late data acquisition time might have caused a smaller temperature difference between liana leaves and tree leaves. However, it should be noted that multiple factors such as the leaf morphology of different species and the size and surface properties of these species can affect leaf temperatures [59,60]. At a canopy level, the structural (e.g., leaf density, leaf angle distribution) and positional (e.g., sunlit vs shade leaves) properties of the canopy can furthermore affect the observed temperatures as a result of variations in latent heat fluxes, dense canopies being cooler than spare canopies [56].
Furthermore, our results suggest that the liana distribution patterns are not random, according to the results of the spatial statistics analysis (Moran’s index I = 0.95, p = 0). This finding confirms previous studies by Talley et al. [61], Rice et al. [62], Allen et al. [63], and Carsten et al. [64], who also documented that lianas are not distributed randomly on host tree. It should be noted that we conducted the analyses at a pixel level because lianas can cover only a part of the canopy of an individual tree [65] or spread across the canopies of several individual trees [66]. Hence, it is not practical to try to map individual liana-infested tree canopies.
Although the temperature differences between liana-infested and non-liana infested areas were the main focus of our research, we also investigated the differences between liana-infested areas, non-liana infested areas, and gaps to obtain a comprehensive understanding on the temperature variation of these three categories. A mean temperature difference of 0.57 °C was encountered between the liana-infested areas and the forest gaps (forest gaps being cooler; see e.g., Table 1). Such gaps are known to have relatively high temperatures and evaporative gradients, as well as low humidity [6]. However, when the viewing point is from the nadir, as is typically the case in remote sensing, gaps are shaded and thus protected from direct irradiance. Hence, our finding of gaps having a lower average temperature than the living trees is not unexpected. It should also be noted that shadowing changes as a function of the solar angle in the course of the day, a factor that renders the temperatures of gaps subject to these changes. Despite the lower temperature of gaps, when compared to living trees, the difference between non-liana infested trees and gaps was not statistically significant. We attribute this phenomenon to the understory vegetation (e.g., shrubs and small trees) in gaps which, depending on the gap, can render the temperature differences between gaps and living trees small. In the case of liana-infested trees and gaps, the higher temperature of lianas (when compared to non-liana infested trees) was statistically significant.
Given the narrow range of the observed temperature difference between the liana-infested areas and the other categories studied in this paper, more research needs to be conducted to determine whether this information can be used as a parameter for the detection of liana infestation in tropical forests and, in turn, for automated detection of liana clusters in a time-effective manner and independently of human interpretation [67]. Nevertheless, our findings are important because they confirm that these differences observed at the leaf level [24,25] can be detected using a remote sensing platform, a finding that potentially has implications for classification and modeling efforts, such as those that aim at large-scale assessments of liana extent. Furthermore, as the increase of canopy temperature can cause shifts in the optimum geographic climate areas for the growth of plants and other species [68], our finding indicates that liana infestation can result in an average higher temperature and thus would potentially alter future forest tree symbioses and species composition.

5. Conclusions

Our results suggest that liana-infested areas have a higher average temperature (0.41 °C) than non-liana infested areas. This finding conforms to those of previous studies that were carried out within a short distance of or in contact with the canopy. Unlike these studies, our results were obtained using thermal infrared remote sensing data acquired by a UAV system, which indicates that temperature differences can be observed by remote sensing. Moreover, our results suggest that forest gaps have an overall cooler temperature than living trees in a tropical dry forest, which we propose to be a direct consequence of gaps being sheltered from direct solar irradiance, a result that contradicts some ground-based observations. In general, our findings offer new information that has the potential to be used to fine-tune local and regional-scale classification and modeling efforts. Furthermore, our work suggests that new approaches used to untangle the effect of thermal unmixing will be necessary in the near future, as thermal sensors become more readily available.

Supplementary Materials

The following are available online at https://www.mdpi.com/1999-4907/10/10/890/s1. Table S1: The results of the Levene’s test; Table S2: The results of the Kolmogorov–Smirnov Test; Table S3: Statistical characteristics of the canopy temperatures of the liana-infested areas, non-liana infested areas, and gaps of the subsample; Figure S1: Temperature distributions of the (a) liana-infested areas, (b) non-liana infested areas, and (c) gaps.

Author Contributions

G.A.S.-A. and P.M. conceived and designed the study. P.M. acquired the data. X.Y. and K.L. led the analysis and interpretation of data and drafted the first version of the manuscript. K.L., G.A.S.-A., and P.M. assisted with the analysis and interpretation of data and contributed to writing. All authors contributed to editing and revising the final manuscript. All authors read and approved the final manuscript.

Funding

This research was funded by the Natural Sciences and Engineering Research Council of Canada (NSERC) Discovery Grant Program, and the Chinese Scholarship Program by China Scholarship Council (CSC, 201706150069). The APC was funded by Arturo Sanchez-Azofeifa.

Acknowledgments

We thank Qinglin Meng for his help and support to Xu Yuan on this work. We thank Carlos Andres Campos for helping Xu Yuan to get familiar with the data at the beginning of this work. We thank the reviewers for their valuable comments and efforts towards improving our manuscript.

Conflicts of Interest

The authors declare no conflict of interest.

References

  1. Schnitzer, S.A.; Bongers, F.; Wright, S.J. Community and ecosystem ramifications of increasing lianas in neotropical forests. Plant Signal. Behav. 2011, 6, 598–600. [Google Scholar] [CrossRef] [PubMed] [Green Version]
  2. Janzen, D.H. Tropical dry forests. In Biodiversity, 1st ed.; Wilson, E.O., Ed.; National Academy Press: Washington, DC, USA, 1988; pp. 130–137. [Google Scholar]
  3. Morris, R.J. Anthropogenic impacts on tropical forest biodiversity: A network structure and ecosystem functioning perspective. Philos. Trans. R. Soc. Lond. Ser. B 2010, 365, 3709–3718. [Google Scholar] [CrossRef] [PubMed]
  4. Allen, C.D.; Macalady, A.K.; Chenchouni, H.; Bachelet, D.; McDowell, N.; Vennetier, M.; Kitzberger, T.; Rigling, A.; Breshears, D.D.; Hogg, E.T.; et al. A global overview of drought and heat-induced tree mortality reveals emerging climate change risks for forests. For. Ecol. Manag. 2010, 259, 660–684. [Google Scholar] [CrossRef] [Green Version]
  5. Balfour, D.A.; Bond, W.J. Factors limiting climber distribution and abundance in a southern African forest. J. Ecol. 1993, 81, 93–100. [Google Scholar] [CrossRef]
  6. Schnitzer, S.A. A mechanistic explanation for global patterns of liana abundance and distribution. Am. Nat. 2005, 166, 262–276. [Google Scholar] [CrossRef] [PubMed]
  7. Ingwell, L.L.; Wright, S.J.; Becklund, K.K.; Hubbell, S.P.; Schnitzer, S.A. The impact of lianas on 10 years of tree growth and mortality on Barro Colorado Island, Panama. J. Ecol. 2010, 98, 879–887. [Google Scholar] [CrossRef] [Green Version]
  8. Schnitzer, S.A.; Bongers, F. The ecology of lianas and their role in forests. Trends Ecol. Evol. 2002, 17, 223–230. [Google Scholar] [CrossRef] [Green Version]
  9. Van der Heijden, G.M.F.; Phillips, O.L. Liana infestation impacts tree growth in a lowland tropical moist forest. Biogeosciences 2009, 6, 2217–2226. [Google Scholar] [CrossRef] [Green Version]
  10. Schnitzer, S.A.; Kuzee, M.E.; Bongers, F. Disentangling above-and below-ground competition between lianas and trees in a tropical forest. J. Ecol. 2005, 93, 1115–1125. [Google Scholar] [CrossRef]
  11. Alvira, D.; Putz, F.E.; Fredericksen, T.S. Liana loads and post-logging liana densities after liana cutting in a lowland forest in Bolivia. For. Ecol. Manag. 2004, 190, 73–86. [Google Scholar] [CrossRef]
  12. Phillips, O.L.; Vásquez Martínez, R.; Monteagudo Mendoza, A.; Baker, T.R.; Núñez Vargas, P. Large lianas as hyperdynamic elements of the tropical forest canopy. Ecology 2005, 86, 1250–1258. [Google Scholar] [CrossRef]
  13. Duran, S.M.; Gianoli, E. Carbon stocks in tropical forests decrease with liana density. Biol. Lett. 2013, 9, 20130301. [Google Scholar] [CrossRef] [PubMed]
  14. Schnitzer, S.A.; Dalling, J.W.; Carson, W.P. The impact of lianas on tree regeneration in tropical forest canopy gaps: Evidence for an alternative pathway of gap-phase regeneration. J. Ecol. 2000, 88, 655–666. [Google Scholar] [CrossRef]
  15. Schnitzer, S.A.; Carson, W.P. Lianas suppress tree regeneration and diversity in treefall gaps. Ecol. Lett. 2010, 13, 849–857. [Google Scholar] [CrossRef] [PubMed] [Green Version]
  16. Kainer, K.A.; Wadt, L.H.O.; Gomes-Silva, D.A.P.; Capanu, M. Liana loads and their association with Bertholletia excelsa fruit and nut production, diameter growth and crown attributes. J. Trop. Ecol. 2006, 22, 147–154. [Google Scholar] [CrossRef]
  17. Grauel, W.T.; Putz, F.E. Effects of lianas on growth and regeneration of Prioria copaifera in Darien, Panama. For. Ecol. Manag. 2004, 190, 99–108. [Google Scholar] [CrossRef]
  18. Phillips, O.L.; Martínez, R.V.; Arroyo, L.; Baker, T.R.; Killeen, T.; Lewis, S.L.; Malhi, Y.; Mendoza, A.M.; Neill, D.; Vargas, P.N. Increasing dominance of large lianas in Amazonian forests. Nature 2002, 418, 770–774. [Google Scholar] [CrossRef] [Green Version]
  19. Phillips, O.; Gentry, A.H. The useful plants of Tambopata, Peru: II. Additional hypothesis testing in quantitative ethnobotany. Econ. Bot. 1993, 47, 33–43. [Google Scholar] [CrossRef]
  20. Condon, M.A.; Sasek, T.W.; Strain, B.R. Allocation patterns in two tropical vines in response to increased atmospheric CO2. Funct. Ecol. 1992, 6, 680–685. [Google Scholar] [CrossRef]
  21. Van der Heijden, G.M.F.; Schnitzer, S.A.; Powers, J.S.; Phillips, O.L. Liana impacts on carbon cycling, storage and sequestration in tropical forests. Biotropica 2013, 45, 682–692. [Google Scholar] [CrossRef]
  22. Van der Heijden, G.M.F.; Healey, J.R.; Phillips, O.L. Infestation of trees by lianas in a tropical forest in Amazonian Peru. J. Veg. Sci. 2008, 19, 747–756. [Google Scholar] [CrossRef]
  23. Van der Heijden, G.M.F.; Powers, J.S.; Schnitzer, S.A. Lianas reduce carbon accumulation and storage in tropical forests. Proc. Natl. Acad. Sci. USA 2015, 112, 13267–13271. [Google Scholar] [CrossRef] [PubMed] [Green Version]
  24. Sanchez-Azofeifa, A.; Rankine, C.; do Espirito Santo, M.M.; Fatland, R.; Garcia, M. Wireless sensing networks for environmental monitoring: Two case studies from tropical forests. In Proceedings of the IEEE 7th International Conference on eScience, Stockholm, Sweden, 5–8 December 2011. [Google Scholar]
  25. Guzmán, Q.J.A.; Sánchez-Azofeifa, G.A.; Rivard, B. Differences in leaf temperature between lianas and trees in the neotropical canopy. Forests 2018, 9, 307. [Google Scholar] [CrossRef]
  26. Cai, Z.Q.; Schnitzer, S.A.; Bongers, F. Seasonal differences in leaf-level physiology give lianas a competitive advantage over trees in a tropical seasonal forest. Oecologia 2009, 161, 25–33. [Google Scholar] [CrossRef] [PubMed] [Green Version]
  27. McDowell, N.; Pockman, W.T.; Allen, C.D.; Breshears, D.D.; Cobb, N.; Kolb, T.; Plaut, J.; Sperry, J.; West, A.; Williams, D.G.; et al. Mechanisms of plant survival and mortality during drought: Why do some plants survive while others succumb to drought? New Phytol. 2008, 178, 719–739. [Google Scholar] [CrossRef] [PubMed]
  28. Zweifel, R.; Rigling, A.; Dobbertin, M. Species-specific stomatal response of trees to drought—A link to vegetation dynamics? J. Veg. Sci. 2009, 20, 442–454. [Google Scholar] [CrossRef]
  29. Haldimann, P.; Gallé, A.; Feller, U. Impact of an exceptionally hot dry summer on photosynthetic traits in oak (Quercus pubescens) leaves. Tree Physiol. 2008, 28, 785–795. [Google Scholar] [CrossRef] [PubMed] [Green Version]
  30. Schnitzer, S.A.; Bongers, F. Increasing liana abundance and biomass in tropical forests: Emerging patterns and putative mechanisms. Ecol. Lett. 2011, 14, 397–406. [Google Scholar] [CrossRef] [PubMed]
  31. Lin, H.; Chen, Y.; Zhang, H.; Fu, P.; Fan, Z. Stronger cooling effects of transpiration and leaf physical traits of plants from a hot dry habitat than from a hot wet habitat. Funct. Ecol. 2017, 31, 2202–2211. [Google Scholar] [CrossRef] [Green Version]
  32. Anderson, M.; Kustas, W. Thermal remote sensing of drought and evapotranspiration. Eos Trans. Am. Geophys. Union 2008, 89, 233–240. [Google Scholar] [CrossRef]
  33. Gates, D.M. Leaf temperature and transpiration. Agron. J. 1964, 56, 273–277. [Google Scholar] [CrossRef]
  34. Monteith, J.L.; Szeicz, G. Radiative temperature in the heat balance of natural surfaces. Q. J. R. Meteorol. Soc. 1962, 88, 496–507. [Google Scholar] [CrossRef]
  35. Jackson, R.D.; Idso, S.B.; Reginato, R.J.; Pinter, P.J., Jr. Canopy temperature as a crop water stress indicator. Water Resour. Res. 1981, 17, 1133–1138. [Google Scholar] [CrossRef]
  36. Carlson, T.N.; Dodd, J.K.; Benjamin, S.G.; Cooper, J.N. Satellite estimation of the surface energy balance, moisture availability and thermal inertia. J. Appl. Meteorol. 1981, 20, 67–87. [Google Scholar] [CrossRef]
  37. Taconet, O.; Bernard, R.; Vidal-Madjar, D. Evapotranspiration over an agricultural region using a surface flux/temperature model based on NOAA-AVHRR data. J. Appl. Meteorol. Climatol. 1986, 25, 284–307. [Google Scholar] [CrossRef]
  38. Heilman, J.L.; Kanemasu, E.T.; Rosenberg, N.J.; Blad, B.L. Thermal scanner measurement of canopy temperatures to estimate evapotranspiration. Remote Sens. Environ. 1976, 5, 137–145. [Google Scholar] [CrossRef]
  39. Sullivan, D.G.; Fulton, J.P.; Shaw, J.N.; Bland, G. Evaluating the sensitivity of an unmanned thermal infrared aerial system to detect water stress in a cotton canopy. Trans. ASABE 2007, 50, 1963–1969. [Google Scholar] [CrossRef]
  40. Li, W.; Campos-Vargas, C.; Marzahn, P.; Sanchez-Azofeifa, A. On the estimation of tree mortality and liana infestation using a deep self-encoding network. Int. J. Appl. Earth Obs. Geoinf. 2018, 73, 1–13. [Google Scholar] [CrossRef]
  41. Runkle, J.R. Guidelines and sample protocol for sampling forest gaps. In Gen. Tech. Rep. PNW-GTR-283; U.S. Department of Agriculture, Forest Service, Pacific Northwest Research Station: Portland, OR, USA, 1992; 44p. [Google Scholar]
  42. Castro, S.M.; Sanchez-Azofeifa, G.A.; Sato, H. Effect of drought on productivity in a Costa Rican tropical dry forest. Environ. Res. Lett. 2018, 13, 045001. [Google Scholar] [CrossRef]
  43. Sánchez-Azofeifa, G.A.; Quesada, M.; Rodríguez, J.P.; Nassar, J.M.; Stoner, K.E.; Castillo, A.; Garvin, T.; Zent, E.L.; Calvo-Alvarado, J.C.; Kalacska, M.E.R.; et al. Research priorities for neotropical dry forests. Biotropica 2005, 37, 477–485. [Google Scholar]
  44. Kalacska, M.; Sanchez-Azofeifa, G.A.; Calvo-Alvarado, J.C.; Quesada, M.; Rivard, B.; Janzen, D.H. Species composition, similarity and diversity in three successional stages of a seasonally dry tropical forest. For. Ecol. Manag. 2004, 200, 227–247. [Google Scholar] [CrossRef]
  45. Iqbal, F.; Lucieer, A.; Barry, K. Simplified radiometric calibration for UAS-mounted multispectral sensor. Eur. J. Remote Sens. 2018, 51, 301–313. [Google Scholar] [CrossRef]
  46. Levene, H. Robust tests for equality of variances. In Contributions to Probability and Statistics, 1st ed.; Olkin, I., Ed.; Stanford University Press: Palo Alto, CA, USA, 1961; pp. 278–292. [Google Scholar]
  47. Massey, F.J., Jr. The Kolmogorov-Smirnov test for goodness of fit. J. Am. Stat. Assoc. 1951, 46, 68–78. [Google Scholar] [CrossRef]
  48. Welch, B.L. The significance of the difference between two means when the population variances are unequal. Biometrika 1938, 29, 350–362. [Google Scholar] [CrossRef]
  49. Welch, B.L. On the comparison of several mean values: An alternative approach. Biometrika 1951, 38, 330–336. [Google Scholar] [CrossRef]
  50. Games, P.A.; Howell, J.F. Pairwise multiple comparison procedures with unequal n’s and/or variances: A Monte Carlo study. J. Educ. Behav. Stat. 1976, 1, 113–125. [Google Scholar]
  51. Cribbie, R.A.; Wilcox, R.R.; Bewell, C.; Keselman, H.J. Tests for treatment group equality when data are nonnormal and heteroscedastic. J. Mod. Appl. Stat. Methods 2007, 6, 117–132. [Google Scholar] [CrossRef]
  52. Lin, L.; Chu, H. Quantifying publication bias in meta-analysis. Biometrics 2018, 74, 785–794. [Google Scholar] [CrossRef]
  53. Chissom, B.S. Interpretation of the kurtosis statistic. Am. Stat. 1970, 24, 19–22. [Google Scholar]
  54. Waldock, C.; Dornelas, M.; Bates, A.E. Temperature-driven biodiversity change: Disentangling space and time. Bioscience 2018, 68, 873–884. [Google Scholar] [CrossRef]
  55. Sánchez-Azofeifa, G.A.; Castro-Esau, K. Canopy observations on the hyperspectral properties of a community of tropical dry forest lianas and their host trees. Int. J. Remote Sens. 2006, 27, 2101–2109. [Google Scholar] [CrossRef]
  56. Pau, S.; Detto, M.; Kim, Y.; Still, C.J. Tropical forest temperature thresholds for gross primary productivity. Ecosphere 2018, 9, e02311. [Google Scholar] [CrossRef] [Green Version]
  57. Mildrexler, D.J.; Zhao, M.; Running, S.W. A global comparison between station air temperatures and MODIS land surface temperatures reveals the cooling role of forests. J. Geophys. Res. Biogeosci. 2011, 116, G03025. [Google Scholar] [CrossRef]
  58. Chen, Y.-J.; Schnitzer, S.A.; Zhang, Y.-J.; Fan, Z.-X.; Goldstein, G.; Tomlinson, K.W.; Lin, H.; Zhang, J.-L.; Cao, K.-F. Physiological regulation and efficient xylem water transport regulate diurnal water and carbon balances of tropical lianas. Funct. Ecol. 2017, 31, 306–317. [Google Scholar] [CrossRef]
  59. Jarvis, P.G.; McNaughton, K.G. Stomatal control of transpiration: Scaling up from leaf to region. Adv. Ecol. Res. 1986, 15, 1–49. [Google Scholar]
  60. Grace, J. Plant response to wind. In Windbreak Technology, 1st ed.; Brandle, J.R., Hintz, D.L., Sturrock, J.W., Eds.; Elsevier Science Publishers B.V.: Amsterdam, The Netherlands, 1988; pp. 71–88. [Google Scholar]
  61. Talley, S.M.; Lawton, R.O.; Setzer, W.N. Host preferences of Rhus radicans (Anacardiaceae) in a southern deciduous hardwood forest. Ecology 1996, 77, 1271–1276. [Google Scholar] [CrossRef]
  62. Rice, K.; Brokaw, N.; Thompson, J. Liana abundance in a Puerto Rican forest. For. Ecol. Manag. 2004, 190, 33–41. [Google Scholar] [CrossRef]
  63. Allen, B.P.; Sharitz, R.R.; Goebel, P.C. Twelve years post-hurricane liana dynamics in an old-growth southeastern floodplain forest. For. Ecol. Manag. 2005, 218, 259–269. [Google Scholar] [CrossRef]
  64. Carsten, L.D.; Juola, F.A.; Male, T.D.; Cherry, S. Host associations of lianas in a south-east Queensland rain forest. J. Trop. Ecol. 2002, 18, 107–120. [Google Scholar] [CrossRef]
  65. Slot, M.; Rey-Sánchez, C.; Gerber, S.; Lichstein, J.W.; Winter, K.; Kitajima, K. Thermal acclimation of leaf respiration of tropical trees and lianas: Response to experimental canopy warming, and consequences for tropical forest carbon balance. Glob. Chang. Biol. 2014, 20, 2915–2926. [Google Scholar] [CrossRef] [PubMed]
  66. Putz, F.E.; Chai, P. Ecological studies of lianas in Lambir National Park, Sarawak, Malaysia. J. Ecol. 1987, 75, 523–531. [Google Scholar] [CrossRef]
  67. Waite, C.E.; van der Heijden, G.M.F.; Field, R.; Boyd, D.S. A view from above: Unmanned aerial vehicles (UAVs) provide a new tool for assessing liana infestation in tropical forest canopies. J. Appl. Ecol. 2019, 56, 902–912. [Google Scholar] [CrossRef]
  68. Kimball, B.A.; Bernacchi, C.J. Evapotranspiration, canopy temperature, and plant water relations. In Managed Ecosystems and CO2, 1st ed.; Nösberger, J., Long, S.P., Norby, R.J., Stitt, M., Hendrey, G.R., Blum, H., Eds.; Springer: Berlin, Germany, 2006; pp. 311–324. [Google Scholar]
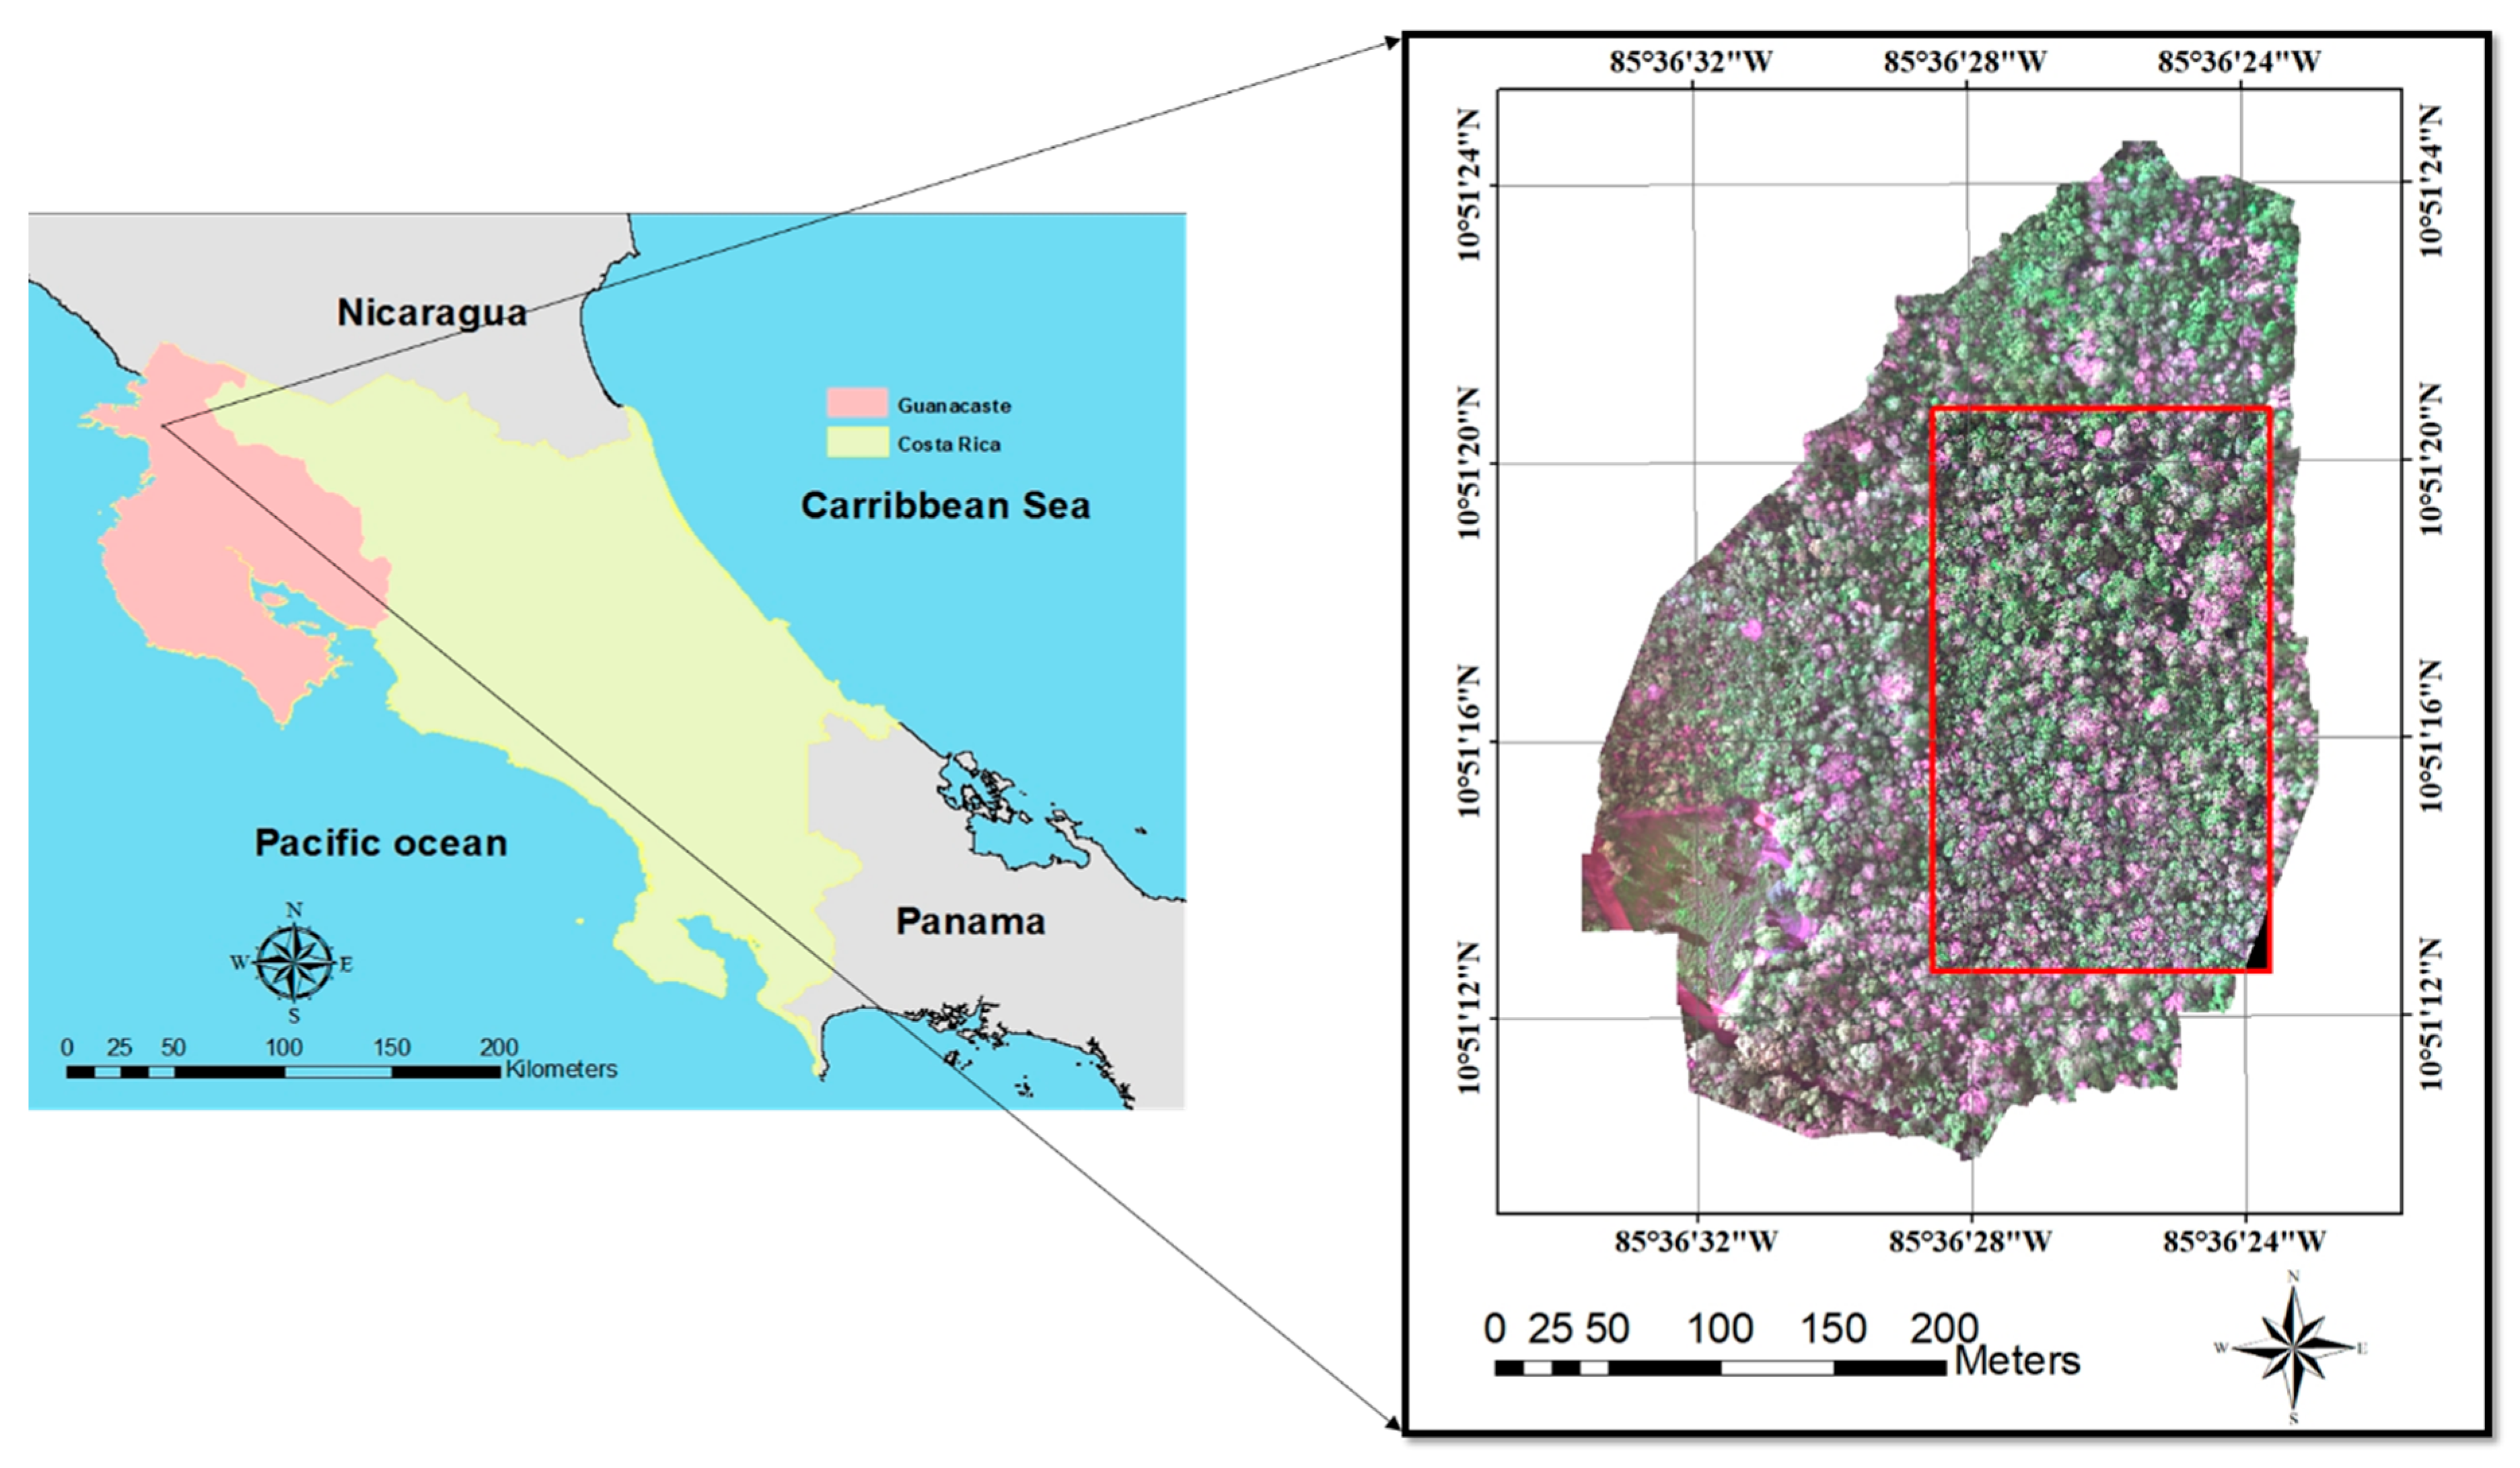
Figure 1. The study area in the province of Guanacaste, Costa Rica. The inset map shows the study area as a red rectangle overlain on a red, green, and blue (R: 668 nm, G: 560 nm, B: 475 nm) composite image acquired by an unmanned aerial vehicle (UAV) with a spatial resolution of 0.15 m.
Forests 10 00890 g001
Figure 2. Spatial distribution of the surface temperatures of the (a) liana-infested areas (b) non-liana infested areas, and (c) forest gaps in the study area. Land cover classes are after Li et al. [40].
Forests 10 00890 g002
Figure 3. The results of the spatial statistics analysis: (a) Optimized hotspot analysis, (b) spatial autocorrelation analysis after ArcGIS analysis.
Forests 10 00890 g003
Figure 4. Temperature distribution percentages shown for liana-infested areas, non-liana infested areas, and gaps.
Forests 10 00890 g004
Table 1. Statistical characteristics of the canopy temperatures of the liana-infested areas, non-liana infested areas, and gaps, Max.: Maximum, Min.: Minimum, Std. dev.: Standard deviation.
Mean (°C)Median (°C)Std. Dev.Min (°C)Max (°C)
Liana-infested areas26.6726.710.8523.9630.86
Non-liana infested areas26.2626.220.7723.7330.88
Gaps26.1026.070.8123.5230.89
Table 2. Results obtained from the Welch’s test.
Statistic aDf1Df2Sig.
Welch43.155102764.858330.000
a Asymptotically F distributed.
Table 3. Results obtained from the Games–Howell post-hoc test.
Main CategoryComparative CategoriesMean Difference (I–J)Std. ErrorSig.99% Confidence Interval
Lower BoundUpper Bound
120.412380.061650.0000.267600.55716
30.529900.059080.0000.391170.66863
21−0.412380.061650.000−0.55716−0.26760
30.117520.059650.120−0.022550.25759
31−0.529900.059080.000−0.66863−0.39117
2−0.117520.059650.120−0.257590.02255
Category 1: Liana-infested areas; Category 2: Non-liana infested areas; Category 3: Gaps.