Article

A Temporal Framework of Large Wildfire Suppression in Practice, a Qualitative Descriptive Study

1
Centre for Environmental Risk Management of Bushfires, University of Wollongong, Wollongong, NSW 2522, Australia
2
Bushfire Natural Hazards CRC, East Melbourne, Victoria 3002, Australia
*
Author to whom correspondence should be addressed.
Forests 2019, 10(10), 884; https://doi.org/10.3390/f10100884
Submission received: 8 September 2019 / Revised: 24 September 2019 / Accepted: 30 September 2019 / Published: 7 October 2019

Abstract

:
Suppression activities on large wildfires are complicated. Existing suppression literature does not take into account this complexity which leaves existing suppression models and measures of resource productivity incomplete. A qualitative descriptive analysis was performed on the suppression activities described in operational documents of 10 large wildfires in Victoria, Australia. A five-stage classification system summarises suppression in the everyday terms of wildfire management. Suppression can be heterogeneous across different sectors with different stages occurring across sectors on the same day. The stages and the underlying 20 suppression tasks identified provide a fundamental description of how suppression resources are being used on large wildfires. We estimate that at least 57% of resource use on our sample of 10 large wildfires falls outside of current suppression modelling and productivity research.

1. Introduction

Hundreds of thousands of wildfires occur annually across all populated continents [1]. One or two percent of these become large wildfires [2,3,4] and cause the majority of the damages [2,5,6]. The impacts of these wildfires will continue to escalate as the wildland–urban interface expands [7,8]. Suppression continues to be the primary method of wildfire management [9], and it is an increasingly costly enterprise [10]. Suppression costs increased from $1.3 billion to $3.1 billion inflation-adjusted dollars in the USA from the mid-1990s to the mid-2000s [11]. In Australia, the annual wildfire operations expenses for the New South Wales (NSW) Rural Fire Service ($217 million in 2016 and $268 million in 2017) [12] exceeded the combined suppression costs for NSW and Victoria during the 2003 fire season ($208 million), one of the most severe seasons on record [13]. The suppression of large wildfires accounts for the vast majority of suppression costs [2,14]. Despite these cost increases, we have a limited understanding of suppression efforts and their effectiveness on large wildfires [15,16].
The focus of the majority of suppression research is small fires or initial attack success [17,18]. The conceptual model of this body of small fire research is exemplified in suppression simulation models (SSMs) where all suppression effort is directed at the additive production of control lines until containment is achieved [19]. Recent large fire suppression research challenges the assumptions of these models. Anomalous negative production rates (negative correlation between hand-crews and control line production) indicate that they are not exclusively engaged in fireline construction, the main assumed activity in SSMs [20]. In addition, despite guidelines prioritising initial attack, nearly half (45%) of large air-tanker use in the USA is on large fire suppression in conditions that are often outside of the operational guidelines for effectiveness (e.g., dispatched during peak burning period) and influenced by proximity to the urban interface, which indicates that objectives beyond containment, such as point protection, may be a factor [21] that may not relate directly to containment [21]. Few, if any of the existing research-based fire-management tools, such as decision support systems (DSS), suppression simulation models (SSM) or operational research (OR) models relate to large fire management [19]. The shortfalls of these models and why they have not achieved operational adaptation are reviewed in Thompson et al. [22]. In large fire management, objective measures of effectiveness are limited, or non-existent [17,18]. Without such measures and without effective research-based fire-management tools, it is unsurprising that incident management team (IMT) preferences can be as important as fire and environmental factors in explaining the number and type of resources that are used, with some IMTs using an order of magnitude more resources than others on similar wildfires [23].
Finney et al. [15] asserted that large fire suppression is qualitatively different from initial attack. A recurring theme in suppression research [16,20,21,24] is that resources used in large fire suppression are engaged in activities beyond what has been established in the literature; however, the nature of these activities is yet to be established empirically. Until we identify these activities, we cannot answer the deceptively simple question: ‘How effective is large fire suppression?’ First, a more fundamental question must be answered: ‘How are suppression resources being used on large wildfires?’ To answer this question, we aimed to develop a framework of large fire suppression. We begin with a descriptive account of large fire suppression using existing Wildfire Management Agency definitions of suppression status as a five-stage scaffold. Following this, we identify key fireline suppression tasks and determine the temporal context of those tasks within the five stages. Finally, we contrast this work with the current conceptualisation of resource use to identify the shortcomings in the literature. The abrupt nature of wildfire events makes direct collection of high quality data problematic [15,20,25,26]. To address this, we undertook a qualitative document analysis similar to the evaluation of post-fire inquiries in Australia conducted by Bearman et al. [27]. As the principal source of information, we examined suppression actions detailed in operational documents that are produced by wildfire management agencies during wildfire suppression. We performed a qualitative descriptive analysis to provide a summary of events, in the everyday terms of those events [28].

2. Materials and Methods

Three interconnected approaches were used to define how suppression unfolds through time during major wildfires: daily reconstructions of the individual wildfires spread and suppression response, classification of the suppression response in progressive stages and delineation of distinct fireline tasks within those stages. An initial examination of the data led us to conclude that the smallest identifiable unit that a meaningful assessment of stage and resource activity could be made on is a sector of the wildfire over the course of a 24 h burn period. A sector is defined as “a specific area of an incident which is under the control of Sector Commander who is supervising a number of crews” [29] (p. 24). This was delineated by the morning shift change (typically 07:00) which formed a natural break in weather, fire behaviour and operations. This division of the data is similar to the segmentation of suppression in Mees and Strauss [30], one of the only large fire SSMs. The use of categorical stages to describe fire status is common within fire management agencies [30,31,32,33,34,35,36]. The number and status definitions vary across jurisdictions and even within single agencies over time; we used the broad overlap of these agency status as a starting point to form an initial scaffold of five suppression stages (Table 1). Further refinement of this scaffold was achieved by consultation with members of those agencies and the previous field experience of the lead author. The five-stage suppression framework permits us to deconstruct suppression operations, to classify suppression tasks and to identify how resources are being used on large wildfires. The aim was to refine the suppression stages and determine the suppression tasks that defined them through an iterative deductive and inductive process of qualitative coding, analysis and consultation.

2.1. Sources of Data

Over three thousand wildfires occurred between 2011 and 2015 in Victoria, Australia. Of these, 74 were over 500 hectares in size and, therefore, candidates for our study of large wildfires [37]. Forty-eight were discarded due to limited, missing or indecipherable spatial or resource data. Heterogeneous sampling, a purposive sampling technique [38], was then used to select ten wildfires from the remaining 26 to evaluate in-depth. These ten wildfires represented a range of geographic regions, fuel types, sizes and suppression complexity (Table 2).
The data for this study were sourced from the Department of Environment, Land, Water and Planning (DELWP) who provided access to:
  • eMap, a live incident mapping and resource tracking website (source of operational mapping information, fire history and a simple geographic information system (GIS) viewer used to corroborate information).
  • FireWeb, a live incident-reporting website which is their primary source of integrated fire management information (source of Situation Reports (SitReps), Incident Shift Plans (also known as Incident Action Plans or IAPs), archived eMap data, linescans, operational maps and photographs).
  • GIS and mapping data from internal DELWP databases (source of real-time aircraft tracking system (RATS) data, operational maps, mapping information and GIS spatial base layers for the State of Victoria).
We also sourced weather station data from the Australian Bureau of Meteorology (relative humidity, temperature, wind direction and wind speed) to describe the daily fire weather conditions.

2.2. Reconstructions

Daily wildfire reconstructions were used to contextualise the suppression efforts and provide an understanding of the suppression achievements and wildfire response of a given burn period. The reconstructions covered a total of 156 days across all fires, and they were based on linescans, GIS records, operational maps, RATS, weather conditions and 674 SitReps and IAPs that included information on the planned suppression efforts, strategies, current fire situation and other relevant activities. IMT members from two of the wildfires were consulted to verify the accuracy of the fire reconstructions. Summary reconstructions of the 10 wildfires are in Appendix A.

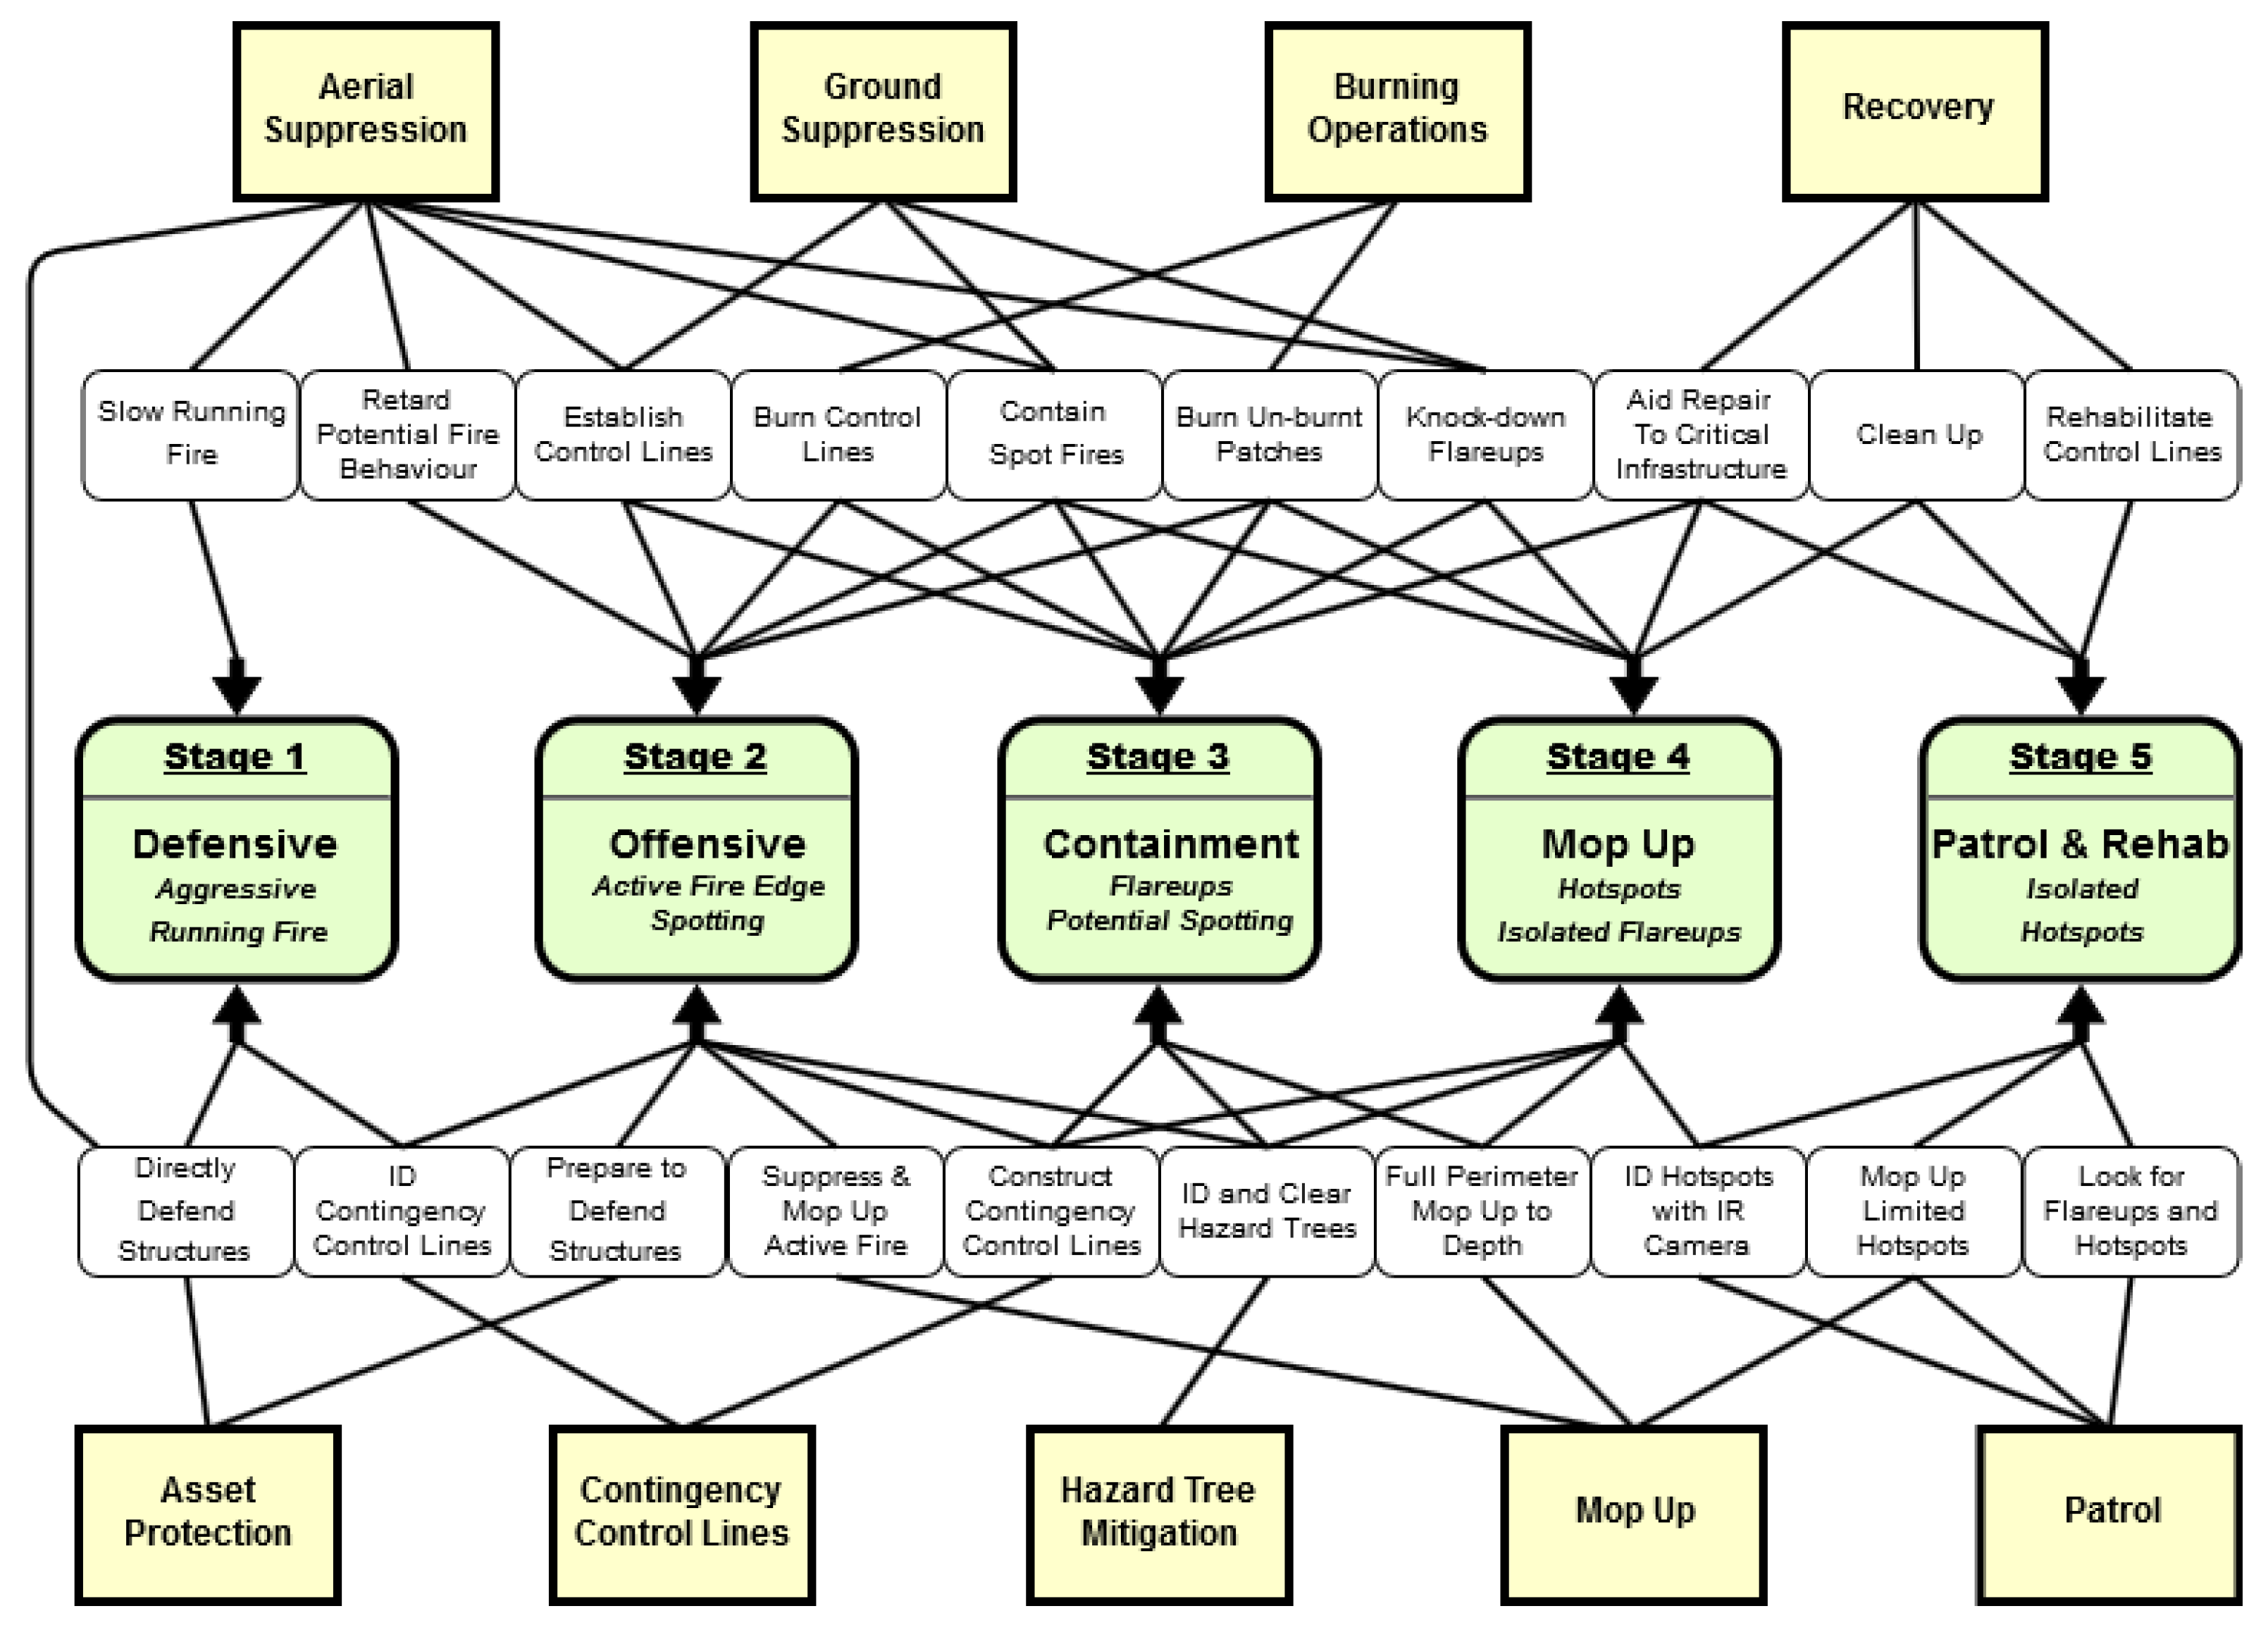
2.3. Classification of Stages

For the suppression stages, a directed content analysis was applied whereby a ‘scaffold’ [38] of five stages was used as initial coding categories to code the data [39]. Initially, the lead author (experienced wildland firefighter) and one other researcher independently coded the suppression stages based on a holistic view [40] of what happened during each 24 h burn period at a sector level. Substantial agreement was achieved for two wildfires that the coders overlapped on. Further refinements to the suppression stages were made by again consulting with industry experts and by the two coders jointly analysing and recoding a common wildfire. Finally, all 10 wildfires were revisited to ensure consistency, and the comments from the SitReps and IAPs were coded into the suppression stages as nodes using NVivo11 software.

2.4. Classification of Tasks

Content analysis [41] employing NVivo11 software was used to code and analyse the comments from the SitReps and IAPs for discrete suppression tasks. Process codes [40] were developed from broad categories of suppression activities that are readily identifiable from the suppression literature or are in common usage in fire management agencies. Then, these broad activity nodes were ‘charted’ [42] into a matrix with the suppression stage nodes. Each cross-referenced set of text was re-examined in order to subclassify the broader activities into distinct suppression tasks that partner with the suppression stages.

3. Results

3.1. Suppression Overview

Figure 1 is a conceptual map of suppression resulting from our analysis of the charted stages and activities. Our iterative qualitative analysis of ten large wildfires revealed the considerable complexity of suppression effort. Overall, we identified and delineated 20 distinct suppression tasks (white boxes, Figure 1). Detailed descriptions of each task are given in Appendix B. While the five stages are explained in detail in the next section, key aspects that delineate the stages are:
  • Defensive Suppression—The fire behaviour is beyond the control capacity of the suppression resources.
  • Offensive Suppression—The suppression resources are making ‘gains’ on the fire. Plans are emerging and being executed.
  • Containment Achieved—In a post-hoc analysis, this is the clearest stage to delineate. A control line has been established along the entirety of the sector or division, and subsequent mop-up activities are expected to hold the fire at this perimeter.
  • Mop-Up—While mop-up activities occur to some degree in stages 2–5, complete mop-up of some depth (typically a 30 m perimeter) is the focus of this stage.
  • Patrol and Rehabilitation—The fire is still smouldering in the interior or in isolated hotspots on the perimeter. Perimeter mop-up is almost complete, and resources can be freed up for rehabilitation or demobilisation. The boundary between stages 4 and 5 is the fuzziest.
Normally, an ordinal progression through the stages occurs unless there is an ‘escape’ or rekindling at which point a sector or even the whole fire can revert back to an earlier stage. The defensive stage did not occur on all wildfires, and different stages can and often do occur concurrently on different sectors of a wildfire.

3.2. Characteristics of Stages and Activities

3.2.1. Stage 1—Defensive Suppression

The key characteristic of the defensive suppression stage was that the current or expected fire behaviour exceeds the suppression control capacity [43]. Classification of this stage was made when there was a combination of sustained dangerous fire behaviour over the majority of burn period and largely unsuccessful or unattempted containment efforts (Table 3). Dangerous fire behaviour was defined by reports of escalating fire activity and intensity, an organised head or fire front, and uncontrollable spotting. The focus of the suppression effort in wildland urban interface areas was asset protection, whereas firefighter safety was prioritised on remote wildfires and ground resources were not dispatched until the fire behaviour was moderated. For ground resources, asset protection was prioritised over containment efforts, and aerial resources were directed to either assist with asset protection or slow the running fire (Table 3).
An example of limited duration defensive suppression occurred on the Corryong wildfire with reports of “[i]ncreased fire activity this afternoon, spotting 100 m uphill—not confident of holding the fire within containment lines this afternoon (increased winds). Ground crews and contractors have now been withdrawn to a safer location [47]”. However, a few hours later, the crews had re-engaged, and it was reported that the “[f]ire activity from the afternoon of 21 January has settled down and fire remains within containment lines” [48]. The defensive response in this situation did not merit inclusion into the defensive stage as the dangerous fire behaviour was limited in duration, the crews re-engaged after a brief disruption and the fire remained within the intended containment area. Defensive suppression occurred on eight of the ten wildfires (Powelltown and Stonyford did not manifest this stage). Defensive suppression was a prominent part of the three wildland urban interface wildfires (Grampians, Mickleham and Morwell) that had prolonged periods of dangerous fire behaviour, asset protection efforts and substantial asset damage. One wildfire (Lake Rowan) had limited information about the initial burn period, and defensive suppression was inferred from reports of rapid fire growth and asset protection. The initial burn periods of two remote wildfires (Corryong and Timbarra) were classified as defensive because ground resources were not dispatched due to the expected fire behaviour conditions. The defensive suppression classification for two wildfires (Kentbruck and Hallston) was the result of unsuccessful suppression efforts that necessitated further asset protection.

3.2.2. Stage 2—Offensive Suppression

Stage two was characterised by deliberate containment efforts as opposed to the reactionary response of stage one. Suppression resources successfully suppress active fire, contain spot fires and retard fire behaviour that had the potential to exceed the control capacity. Resources were used to establish control and contingency lines, conduct burning operations, identify and clear hazard trees, mop up and prepare assets for potential future impact (Table 4). Damage assessments and recovery operations initiated on three wildfires (Mickleham, Morwell, and Grampians) by non-fireline personnel have not been included in the tasks of this stage. Fire behaviour was heterogeneous and ranged from limited, characterised by intermittent hotspots along an inactive edge, to aggressive, where a running fire edge with spotting and control line breaches may occur. Excerpts from a single wildfire (Timbarra) exemplify this range (Table 4).

3.2.3. Stage 3—Containment Achieved

The key characteristic of the containment stage was fully established control lines along the wildfire perimeter for the full length of the sector or division. Unless there was a later breach, this was the final wildfire perimeter. The assignment of this stage centred on either explicit references of progress and completion (Table 5) or inference when there was no further resource tasking that related to the establishment of control lines. Progress updates were interpreted in the context of previous and subsequent updates as the reports for the fire as a whole fire rarely coincided exactly with completion in a given sector. For the six wildfires with significant burning operations (Corryong, Grampians, Kentbruck, Powelltown, Stonyford and Timbarra), containment was achieved once the perimeter adjacent to the control line was burnt in. A distinction was made between perimeter burning operations, where ground crews were used to establish a perimeter burn along the control line, and interior burning operations that used aerial ignition techniques. A variety of suppression tasks continued during the containment stage, including establishing contingency control lines, hazard tree abatement, mop-up and patrol. If critical recovery efforts were required, fireline personnel were used to facilitate access to infrastructure for non-fireline personnel. Fire behaviour in stage three was most commonly reported as ‘quiet’, although there were also escalations that included ‘minor flare-ups’ inside the control lines and isolated spotfires; these escalations were managed by ground and aerial suppression resources.
Control lines did not guarantee containment. Spotting occurred on all ten wildfires after control lines were established, and half had sizable control lines breaches. Control lines on one wildfire (Kentbruck) were breached by the burning operations that had been used to establish the perimeter. Two wildfires (Hallston and Morwell) had breaches occur during the burn period that followed the initial control line establishment, whereas the breaches on two other wildfires (Powelltown and Timbarra) occurred several days after.

3.2.4. Stage 4—Mop-Up

In stage four, there was no longer a need to establish perimeter control lines, and the absence of this task defined the beginning of this stage. Throughout the stage, the central focus was full perimeter mop-up to a depth of 30 m, or greater if extreme conditions were forecast (Table 6). Burning operations in stage four were limited to burning out interior patches. The largest area burnt by these interior burning operations was ~3000 hectares (Kentbruck), followed by two ~1000 hectare burns (Grampians). Hazard tree abatement efforts were completed. The ongoing construction of contingency lines that occurred in this stage may reflect a risk mitigation strategy due to the prevalence of spotting and control line breaches on all ten wildfires, emphasising that completed control lines did not guarantee containment. Recovery efforts escalated from facilitating access, as in stage three, to fireline resources engaged in clean-up efforts. The end of stage four was defined by three tasks: Perimeter hotspot numbers were reduced to the point that thermal imaging, such as forward-looking infrared (FLIR) cameras being used to identify individual hotspots; wildfire rehabilitation requirements were assessed and had begun to be implemented; and there was a shift back towards the use of local crews alone.

3.2.5. Stage 5—Patrol and Rehabilitation

Mop-up in the patrol and rehabilitation stage was limited to isolated hotspots that were missed in stage four (Table 7). The isolated hotspots were identified by thermal imaging, either a handheld thermal imaging camera (TIC) or helicopter-mounted FLIR, and maps or coordinates of the hotspots were provided to crews that were tasked to patrol the fire perimeter. Incident management transitioned from IMTs to local suppression crews and the SitReps and IAP information during this stage was succinct; the control strategy was often recorded as ‘patrol and mop-up where required’ or even just ‘patrol’. Other than patrol and mop-up, a key identifier in this stage was the primacy of the recovery and rehabilitation efforts. Fire behaviour in the patrol and rehabilitation stage was usually limited to the isolated hotspots. In addition, there was the occasional specific location or area of concern identified that required additional suppression efforts. On occasions when conditions worsened considerably, active fire behaviour occurred in unburnt areas within the control lines, but this fire activity did not present challenges to control (Table 7).

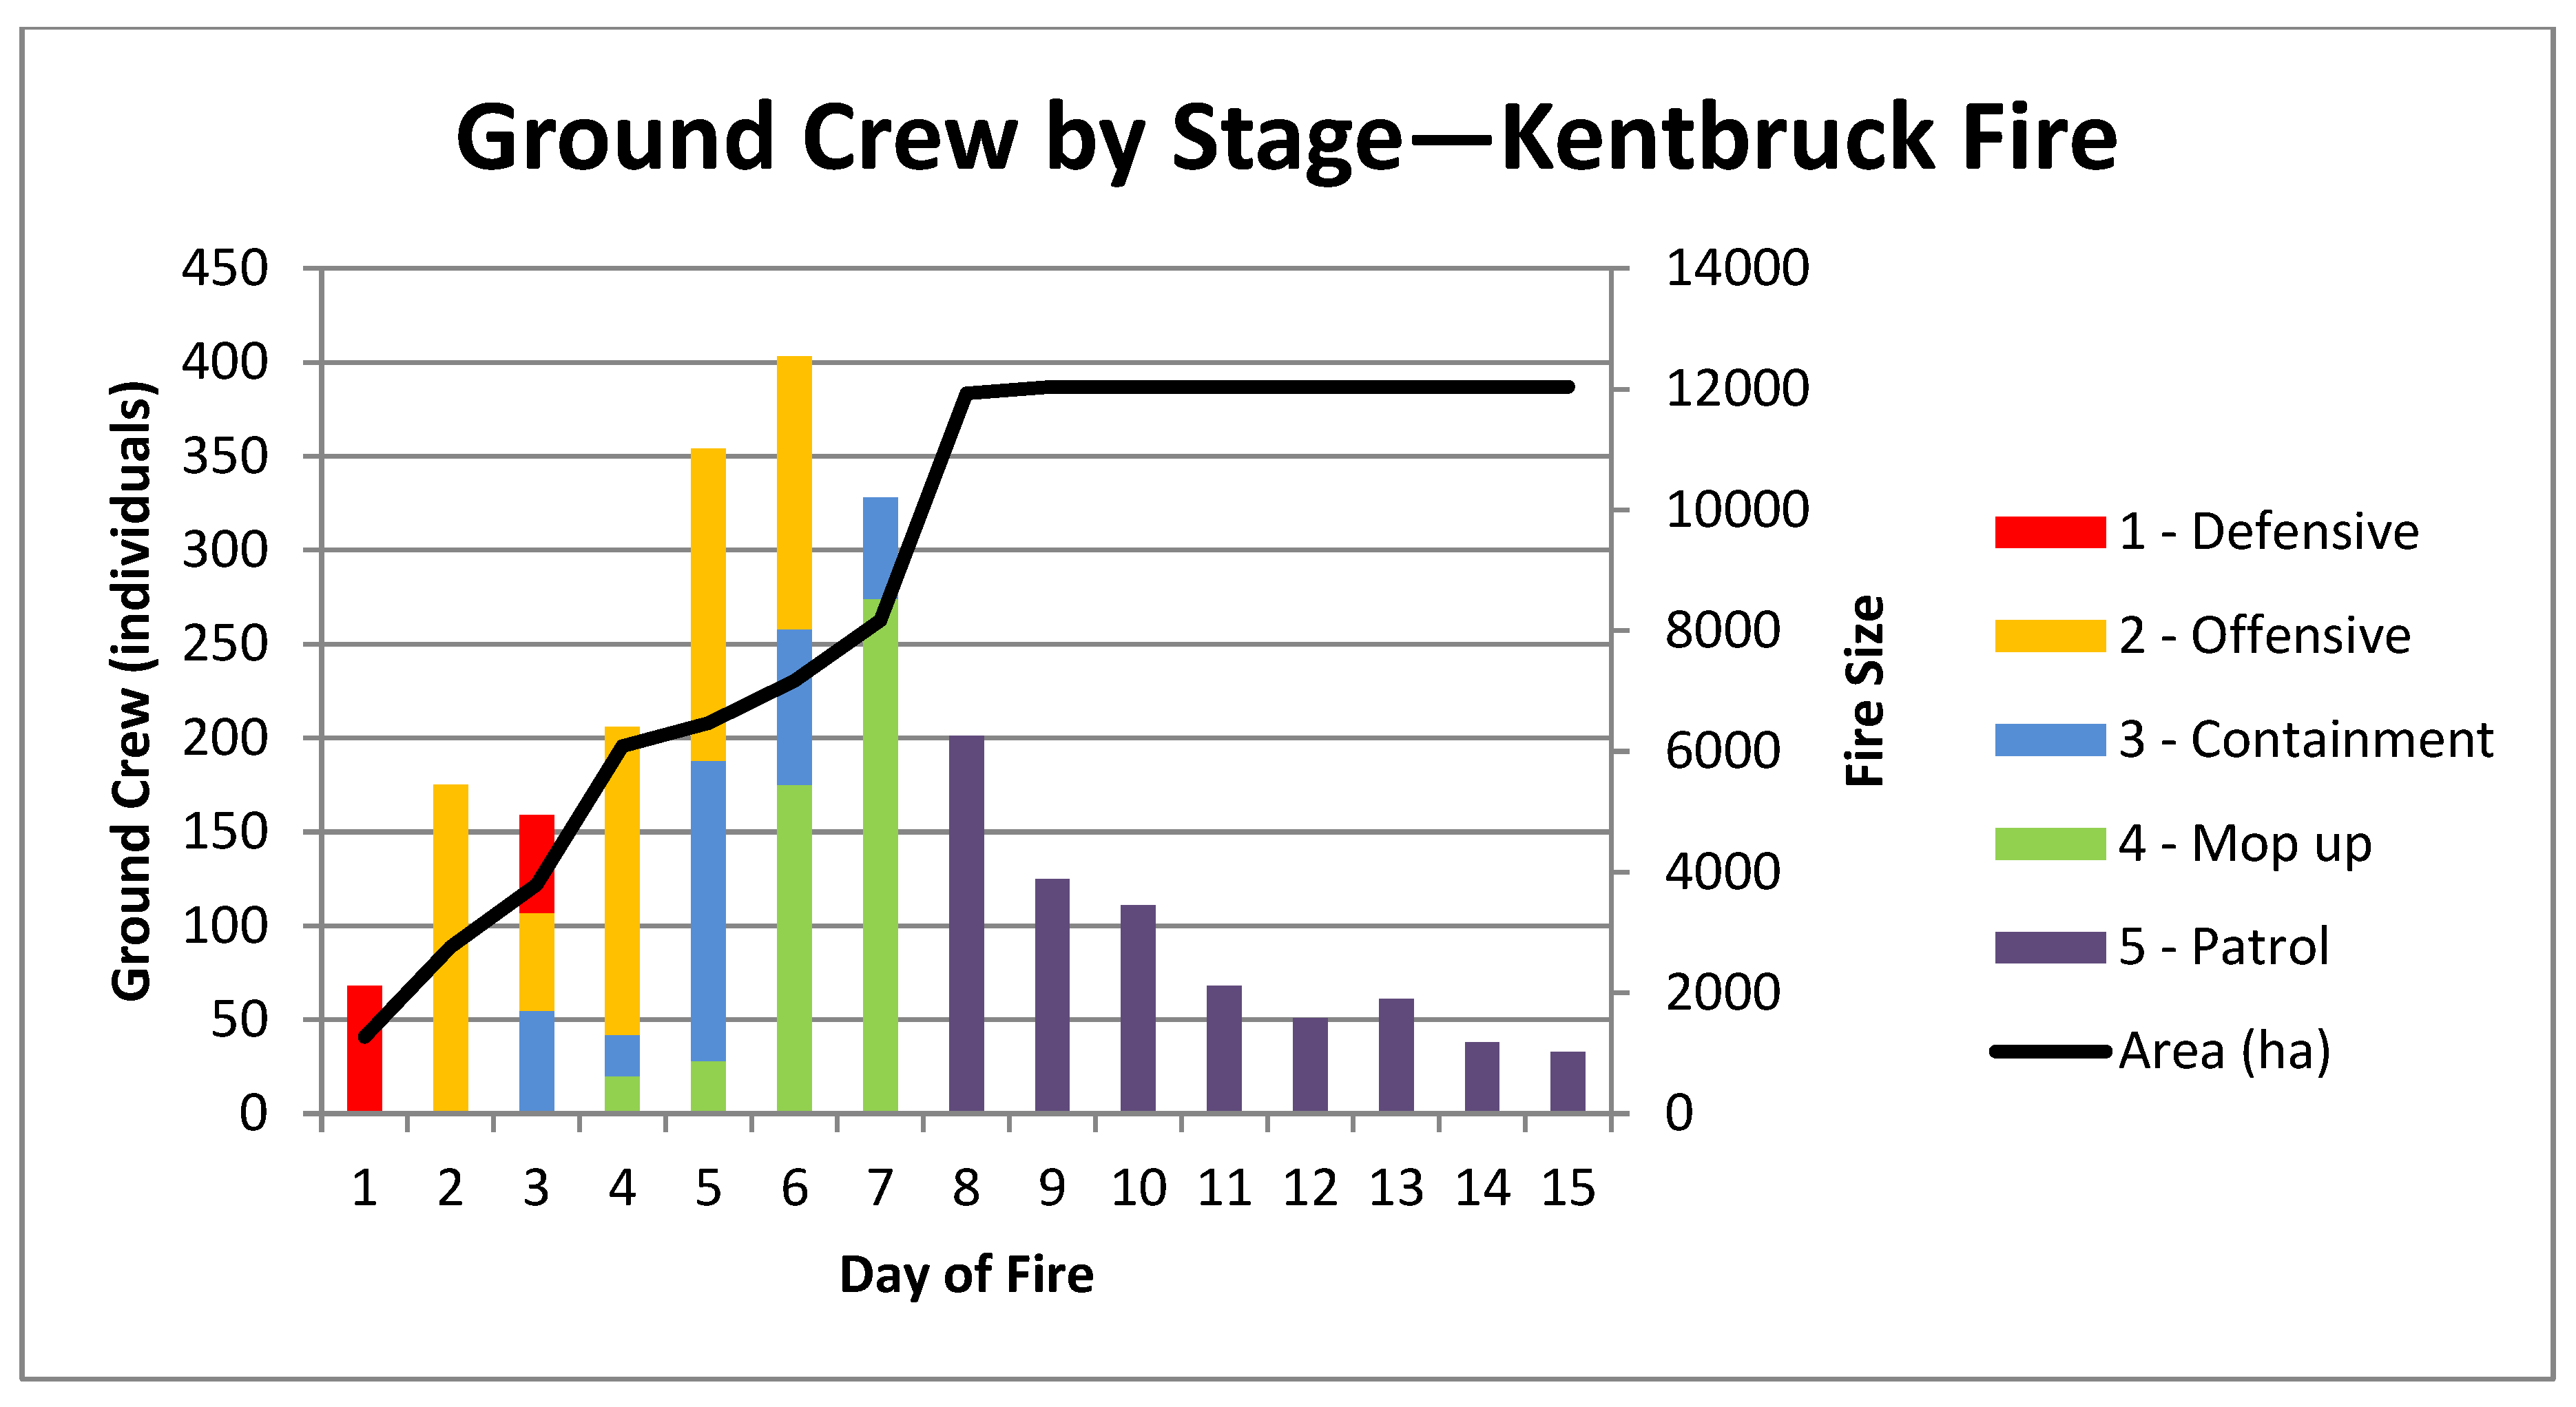
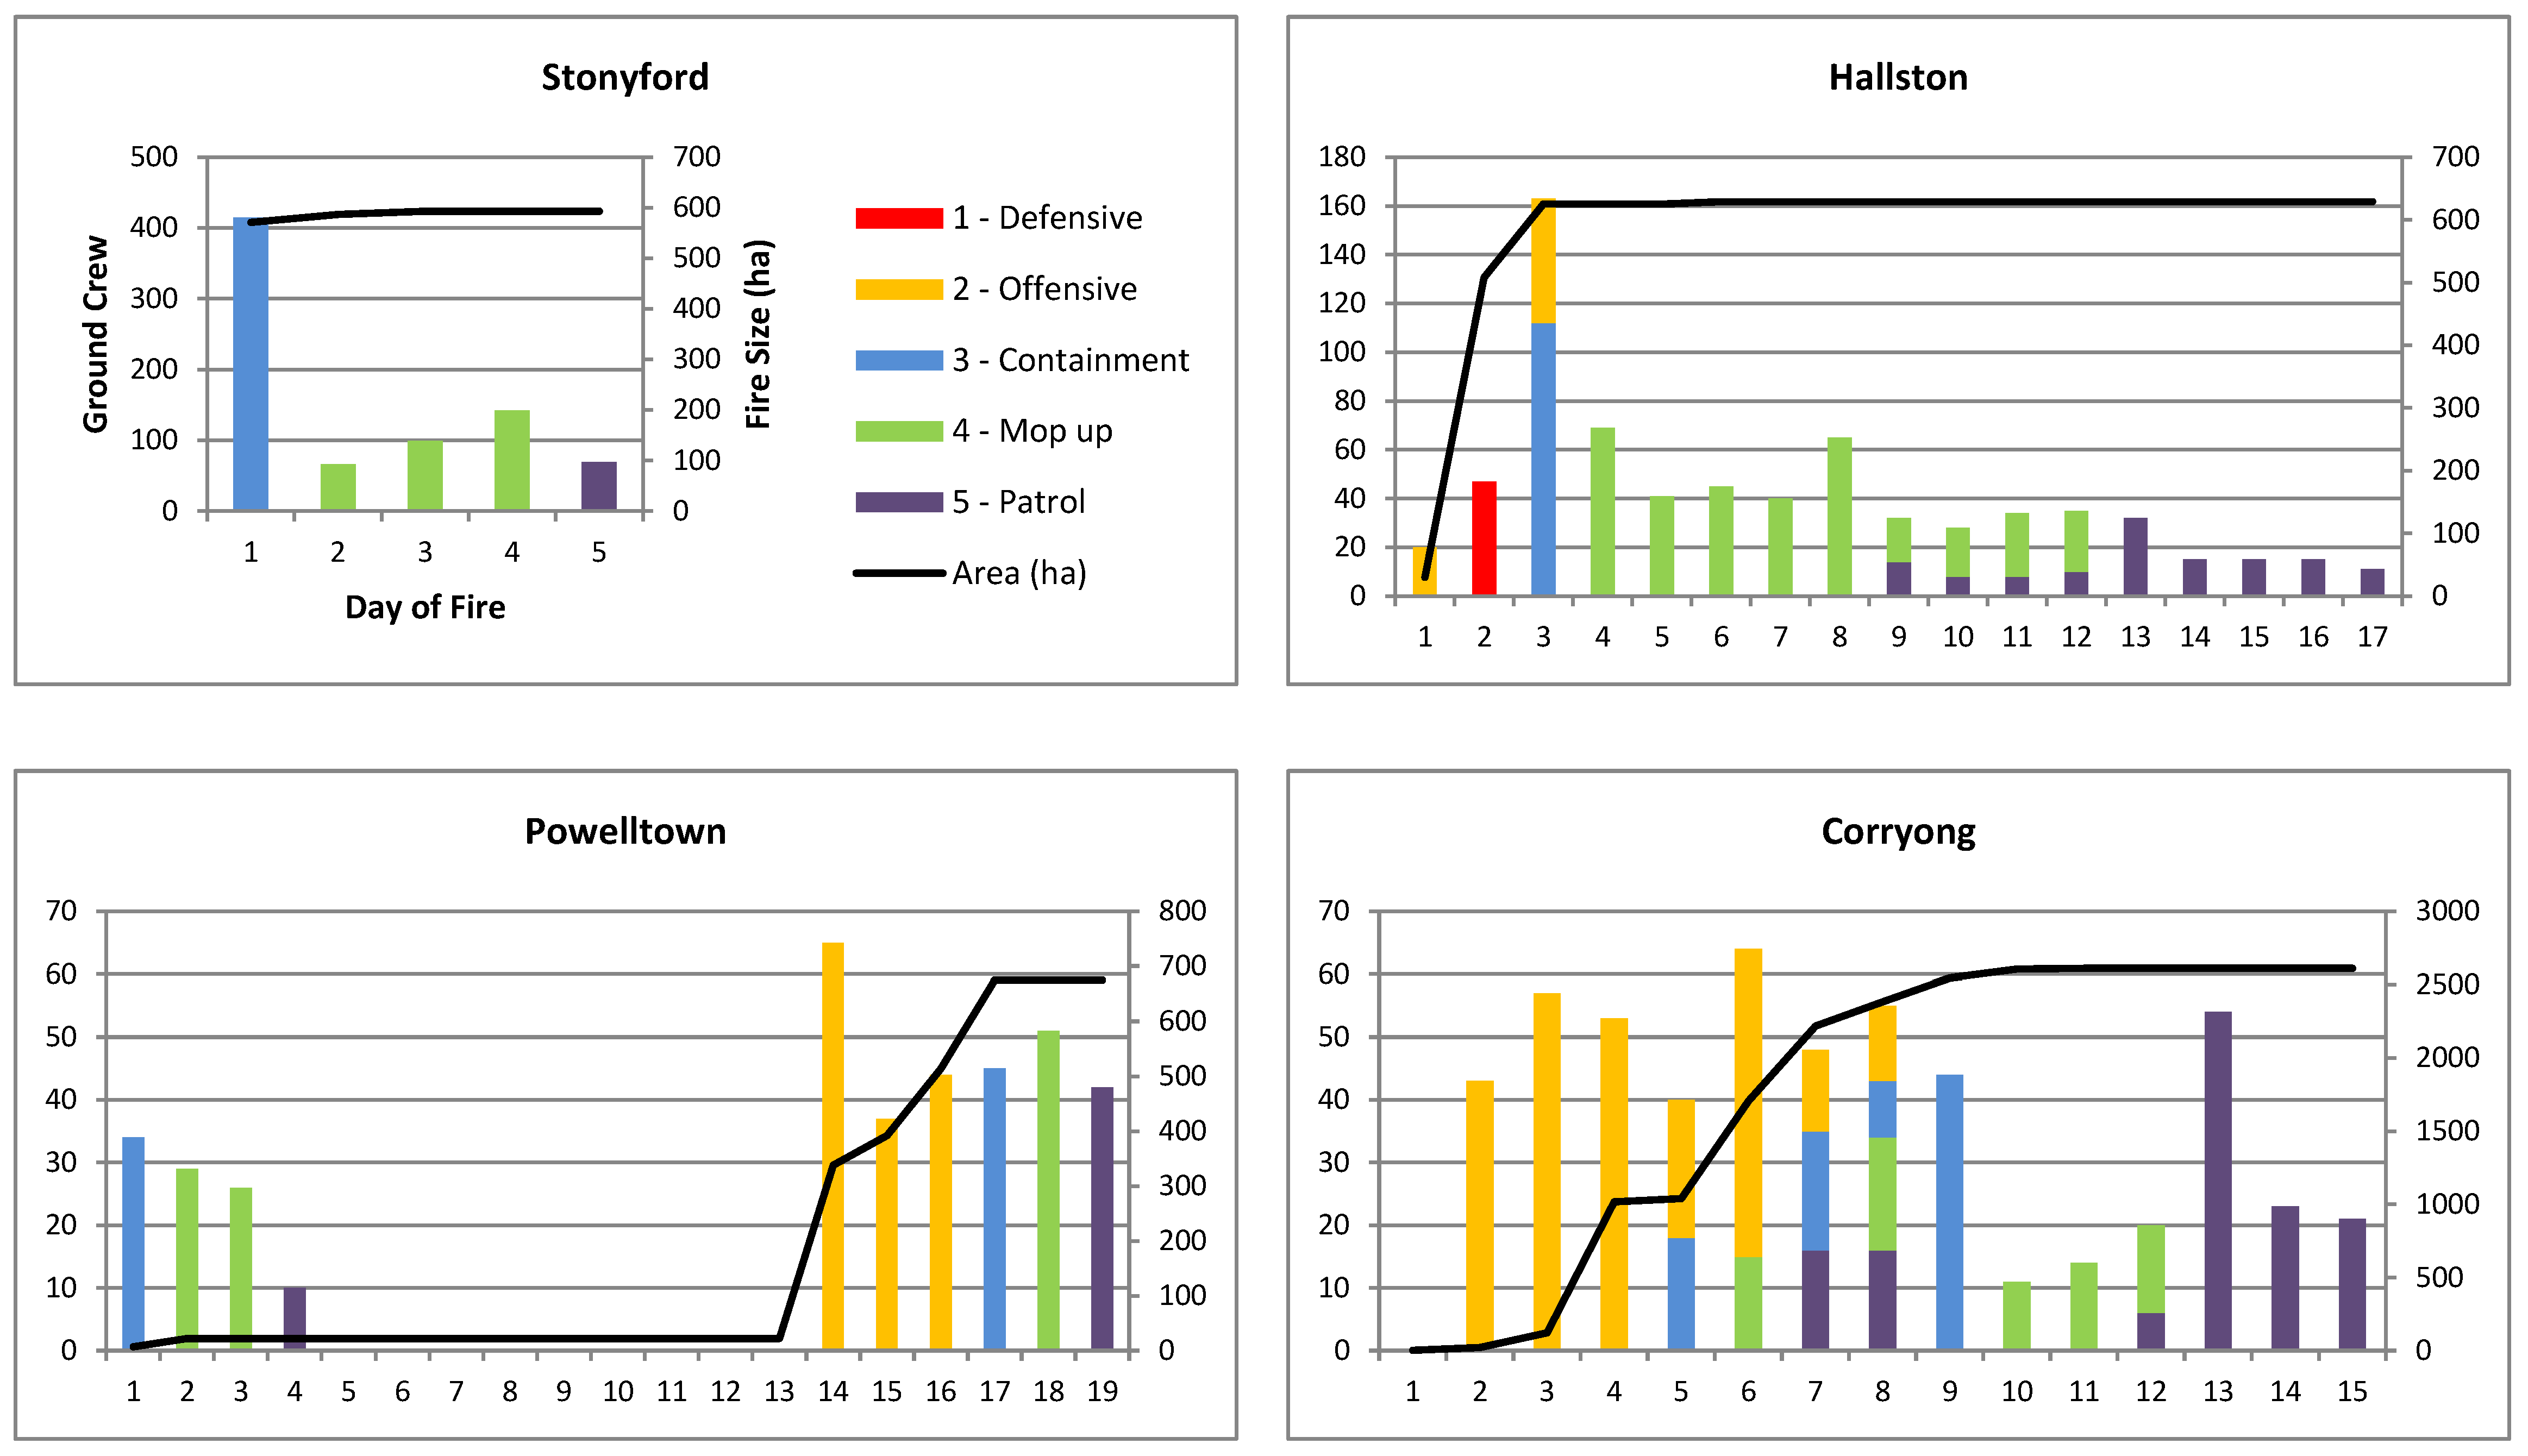
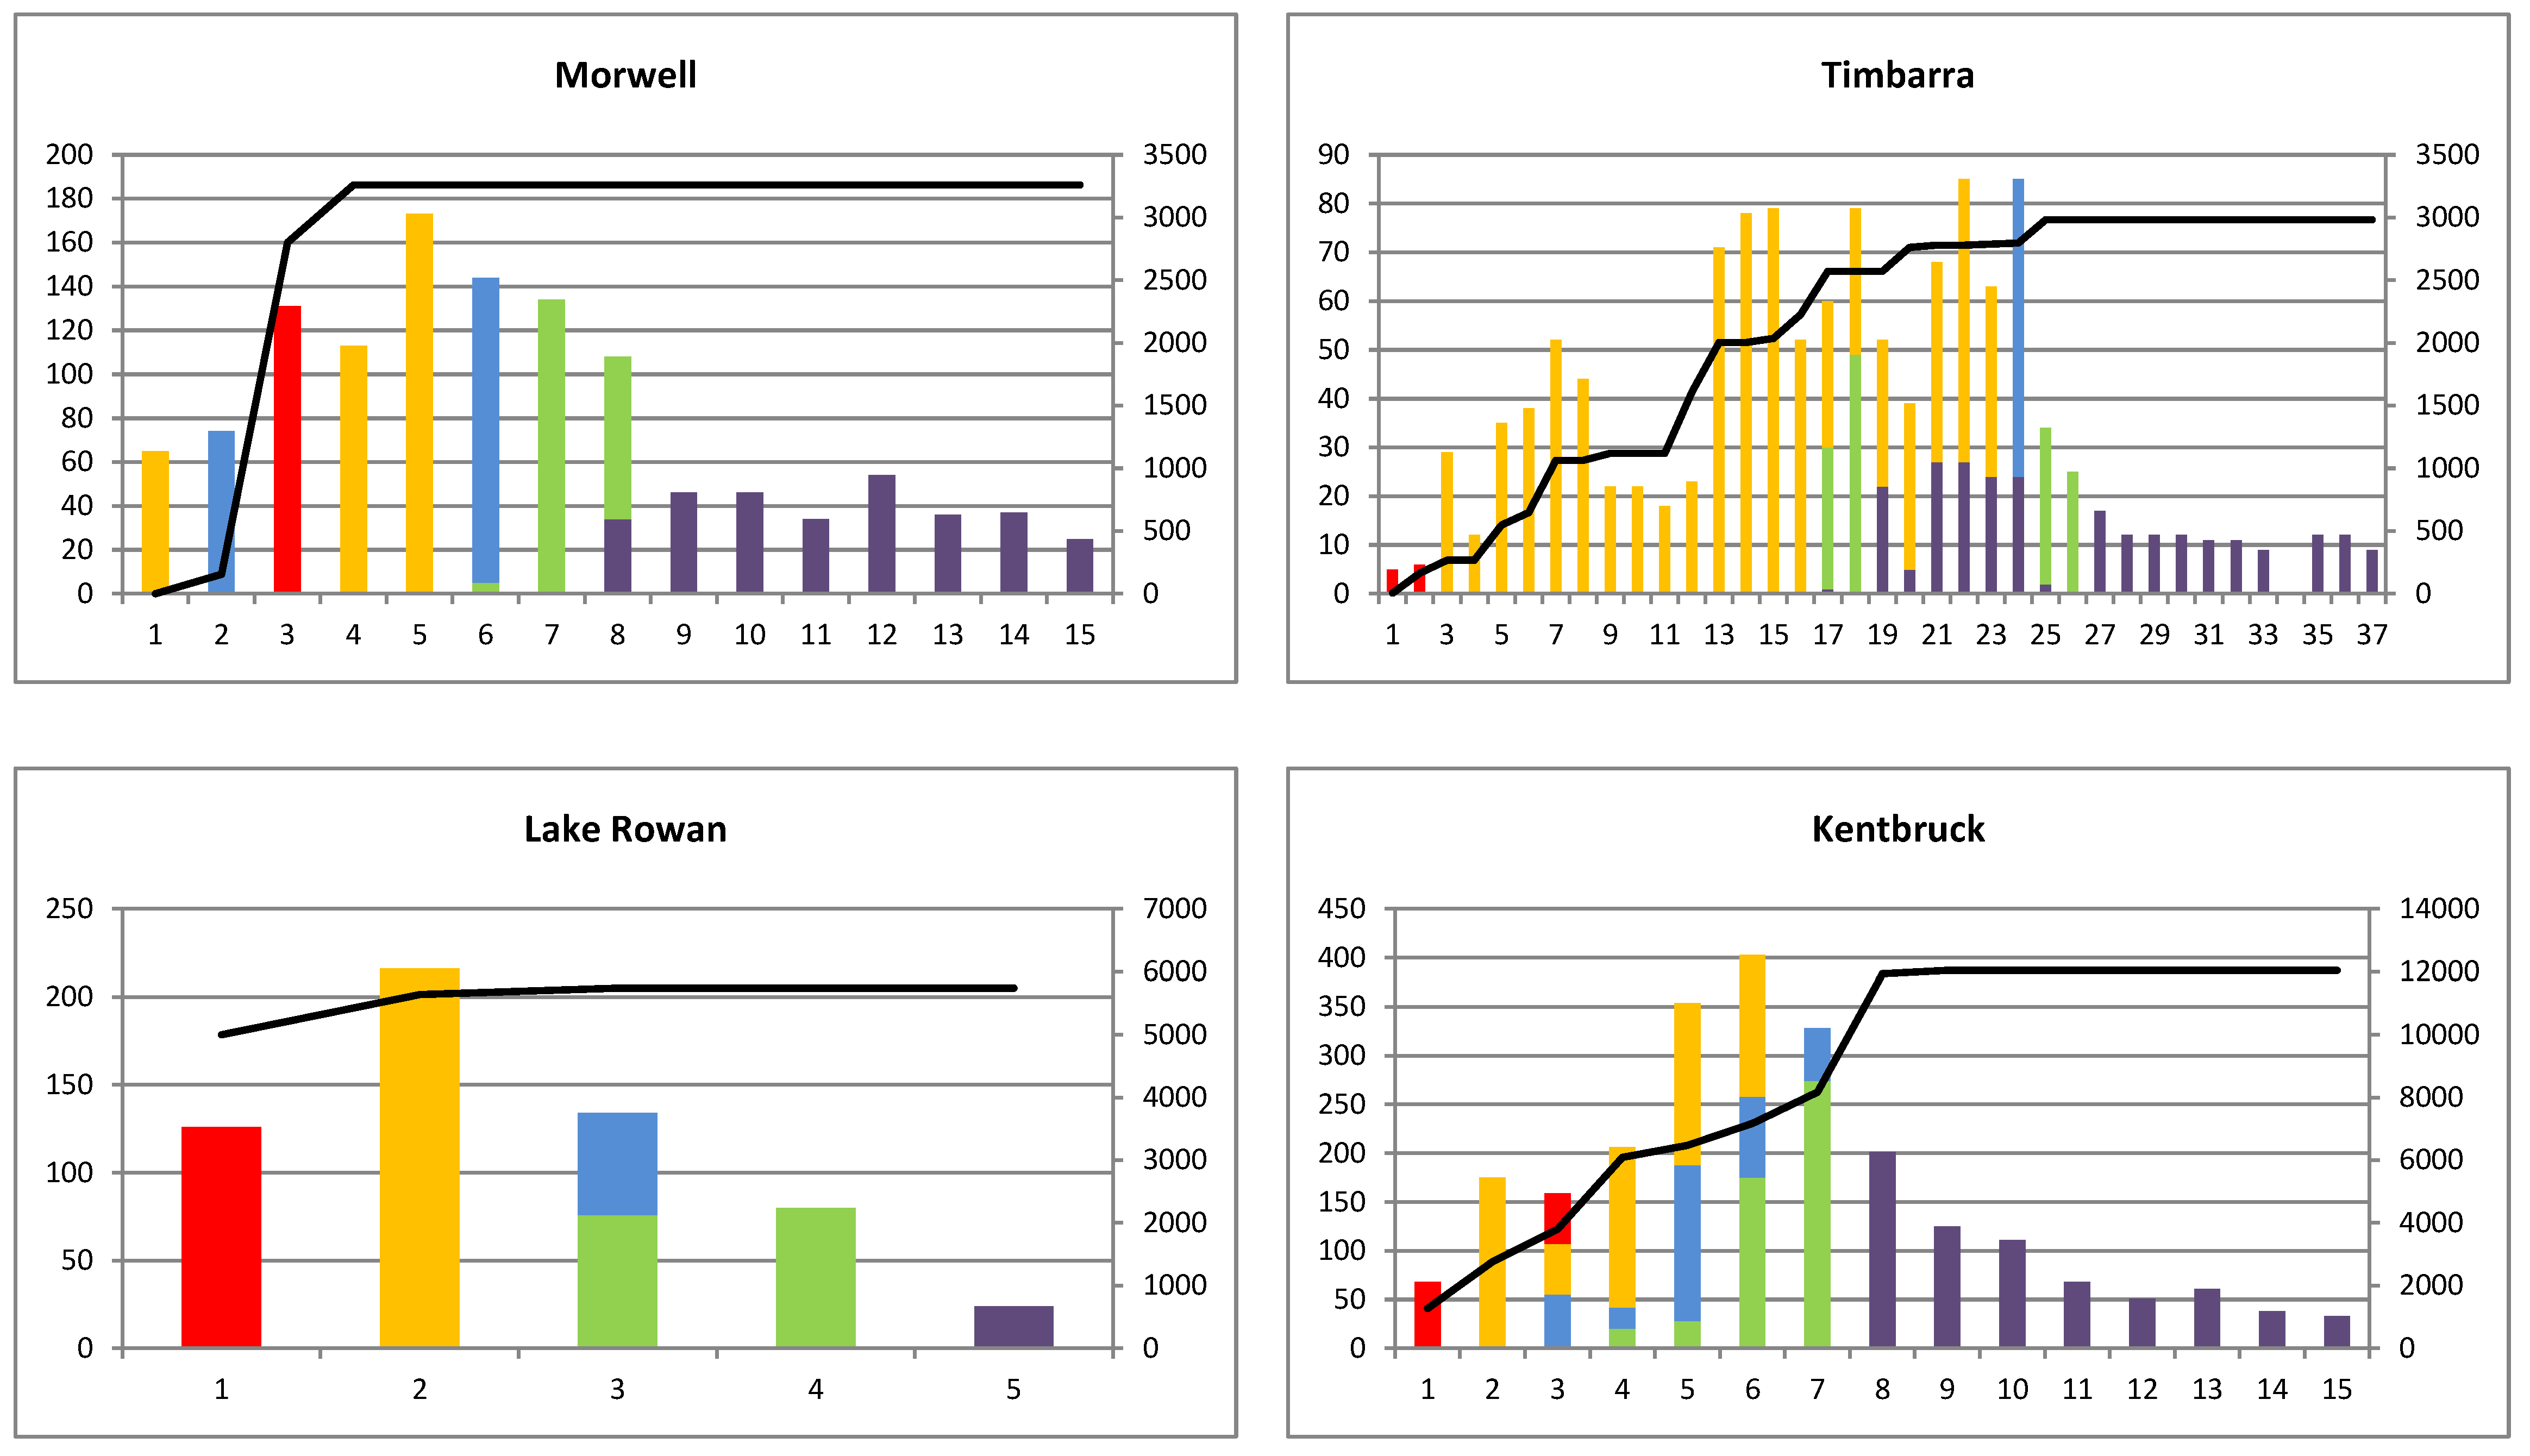
3.3. Resource Use by Sector and Stage

The sector level assessment by stage yields a drastically different picture of resource use than what is assumed by the current conceptual model of suppression, illustrated by SSMs. This model of suppression and the related productivity research assumes that the focus of resource use is establishing control/contingency lines, which relates to only two (establish control lines, construct contingency control lines) of the 12 tasks we identified in stage 2 and 3. Currently, there are no measures of resource requirements or estimates of productivity for the other 10 tasks in these two stages, nor for any tasks in stages 1, 4 and 5. We quantified this shortfall with the daily sector level assessment of stages, which we illustrate with a graph using the number of daily ground crews as a proxy for resource use on a single wildfire (Figure 2; graphs of all ten wildfires are in Appendix C). Other than command staff, equipment operators and pilots, the ground crew figure includes all fireline personnel. Only 45% of resource use falls within stages 2 and 3 (43% for all 10 wildfires). The magnitude of this shortfall is masked by DELWPs-reported whole-fire containment status, which boosts ‘containment’ resource use to 71%, which is the percentage of resources used until the wildfire was ‘contained’—according to DELWP, equivalent to stage 3—at the end of the 7th day of the fire [63]. The current dataset does not permit the attribution of resource use at the individual task level; however, with the sector level stage assessment, we estimated that at least 57% of resource use on our sample of 10 large wildfires falls outside of current suppression modelling and productivity research. Sectors of large wildfires commonly differ on the stage of suppression attained on any given day, which provides empirical support to the overlapping phases of suppression described in Figure 1 of Plucinski [17]. The sector-based assessment of fire status along with an explicit knowledge of stage-based suppression tasks gives a comprehensive insight into the complexity of large fire suppression. Such an understanding should be the starting point for resource planning, productivity estimates, and fire suppression modelling.

4. Discussion

Through this work, we have established that suppression can be thought of as a multistage process involving a variety of activities and tasks, which contrasts the existing suppression literature and SSMs that represent suppression as a continuous process of establishing a control line around a growing fire. Reframing suppression and expanding the list of critical tasks is a first step towards determining the effectiveness of suppression on large wildfires. In doing this, we have elucidated the complexity of stages and tasks that constitute large fire suppression (Figure 1).
Many fire management agencies use a variation of these suppression stages to classify wildfires, which begs the question, why develop new stage definitions? The different agency classifications are generally understood within each agency through practice and experience, but this implicit, tacit understanding does not extend to other forums, such as research and modelling. The five stages are explicit categories that focus on resource use and suppression impact and are readily understandable to a wider audience. Each stage evokes a set of associated fire behaviour, suppression activities and tasks that assist in identifying the potential resources needs. Like the fuels, topography and weather [15] of large wildfires, suppression is also heterogeneous. The stages are more useful as a tool when we examine suppression at a sector level, rather than the whole fire. This shift away from a blanket status for a whole fire, which is the convention of fire management agencies, allows for greater refinement of the resource needs and illustrates the gaps between the suppression literature and SSMs and fireline operations. The sector level evaluation is less ambiguous and can be used to redefine the risk of rekindling to a more precise geographic location which could combat the overly conservative assessment of the suppression status that was found by Katuwal et al. [16].
Wildfires are rapidly evolving events, and the operational data generated during these events were not recorded for the purpose of research; therefore, some level of inaccuracy is to be expected. Judgement, repeated examination and cross-referencing of information was required to piece together a chain of events for each wildfire and resolve discrepancies, examples of inaccuracies included:
  • Erroneously repeated information—the entire content of a previous SitRep was often copied to form a draft of a new SitRep, at which point one or more key pieces of information was edited and updated. This resulted in verbatim information persisting in subsequent documents that may no longer be relevant or even be contradicted by the updated information.
  • Delayed recording—updates in the SitReps were not always a full update of the whole fire. There was often a lag in record keeping, for example, a linescan with an accurate size and location of the fire may occur in the morning, but the size may not have been updated in the records until much later in the day.
  • Planned vs. actual events—records include the plans for a day or a shift that may not have actually occurred. An indication of the completion status of planned works or whether plans were abandoned was not always provided.
  • The records were rife with spelling errors, name changes, local geographic references, abbreviations, shifting geographic boundaries and jargon.
  • Resource numbers and locations were not always recorded accurately—tabulated numbers may be contradicted by written descriptions, and appliances (trucks, etc.) may be listed without the crew numbers to staff them or resource numbers carried forward on records when resources were no longer present.
  • Multiple wildfires may have been managed by the same IMT and records for one fire may include information for multiple events.
The reconstructions were a lengthy and time-consuming process due to the data issues mentioned above. The ten wildfires considered were all in Victoria, Australia. The applicability of these findings for other areas is unknown and requires further study as the configuration of ground resources varies across countries (e.g., USA hotshot hand crews, prevalent use of portable pumps and hoses in flat boreal forests of Canada, and tanker-based suppression in Australia). Given the consultation with both in- and out-of-state experts, international deployment of wildland firefighters and resources and the international wildfire experience of the lead author, it is reasonable to assume that similar activities occur on large wildfires elsewhere.
A caveat to this work is that it generates discrete ridged definitions (the stages and tasks) from a fluid process (suppression). Firefighting and operational data do not always fit with discrete sampling, and there were some instances when tasks fell outside of the designated stages. Some examples are a short period of defensive suppression on the Corryong wildfire that was not representative of the whole 24 h burn period, or that the final sections of the control lines on the Hallston wildfire were completed during the Patrol stage, as the fire-ground received a large amount of rain and control line construction had to be revisited after the ground dried out enough to permit access. Quantification of the frequency of the tasks or their relative importance was not possible. In post-hoc operational data, the absence of a task does not indicate that it did not occur; the only conclusion that can be made is that it was not recorded. In addition, the number of documents per wildfire is nonstandard, and there is erroneously repeated information, so conclusions based on frequency would be problematic. We hope that our analysis will ultimately lead to better and more systematic record keeping that may produce the kind of data that would allow such an analysis. Until there is better record keeping, it would be prudent to not to make conclusions based on frequency. Finally, there was limited descriptive information about the suppression operations when suppression progressed to the Mop-Up and Patrol and Rehabilitation stages and the transition from the end of the Mop-Up stage to the start of the Patrol stage was a matter of degree.
There are a number of implications to this work. Production rates for suppression resources that have been developed by field observations [79] or post-hoc whole fire economic analysis [16,20,26] feed into the SSMs. The majority of the activities and tasks that we identify in Figure 1 lack both production rates and incorporation in SSMs. However, SSMs are being used to determine the adequacy resources on individual fires and for agencies as a whole [80,81]. There are three problems with this:
  • Extending production rates derived from field observations [79] of one of the 20 tasks that we identified as a proxy for resource needs would lead to chronic under-resourcing because resources are required to carry out a much broader range of tasks. This is supported by the findings of Haven et al. [82] that observed production rates are overly optimistic.
  • Using production rates from post-hoc whole fire assessments [16,20,26] may lead to over-resourcing because the production rates include the completion of unaccounted tasks, (e.g., Katuwal et al. [20], where ground crews had an anomalous negative result).
  • Resourcing for a fraction of the required tasks may result in the wrong bundle (type and amount) of resources because we do not understand how the resources are being used.
Of all the activities and tasks that we identified, the size and scope of the burning operations have the greatest significance for future suppression research. Recent technical literature on burning operations is limited to a small number of numerical simulations of suppression burning [83,84,85]. The experimental work of Wilson [86], which derived an equation for the width of a firebreak required to stop a grassfire, noted that in practice, burning operations would be important, but they were not included in Wilson’s experiment. Burning operations occurred on six of the ten wildfires (Corryong, Grampians, Kentbruck, Powelltown, Stonyford and Timbarra), and some were of substantial size; the largest was an estimated 3000 hectares on the Kentbruck wildfire, followed by two areas of approximately 1000 hectares on one sector of the Grampians wildfire. These burning operations generally made use of the existing road network and without examining this suppression task one might assume that it was the roads, rather than the suppression resources that stopped the fire as in Narayanaraj and Winberly [87]. Burning operations that result in significant fire spread have the potential to distort post-hoc analyses of fire behaviour and its determinants if unaccounted for. Burning operations are not always revealed by the final fire perimeter or remote imagery (satellite/aerial photos). Currently, this potential distortion is largely unquantified in the literature. Operational data should be consulted to ensure appropriate differentiation between unplanned and planned sources of fire spread.
Technologies have improved, and geographic resource tracking has expanded beyond aviation resources. This may provide new methods for determining resource productivity. Operational data coupled with these improvements will be needed to tie productivity and resource requirements to the tasks that we identified. As we come to better understand how resources are being used on large wildfires, we will be better able to model suppression and improve our measures of effectiveness. This could result in numerous improvements in response planning, risk management, cost effectiveness and, perhaps most importantly, a more effective and safer operational response.

5. Conclusions

Using document analysis for a sample of ten major fires, we framed large wildfire suppression as a typical progression of fire sectors through a series of five discrete stages as opposed to the initial attack concept of suppression as a process of continuous control line construction as depicted by SSMs. The key features of the stages are:
  • Defensive: The fire behaviour is beyond the control capacity of the suppression resources. The focus is firefighter safety, asset protection and slowing the fire.
  • Offensive: The suppression resources are making ‘gains’ on the fire. Plans are emerging and being executed. The largest range in fire behaviour and suppression actions occurs in this stage.
  • Containment: A control line has been established along the entirety of the sector or division, and subsequent mop-up activities are expected to hold the fire at this perimeter.
  • Mop-Up: While mop-up activities occur to some degree in stages 2–5, complete mop-up of some depth (typically a 30 m perimeter) is the focus of this stage.
  • Patrol and Rehabilitation: The fire is still smouldering in the interior or in isolated hotspots on the perimeter. Perimeter mop-up is almost complete, and resources can be freed up for rehabilitation or demobilisation.
A whole-fire assessment of containment distorts resource use as sectors of large wildfires commonly differ on the stage of suppression attained on any given day. Within the stages, we identified 20 explicit suppression tasks; there are no guidelines to mandate the allocation of resources or productivity measures of 18 of the 20 tasks that we identified. The full suite of suppression tasks should be considered whenever a fire suppression model is constructed and used to explore the effectiveness of suppression and related research questions.

Author Contributions

Conceptualisation, H.S., R.B. and O.P.; Data curation, H.S.; Formal analysis, H.S.; Funding acquisition, H.S., R.B. and O.P.; Investigation, H.S.; Methodology, H.S., R.B. and O.P.; Project administration, H.S., R.B. and O.P.; Resources, R.B.; Supervision, R.B. and O.P.; Validation, H.S.; Visualisation, H.S.; Writing—original draft, H.S., R.B. and O.P.; Writing—review and editing, H.S., R.B. and O.P.

Funding

This research has been conducted with the support of the Bushfire Natural Hazards CRC Scholarship. Funding was provided by the Department of Environment, Land, Water and Planning, Victoria as part of the “Estimation of the social, economic and environmental costs and benefits of bushfire preparedness and response operations in the 2013/2014 fire season (Schedule 20)” project.

Acknowledgments

The authors would like to thank Bronwyn Horsey (University of Wollongong) for assistance with the coding of wildfires; staff from the NSW RFS and DELWP for their clarification of Australian suppression practices and confirmation of wildfire reconstructions; and DELWP for providing access to data.

Conflicts of Interest

The authors declare no conflict of interest.

Appendix A

Below are brief reconstructions of the 10 wildfires considered in this article. As the wildfires were assessed over the course of a 24 h burn period, starting at 07:00. The daily mapped fire extent represents the fire location at the beginning of the day. The fire extent for day 1 is represented by the point of origin. ‘Day 2’ on the fire progression maps is approximately 07:00 on the day after ignition. Regular, unambiguous mapping throughout the fire duration would make generating such progression maps much simpler. The depth or external extent of the burning operations was estimated.

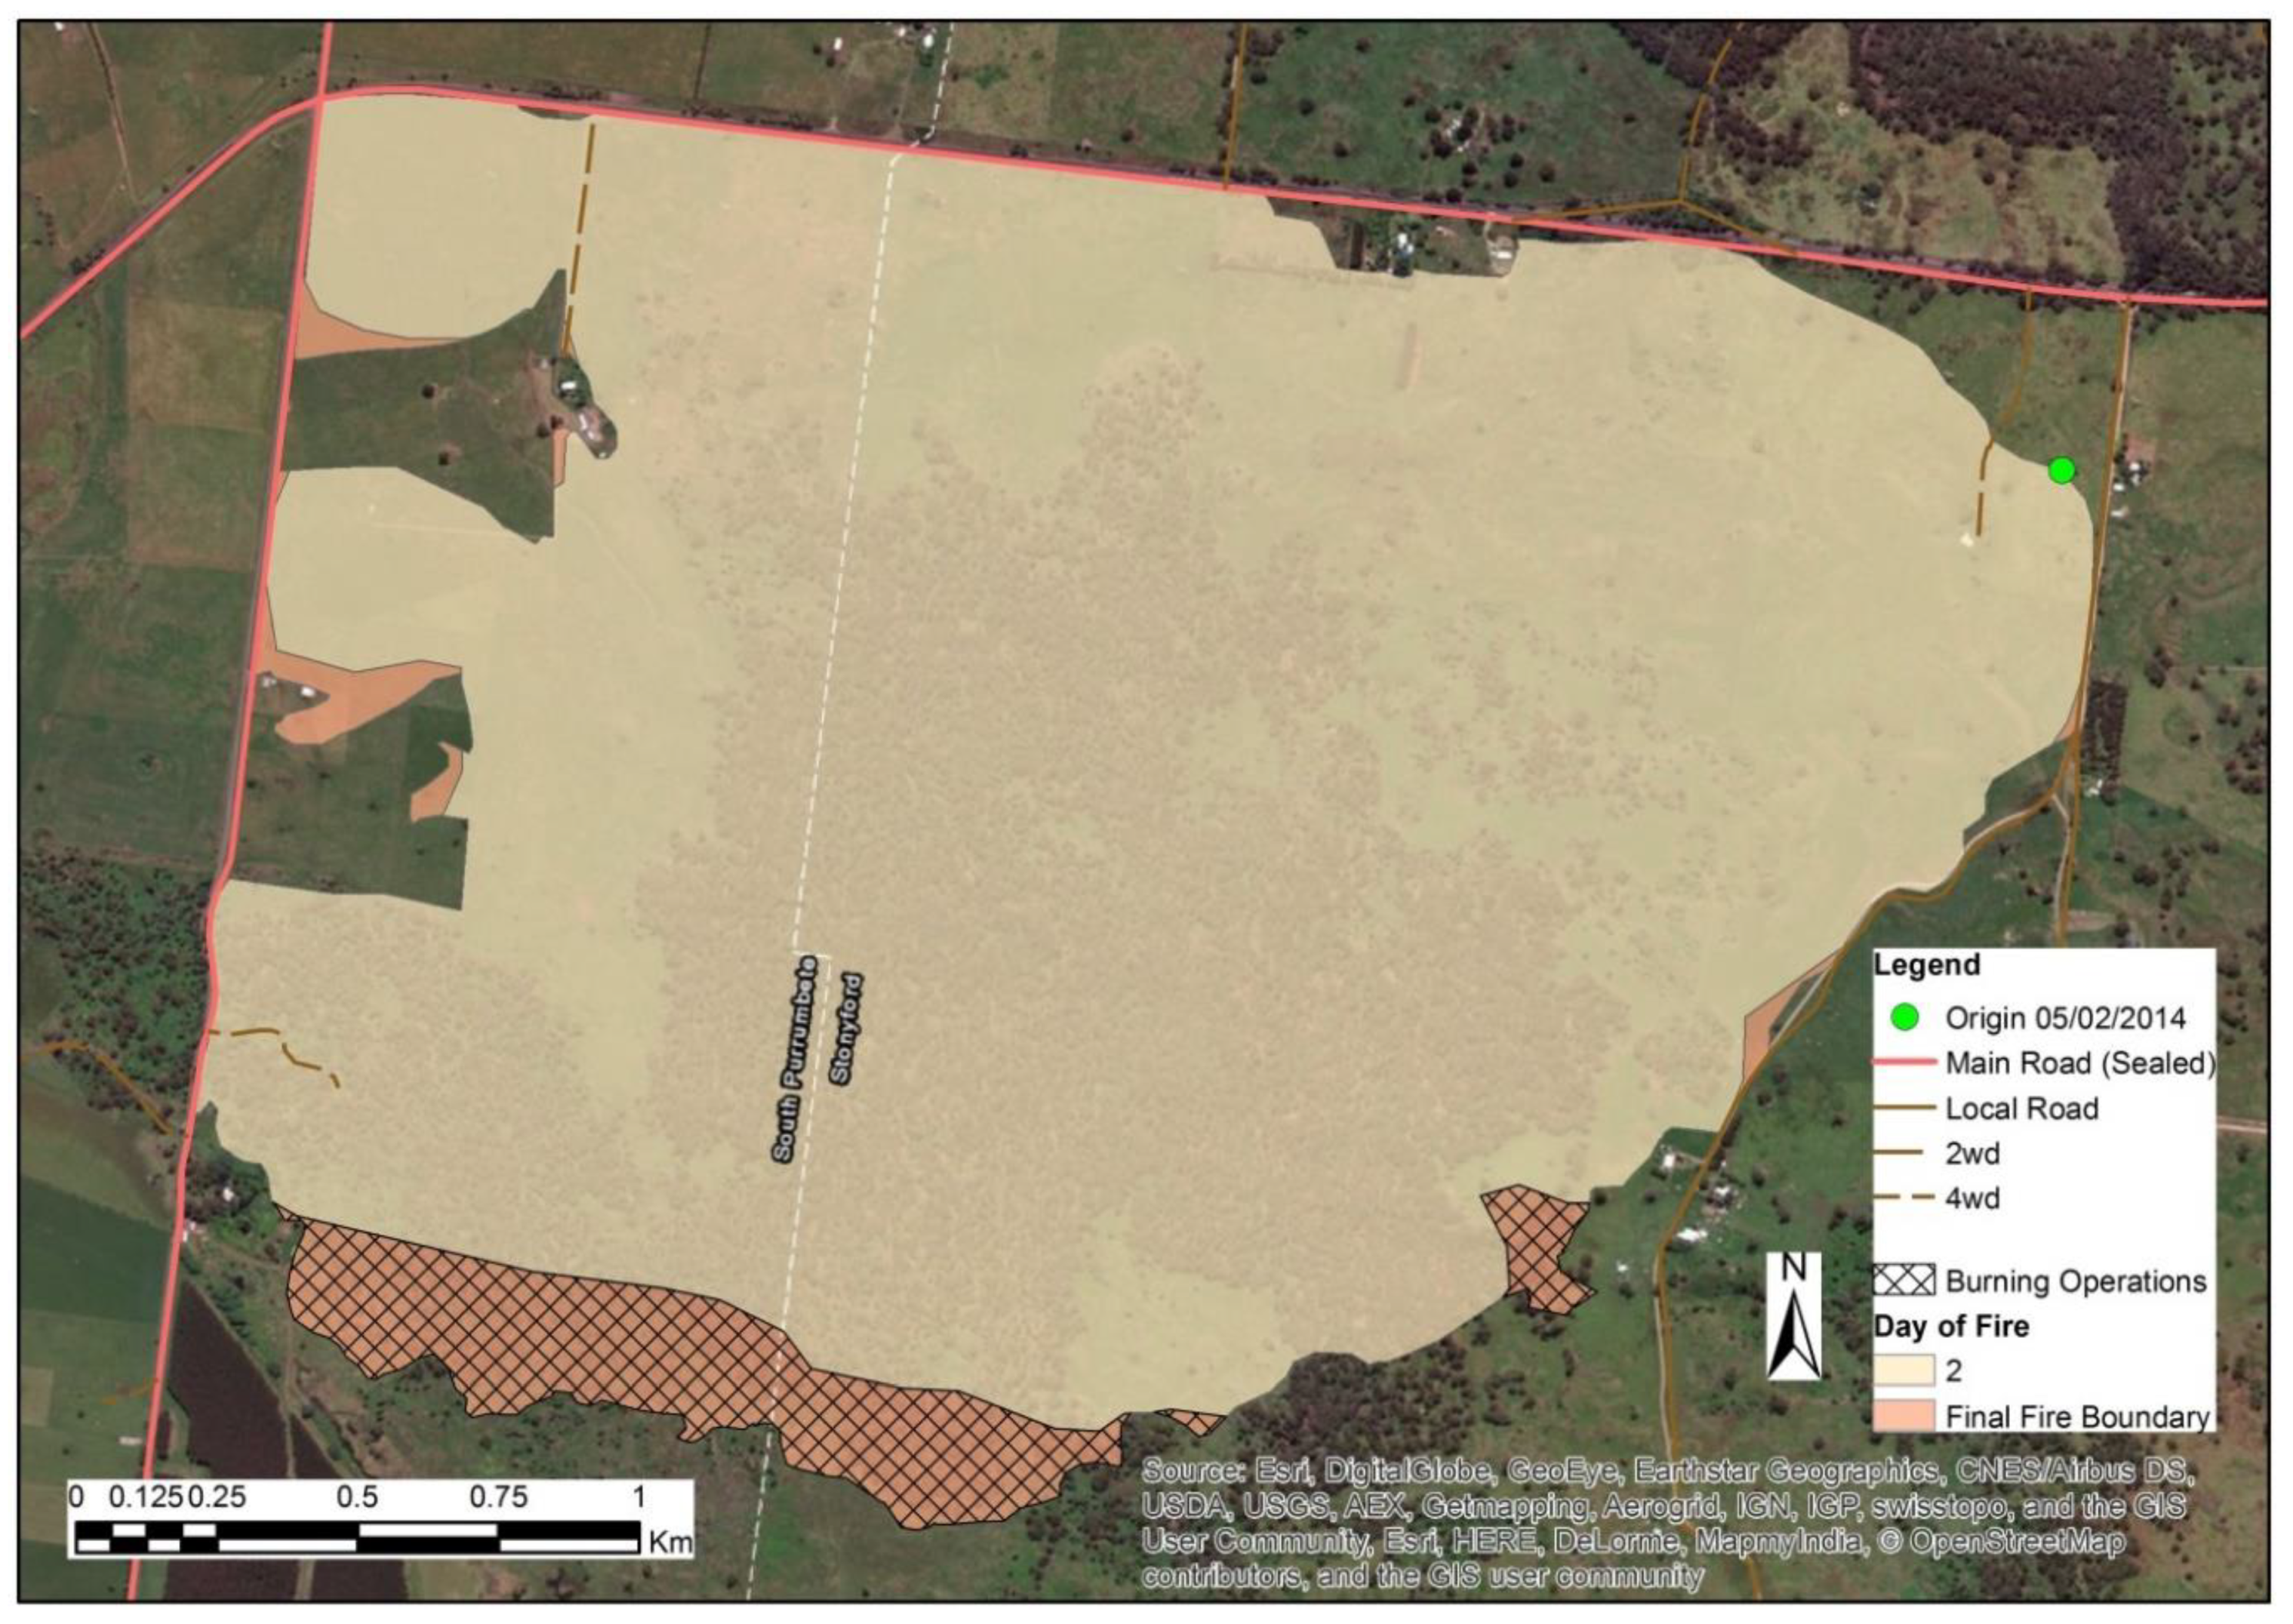
Appendix A.1. Stonyford

Aircraft (CFA response) started flying to the Stonyford wildfire (Figure A1) at 15:13, prior to the first DELWP record at 16:23 on the 5th of February. By 18:00, the forward spread was halted, and the fire was estimated to be 450 hectares. This is the smallest wildfire in the dataset by area, but it had the largest first-day response from ground crew (415), as well as substantive aerial resource use; 27 h of flight-time which included 4 h by fixed-wing birddog aircraft, 8 h by 2 light helicopters, and 15 h by 3 medium/heavy helicopters. Three sides of the fire used existing roads as control lines; the last side was a dozer line connecting the roads, which was completed by midnight on the first day. Limited burning operations were completed overnight on the 2nd day (6–7 February 2014). Perimeter mop-up depths were extended beyond what was detailed on other wildfires as adverse weather conditions were expected to occur on the 5th day.
Figure A1. Stonyford fire progression map.
Forests 10 00884 g0a1

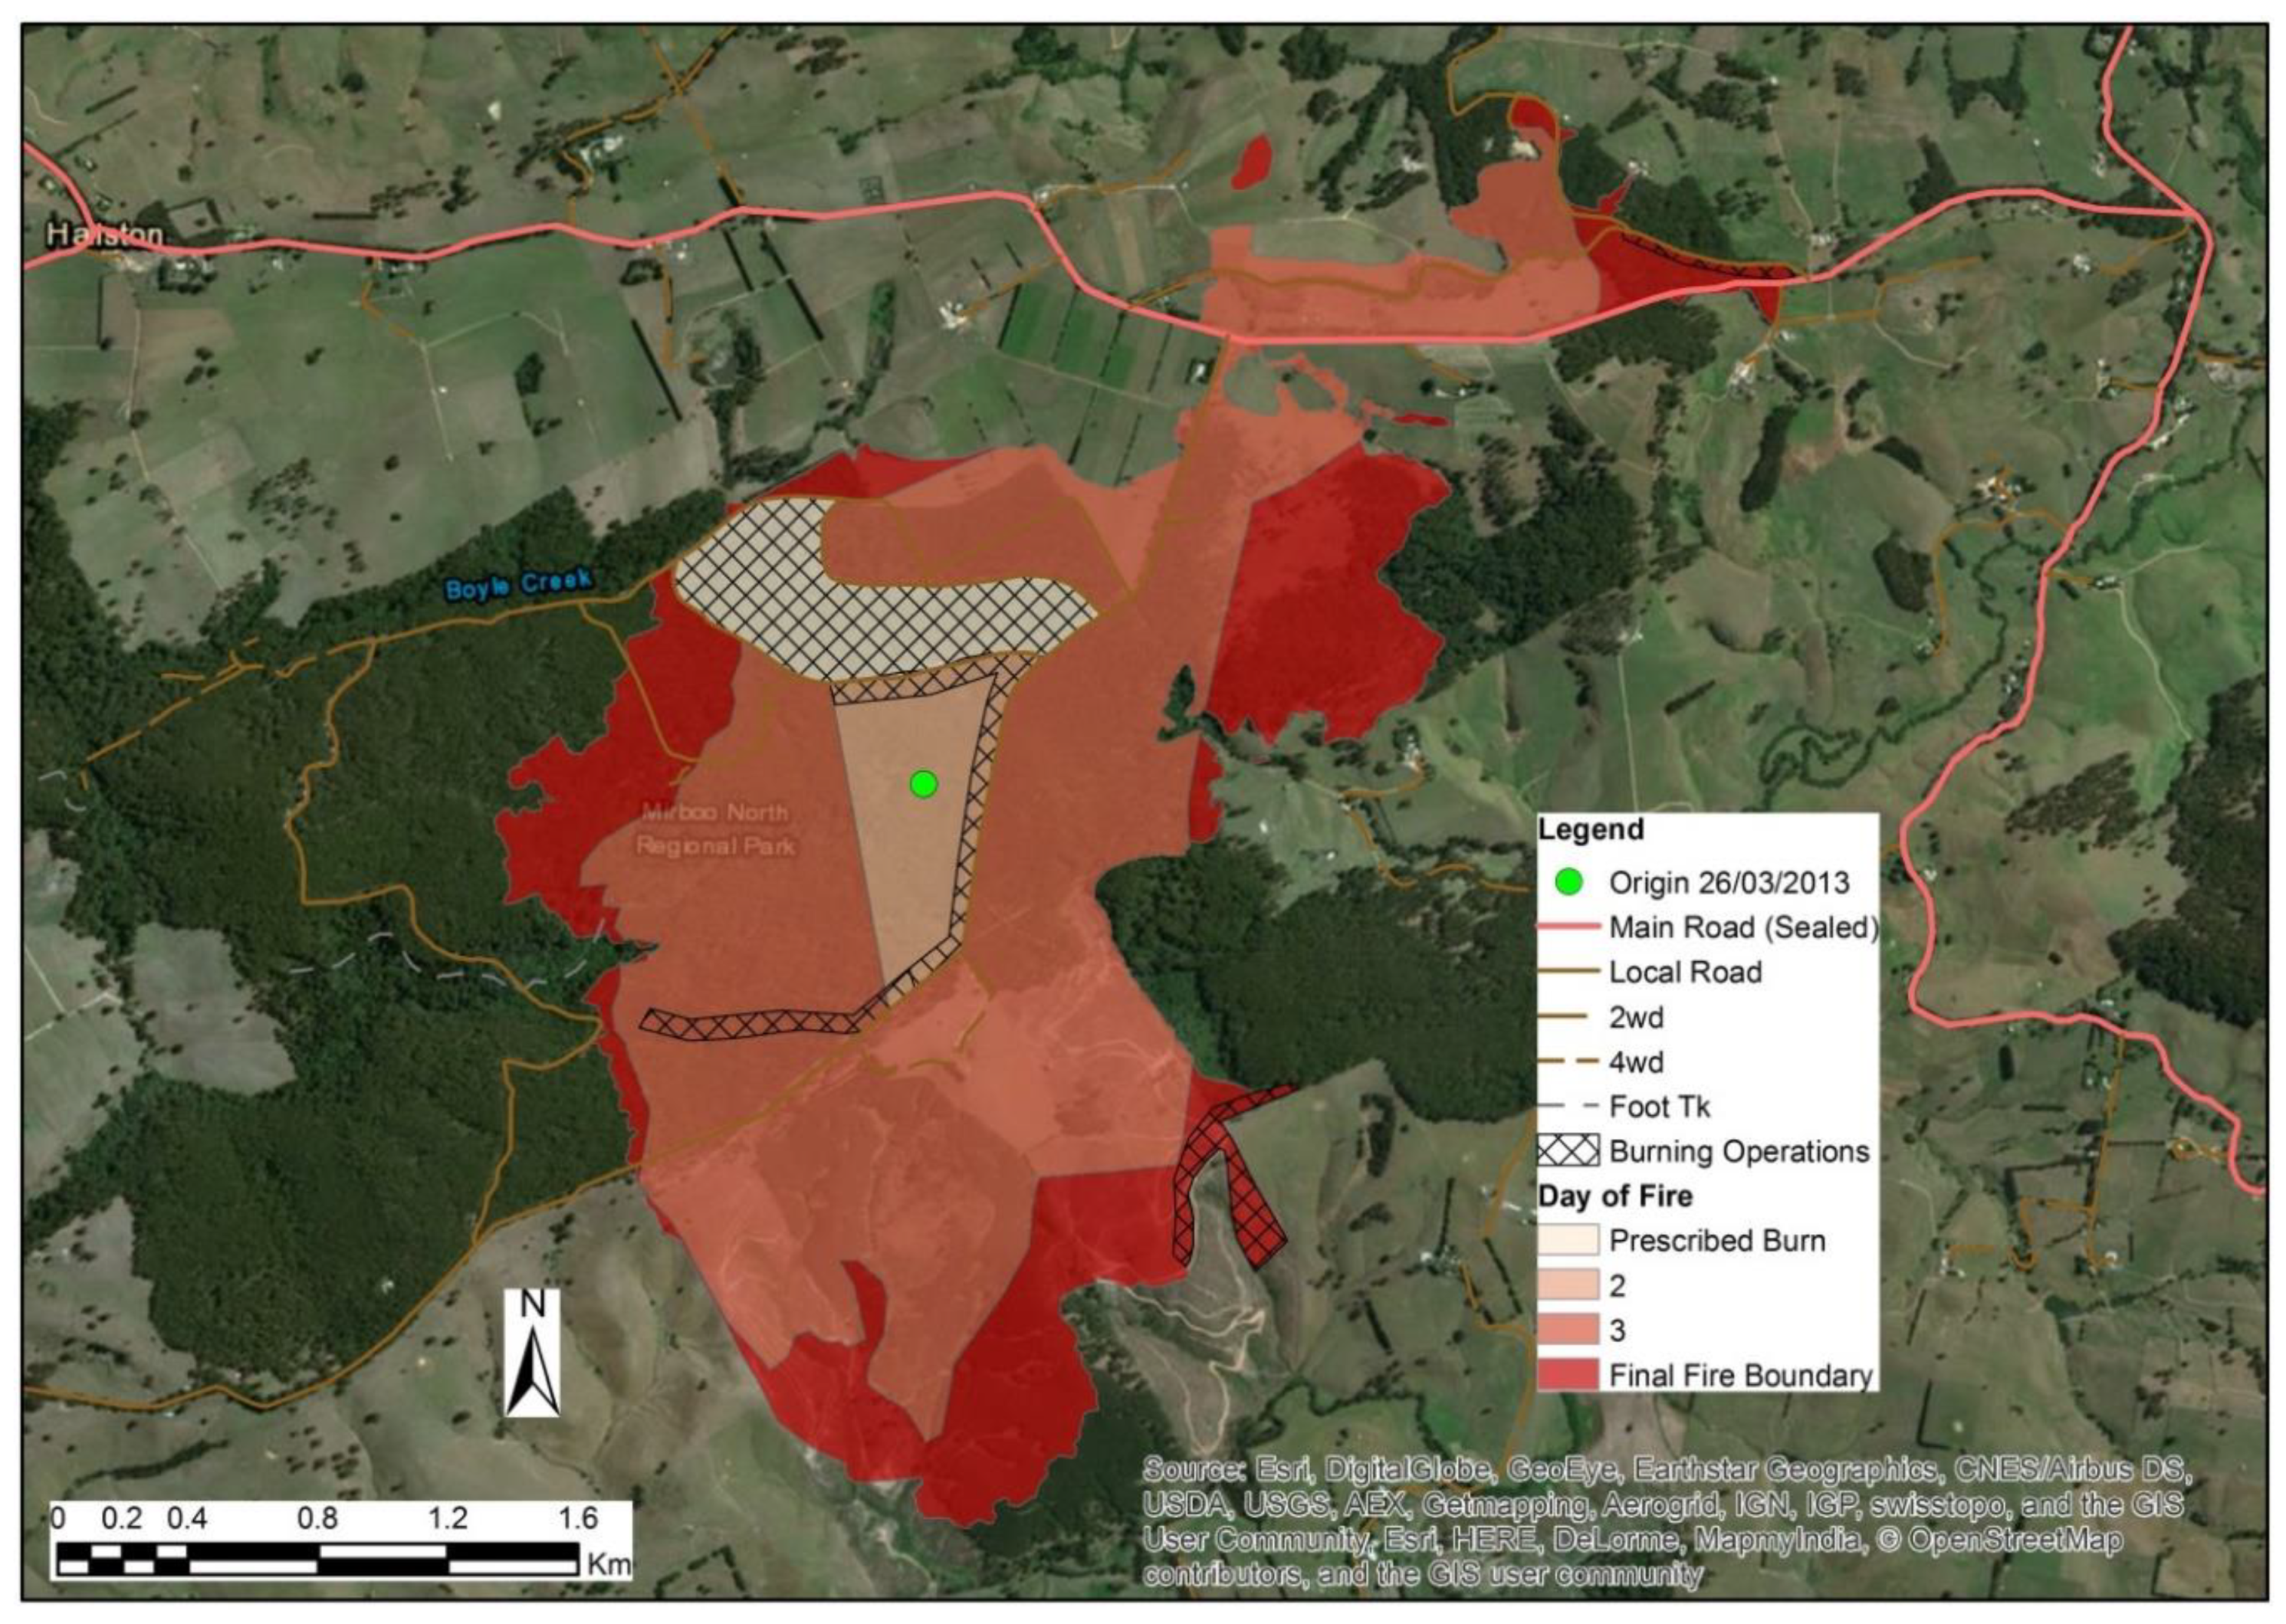
Appendix A.2. Hallston

At 16:33 on the 26th of March 2013, it was reported that a prescribed burn had been spotted ~300 m south of the intended burn area, igniting the Hallston wildfire (Figure A2). A 100 m wide head-fire initially spread in a south–west direction. Early in the morning (05:35) on the second day, the fire was 49 hectares and partially contained on the north, east and south sides. The fire was spotted over the control lines again in the early afternoon (13:32) on the 2nd day. By that evening, it was reported to be 320 hectares and still growing, and crews were engaged in asset protection. The fire continued to burn overnight and approached the limit of its growth in the morning of the 3rd day (28 January 2012) when it started to rain. Some limited burning operations occurred during containment efforts, but primarily containment was achieved with direct attack in conjunction with the rain. Final completion of mechanical control lines in the forested areas occurred days after the fire spread had halted as it was too wet and unsuitable for heavy equipment.
Figure A2. Hallston fire progression map.
Forests 10 00884 g0a2

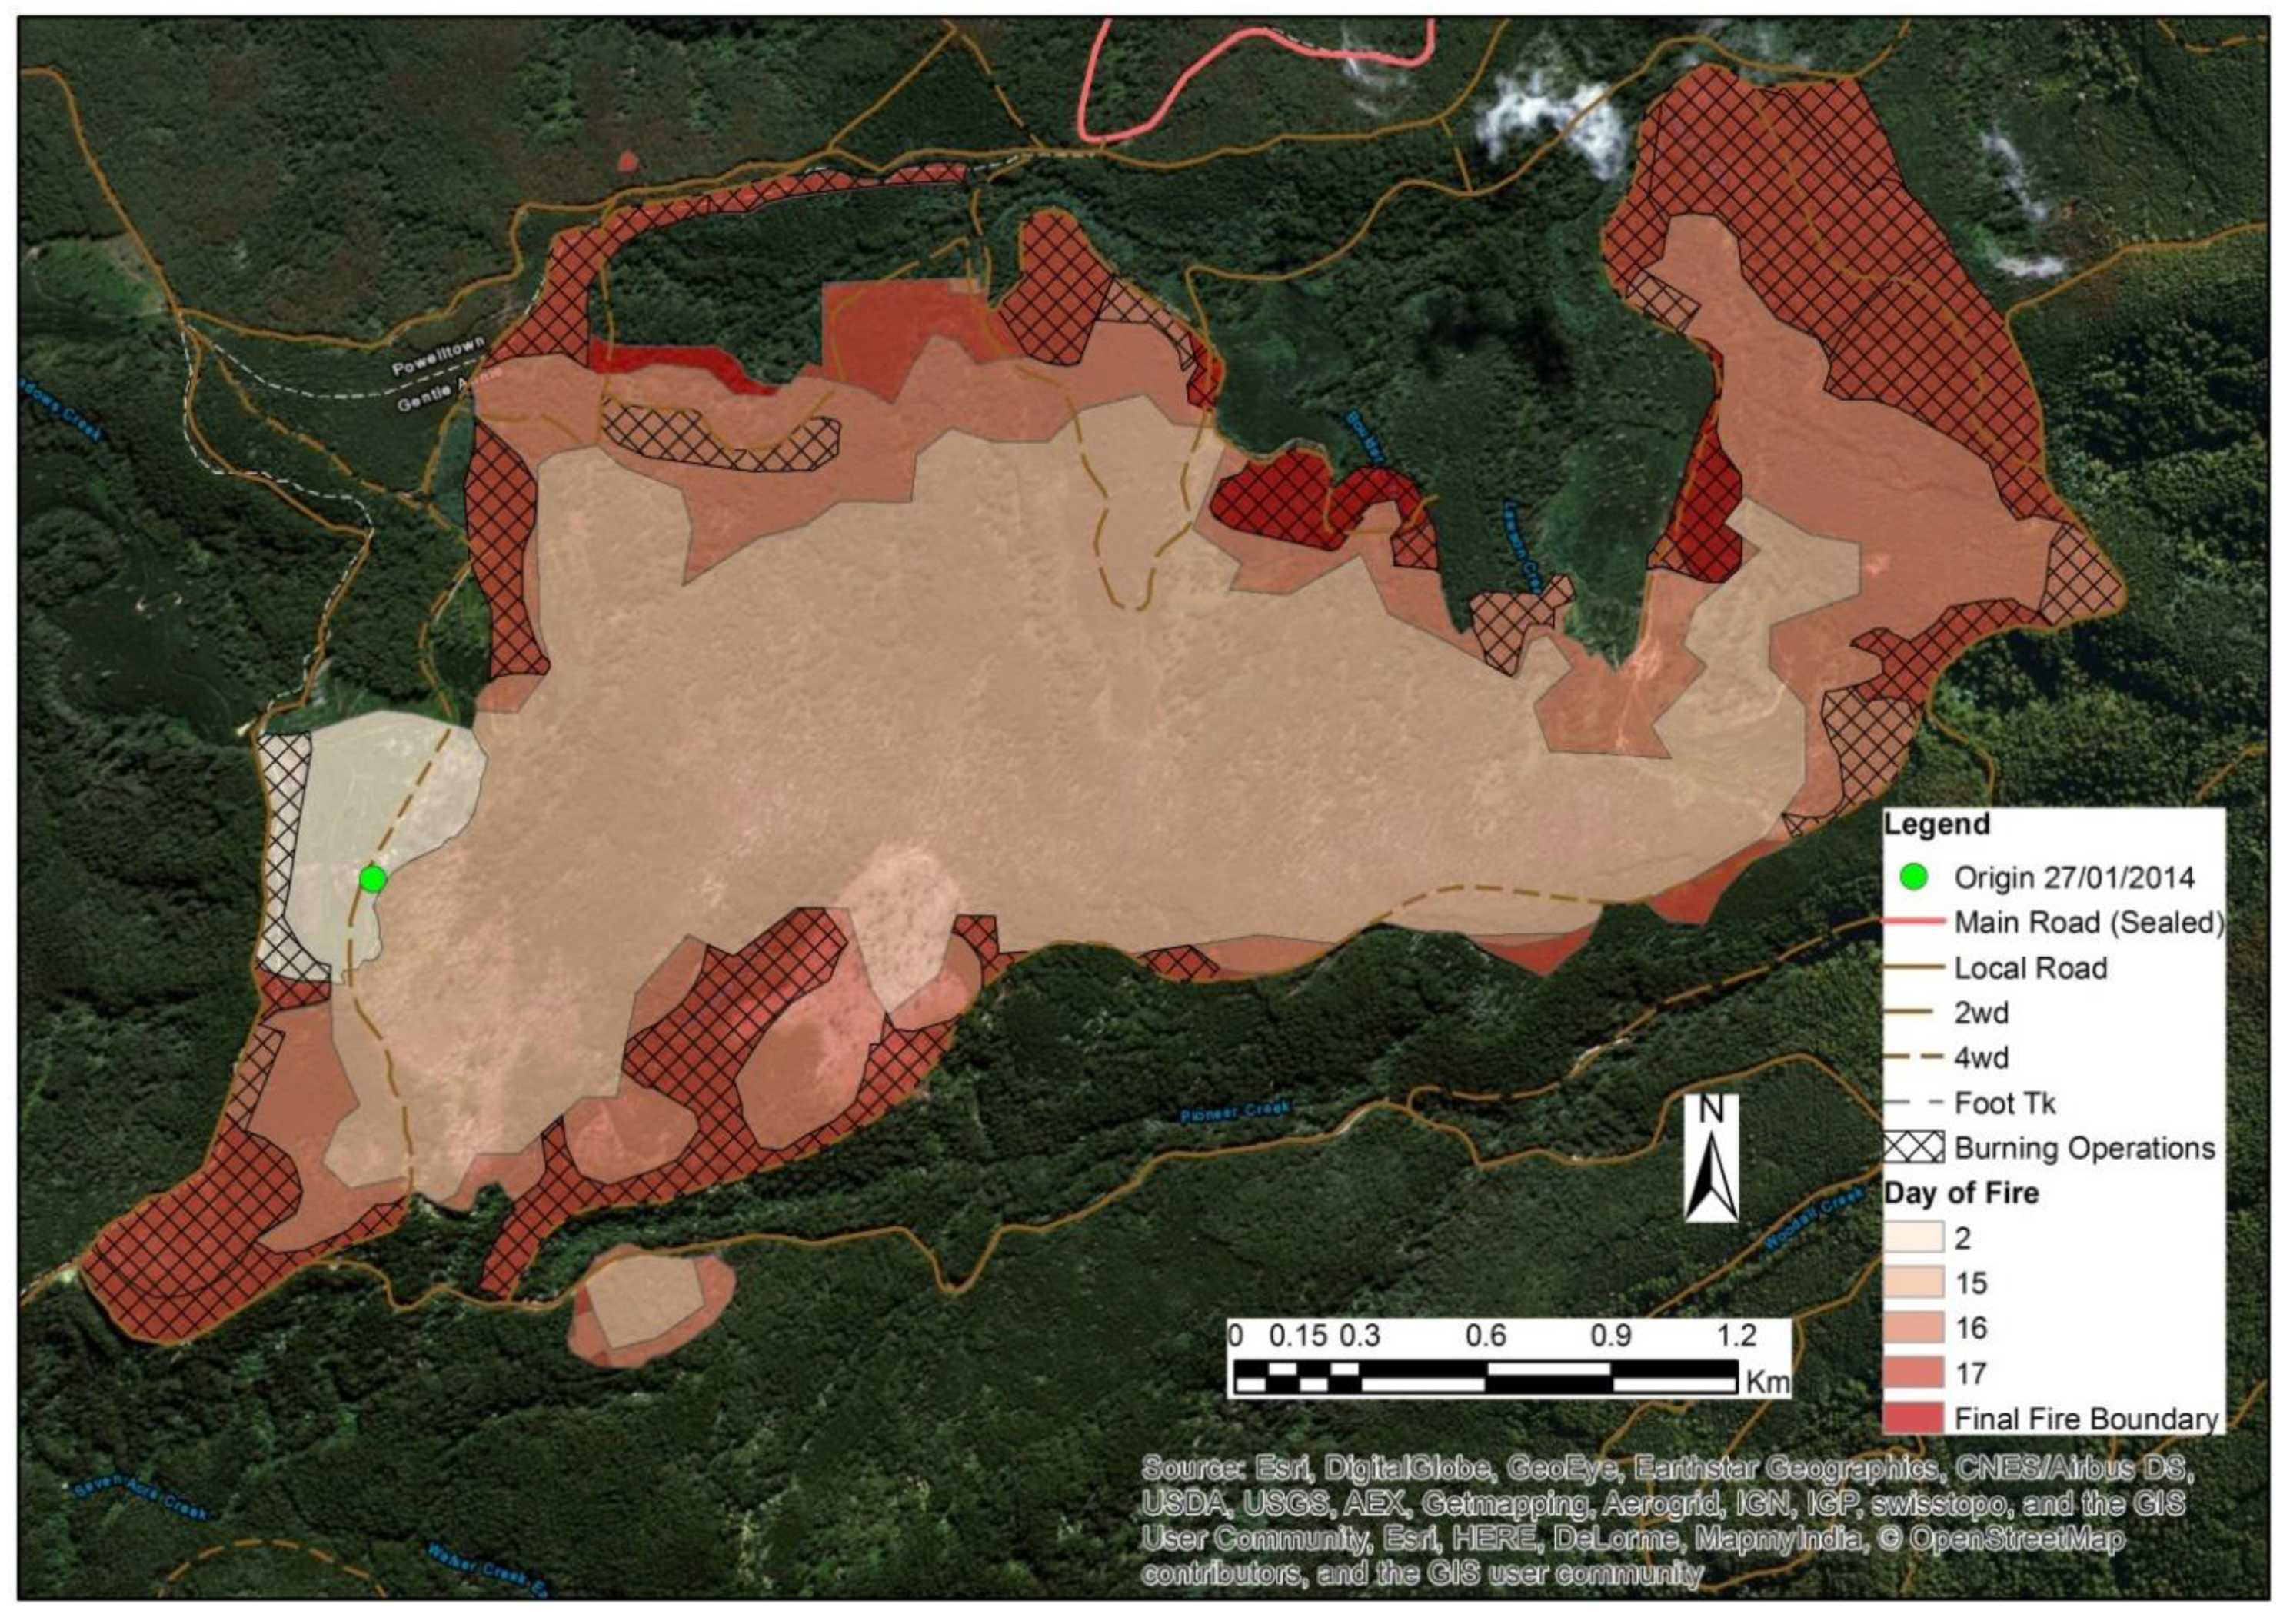
Appendix A.3. Powelltown

The Powelltown wildfire (Figure A3) started in an active logging coupe and was contained at 22 hectares on 27 January 2014. In the morning (11:18) of 9 February 2014, nine days after the last suppression presence, the fire rekindled and grew over three-hundred hectares to an estimated 350 hectares the morning of 10 February 2014. A plan was developed by midnight 2 September 2014 to use the existing road network to contain the fire. Successive burning operations occurred along the roads and short stretches of mechanical control line day and night until the evening of 12 February 2014, when the fire was contained. Issues occurred with the burning operations, such as one section exceeding the intended burn area and one operation ceasing because the fire would not spread.
Figure A3. Powelltown fire progression map.
Forests 10 00884 g0a3

Appendix A.4. Corryong

Two lightning fires that were reported on 16 and 17 January 2014 in a remote forested area merged together on 19 January 2014 as the Timbarra wildfire (Figure A4). There was only aerial suppression on the first day, and the direct attack strategy enacted on the second day was abandoned. Aerial suppression was used to slow the fire while burning operations occurred. Two of four sides of the fire were contained with burning operations that used existing roads. The burning operations were extended along a newly constructed dozer line (~4 km), and there were plans to burn along the existing road to contain the final side, but a dozer line was constructed along the fire edge instead. This was due to a weather change on the 24 January 2014, which included significant rain. Control line construction and burning operations took longer than expected, and hazard tree work was an ongoing impediment. Extensive work was done to clear existing roads as contingency lines.
Figure A4. Corryong fire progression map.
Forests 10 00884 g0a4

Appendix A.5. Morwell

The first report (15:18) of the first of two human-caused ignitions on the Morwell wildfire (Figure A5) was on 7 February 2014. The CFA responded to the first fire and it was contained at 156 hectares on 8 February 2014. Early in the afternoon (13:12), the fire was spotted beyond the control lines and, at 591 hectares, it was spreading toward substantive assets, including public infrastructure, mining assets, plantations and a mill and private residences. The first report (14:46) of the second ignition was on 9 February 2014. By early evening (17:37), the fire was reported to be 2800 hectares, there was extensive spotting and multiple assets were being impacted. It is not clear whether the burn area associated with the second ignition (~759 hectares) merged with the initial fire, but the two fires were managed as one incident. There were no further significant suppression challenges following the period of rapid wildfire growth on 9–10 February 2014 as a ~315 hectare burn area within the Hazelwood Mine was excised for separate management due to the specialised suppression requirements of a coal mine fire.
Figure A5. Morwell fire progression map.
Forests 10 00884 g0a5

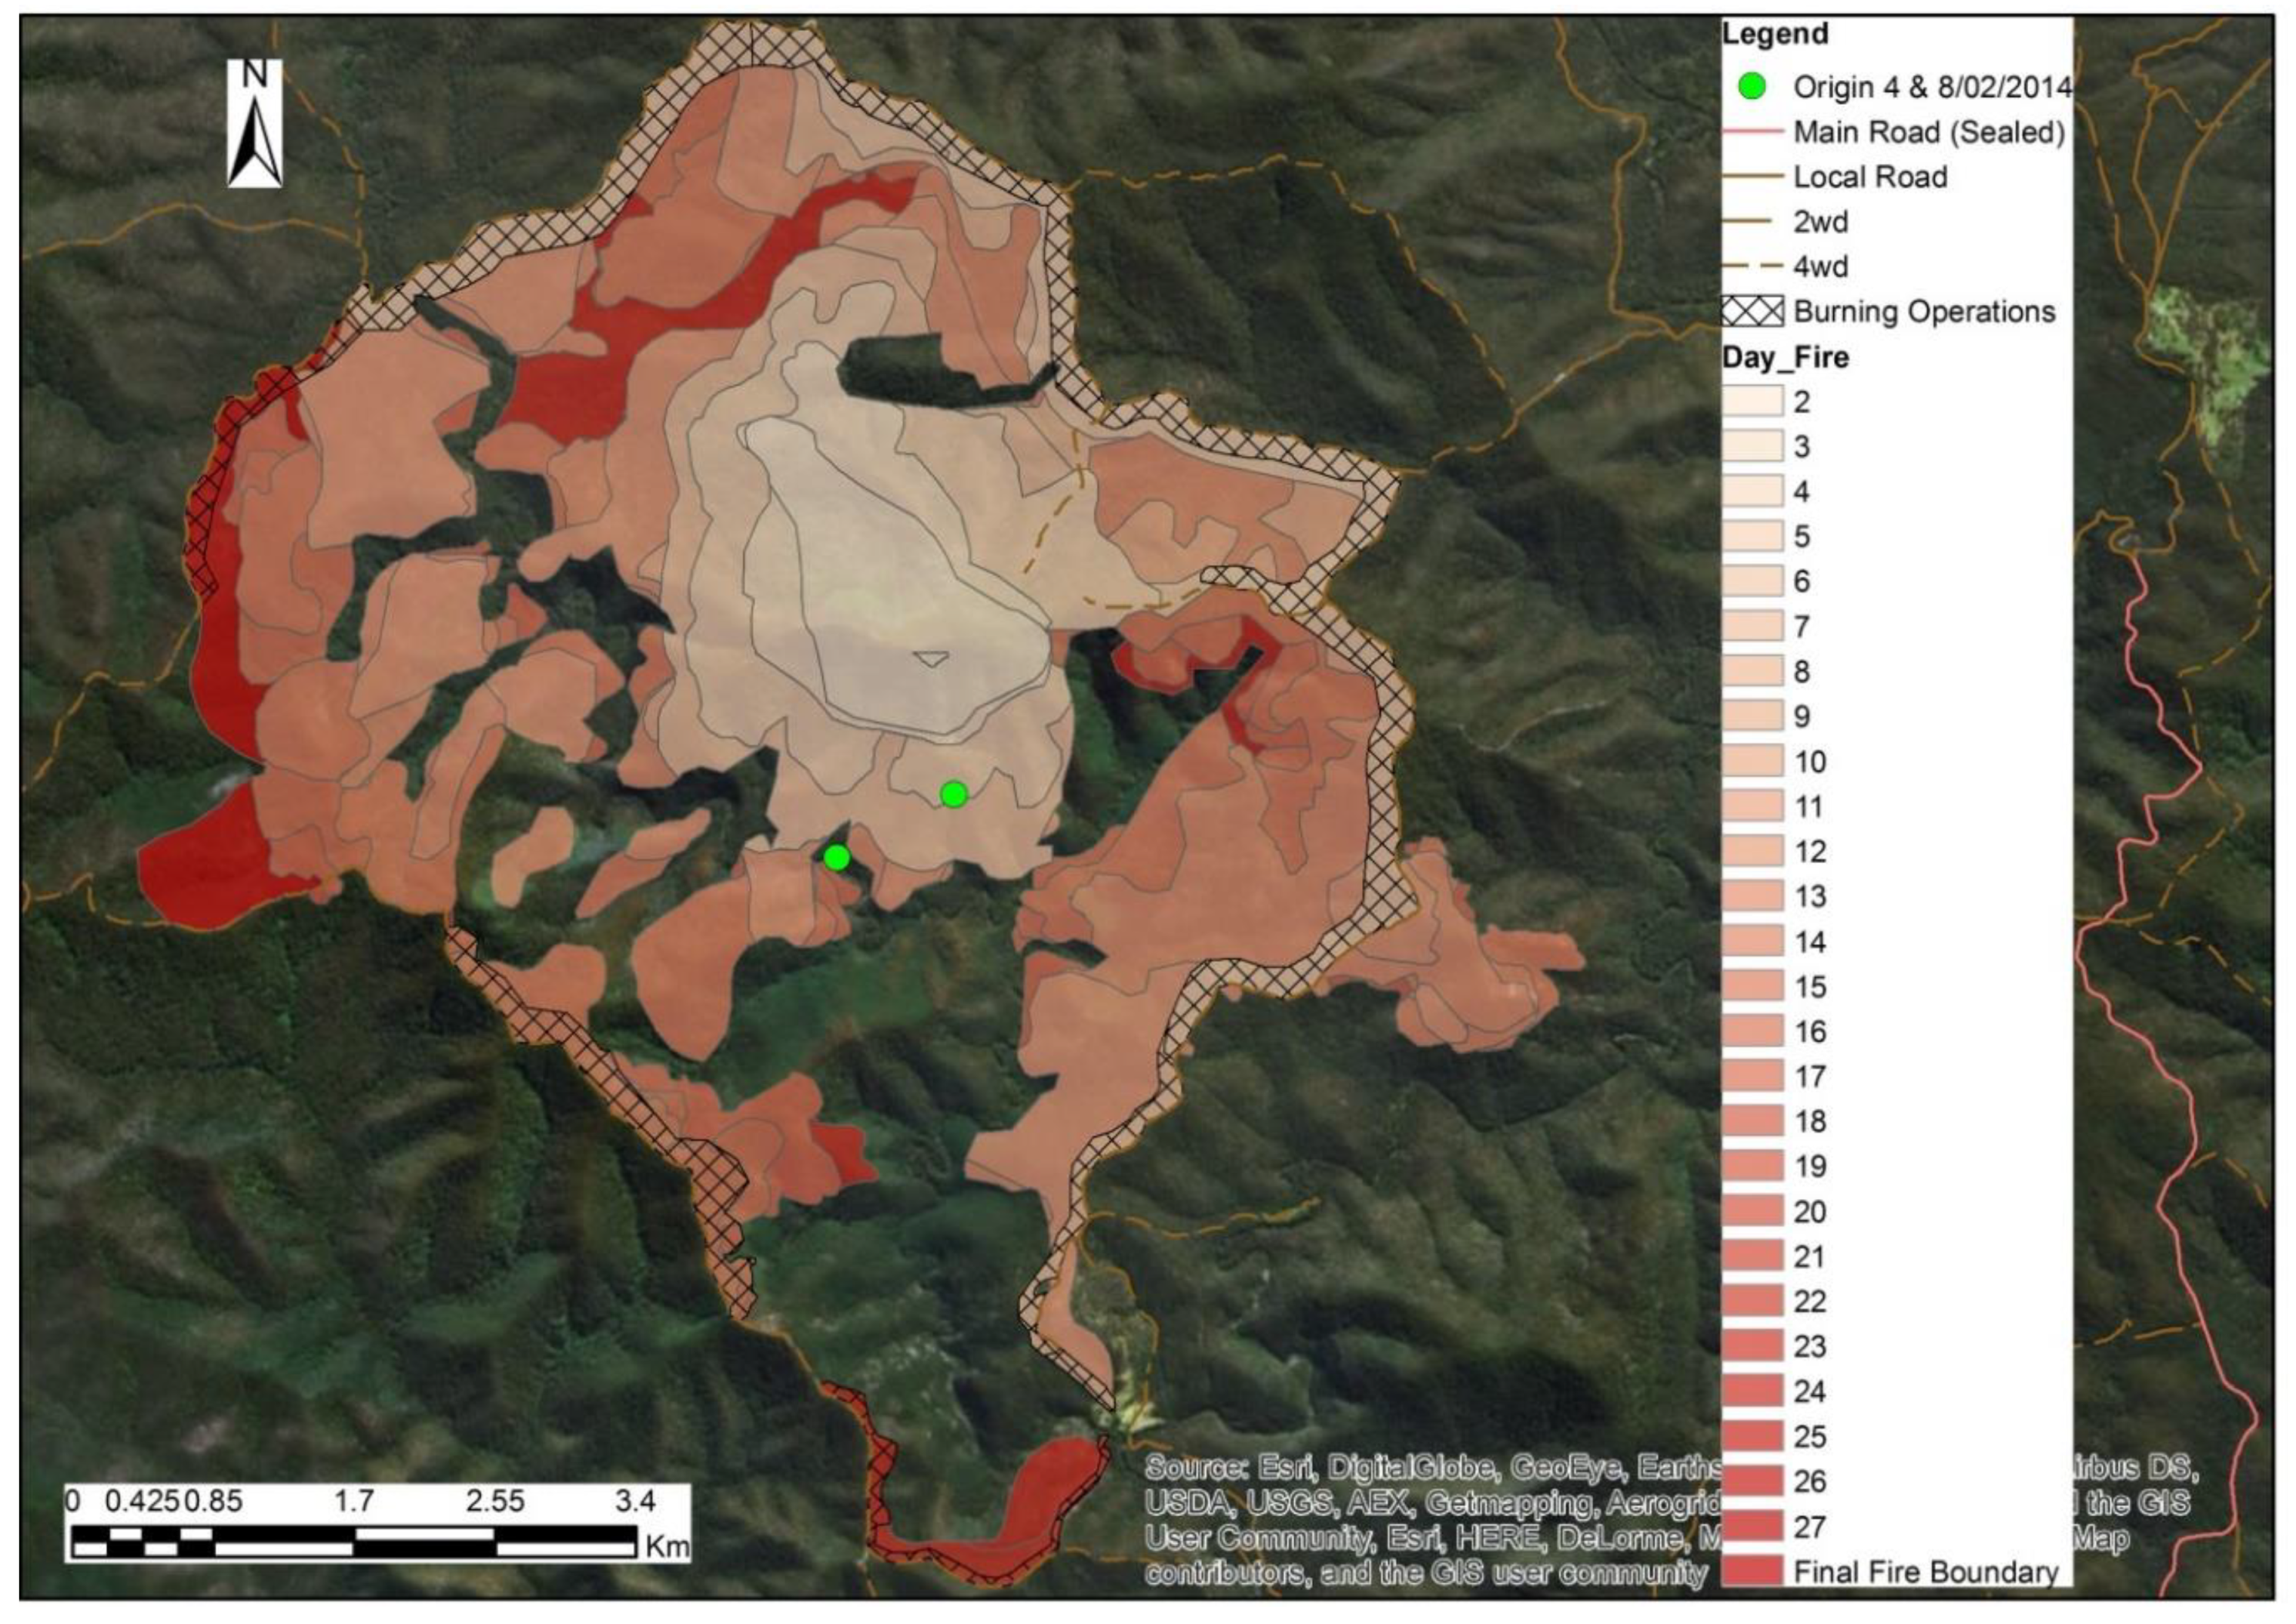
Appendix A.6. Timbarra

The Timbarra wildfire (Figure A6) was reported in the afternoon (13:51) of 8 February 2014. For two days, direct attack with ground crews was deemed to be too dangerous and aerial suppression resources were used exclusively. Ground resources accessed the fire on 10 February 2014, and improvements were made to the existing road network to enable its use as a control line for burning operations. Burning operations started on 12 February 2014 with a burn extending ~7 km that reached a depth of ~100 m from the road, and they continued until 14 February 2014, when they encompassed three sides of the fire and were halted by rain. Adverse weather on 19 February 2014 resulted in the fire spotting outside of the intended burn area. Burning operations resumed on 21 February 2014 and continued on intermittent days until 3 March 2014. This fire was managed as a part of a complex of fires which obscured the multistage process until later in the fire management (the 17th day). The fire overran another lightning-caused fire (Ensay-Dinner Creek Track) that that had been contained to 0.3 hectares on 4 February 2014.
Figure A6. Timbarra fire progression map.
Forests 10 00884 g0a6

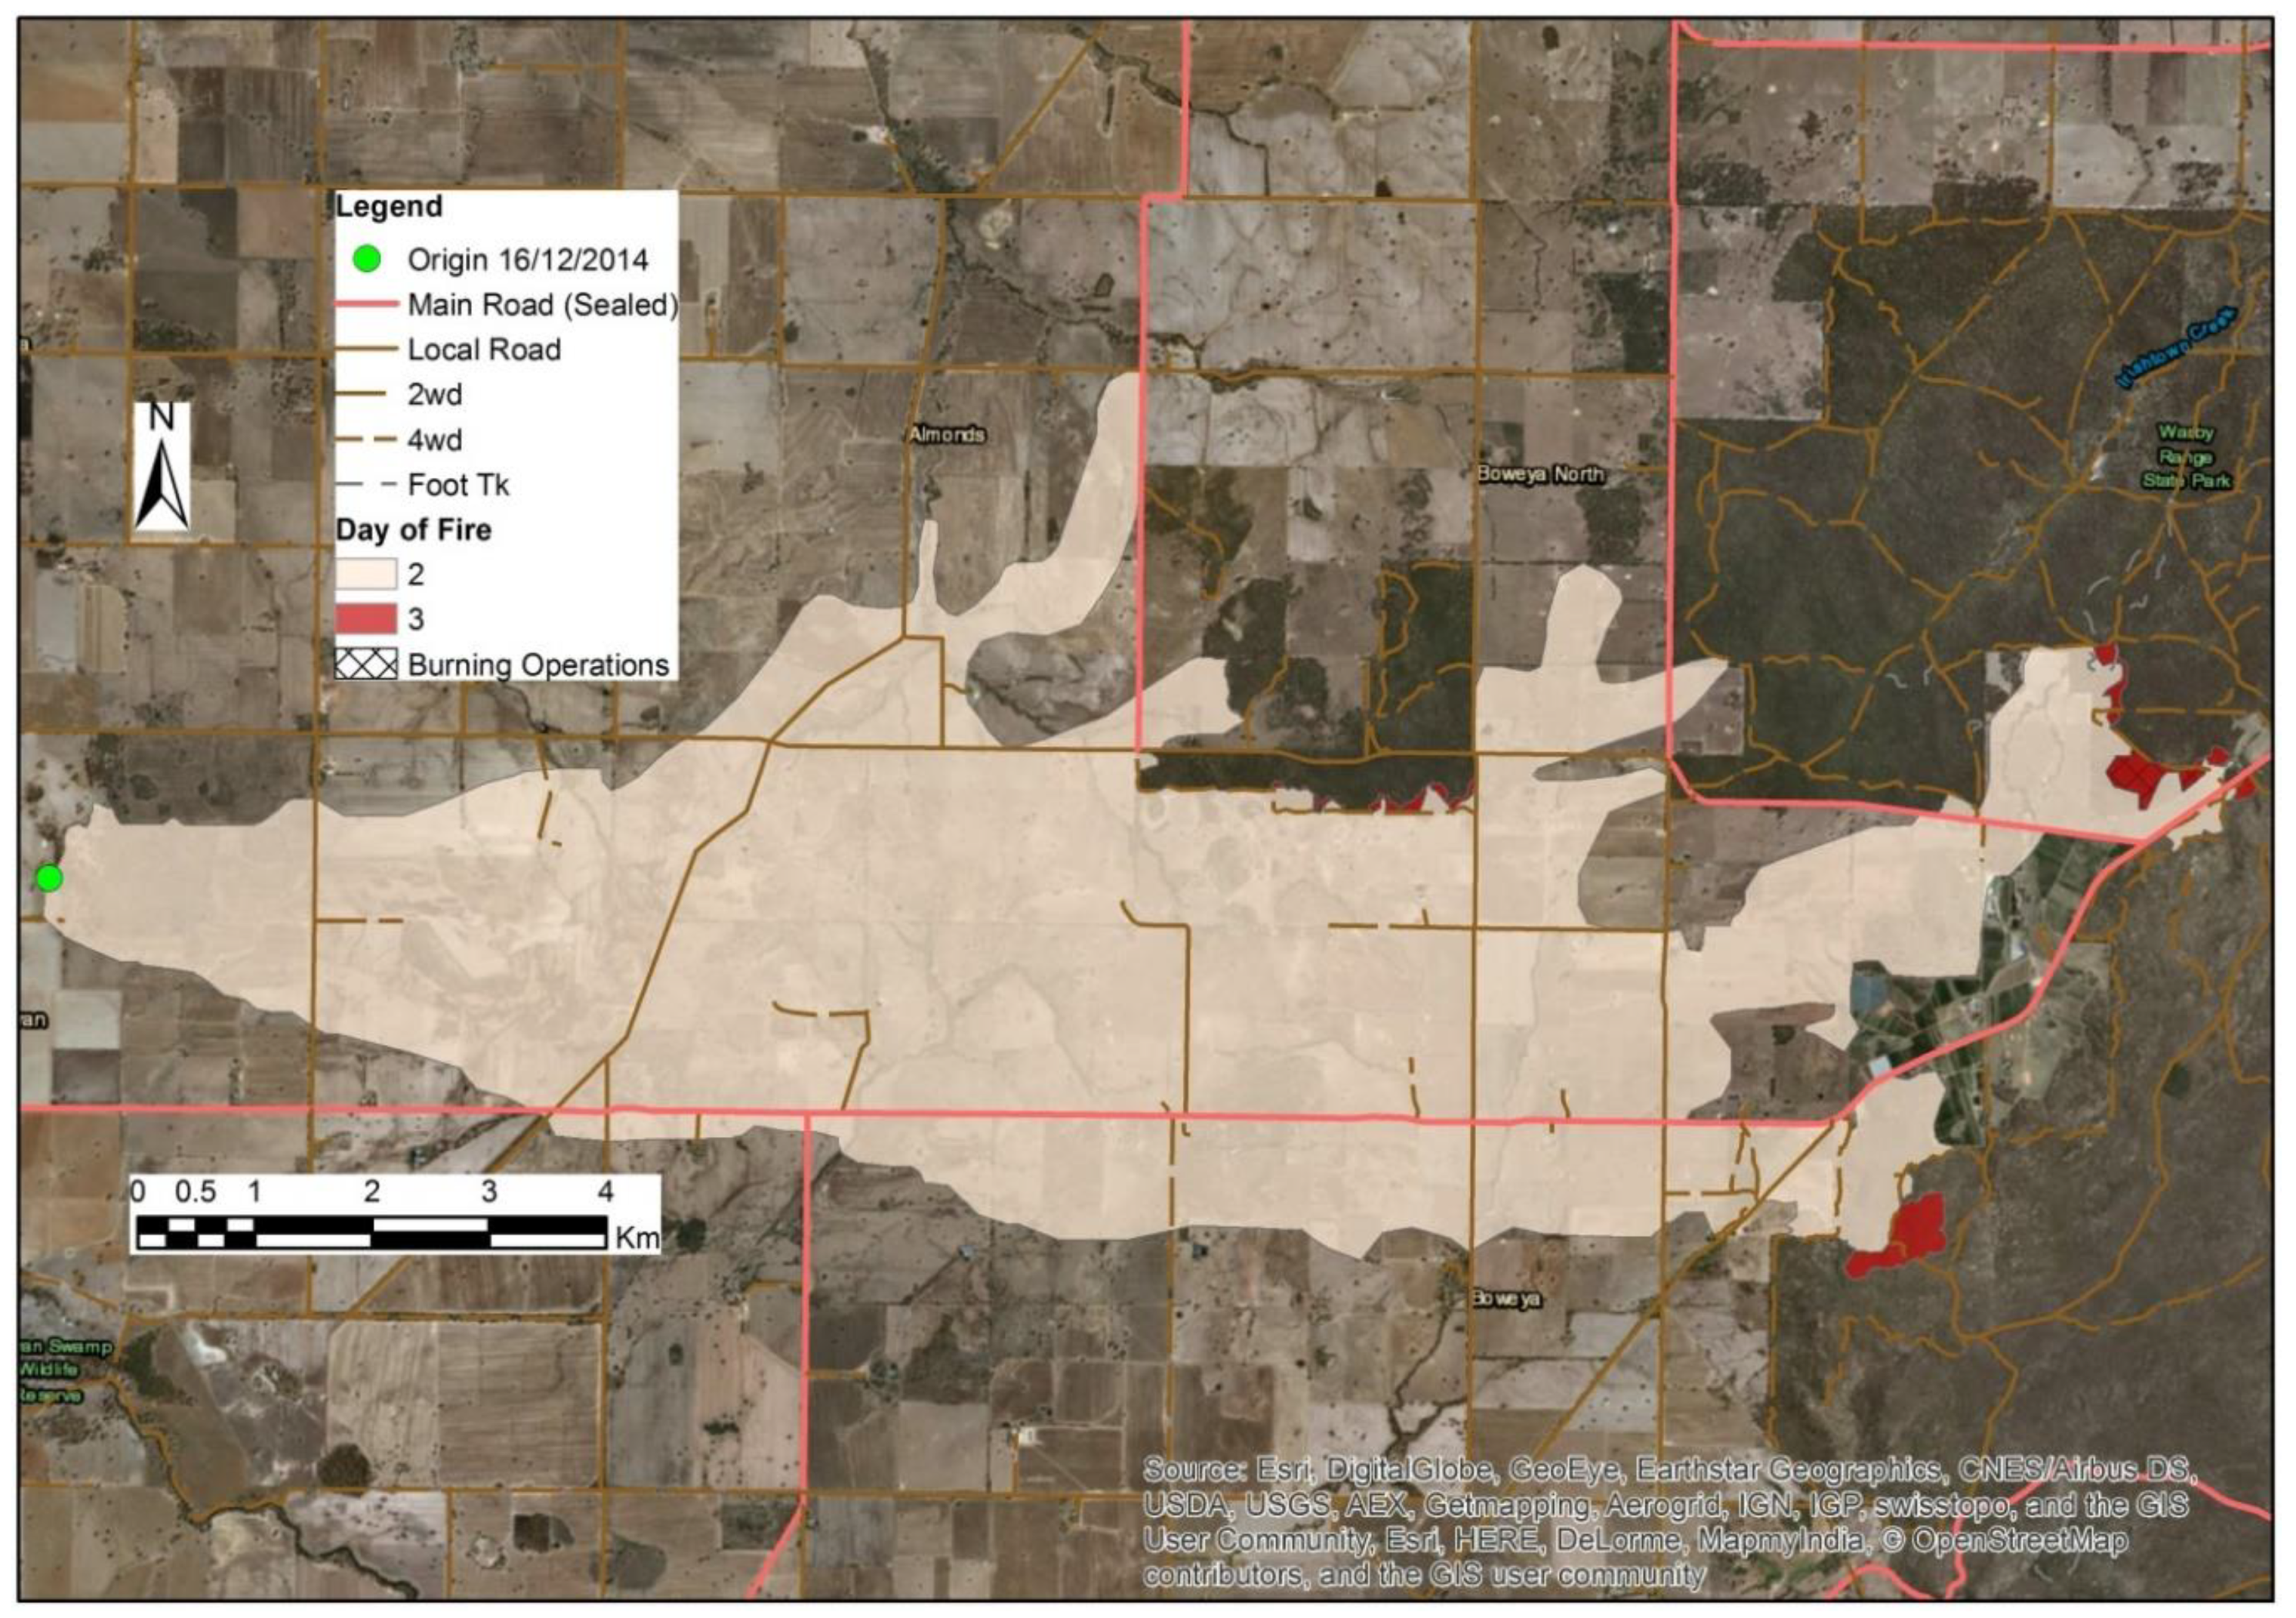
Appendix A.7. Lake Rowan

Protection of rural assets was the focus of suppression during the first day of the rapidly growing Lake Rowan wildfire (Figure A7), which was estimated to be over 1000 hectares an hour and a half after the first report (15:50) on 16 December 2014. By 19:00, the fire had burned ~15 km from the point of origin, and further fire behaviour and spread was moderated by milder overnight weather. Graders were used to establish control lines in rural pastures, while dozers were used in the treed areas. Fire spread was relatively limited after the first burn period, and there were burning operations overnight in the treed areas on the night of the 18th and 20th of December.
Figure A7. Lake Rowan fire progression map.
Forests 10 00884 g0a7

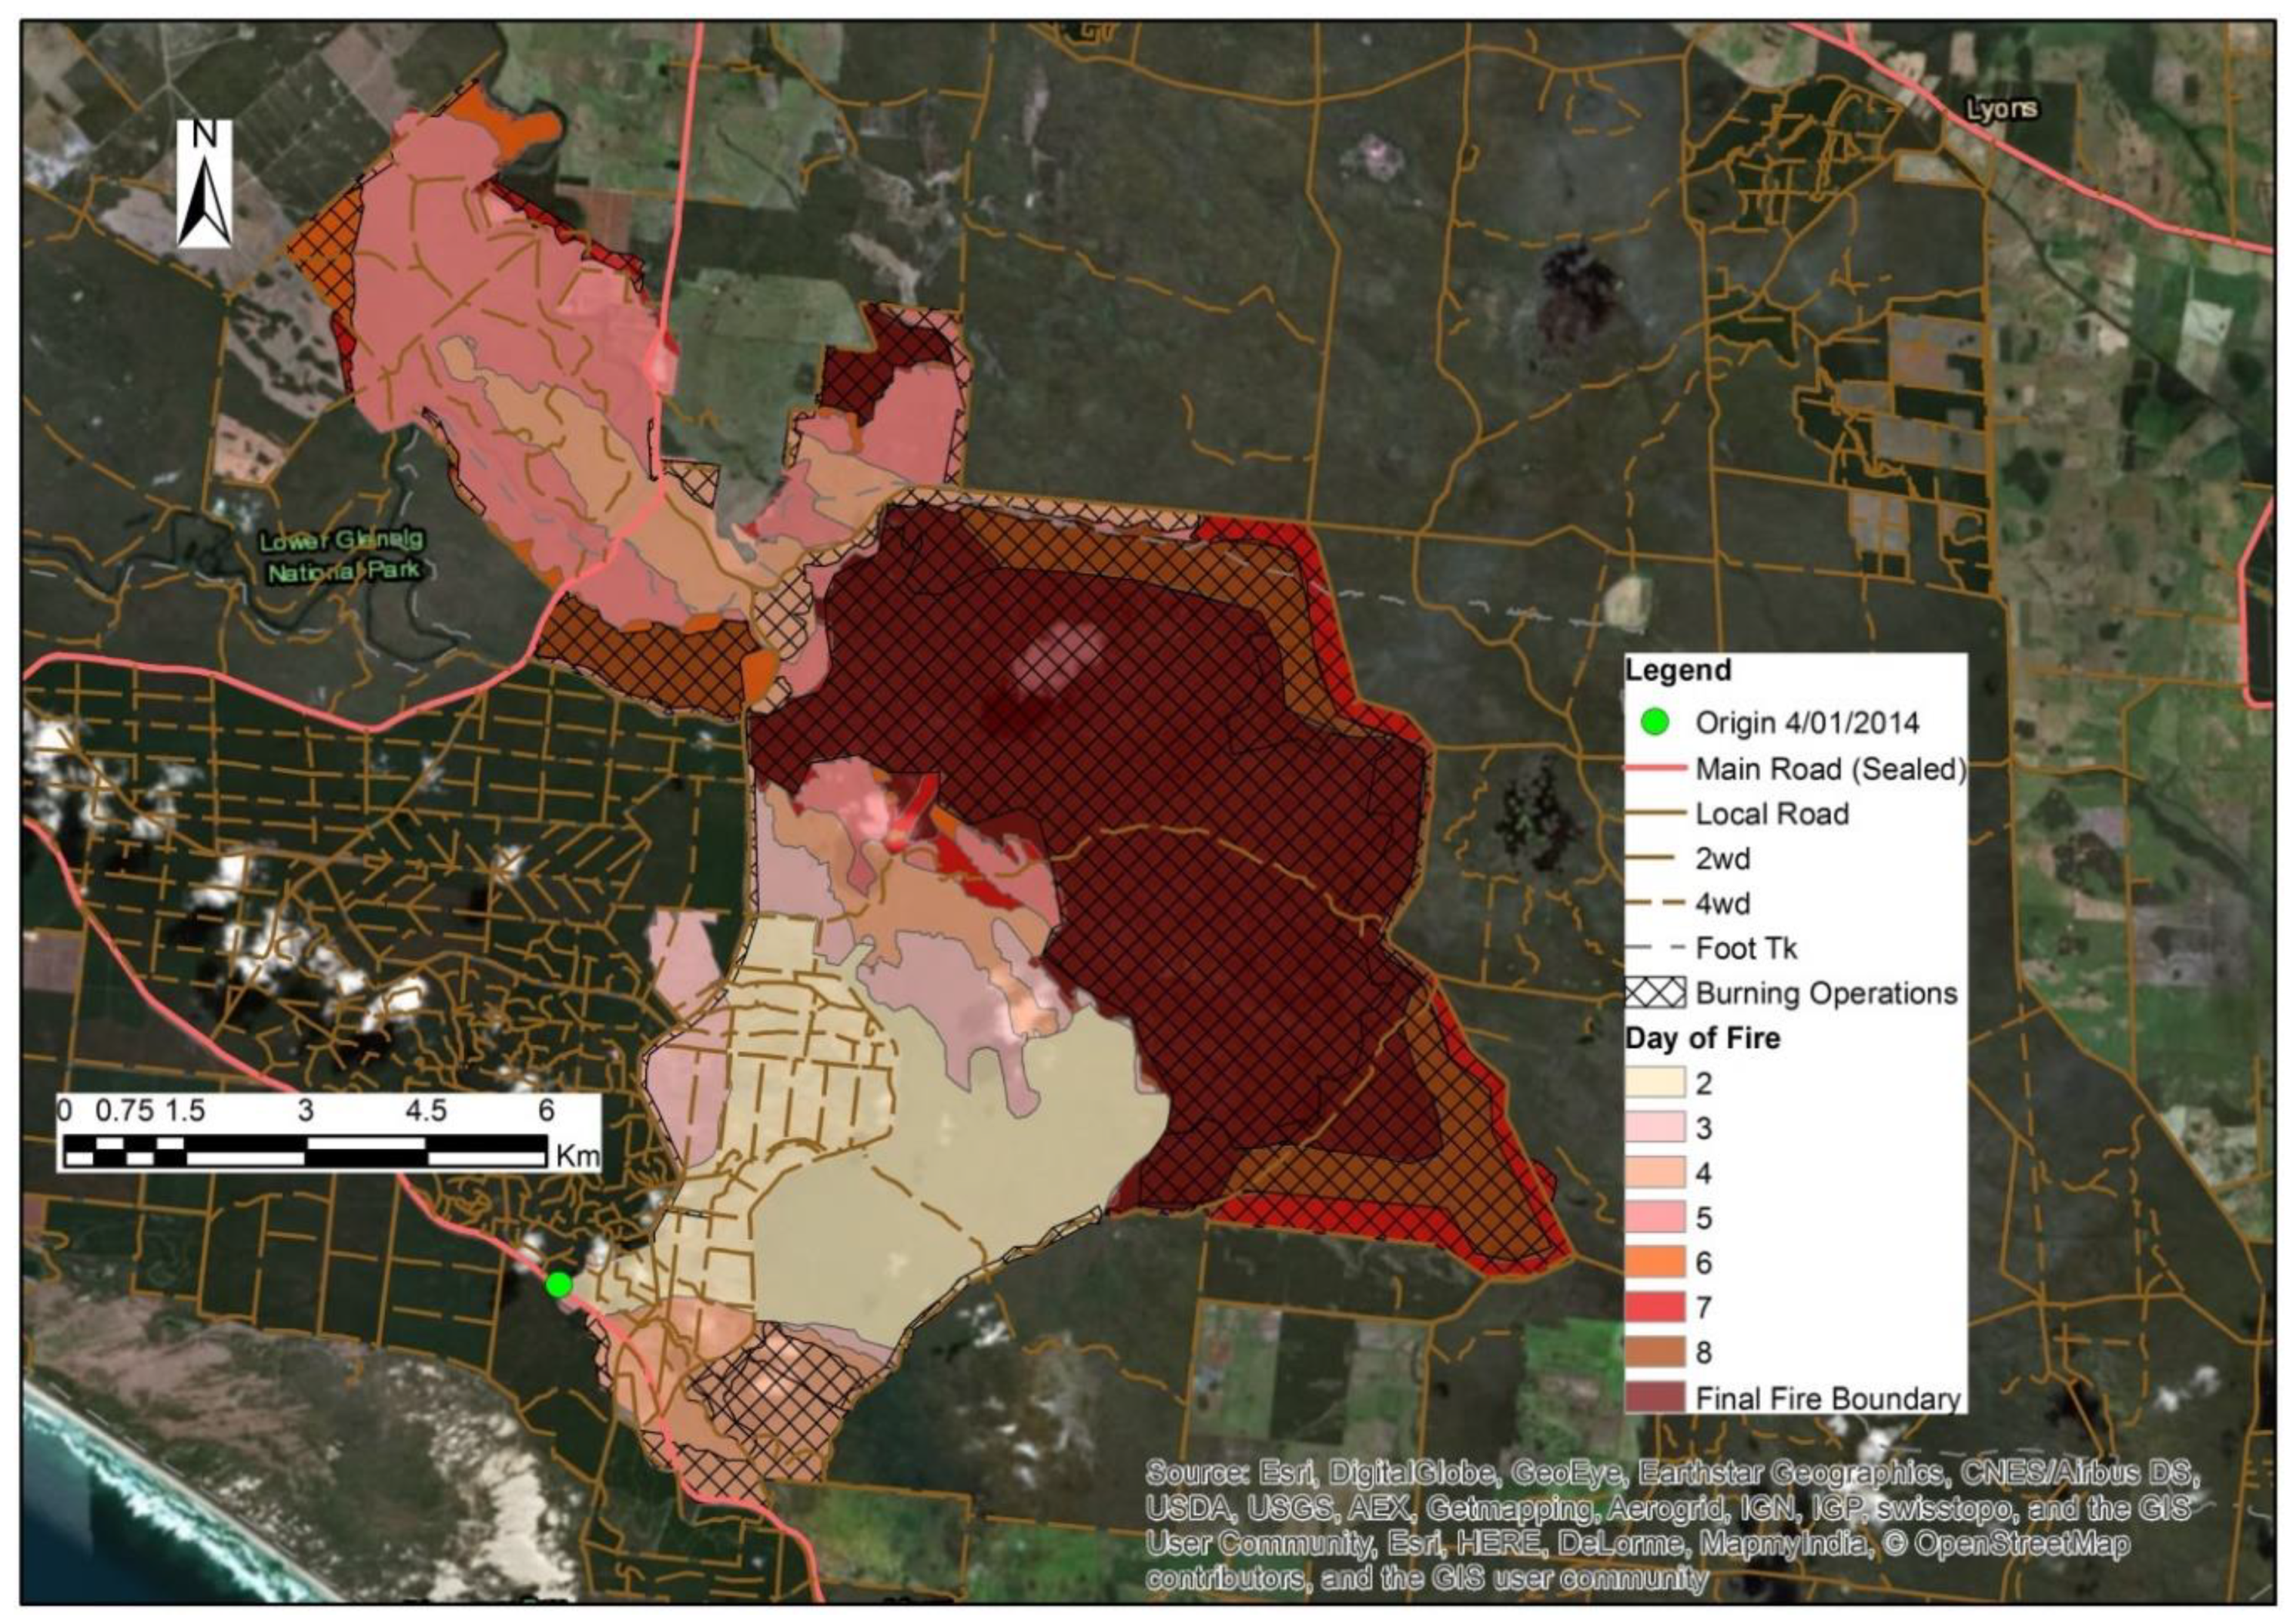
Appendix A.8. Kentbruck

The Kentbruck wildfire (Figure A8) was human-caused and started along the highway on 4 January 2013. Within minutes of the first report (14:36), the fire was estimated at 55 hectares with flames crowning 20 m above the treetops in a pine plantation. The fire grew to 160 hectares, running 1.25 km in 1.5 h in an easterly direction. Within 5 h, the fire was 670 hectares, and it had been spotted over three roads to the east and an unnamed track to the north. By 21:00, aerial suppression ended, and the fire was 1270 hectares, and containment burning operations had begun. Outside the pine plantation, the fire burned in swampy, inaccessible heathland, inducing a containment strategy of aerial suppression and burning operations along existing roads. By estimate, half the final burn area was the direct result of burning operations which occurred over eight days. The burning operations on the third day exceeded the intended burn, which ultimately resulted in an extra ~3000 hectares of fire growth beyond what had originally been intended.
Figure A8. Kentbruck fire progression map.
Forests 10 00884 g0a8

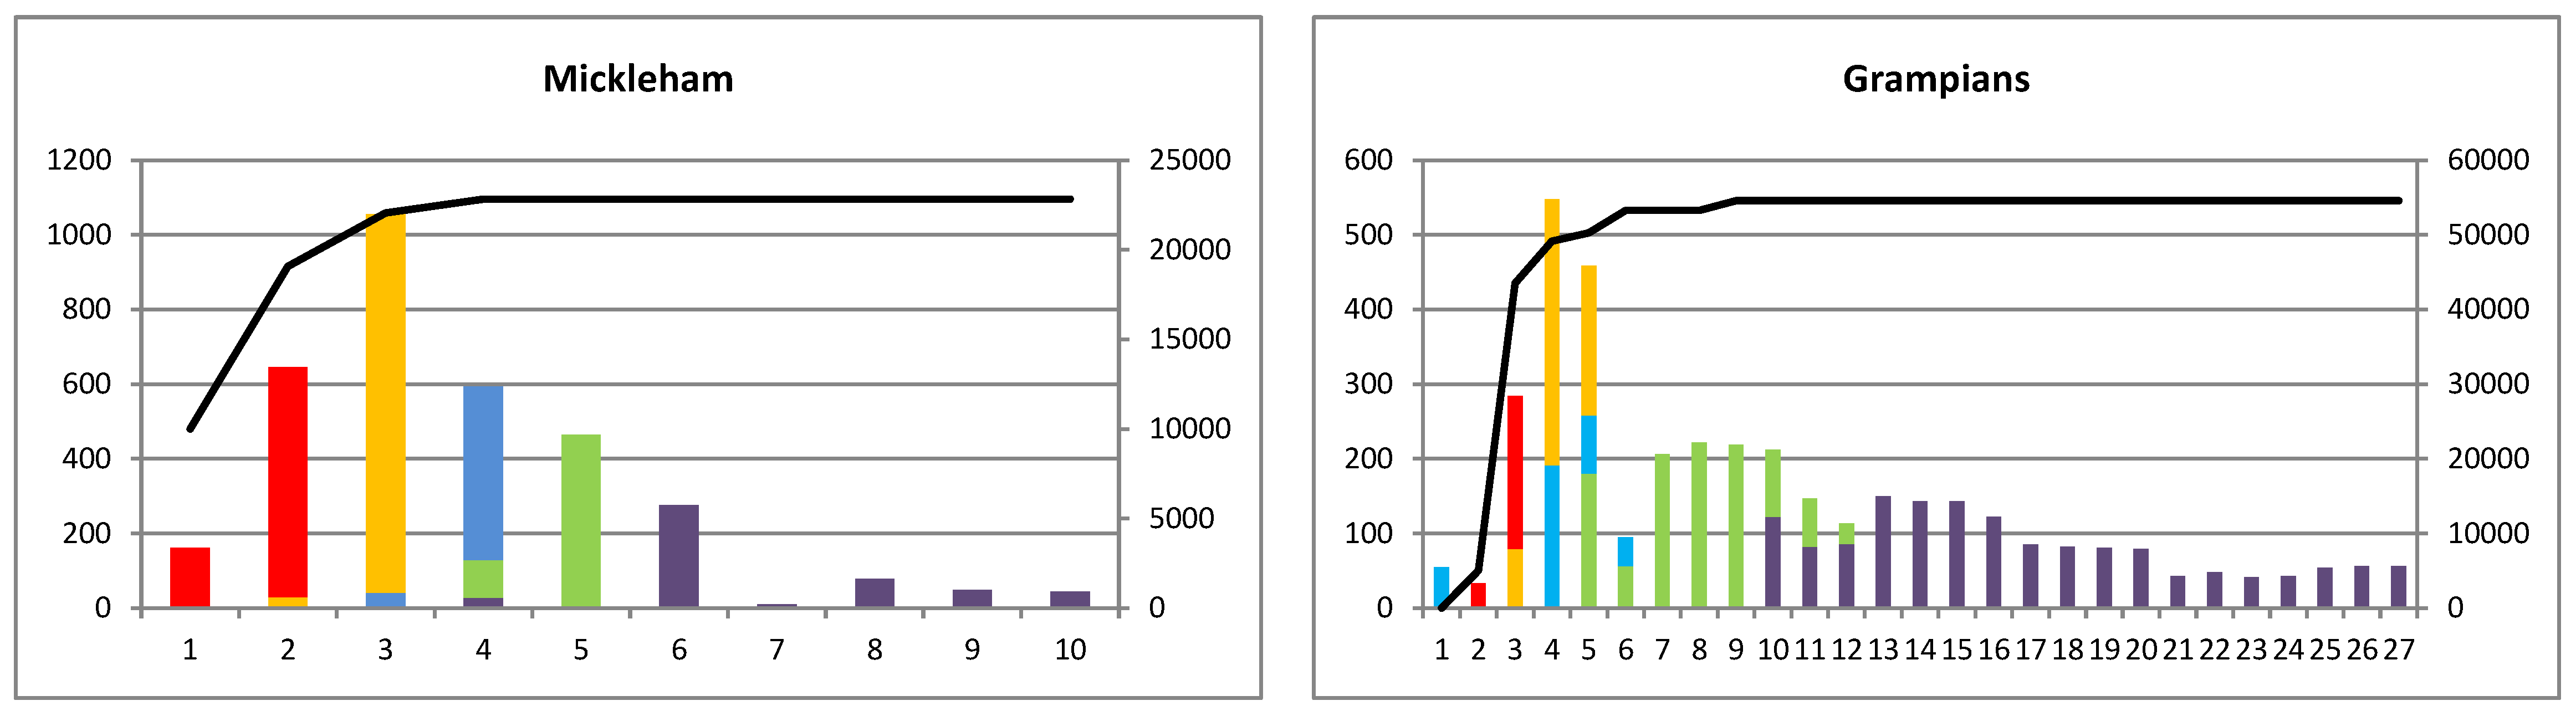
Appendix A.9. Mickleham

This Mickleham wildfire (Figure A9) initially spread in a southwesterly direction and reached ~150 hectares within two hours of the first report (12:46) on the 9 February 2014. A southerly wind change resulted in rapid fire growth to the north, and 3930 hectares were burnt within four hours (15:58). Resources focused on asset protection as this is an interface area close to Melbourne, Victoria. By midnight, the fire was ~10,000 hectares and still burning in a northerly direction. Fire activity abated overnight but spotting was occurring again by noon of the 2nd day when another period of significant growth occurred (8683 hectares), which necessitated defensive firefighting and the evacuation of the Kilmore Township. There were no significant burning operations recorded, and many of the machine control lines were constructed after the fire was contained by wetlines. The initial suppression response was moderated by existence of a second large interface wildfire within 25 km of the point of origin.
Figure A9. Mickleham fire progression map.
Forests 10 00884 g0a9

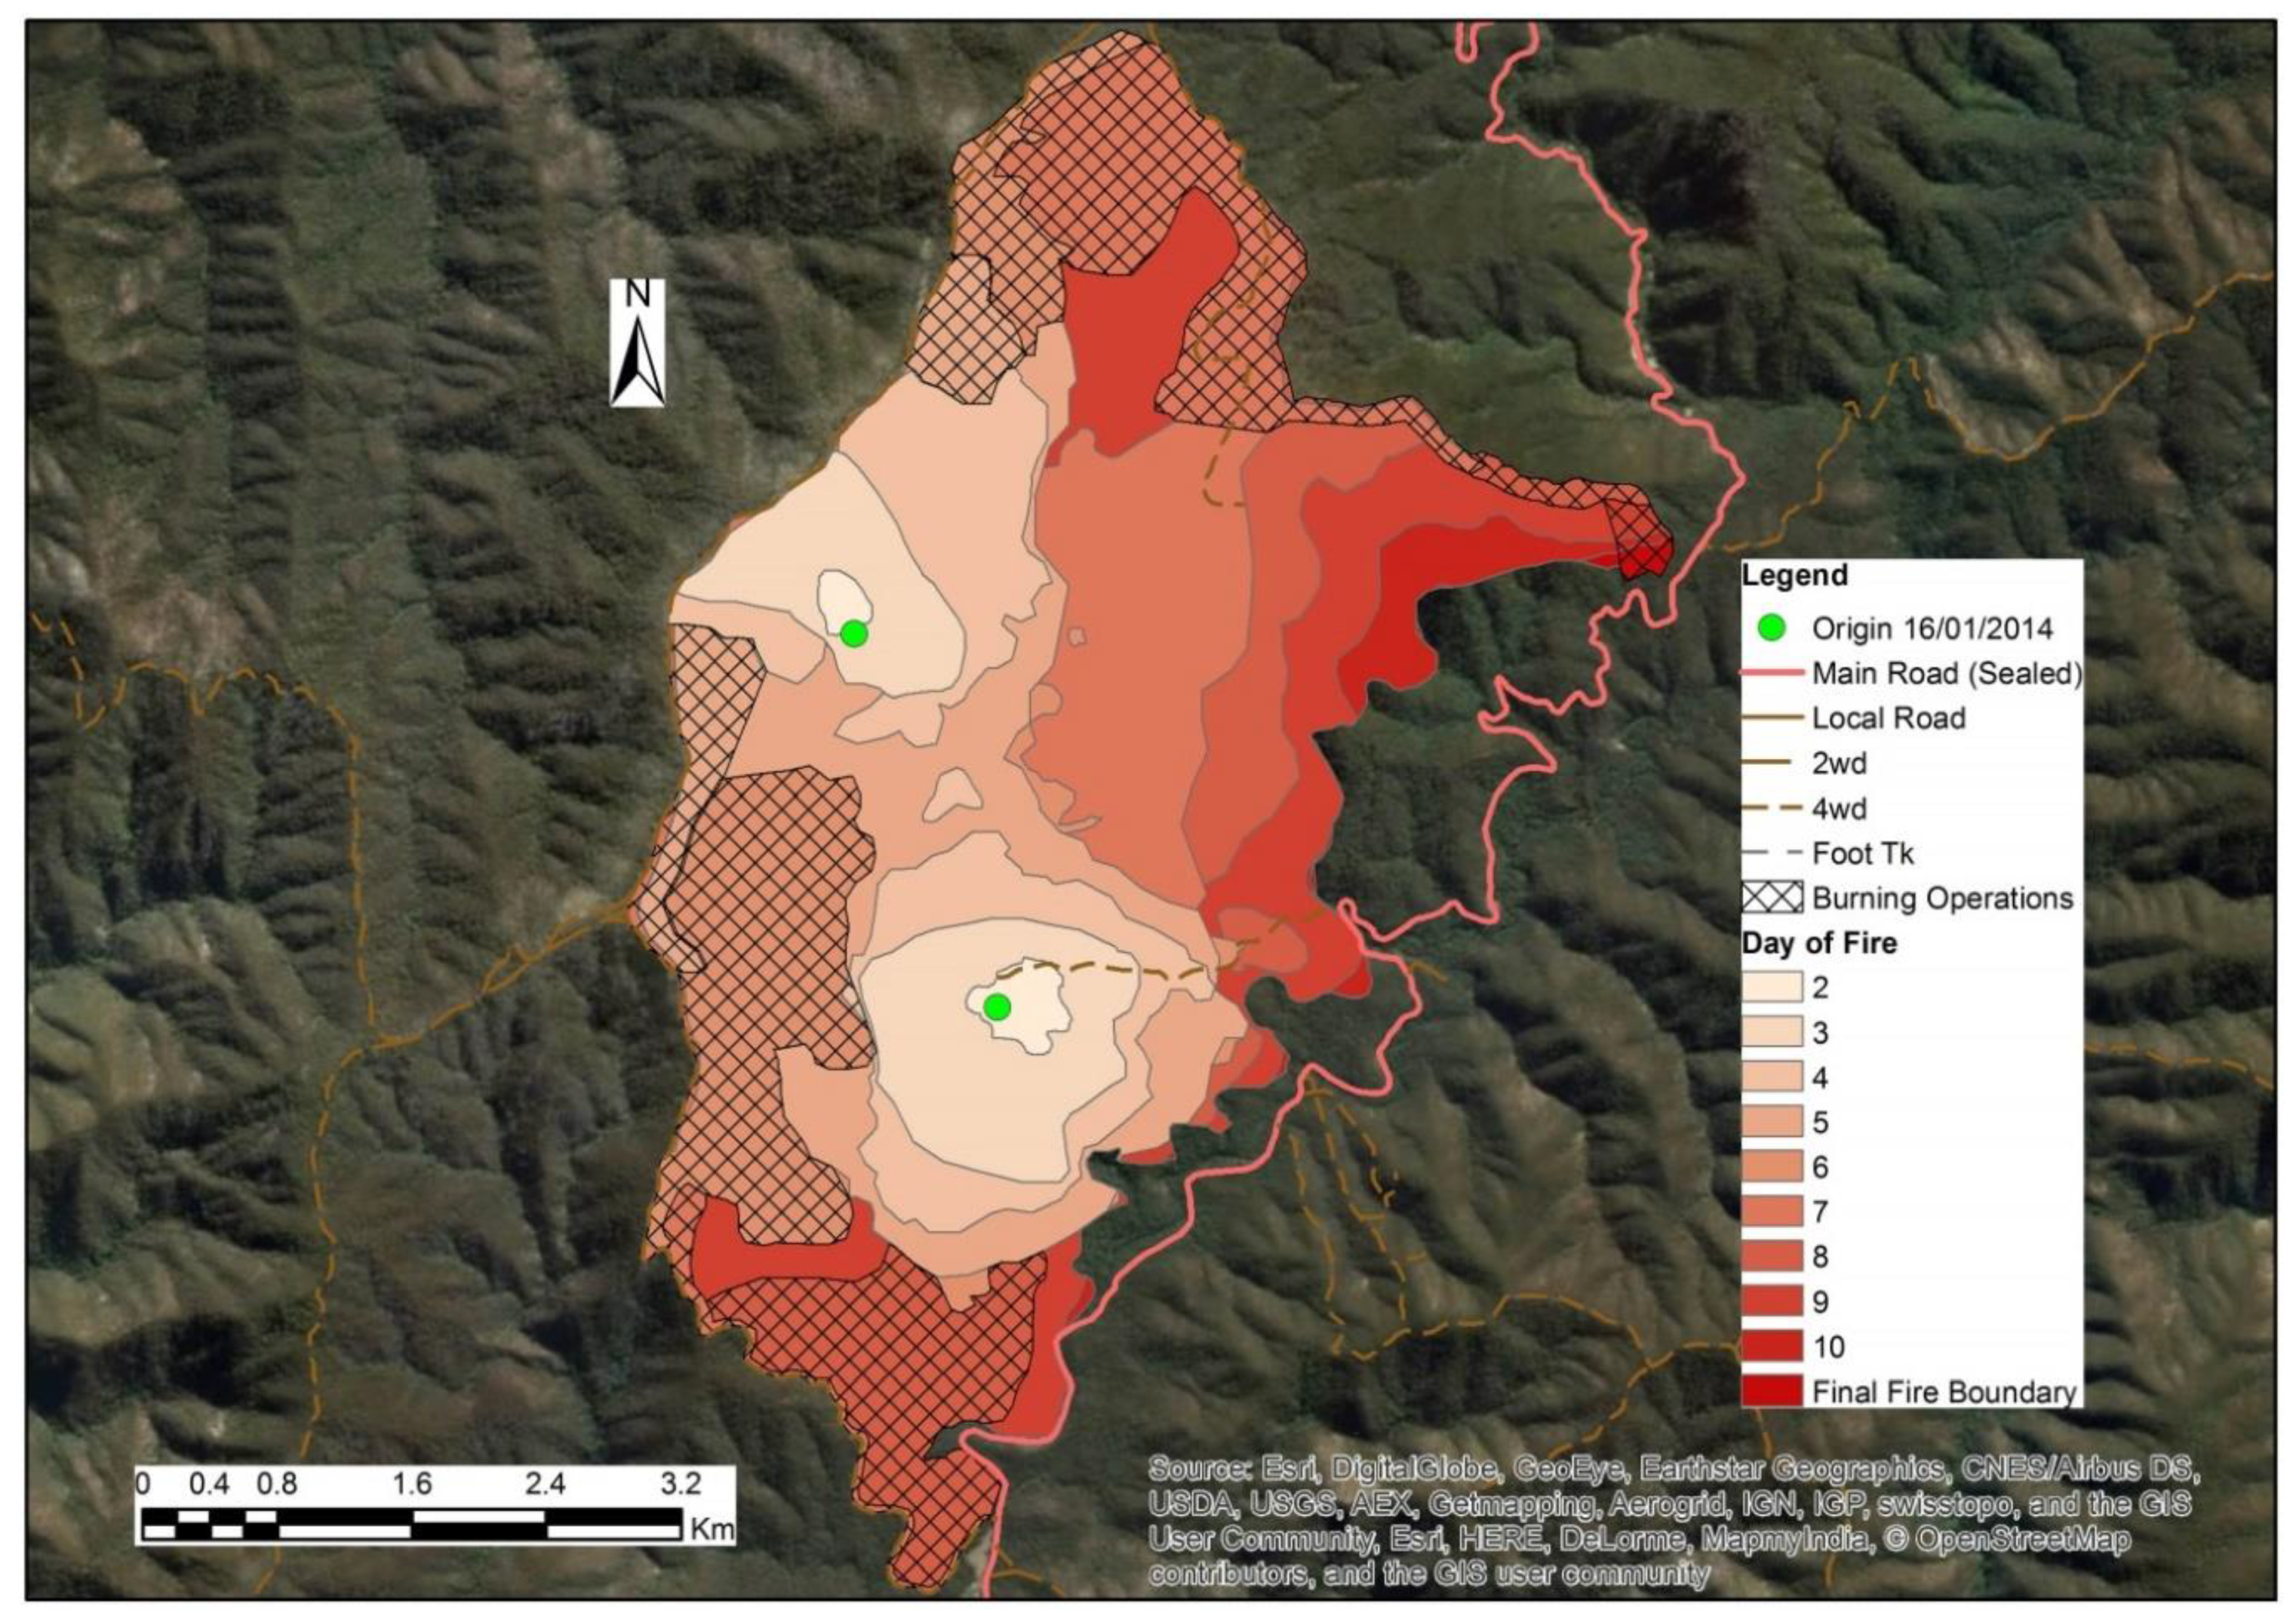
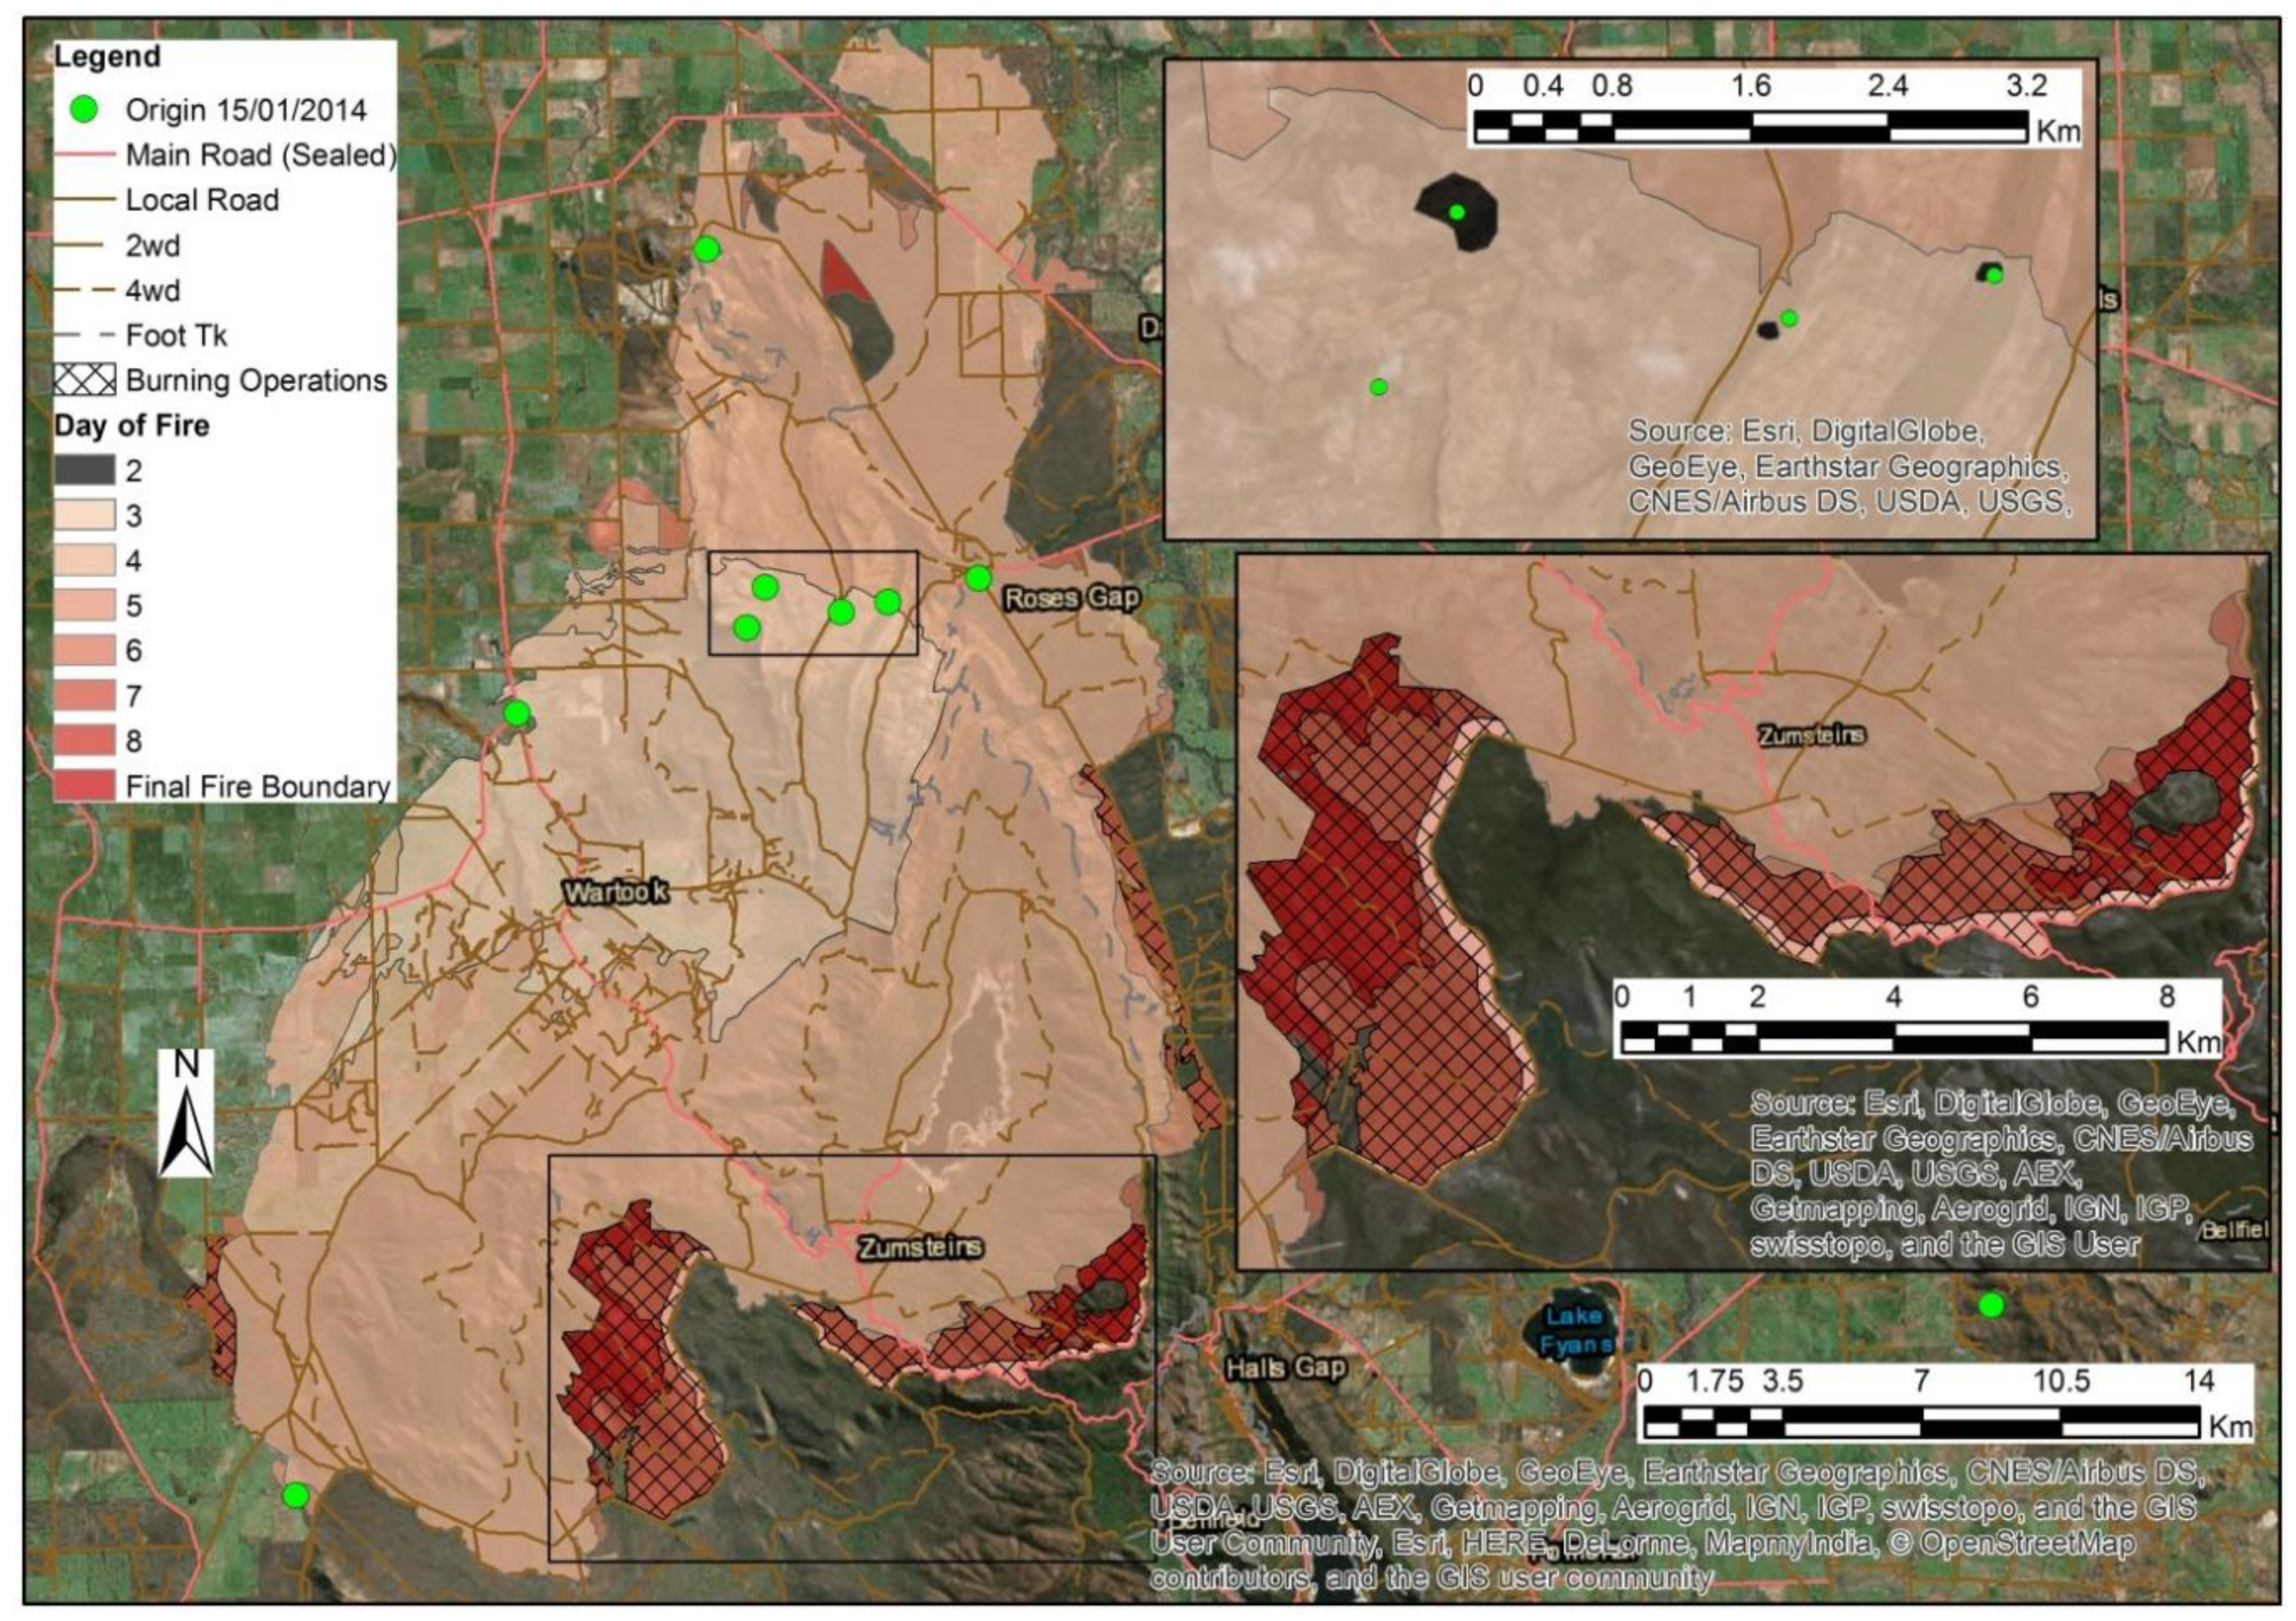
Appendix A.10. Grampians

The first report of seven ignitions in the Grampians wildfire Complex (Figure A10) was at 09:04 on the 15th of January. Four ignitions were contained prior to being overrun by the rapidly growing wildfire that resulted when multiple ignitions that were ~3 km apart joined on 16 January 2014. In the late morning (10:25) of 16 January 2014, there were signs of column interactions between two fires, one of which had grown to 100 hectares. By 14:08, the fires joined, and subsequently (17:37), assets in a southerly direction (Smiths Road) were being impacted, and fire was ~1600 hectares. In the early morning (03:44) of 17 January 2014, the fire was mapped at 11,318 hectares. Growth continued in a southerly direction, and the fire was 36,680 hectares at 18:26. A wind change resulted in the rear of the fire becoming the head, and it burned ~10,000 hectares in a ~14 km run to the north. On the morning (10:15) of the 18th, the fire was 49,153 hectares. Offensive suppression had not been possible unless the fire had reached pastureland. There was a further ~5500 hectares of fire growth due to burning operations that were used to contain the southern half of the fire. Major burning operations extended from the night of the 18 January 2014 to the morning of 20 January 2014 with hand-lighting along the existing roads. Natural in-fill burning from this anthropogenic origin occurred until the evening of the 22nd of January, when the area was burnt with aerial incendiaries.
Figure A10. Grampians fire progression map.
Forests 10 00884 g0a10

Appendix B

Table A1. A detailed description of the 20 suppression tasks that make up Figure 1.
TaskDescription
Slow running fireWhen containment or extinguishment is unlikely, aircraft drop water, foam, or chemical retardant on the head or flanks of a running wildfire to slow the forward rate of spread or decrease the head-fire width.
Retard potential fire behaviourWhile control lines are being established aircraft drop water, foam, or chemical retardant on fuels that are burning inside, often at a distance of a km or more, of the proposed control lines of prevent fire behaviour from building into an organised flame front. Fuel at the drop locations is later burnt either naturally or during burning operations.
Contain spot firesAircraft drop water, foam, or chemical retardant on spot fires to prevent further spread and/or ground resources extinguish the spotfire, establishing control lines if necessary.
Establish control linesExisting barriers (e.g., roads) provide access and a defensible, fuel free space from which the wildfire can be directly suppressed as it approaches or as a location from which burning operations can be initiated. Modification (e.g., brushing vegetation) may be necessary.
Mineral earth control lines are constructed by plant/heavy equipment such as dozers/graders or ground crews either directly adjacent to the burning wildfire impeding spread or in a geographically favourable location from which burning operations can be initiated.
The fire edge is fully extinguished (a wetline) and burnt fuel that will not re-burn forms the control line.
Aircraft drop retardant to reinforce an alternate control line (no standalone retardant lines in case studies).
Knock down flare upsDepending on accessibility, either ground crews or aircraft suppress a flare-up, or a small burst of increased fire behaviour in internal unburnt patches of fuel to prevent embers from causing spot fires.
Burn control linesA fire is ignited progressively along a constructed or existing control line. The anthropogenic fire either spreads to join the wildfire or the intervening unburnt fuel is burnt in another operation.
Burn un-burnt patchesAfter the fuel along the control line has been burnt, either naturally or via anthropogenic means, interior areas of unburnt fuel are ignited under favourable burning conditions.
Aid repair to critical infrastructureLimited resources (e.g., 1–2 ground crews and/or dozer) assist Utilities Crews with the process of repairing critical infrastructure.
Clean upDebris, burnt material, and downed trees are cleared for safety and access.
Rehabilitate control linesConstructed control lines are returned to an environmentally sound state to address erosion or access issues. Repairs to assets such as fences or lawns were included on some wildfires.
Directly defend structuresAircraft drop water, foam, or chemical retardant on the fuels that are burning near structures or other assets.
Ground crews extinguish fuels that are near structures or embers that may ignite structures. Some agencies train and equip firefighters for both wildland and structure fires, and for these agencies structure fires are part of wildland firefighting.
Prepare to defend structuresCrews are deployed to asset locations where wildfire impact is anticipated—though no impact is occurring.
Defensive control lines are constructed, and properties are prepared for possible wildfire impact.
ID contingency control linesDetermine where contingency lines could be established—limited to existing features in defensive stage.
Construct contingency control linesControl lines are constructed, or existing features are improved in advance of potential fire spread so as to provide a defensible space or permit future burning operations should the wildfire spread beyond current containment control lines.
Suppress and mop-up active fireSuppress flaming and smouldering fuels near the wildfire edge or fire perimeter, around assets and along public roadways.
ID and clear hazard treesIdentify and clear hazard trees; hand falling and/or plant/heavy equipment used.
Full perimeter mop-up to depthFull extinguishment of all smouldering material for a full depth (typically 30 m or greater) around the perimeter of the wildfire.
ID hotspots with IRInfrared cameras (handheld or aerial) used to identify hotspots smouldering within the fully extinguished perimeter, GPS locations of hotspots marked and disseminated to ground crews to extinguish.
Mop-up limited hotspotsSmouldering hotspots, limited in number, discovered while patrolling the perimeter or identified by IR technology are fully extinguished.
Look for flare-ups and hotspotsGround crews transit the fire perimeter to seek and supress overlooked hotspots near the fire perimeter or internal flare-ups that throw embers beyond the control lines and create spotfires.

Appendix C

Figure A11 shows the total number of ground-crew classified by stage on each day of the fire for all 10 wildfires considered. Multiple colours in a single day indicate that various sectors reached different stages. Ground crews are used as a proxy for total resource use.
Figure A11. Total ground-crew classified by stage for each day of the fire (see Stonyford graph for axis labels and legend).
Forests 10 00884 g0a11aForests 10 00884 g0a11bForests 10 00884 g0a11c

References

  1. Krawchuk, M.A.; Moritz, M.A.; Parisien, M.-A.; Van Dorn, J.; Hayhoe, K. Global Pyrogeography: The Current and Future Distribution of Wildfire. PLoS ONE 2009, 4, e5102. [Google Scholar] [CrossRef] [PubMed]
  2. Strauss, D.; Bednar, L.; Mees, R. Do One Percent of the Forest Fires Cause Ninety-Nine Percent of the Damage? For. Sci. 1989, 35, 319–328. [Google Scholar]
  3. Stocks, B.J.; Mason, J.A.; Todd, J.B.; Bosch, E.M.; Wotton, B.M.; Amiro, B.D.; Flannigan, M.D.; Hirsch, K.G.; Logan, K.A.; Martell, D.L.; et al. Large forest fires in Canada, 1959–1997. J. Geophys. Res. 2002, 107, 8149. [Google Scholar] [CrossRef]
  4. Donovan, G.H.; Brown, T.C. An Alternative Incentive Structure for Wildfire Management on National Forest Land. For. Sci. 2005, 51, 387–395. [Google Scholar]
  5. Omi, P.N. Forest Fires: A Reference Handbook; ABC-CLIO: Santa Barbara, CA, USA, 2005; ISBN 978-1-85109-438-7. [Google Scholar]
  6. San-Miguel-Ayanz, J.; Moreno, J.M.; Camia, A. Analysis of large fires in European Mediterranean landscapes: Lessons learned and perspectives. For. Ecol. Manag. 2013, 294, 11–22. [Google Scholar] [CrossRef]
  7. Mell, W.E.; Manzello, S.L.; Maranghides, A.; Butry, D.; Rehm, R.G. The wildland–urban interface fire problem – current approaches and research needs. Int. J. Wildland Fire 2010, 19, 238. [Google Scholar] [CrossRef]
  8. Moritz, M.A.; Batllori, E.; Bradstock, R.A.; Gill, A.M.; Handmer, J.; Hessburg, P.F.; Leonard, J.; McCaffrey, S.; Odion, D.C.; Schoennagel, T.; et al. Learning to coexist with wildfire. Nature 2014, 515, 58–66. [Google Scholar] [CrossRef]
  9. Fernandes, P.M. Fire-smart management of forest landscapes in the Mediterranean basin under global change. Landsc. Urban Plan 2013, 110, 175–182. [Google Scholar] [CrossRef] [Green Version]
  10. Thompson, M.P.; Haas, J.R.; Finney, M.A.; Calkin, D.E.; Hand, M.S.; Browne, M.J.; Halek, M.; Short, K.C.; Grenfell, I.C. Development and application of a probabilistic method for wildfire suppression cost modeling. For. Policy Econ. 2015, 50, 249–258. [Google Scholar] [CrossRef]
  11. U.S. Government Accountability Office. Wildland Fire Management: Lack of Clear Goals or a Strategy Hinders Federal Agencies’ Efforts to Contain the Costs of Fighting Fires; United States Government Accountability Office: Washington, DC, USA, 2007. [Google Scholar]
  12. NSW Rural Fire Service. NSW RFS Annual Report 2016-17; NSW Rural Fire Service: New South Wales, Australia, 2017.
  13. Ellis, S.; Kanowski, P.; Whelan, R. National Inquiry on Bushfire Mitigation and Management; Council of Australian Governments: Canberra, Australia, 2004.
  14. Holmes, T.P.; Huggett, R.J.; Westerling, A.L. Statistical Analysis of Large Wildfires. In The Economics of Forest Disturbances; Holmes, T.P., Prestemon, J.P., Abt, K.L., Eds.; Forestry Sciences; Springer: Amsterdam, The Netherlands, 2008; pp. 59–77. ISBN 978-1-4020-4369-7. [Google Scholar]
  15. Finney, M.; Grenfell, I.C.; McHugh, C.W. Modeling Containment of Large Wildfires Using Generalized Linear Mixed-Model Analysis. For. Sci. 2009, 55, 249–255. [Google Scholar]
  16. Katuwal, H.; Dunn, C.; Calkin, D.E. Characterising Resource Use and Potential Inefficiencies during Large-Fire Suppression in the Western US. Int. J. Wildland Fire 2017, 26, 604–614. [Google Scholar] [CrossRef]
  17. Plucinski, M.P. Fighting Flames and Forging Firelines: Wildfire Suppression Effectiveness at the Fire Edge. Curr. For. Rep. 2019, 5, 1–19. [Google Scholar] [CrossRef]
  18. Plucinski, M.P. Contain and Control: Wildfire Suppression Effectiveness at Incidents and Across Landscapes. Curr. For. Rep. 2019, 5, 20–40. [Google Scholar] [CrossRef]
  19. Duff, T.J.; Tolhurst, K.G. Operational wildfire suppression modelling: A review evaluating development, state of the art and future directions. Int. J. Wildland Fire 2015, 24, 735–748. [Google Scholar] [CrossRef]
  20. Katuwal, H.; Calkin, D.E.; Hand, M.S. Production and efficiency of large wildland fire suppression effort: A stochastic frontier analysis. J. Environ. Manag. 2016, 166, 227–236. [Google Scholar] [CrossRef]
  21. Stonesifer, C.S.; Calkin, D.E.; Thompson, M.P.; Stockmann, K.D. Fighting fire in the heat of the day: An analysis of operational and environmental conditions of use for large airtankers in United States fire suppression. Int. J. Wildland Fire 2016, 25, 520–533. [Google Scholar] [CrossRef]
  22. Thompson, M.P.; y Silva, F.R.; Calkin, D.E.; Hand, M.S. A review of challenges to determining and demonstrating efficiency of large fire management. Int. J. Wildland Fire 2017, 26, 562–573. [Google Scholar] [CrossRef] [Green Version]
  23. Hand, M.; Katuwal, H.; Calkin, D.E.; Thompson, M.P. The influence of incident management teams on the deployment of wildfire suppression resources. Int. J. Wildland Fire 2017, 26, 615–629. [Google Scholar] [CrossRef]
  24. Calkin, D.E.; Stonesifer, C.S.; Thompson, M.P.; McHugh, C.W. Large airtanker use and outcomes in suppressing wildland fires in the United States. Int. J. Wildland Fire 2014, 23, 259–271. [Google Scholar] [CrossRef]
  25. Plucinski, M.P.; McCarthy, G.J.; Hollis, J.J.; Gould, J.S. The effect of aerial suppression on the containment time of Australian wildfires estimated by fire management personnel. Int. J. Wildland Fire 2012, 21, 219–229. [Google Scholar] [CrossRef]
  26. Holmes, T.P.; Calkin, D.E. Econometric analysis of fire suppression production functions for large wildland fires. Int. J. Wildland Fire 2013, 22, 246–255. [Google Scholar] [CrossRef] [Green Version]
  27. Bearman, C.; Grunwald, J.A.; Brooks, B.P.; Owen, C. Breakdowns in coordinated decision making at and above the incident management team level: An analysis of three large scale Australian wildfires. Appl. Ergon. 2015, 47, 16–25. [Google Scholar] [CrossRef] [PubMed]
  28. Sandelowski, M. Whatever happened to qualitative description? Res. Nurs. Health 2000, 23, 334–340. [Google Scholar] [CrossRef]
  29. Australasian Fire and Emergency Service Authorities Council. AFAC Bushfire Glossary. Available online: http://www.fireandbiodiversity.org.au/_literature_196883/AFAC_Bushfire_Glossary (accessed on 8 August 2019).
  30. Mees, R.; Strauss, D. Allocating Resources to Large Wildland Fires: A Model with Stochastic Production Rates. For. Sci. 1992, 38, 842–853. [Google Scholar]
  31. BC Wildfire Service Response Types and Stages of Control. Available online: https://www2.gov.bc.ca/gov/content/safety/wildfire-status/about-bcws/wildfire-response/response-terminology (accessed on 9 July 2019).
  32. Tasmania Fire Service Tasmania Fire Service. Available online: http://www.fire.tas.gov.au/Show?pageId=colCurrentBushfires&inverse=false&sort=STATUS&filter=ALL (accessed on 3 July 2019).
  33. New South Wales Rural Fire Service Fires near Me. Available online: https://www.rfs.nsw.gov.au/fire-information/fires-near-me (accessed on 9 July 2019).
  34. Queensland Fire and Emergency Services Current Bushfires. Available online: https://www.ruralfire.qld.gov.au:443/map/Pages/default.aspx (accessed on 3 July 2019).
  35. National Parks and Wildlife Service. Fire Management Manual, 2014th–2015th ed.; Office of Environment and Heritage NSW: Sydney South, Australia, 2014.
  36. Department of Environment, Land, Water and Planning. Bushfire Management Manual: 5. Response; Department of Environment, Land, Water and Planning: Victoria, Australia, 2015.
  37. Canadian Interagency Forest Fire Centre. Canadian Wildland Fire Management Glossary; Canadian Interagency Forest Fire Centre: Winnipeg, MB, Canada, 2017. [Google Scholar]
  38. Morse, J.M.; Mitcham, C. Exploring Qualitatively-Derived Concepts: Inductive—Deductive Pitfalls. Int. J. Qual. Meth. 2002, 1, 28–35. [Google Scholar] [CrossRef]
  39. Hsieh, H.-F.; Shannon, S.E. Three Approaches to Qualitative Content Analysis. Qual. Health Res. 2005, 15, 1277–1288. [Google Scholar] [CrossRef]
  40. Saldaña, J. The Coding Manual for Qualitative Researchers, 2nd ed.; SAGE: Los Angeles, CA, USA, 2013; ISBN 978-1-4462-4736-5. [Google Scholar]
  41. Krippendorff, K. Content Analysis: An Introduction to Its Methodology, 2nd ed.; Sage Publications, Inc.: Thousand Oaks, CA, USA, 2004; ISBN 0-7619-1544-3. [Google Scholar]
  42. Gale, N.K.; Heath, G.; Cameron, E.; Rashid, S.; Redwood, S. Using the framework method for the analysis of qualitative data in multi-disciplinary health research. BMC Med. Res. Methodol. 2013, 13, 117. [Google Scholar] [CrossRef]
  43. Department of Environment, Land, Water, and Planning. Bushfire Management Manual: 4. Response; Department of Environment, Land, Water and Planning: Victoria, Australia, 2016.
  44. DELWP Grampians_Northern_Complex_20140116_1025_SitRep_3 2014 Unpublished internal document.
  45. DELWP Timbarra_GilGroggin_20140208_1604_SitRep_3 2014 Unpublished internal document.
  46. DELWP Mickleham_Kilmore_20140209_1558_SitRep_2 2014 Unpublished internal document.
  47. DELWP Corryong_Kings_Creek_20140121_1808_SitRep_25 2014 Unpublished internal document.
  48. DELWP Corryong_Kings_Creek_20140121_2359_SitRep_26 2014 Unpublished internal document.
  49. DELWP Kentbruck_Portland_Nelson_Rd_20130105_Day_IAP_2 2013 Unpublished internal document.
  50. DELWP Lake_Rowan_Warbys_20141217_Night_IAP_4 2014 Unpublished internal document.
  51. DELWP Morwell_Hernes_Oak_20140210_1415_SitRep_10 2014 Unpublished internal document.
  52. DELWP Corryong_Kings_Creek_20140120_Day_IAP_7 2014 Unpublished internal document.
  53. DELWP Grampians_Northern_Complex_20140119_1439_SitRep_15 2014 Unpublished internal document.
  54. DELWP Kentbruck_Portland_Nelson_Rd_20130107_Day_IAP_6 2013 Unpublished internal document.
  55. DELWP Timbarra_GilGroggin_20140216_1104_SitRep_17 2014 Unpublished internal document.
  56. DELWP Timbarra_GilGroggin_20140211_1351_SitRep_8 2014 Unpublished internal document.
  57. DELWP Timbarra_GilGroggin_20140220_1844_SitRep_27 2014 Unpublished internal document.
  58. DELWP Morwell_Hernes_Oak_20140208_1126_SitRep_2 2014 Unpublished internal document.
  59. DELWP Lake_Rowan_Warbys_20141218_Night_IAP_6 2014 Unpublished internal document.
  60. DELWP Corryong_Kings_Creek_20140122_0559_SitRep_27 2014 Unpublished internal document.
  61. DELWP Timbarra_GilGroggin_20140303_1343_SitRep_45 2014 Unpublished internal document.
  62. DELWP Stonyford_20140205_2254_SitRep_5 2014 Unpublished internal document.
  63. DELWP Kentbruck_Portland_Nelson_Rd_20130110_1814_SitRep_56 2013 Unpublished internal document.
  64. DELWP Powelltown_Learmonth_20140213_Day_IAP_11 2014 Unpublished internal document.
  65. DELWP Grampians_Northern_Complex_20140121_Night_IAP_12 2014 Unpublished internal document.
  66. DELWP Kentbruck_Portland_Nelson_Rd_20130109_Day_IAP_10 2013 Unpublished internal document.
  67. DELWP Mickleham_Kilmore_20140214_Day_IAP_9 2014 Unpublished internal document.
  68. DELWP Hallston_Forresters_20130330_Day_IAP_8 2013 Unpublished internal document.
  69. DELWP Morwell_Hernes_Oak_20140212_1350_SitRep_14 2014 Unpublished internal document.
  70. DELWP Grampians_Northern_Complex_20140120_1331_SitRep_18 2014 Unpublished internal document.
  71. DELWP Mickleham_Kilmore_20140214_1149_SitRep_19 2014 Unpublished internal document.
  72. DELWP Lake_Rowan_Warbys_20141223_1622_SitRep_14 2014 Unpublished internal document.
  73. DELWP Morwell_Hernes_Oak_20140215_1340_SitRep_21 2014 Unpublished internal document.
  74. DELWP Hallston_Forresters_20130408_1034_SitRep_47 2013 Unpublished internal document.
  75. DELWP Stonyford_20140209_1850_SitRep_12 2014 Unpublished internal document.
  76. DELWP Hallston_Forresters_20130404_1837_SitRep_39 2013 Unpublished internal document.
  77. DELWP Grampians_Northern_Complex_20140129_0627_SitRep_41 2014 Unpublished internal document.
  78. DELWP Lake_Rowan_Warbys_20141229_1516_SitRep_16 2014 Unpublished internal document.
  79. Broyles, G. Fireline Production Rates; USDA Forest Service, San Dimas, CA, USA: 2011.
  80. Martell, D.L.; Drysdale, R.J.; Doan, G.E.; Boychuk, D. An Evaluation of Forest Fire Initial Attack Resources. Interfaces 1984, 14, 20–32. [Google Scholar] [CrossRef]
  81. McCarthy, G.J.; Plucinski, M.P.; Gould, J.S. Analysis of the resourcing and containment of multiple remote fires: The Great Divide Complex of fires, Victoria, December 2006. Aust. For. 2012, 75, 54–63. [Google Scholar] [CrossRef]
  82. Haven, L.; Hunter, T.P.; Storey, T.G. Production Rates for Crews Using Hand Tools on Firelines; USDA Forest Service: Berkeley, CA, USA, 1982.
  83. Roxburgh, R.; Rein, G. Study of wildfire in-draft flows for counter fire operations. WIT Trans. Ecol. Environ. 2008, 119, 13–22. [Google Scholar] [Green Version]
  84. Morvan, D.; Meradji, S.; Mell, W. Interaction between head fire and backfire in grasslands. Fire Saf. J. 2013, 58, 195–203. [Google Scholar] [CrossRef]
  85. Morvan, D.; Hoffman, C.; Rego, F.; Mell, W. Numerical simulation of the interaction between two fire fronts in the context of suppression fire operations. In Proceedings of the 8th Symposium on Fire and Forest Meteorology, Kalispell, MT, USA, 13–15 October 2009. [Google Scholar]
  86. Wilson, A.A.G. Width of firebreak that is necessary to stop grass fires: Some field experiments. Can. J. For. Res. 1988, 18, 682–687. [Google Scholar] [CrossRef]
  87. Narayanaraj, G.; Wimberly, M.C. Influences of forest roads on the spatial pattern of wildfire boundaries. Int. J. Wildland Fire 2011, 20, 792–803. [Google Scholar] [CrossRef]
Figure 1. Suppression stages, activities and tasks. Green boxes are stage names and associated key fire behaviour. White boxes are distinct suppression tasks identified by analysing cross-coded broad categories of suppression activities (yellow boxes) with the suppression stages.
Forests 10 00884 g001
Figure 2. The left y axis is the number of ground crew (all fireline personnel except command staff, equipment operators and pilots), classified in sectors by stage, which is used as a proxy for fire resource use. Existing resource measures apply to a limited number of tasks occurring in stages 2 and 3 (a maximum of 45% of resource use).
Forests 10 00884 g002
Table 1. Fire suppression stages vs. existing agency status definitions. A representation of how the proposed fire suppression stages map to existing agency definitions of fire status across jurisdictions.
AgencyStatus
This Study1—Defensive2—Offensive3—Containment4—Mop-Up5—Patrol and Rehab
DELWP 1GoingContainedUnder Control 1Under Control 2
NSW RFS 2Out of ControlBeing ControlledUnder Control
QLD RFS 3GoingContainedPatrol
NSW Parks 4GoingBeing ContainedContainedPatrol
CIFFC 5Out of ControlBeing HeldUnder Control
1 Department of Environment, Land, Water and Planning, Victoria, Australia [36]; 2 Rural Fire Service, New South Wales, Australia [33]; 3 Rural Fire Service, Queensland, Australia [34]; 4 National Parks, New South Wales, Australia [35]; 5 Canadian Interagency Forest Fire Centre, Canada [37].
Table 2. Fire suppression. Selected wildfires: name, size and number of associated documents.
Fire NameSize (ha)#SitReps#Day IAP#Night IAPTotal DocumentsDays to Containment *Primary Fuel Type
Stonyford5931643231Grassland
Hallston62957163764Native eucalypt forest
Powelltown67434854717Native eucalypt forest
Corryong2617531497611Native eucalypt forest
Morwell294531146516Scrub, grassland
Timbarra30965327129225Native eucalypt forest
Lake Rowan57101853263Grassland
Kentbruck12,00695781107Pinus plantation, heath
Mickleham22,8322754365Grassland
Grampians54,6169527111406Native forest
* Number of calendar days until the Department of Environment, Land, Water and Planning (DELWP) status for the whole fire is ‘Contained’ (the fire spread is halted).
Table 3. Illustrative excerpts of unsuccessful, unattempted, and defensive suppression.
ActivityExcerpt from SitRep or IAPSource Fire
Unsuccessful“The fire is burning in a South Westerly direction and has spotted over a ridge at XE 240064.4 helitak are working (including the Air Crane) on the running edge but having a limited influence at this stage [44] (p. 2).”Grampians
Unattempted“Fire is in very steep, remote and inaccessible country. Nearest vehicle tracks not suitable for float of machinery. Direct attack with hand crews not possible with current FDI/fire behaviour [45] (p. 2).”Timbarra
Defensive Suppression“Crews focusing on asset protection with the assistance of air support. Air support being used to slow the spread of head fire and spread of eastern flank [46] (p. 2).”Mickleham
Table 4. Illustrative excerpts of the range of offensive suppression tasks and fire behaviour.
ActivityExcerpt from SitRep or IAPSource Fire
Retard Fire Behaviour“Significant air-attack support is available today to prevent the fire developing a head [49] (p. 2).”Kentbruck
Contain Spot Fires“There have been spotovers during the day which have been addressed utilising aircraft and direct attack [50] (p. 2).”Lake Rowan
Mop Up and Control Lines“Crews to continue to black out hotspots in forest and running edge in the grass lands, Plant being used to cut breaks in grasslands [51] (p. 2).”Morwell
Contingency Lines“Prepare fallback lines as identified on operations overview map. Pheasent Creek Tk-Commins D6 (Swifts Ck) working days brushing up from Buenba Rd. Dart Tk-Potocnik D6 and McInnes Exc & float [52] (p. 9).”Corryong
Burning“Burning off along Mt Difficult Rd has reached Mt Victory Rd (8 km ignited). Burning out has also commenced along the Mt Zero Rd, north of Heatherlie (0.5 km ignited). Burning out will continue throughout today and tonight [53] (p. 2).”Grampians
ID and Clear Hazard Trees“Excavator to work on hazardous trees on Donavan Creek Sector Priority 1: EV685449 to EV689443 Priority 2: EV687438 to EV697433 [52] (p. 9).”Corryong
Prepare to Defend Structures“To patrol area and undertake asset protection when required across the Drik Drik Division and Dartmoor area. Intelligence gathering and familiarisation of assets and access in area between Wanwin Rd and Munbannar-Wanwin Rd. [54] (p. 9).”Kentbruck
Fire BehaviourExcerpt from SitRep or IAPSource Fire
Limited“Fire Activity quiet over all sectors, very quiet over northern parts due to rain [55] (pp. 1–2).”Timbarra
Moderate“Crew walked into fire, active edge on fire—burning in rocky terrain in areas with no rocks flame heights are approximately 1 m [56] (p. 2).”Timbarra
Aggressive“The 3 smaller spot overs on the on the eastern side are contained using Dozer, hand crews and water bombing. The larger breakout on the eastern side is still not contained. Fire on the western side continued to run today towards 2013 fuel reduction burn. Was slowed by aerial retardant drops [57] (p. 1).”Timbarra
Table 5. Illustrative excerpts of the progress of control line and burning operations.
ActivityExcerpt from SitRep or IAPSource Fire
Control Line Progress“2 sections of approx. 1 km each are untracked in forested areas. 2nd Dozer Is on-route to assist with this [58] (p. 2).”Morwell
Control Line Completion“Control lines established today with dozer in Boweya Forest Block and Orchard Tk sections and held throughout day [59] (p. 2).”Lake Rowan
Burning Progress“Kings Creek Tk Sector back burn has continued and progressed well overnight. 250 m of edge remains to the Gibbo River (Benambra Corryong Rd) at 0545 this may be completed by shift changeover [60] (p. 2).”Corryong
“Crews have started to burn the last 150 m of unburnt edge, reports from yesterday’s burn are that it has gone in approx. 200 m [61] (p. 1).”Timbarra
Control Line vs. Burning Operations“Dozer line complete on Southern sector between Scoullers Road and Ansons Road at 22:30. Fire is completely tracked. […] Burning out commenced between dozer line and fire edge near Scoullers Road [62] (p. 2).”Stonyford
Interior vs. Perimeter Burning“Strengthening of edges has been successful during the day. Combination of ADT and hand lighting has increased depth to 100 m plus in most sectors within the Cobboboonee Division. Burning out within fire area will continue for several days [63] (p. 2).”Kentbruck
Table 6. Illustrative excerpts of suppression activities during the mop-up stage.
ActivityExcerpt from SitRep or IAPSource Fire
Mop-up Depth“Patrol and blackout to a good 30 m depth on all control lines [64] (p. 3).”Powelltown
“Patrol and black to a depth of 60 m. (Forcast extreme conditions next Tuesday) [65] (p. 8).”Grampians
Burning“Burn out unburnt fuel north of Hurdle Flat Rd between Glenelg National Park and the Kentbruck forest to ensure no break out to the south when fire comes under the influence of northerly winds on Thursday or Friday [66] (p. 5).”Kentbruck
Rehabilitation“Prepare and implement rehabilitation plans for all Sectors [67] (p. 6).”Mickleham
Clean-Up“Remove debris from private property (north of Forresters Rd) [68] (p. 5).”Hallston
Hazard Trees“Excavator on line to assist in tree removal to allow roads to be opened [69] (p. 2).”Morwell
“A limitation in the number of skilled tree assessors and fallers is slowing the opening of some roads [70] (p. 2).”Grampians
Limited Hotspots“Crew attended to one flare up this morning and was able to contain internal fire spread. FLIR is arranged for this morning to identify any additional hotspots [71] (p. 2).”Mickleham
Table 7. Illustrative excerpts of suppression and fire behaviour in the patrol stage.
ActivityExcerpt from SitRep or IAPSource Fire
Patrol“Only a minor number of hotspots found well within containment lines. All edges secured. CONTROL STRATEGY Patrol [72] (p. 2).”Lake Rowan
FLIR Identified Hotspots“FLIR run undertaken yesterday. Crews deployed to black out hot spots. FLIR run arranged for Monday. Air recon this morning over the fire picked up only a few smokers [73] (p. 2).”Morwell
Rehabilitation“Old fence line clearing almost complete. 50% of fencing repairs complete. 10% of fencing replacement complete. Rehabilitation of control lines underway [74] (p. 2).”Hallston
Demobilisation“Significant progress has been made in the last few days. The complete perimeter of the fire is secured, no breakaway is expected. Formal transfer of control to CFA District 6 will take place at 1900 hrs. IMT will stand down at 1930 hrs after debrief [75] (p. 2).”Stonyford
Fire BehaviourExcerpt from SitRep or IAPSource Fire
Characteristic Fire Behaviour“Mild, stable conditions continue today. No active fire reported, some hotspots still visible [76] (p. 2).”Hallston
Specific Area of Concern“At 0354 h a hotspot was discovered at Grid Reference 288,177 in the East Sector which has been identified as requiring suppression efforts from a Tanker during the oncoming dayshift [77] (p. 2).”Grampians
Internal Fire Behaviour“Strong westerly winds (50–65 km/h) are reigniting hot spots within the fire perimeter. Continue black out and patrolling of eastern flanks of the fire. Some running edge within fire perimeter, burning unburnt fuel well within fire boundary [78] (pp. 1–2).”Lake Rowan

