Article

Mapping the Spatial Distribution of Tea Plantations Using High-Spatiotemporal-Resolution Imagery in Northern Zhejiang, China

1
Collaborative Innovation Center of Sustainable Forestry in Southern China of Jiangsu Province, Nanjing Forestry University, Nanjing 210037, Jiangsu, China
2
College of Biology and the Environment, Nanjing Forestry University, Nanjing 210037, Jiangsu, China
3
School of Computer Science and Engineering, Nanjing University of Science and Technology, Nanjing 210094, Jiangsu, China
4
State Key Laboratory of Subtropical Silviculture, School of Environmental & Resource Sciences, Zhejiang A&F University, Hangzhou 311300, Zhejiang, China
5
Key Laboratory of Carbon Cycling in Forest Ecosystems and Carbon Sequestration of Zhejiang Province, Zhejiang A&F University, Hangzhou 311300, Zhejiang, China
6
School of Environmental & Resource Sciences, Zhejiang A&F University, Hangzhou 311300, Zhejiang, China
*
Authors to whom correspondence should be addressed.
Forests 2019, 10(10), 856; https://doi.org/10.3390/f10100856
Submission received: 31 July 2019 / Revised: 10 September 2019 / Accepted: 17 September 2019 / Published: 1 October 2019
(This article belongs to the Special Issue Forest Resources Assessments: Mensuration, Inventory and Planning)

Abstract

:
Tea plantations are widely distributed in the southern provinces of China and have expanded rapidly in recent years due to their high economic value. This expansion has caused ecological problems such as soil erosion, and it is therefore urgent to clarify the spatial distribution and area of tea plantations. In this study, we developed a simple method to accurately map tea plantations based on their unique phenological characteristics observed from VENμS high-spatiotemporal-resolution multispectral imagery. The normalized difference vegetation index (NDVI) and red—green ratio index (RGRI) of time series were calculated using 40 VENμS images taken in 2018 to evaluate the phenology of tea plantations. The unique phenological period of tea plantations in northern Zhejiang is from April to May, with obvious deep pruning, which is very different from the phenological period of other vegetation. During this period, the RGRI values of tea plantations were much higher than those of other vegetation such as broadleaf forest and bamboo forest. Therefore, it is possible to identify tea plantations from the vegetation in images acquired during their phenological period. This method was applied to tea plantation mapping in northern Zhejiang. The NDVI value of the winter image was used to extract a vegetation coverage map, and spatial intersection analysis combined with maps of tea plantation phenological information was performed to obtain a tea plantation distribution map. The resulting tea plantation map had a high accuracy, with a 94% producer accuracy and 95.9% user accuracy. The method was also applied to Sentinel-2 images at the regional scale, and the obtained tea plantation distribution map had an accuracy of 88.7%, indicating the good applicability of the method.

1. Introduction

Tea is one of the most popular drinks in the world, and China, as the origin of tea, is not only the largest tea consumer but also the largest tea producer in the world [1]. According to data from the Food and Agriculture Organization (FAO) of the United Nations [2], the total tea production in China in 2017 was 2,743,443 tons, accounting for 40.54% of the world’s total tea production. As the most economically valuable agricultural product in China, tea is mainly grown in the red soil hilly areas of the southern provinces, such as Zhejiang and Anhui [3]. As the price of tea rose, the enthusiasm of tea farmers became high, and large areas of mountain land were developed into tea plantations [4,5]. In 2017, China’s tea plantations accounted for 54.57% of the total area of tea plantations in the world, reaching 2,242,261 hectares, an increase of 253% compared to the area in 1997. The large-scale expansion of tea plantations promotes local economic development but triggers a series of ecological and environmental problems [3]. In the process of developing mountainous areas into tea plantations, forests and shrubs are destroyed, resulting in reduced landscape connectivity, habitat fragmentation, soil erosion, and ecosystem service loss [5]. These environmental problems in turn restrict the economic benefits of tea plantations. Therefore, for the sustainable development of tea plantations, it is urgent to clarify their areas and spatial distributions.
Due to the wide distribution of and rapid increase in tea plantations, substantial amounts of labor and time are required to obtain an accurate spatial distribution via field investigation. Remote sensing technology is currently an effective means of obtaining information on the Earth’s surface, which can greatly reduce the consumption of labor, material resources, and time and can also be performed periodically. Some studies have used different remote sensing data to identify tea plantations. Mustafa Dihkan [6] used a support vector machine method to extract tea plantations from high-resolution multispectral digital aerial images with high precision. Chu [4] extracted tea plantations based on hyperspectral and LiDAR data fusion with an accuracy of 91%. Huang [7] proposed a framework that can be used to map tea plantations using BOVW (bag of visual words), sLDA (supervised latent Dirichlet allocation), and UCNN (unsupervised convolutional neural network) models and Worldview high-resolution images. Xu [5] combined Phased Array type L-band Synthetic Aperture Radar (PALSAR) and Landsat data to map the expansion of tea plantations in Yunnan Province, China. Although different data sources and methods were used to extract tea plantations with high accuracy, these studies often focused on small areas, limiting the transferability of the methods. The phenology of vegetation has proven to be an effective parameter for distinguishing vegetation in time series of remote sensing data because each type of vegetation has its own phenological change characteristics (for example, deciduous forests have defoliation in winter, when crops would be harvested). These unique characteristics could increase the separation between vegetation and the background. However, few studies have involved detailed research on the phenology of tea plantations, and tea plantations have not been extracted based on their phenological information.
In the past few decades, scholars have used remote sensing technology to conduct much research on the phenology of forests, especially individual tree species and plantations [8,9,10]. Dong [8] found that tropical rubber plantations can be delineated from natural evergreen forests during the foliation period (late March–April) and defoliation period (late February–March). Xi [10] extracted deciduous broadleaf forest using Landsat images in July and December and then extracted the distribution of hickory plantations and detected their drought-induced disturbance. Many studies have extracted vegetation based on its phenological characteristics, and more researchers are using multitemporal images and time series images to extract plantations [11,12]. Similar to rubber or hickory plantations, tea plantations have their own unique phenology. However, due to the small area of tea plantations, which is less than 1% of the global forest area, and their scarcity and irregular distribution, there is little research on the phenology of tea plantations [13].
Time series remote sensing images such as those of Moderate-resolution Imaging Spectroradiometer (MODIS) and Landsat are commonly used to analyze the phenological characteristics of forests or plantations [14,15,16]. Because tea plantations exist as small patches, it is impossible to analyze their phenology using MODIS images (250-m spatial resolution and 1-day revisit period). Landsat images, with a 30-m spatial resolution and a 16-day revisit period, are the most widely used multispectral data [17,18]. However, tea plantations are mainly distributed in tropical and subtropical regions, and it is difficult to collect enough cloud-free images due to weather conditions. In recent years, remote sensing technology has developed rapidly, and satellites with high spatial and temporal resolution, such as Sentinel and VENμS, have gradually launched [19]. These satellites have a shorter revisit period and provide more images for vegetation monitoring, providing the possibility to analyze the phenology of tea plantations.
Therefore, this study used VENμS time series multispectral images (5-m spatial resolution, 2-day revisit period) to identify tea plantations in northwestern Zhejiang, China. The objectives of this study were (1) to analyze the phenology of tea plantations based on high-spatiotemporal-resolution images and determine their phenological period, (2) to extract tea plantations from forests based on phenological information, and (3) to explore the applicability of the method and analyze its uncertainty. This study provides a simple and practical method for tea plantation mapping and monitoring.

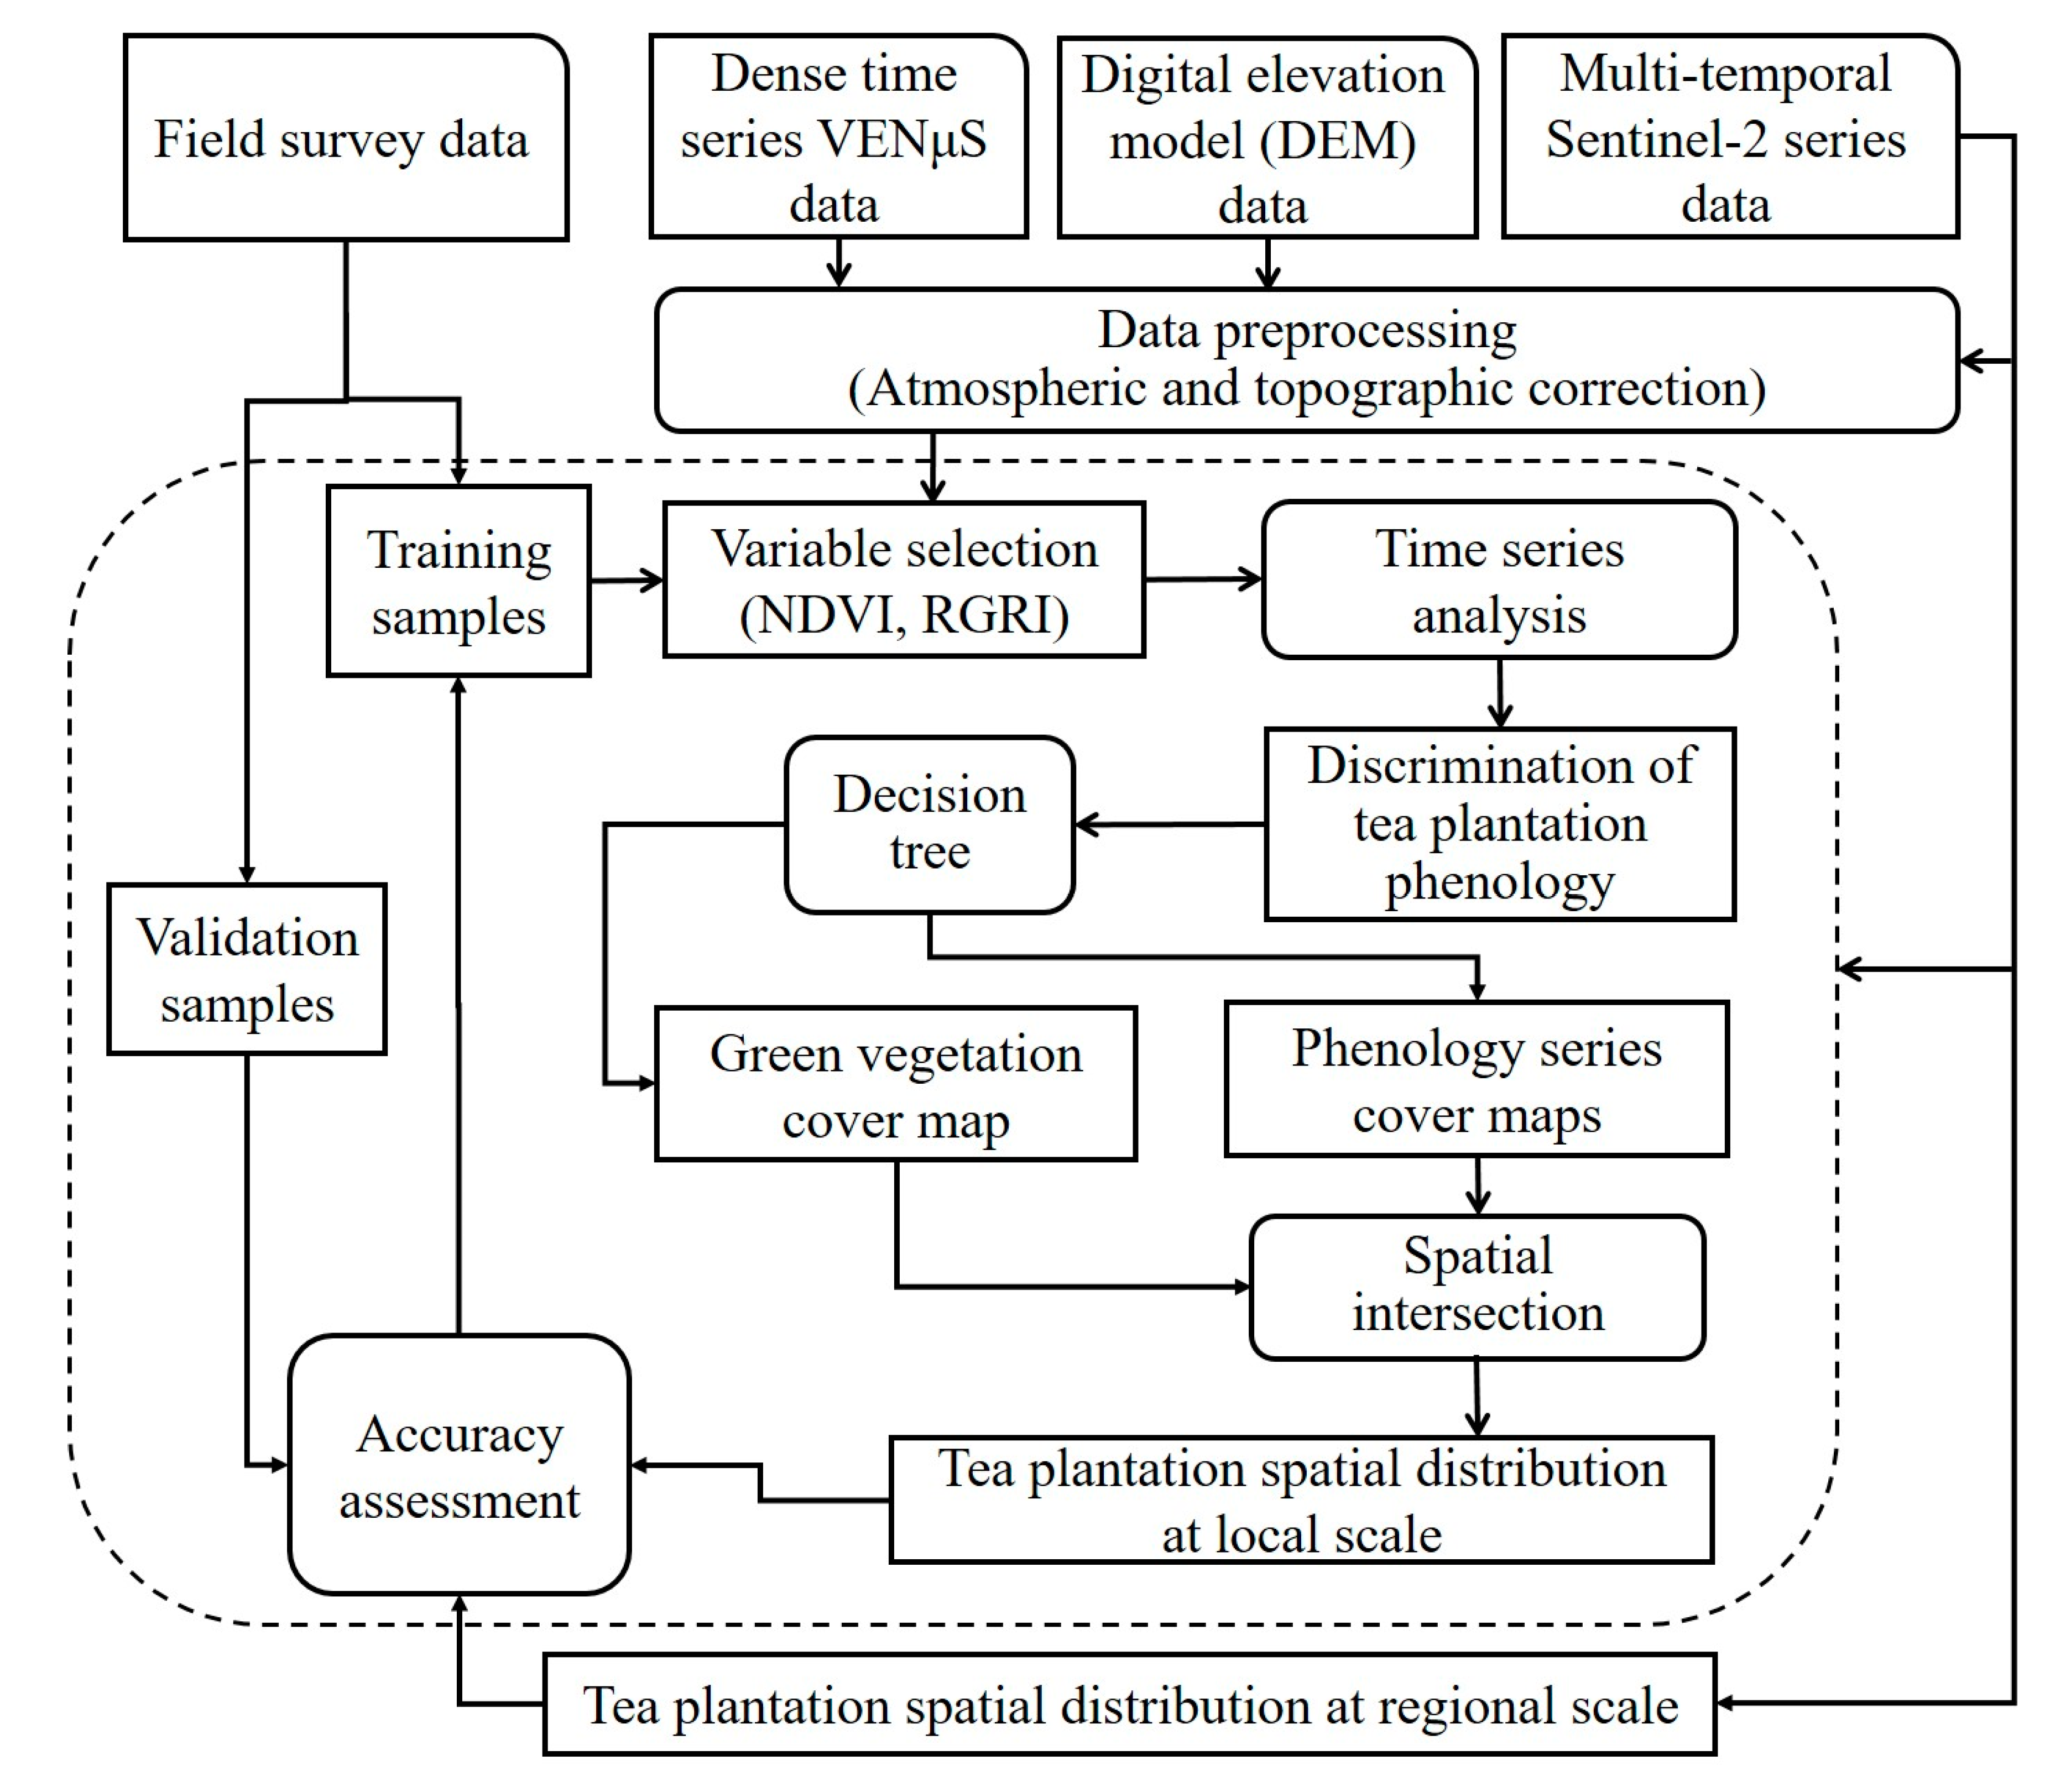
2. Materials and Methods
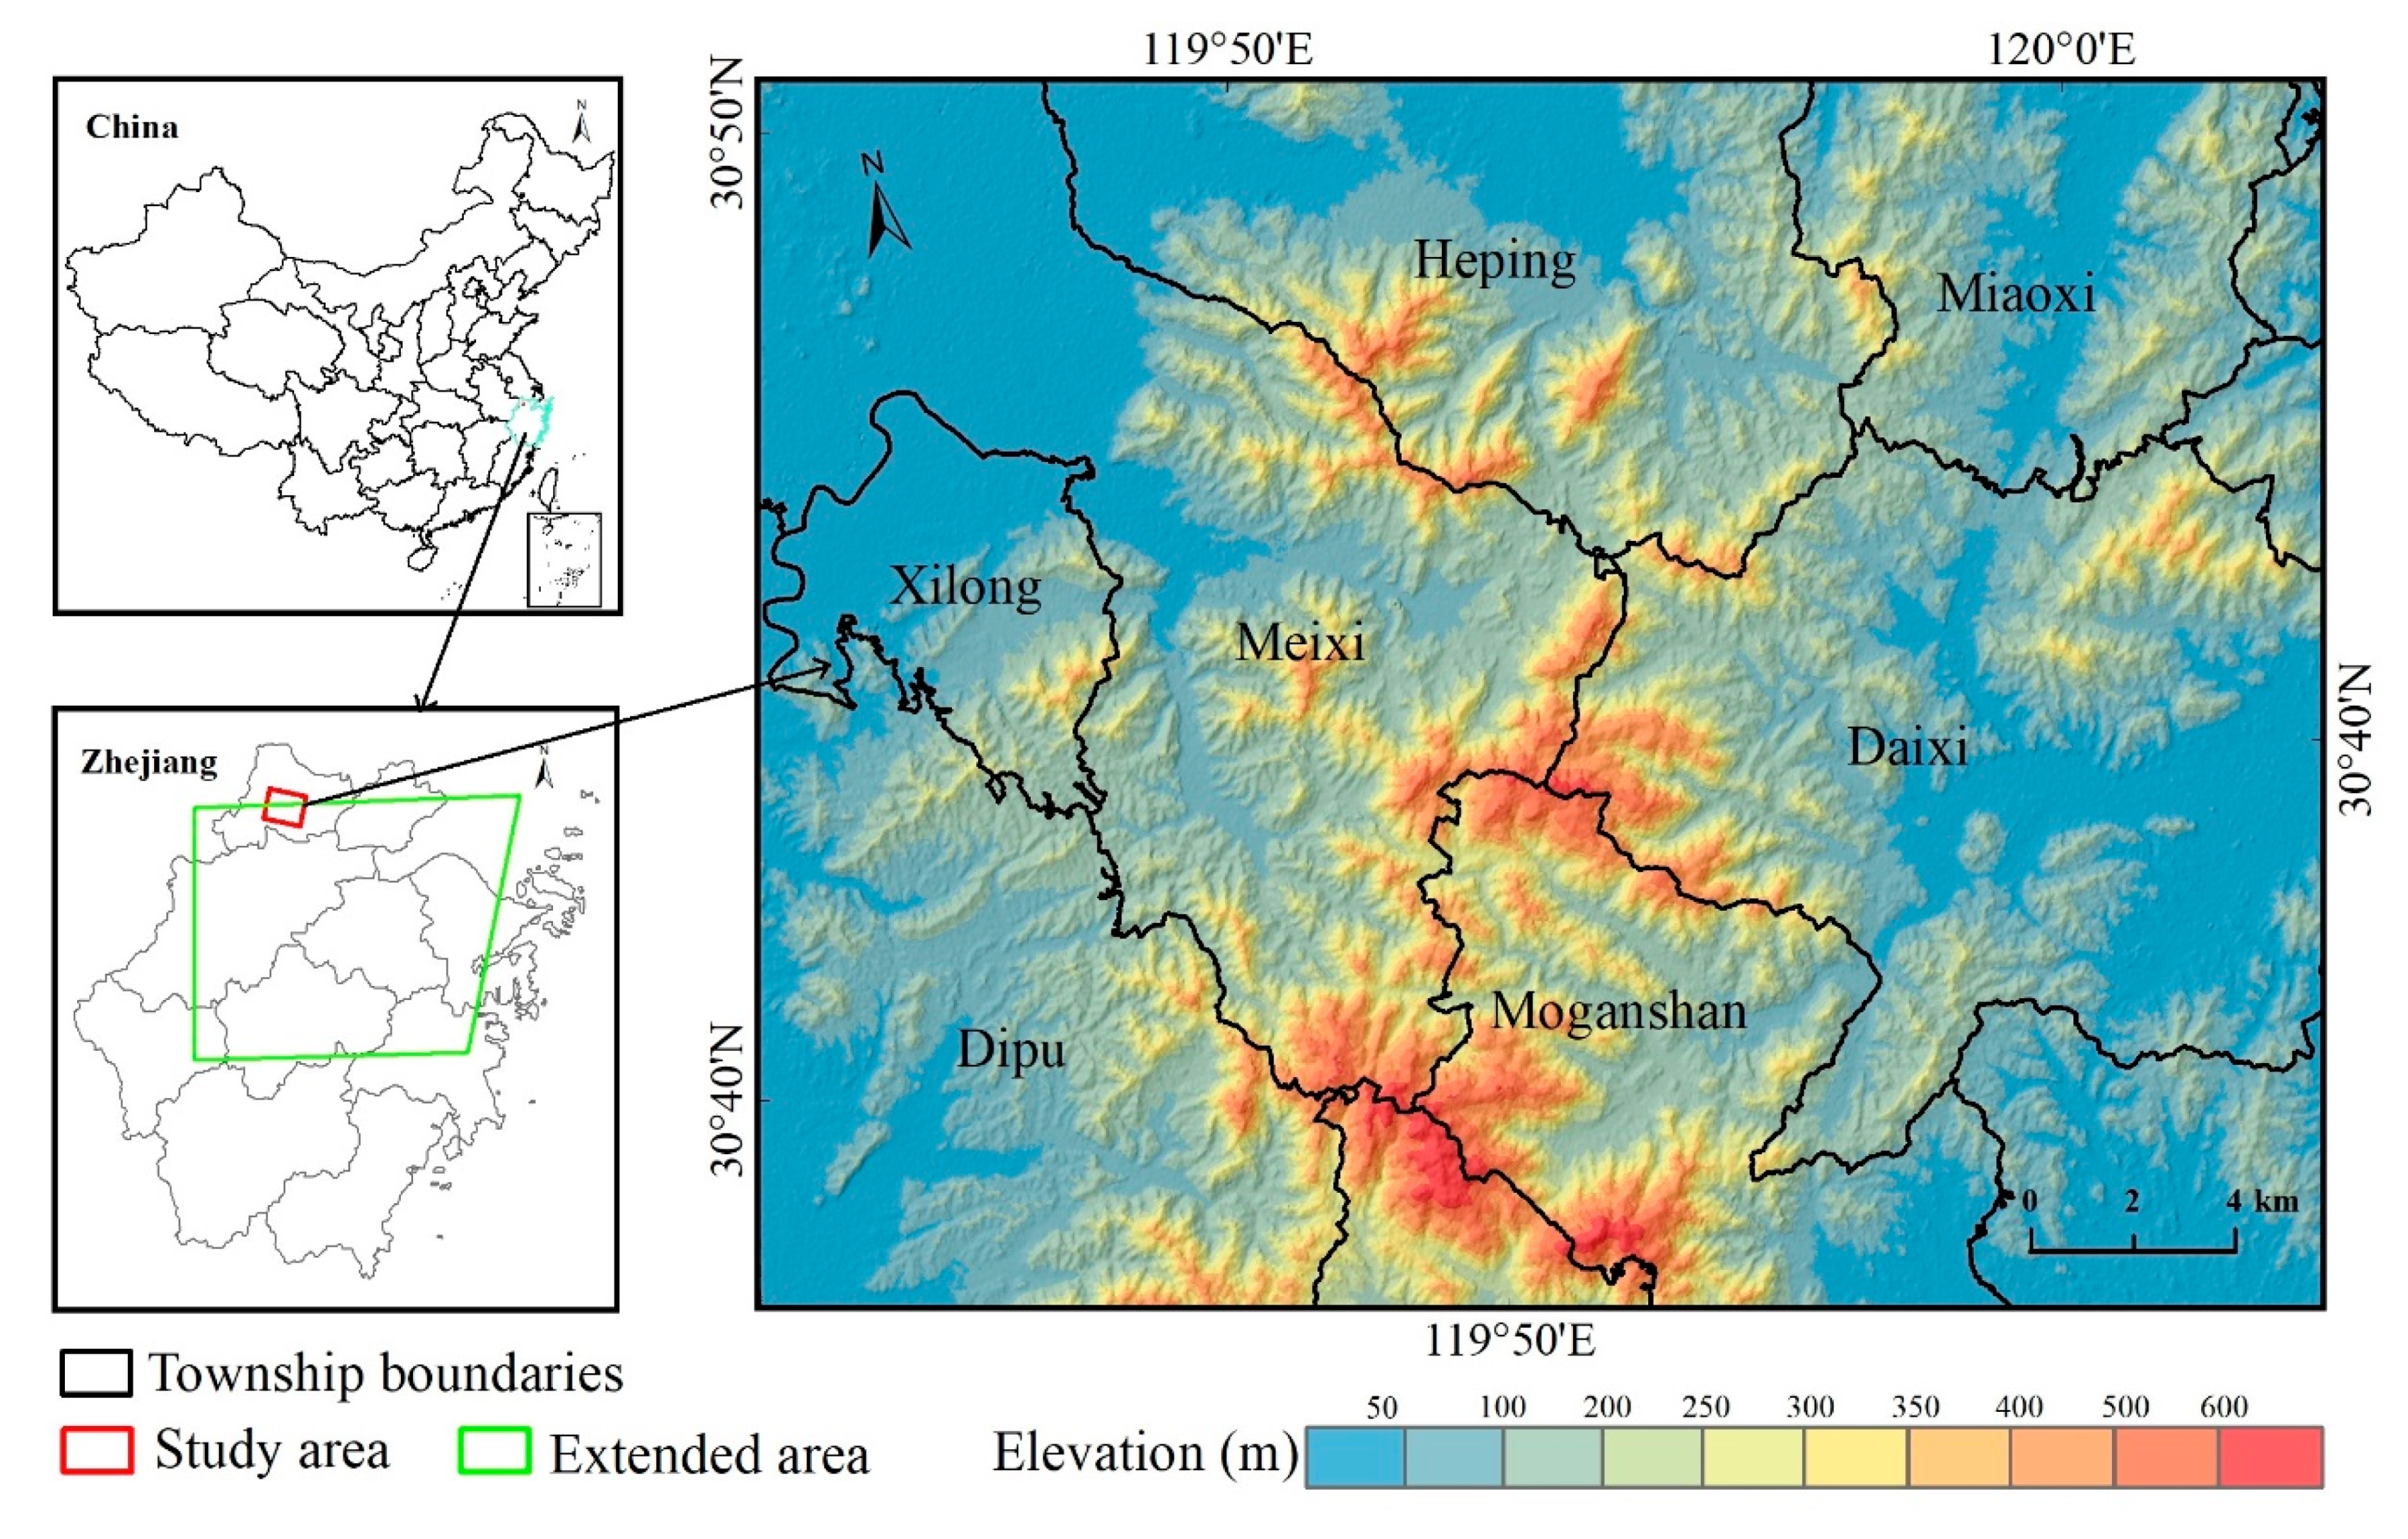
2.1. Study Area

The study area consisting of tea plantations is approximately 765 km2 and is located in Huzhou County, northwestern Zhejiang Province (Figure 1). The terrain of the study area is dominated by hilly mountains with an elevation of less than 700 m. The area belongs to the subtropical monsoon climate zone, with an annual rainfall of 1512.4 mm, annual sunshine hours of 1961.5 h, and an annual average temperature of 16.9 °C (Huzhou Statistics Bureau, 2018). The main soil type is fertile red soil, with a thick soil layer [3]. The area is suitable for tea cultivation due to sufficient sunshine, a mild climate and abundant rainfall. In addition to tea plantations, there are evergreen and deciduous forests, bamboo forests, shrubs, farmland, water bodies, and impervious surfaces. The tea industry is an important industrial pillar of Huzhou County. According to the local statistical yearbook, the tea production value was 204,441 million yuan in 2017, accounting for 20% of the local agricultural output value (Huzhou Statistics Bureau, 2018). The tea plantations in the area have grown rapidly, from 14,620 hectares in 2007 to 24,539 hectares in 2017 (Huzhou Statistics Bureau, 2018).
To verify the portability of the method, an extended research area in the northern part of Zhejiang Province was selected (Figure 1, green polygon). The extended area is 52,131.44 km2, accounting for approximately half of the entire province. This area also has a subtropical monsoon climate and is the main distribution area of tea plantations in Zhejiang.

2.2. Data Collection and Preprocessing

The remote sensing satellite images used in this study included high-spatiotemporal-resolution VENμS images and multitemporal Sentinel-2 images. The VENμS satellite is a near-polar sun-synchronous orbit microsatellite jointly developed by the Israel Aerospace Agency (ISA) and French Centre National d’Etudes Spatiales (CNES) and launched in August 2017 [20,21]. The objectives of the satellite are to provide scientific data for surface monitoring under the influences of environmental factors and human activities. The satellite collects data for 200 basic research areas around the world and provides high-temporal-resolution remote sensing data (revisit time of 2 days and spatial resolution of 5 m). The satellite has a swath of 27 km, an orbital height of 720 km, and a transit time of 10:30 am. It provides a total of 12 spectral bands from 443 nm to 910 nm (Table 1). Sentinel-2 is an Earth observation mission developed by the European Space Agency (ESA). This pair of satellites (Sentinel-2A launched on June 2015, and Sentinel-2B launched on March 2017) provides high-resolution optical imagery. The satellites have a swath of 290 km, an orbit at 786 km and a transit time of 10:30 am. They provide a total of 13 spectral bands from 443 nm to 2190 nm (Table 1).
A total of 40 cloud-free Level-2A VENμS images (Table 2) taken in 2018 were downloaded from the Theia Land Data Center, a French national interagency organization that promotes the use of observational images. The data platform provides Level-1C top of atmosphere reflectance data with a 5-m spatial resolution. The Level-2A product used in this study was surface reflectance with a spatial resolution of 10 m after atmospheric correction and terrain correction by the multisensor atmospheric correction and cloud screening (MACCS) algorithm [22,23].
Due to the small coverage area of the VENμS images (764.97 km2), Sentinel images from 2018 were also collected to identify the tea plantations within the extended area (Figure 1). Level-1C Sentinel-2 A/B images taken on 23 February, 19 April and 4 May, 2018, were acquired from the Copernicus Open Access Hub (https://scihub.copernicus.eu/dhus/#/home). Each period contained six scene images, and the tile numbers were T50RQT, T50RQU, T51RQN, T51RTP, T51RUN, and T51RUP. Level-1C products with top of atmosphere reflectance data were atmospherically corrected with the Sen2Cor plug-in provided by the ESA. Then, the six scene images of each period were mosaicked separately, covering 52,131.44 km2 in northern Zhejiang (Figure 1). The projection of all images was the same: Universal Transverse Mercator Projection 50 (UTM 50). ALOS digital elevation model (DEM) data with a spatial resolution of 12.5 m were collected for the study area. The DEM data were downloaded from NASA’s website (http://earthdata.nasa.gov/about/daacs/daac-asf).
Field survey data are a reliable source of training and validation data [5]. The main land cover types in the study area include tea plantations, broadleaf forests, bamboo forests, bare soil, and impervious surfaces. During the period from 2016 to 2018, our team conducted a thorough field survey of the study area. We obtained more than 1000 photos with coordinate information by using a Canon D7000 GPS camera (Canon Inc., Tokyo, Japan). The real land cover information obtained from the survey was digitized in Google Earth and converted into a region of interest (ROI) series. A total of 1200 ROIs were obtained, half for sample training and half for validation.

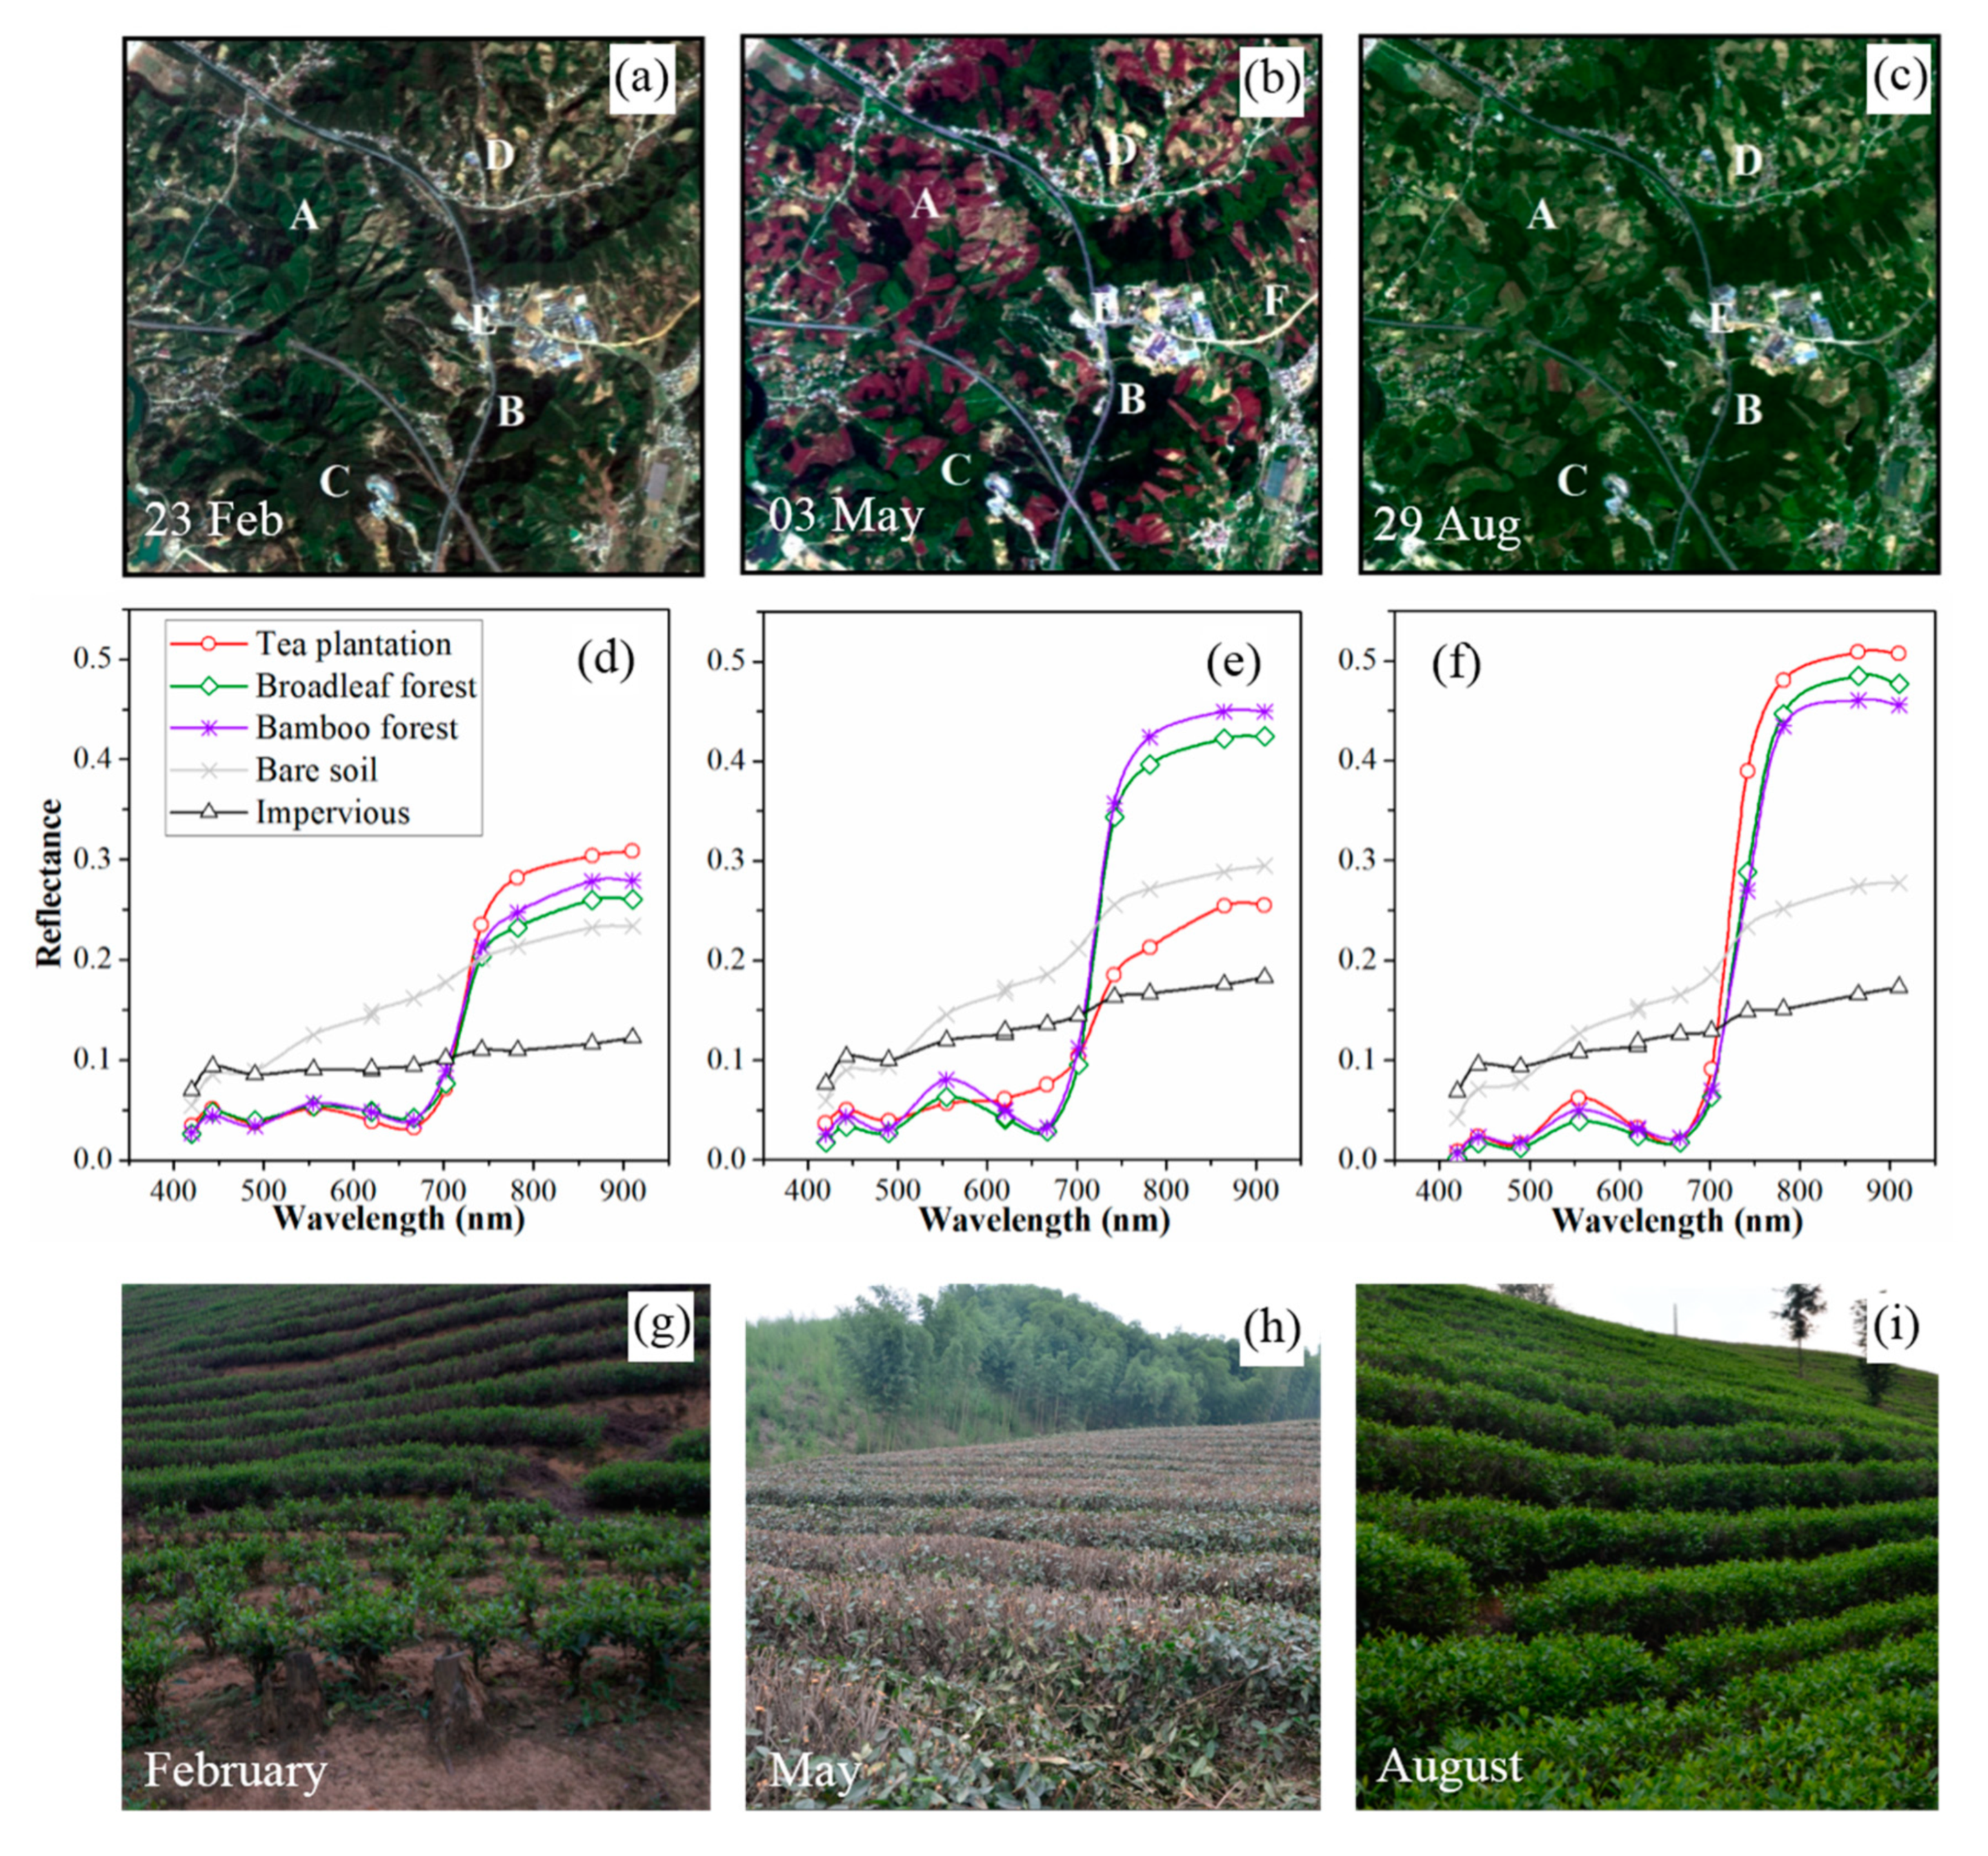
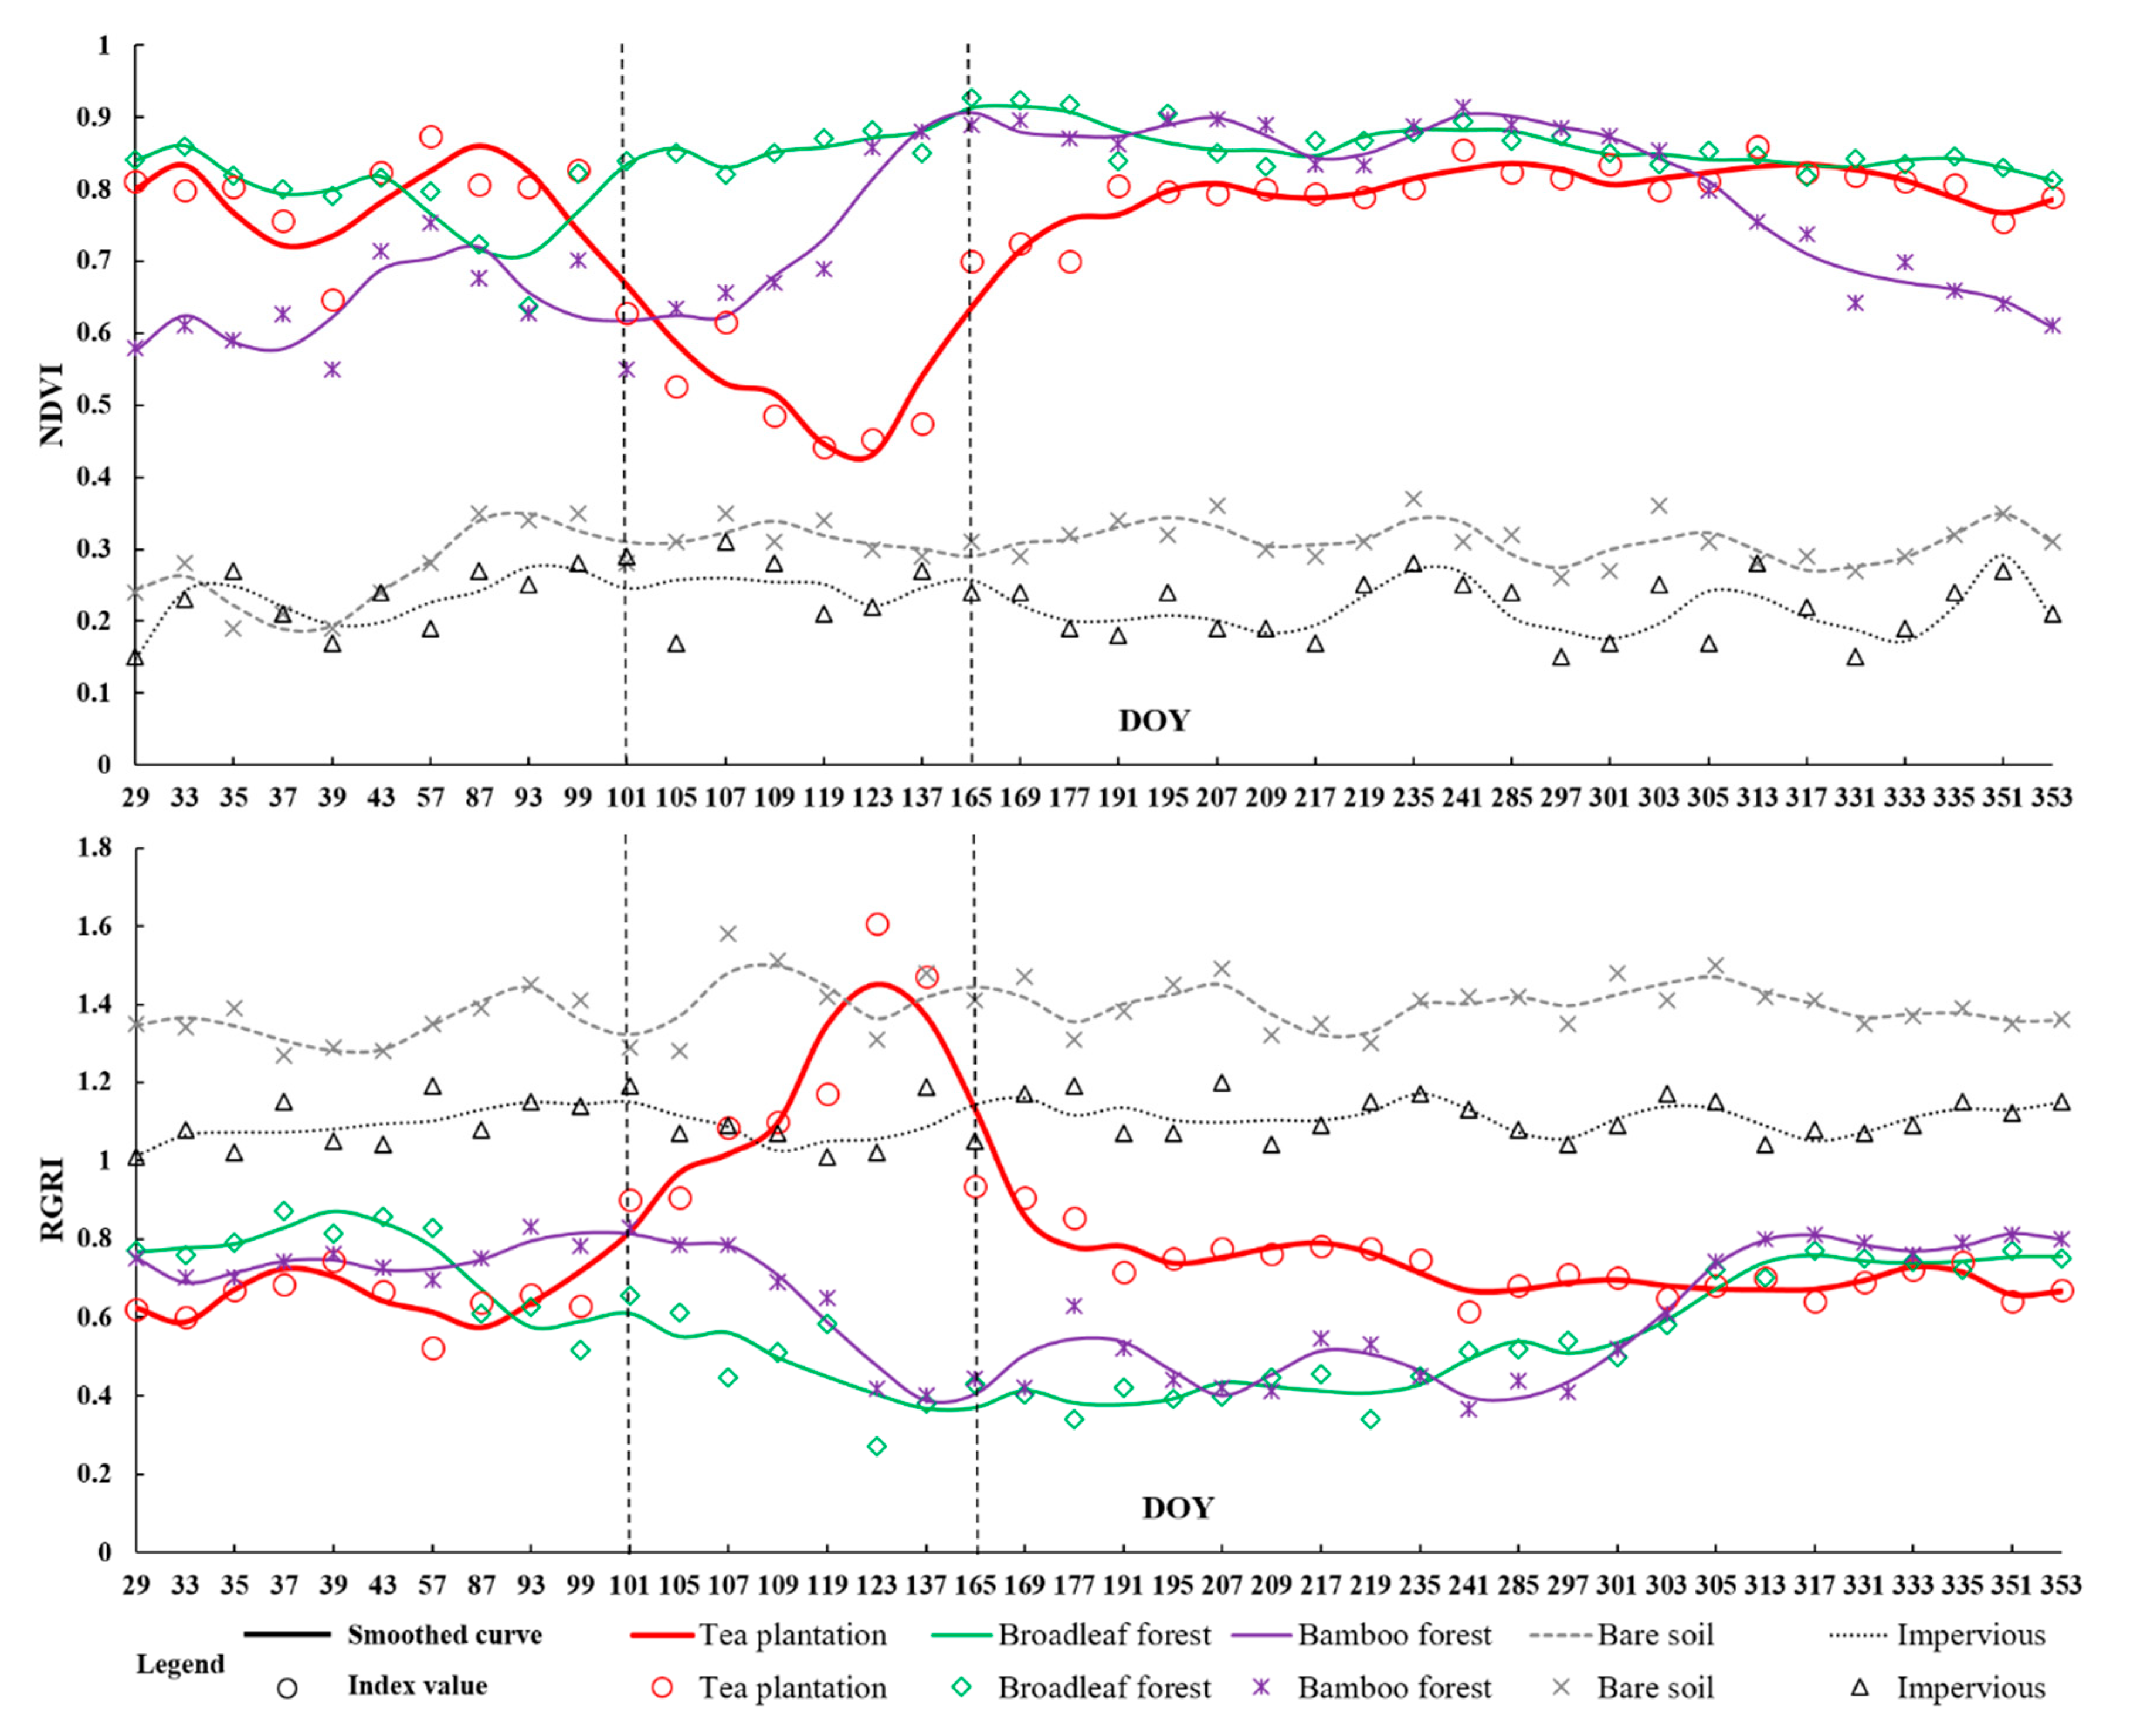
2.3. VENμS-Based Spectral and Phenological Analyses

When the images were examined, the tea plantations appeared very strange at the beginning of May (purple in the true-color composite image, see Figure 2b) and as normal vegetation at other times (Figure 2a,c). Spectral analysis revealed that at this time, the spectral value between 600 nm and 700 nm of tea plantations was higher than that of broadleaf forest and bamboo forest, and the spectral value at wavelengths above 700 nm was much lower for tea plantations than for broadleaf and bamboo forests (Figure 2d–f). In fact, the spectral characteristics of the tea plantations at this stage were more similar to those of bare soil. Based on this discovery, we reviewed a large amount of literature and conducted field investigations to understand tea plantations.
Tea plantations are very different from other forests, plantations, and cultivated fields. First, tea trees are planted in a row, with a distance of approximately 1.5 m between rows (Figure 2g). To reduce the occurrence of weeds competing for soil moisture and nutrients, tea farmers often weed, causing the gaps between the rows of tea trees to be covered by only bare soil (Figure 2g). Second, tea trees need to be periodically pruned (cut from the top) to rejuvenate them and maintain an appropriate height for picking the leaves [24]. The harvest period of tea plantations is mostly concentrated in the spring, and the leaves need to be picked during this time. Pruning inhibits apical dominance of tea trees, allows the roots and stems to reserve nutrients, and stimulates new shoot growth [25]. In local areas, after the tea-picking period, tea farmers perform heavy pruning of the tea plantation, cutting off the leaves and branches on the top to keep the tea trees at a certain height. After deep pruning, most of the canopy of the tea tree is gone, leaving only a small number of leaves, revealing reddish-brown branches (Figure 2h). During this period, the spectral characteristics of the tea plantation are similar to those of bare soil since there is no tea tree canopy and the bare soil between the rows is exposed (Figure 2e).
The large difference between tea plantations and other green vegetation in the pruning phenological phase can be used to delineate tea plantations. The normalized difference vegetation index (NDVI), the most commonly used vegetation index, reflects the state of vegetation growth and can be used to monitor vegetation phenology [26,27,28,29]. The red–green ratio index (RGRI) estimates the canopy development process of vegetation and is often applied to plant growth and phenological research, canopy stress detection and crop estimation [30,31,32]. Therefore, these two indices were calculated using surface reflectance with the following equations:
NDVI = ρ nir ρ red ρ nir + ρ red
RGRI = ρ red ρ green
where ρnir, ρred, and ρgreen, are the surface reflectance values of the near-infrared band, red band, and green band in VENμS, respectively.
Based on the samples obtained from our field survey, the values of the NDVI and RGRI of the five land cover types in the time series images were calculated. Since Savitzky–Golay [33] filtering can improve the description of the index during the year, it was used to smooth the time series NDVI and RGRI values.
I i = j = n n ( C j I i + j ) N
where I is the original index value, such as the NDVI; Ii is the fitted value; Cj is the jth filter coefficient; and N = 2n + 1 is the number of data points contained in the sliding window.
Subsequently, the derivative of the fitted curve is taken, and the position of the maximum and minimum of the derivative corresponds to the beginning and end of the phenological period, respectively (Figure 4). Index value extraction, the Savitzky–Golay filtering algorithm and the derivation process were all implemented in Python.

2.4. Mapping the Spatial Distribution of Tea Plantations

The vegetation in the study area is mainly evergreen plants, including tea plantations, broadleaf forests, and bamboo forests. The key to identifying tea plantations is to find the spectral difference between tea plantations and other evergreen vegetation. In this study, we developed an approach for distinguishing tea plantations from evergreen vegetation based on their unique phenological changes, and spatial cross-analysis was used to map the distribution of tea plantations. Figure 3 shows the framework for mapping tea plantations using dense VENμS time series data and multitemporal Sentinel-2 data. The major steps include (1) analyzing the spectral and phenological characteristics of tea plantations based on VENμS time series images and identifying their phenological changes; (2) separating vegetation and nonvegetation in winter using the NDVI and obtaining a vegetation cover map based on the decision tree method; (3) obtaining a map of the tea plantation phenological information by an appropriate RGRI; (4) performing spatial intersection analysis of the evergreen vegetation map and phenological map to obtain the spatial distribution of tea plantations at a local scale; (5) identifying tea plantations from multitemporal Sentinel-2 images based on this method and obtaining their spatial distribution at a regional scale; and (6) assessing the accuracy of the tea plantation mapping.
The NDVI in winter was an effective index for discriminating the evergreen vegetation from the background. In the second step, the NDVI value of the winter image was selected to be equal to 0.5 as the threshold. The pixels with an NDVI value lower than 0.5 were considered to be nonvegetation or deciduous forests, and the pixels with an NDVI value higher than 0.5 were considered to be evergreen vegetation (tea plantations, bamboo forests and evergreen broadleaf forests). In the third step, an RGRI equal to 1 was selected as a threshold for determining the phenological change of the tea plantations. In the vegetation map, tea plantations were mixed with the evergreen vegetation, such as bamboo forest. In the phenological information map, the tea plantations were mixed with impervious surfaces and bare soil. Through spatial intersection analysis, the other land cover types (included in only one of the two maps) were excluded, and only the tea plantations (contained in two maps) were retained.

2.5. Accuracy Assessment

A confusion matrix approach was used for accuracy assessment in this study [34]. A total of 600 verification points were selected from the field surveys, including 300 points for tea plantations and 300 points for other land cover types. The confusion matrix was generated based on the verification points, and the user’s accuracy, producer’s accuracy, and overall classification accuracy were calculated to evaluate the performance of mapping.

3. Results

3.1. The Phenology of Tea Plantations and Its Potential for Mapping

Figure 4 contains the NDVI and RGRI values for five typical land cover types and the curves after Savitzky–Golay filtering. In this figure, the red line (representing the tea plantations) changed significantly in late April, with a decrease in the NDVI and an increase in the RGRI; these patterns were very different from those for other vegetation. This result shows a significant change in the phenology of the tea plantations. During this period, the tea trees were deeply pruned, and a large number of branches and leaves were cut off by tea farmers. Hence, the tea plantations no longer had typical vegetation characteristics, and their NDVI values were suddenly reduced. Based on derivation of the curve, the phenological change of the tea plantations started on the 101st day and ended on the 165th day (dotted line in Figure 4). This phenological period was concentrated from April to June and contained eight VENμS images (see Table 2). As shown by the RGRI curve in Figure 4, the values in the tea plantations were much higher than those of other vegetation during this phenological period. This significant difference can help differentiate tea plantations from other green vegetation.
An appropriate threshold (in this study, RGRI > 1) was selected to extract tea plantation phenological information (Figure 5b) from VENμS images taken at different times. In the partially enlarged view (Figure 5(b1)), the green area is the tea plantation phenological information extracted from the image taken on 3 May. The pruning period of tea plantations in the area was concentrated, with most trimming occurring at the beginning of May. The red area is the phenological information of the tea plantations that was present in only the 14 June image. Because the local tea plantations in this area were pruned late, their phenology was reflected in only the later images. The yellow and blue areas (Figure 5(b1)) represent phenological changes identified from the 17 and 29 April images, respectively, and from the phenological information map for 3 May. These tea plantations were pruned early, as reflected in the early images. These places can be seen in the image taken in May, indicating that it takes a long period of time for the pruned tea plantations to recover. In case some tea plantations had different pruning periods, all images in this phenological period were used to obtain the map of total primary production information.

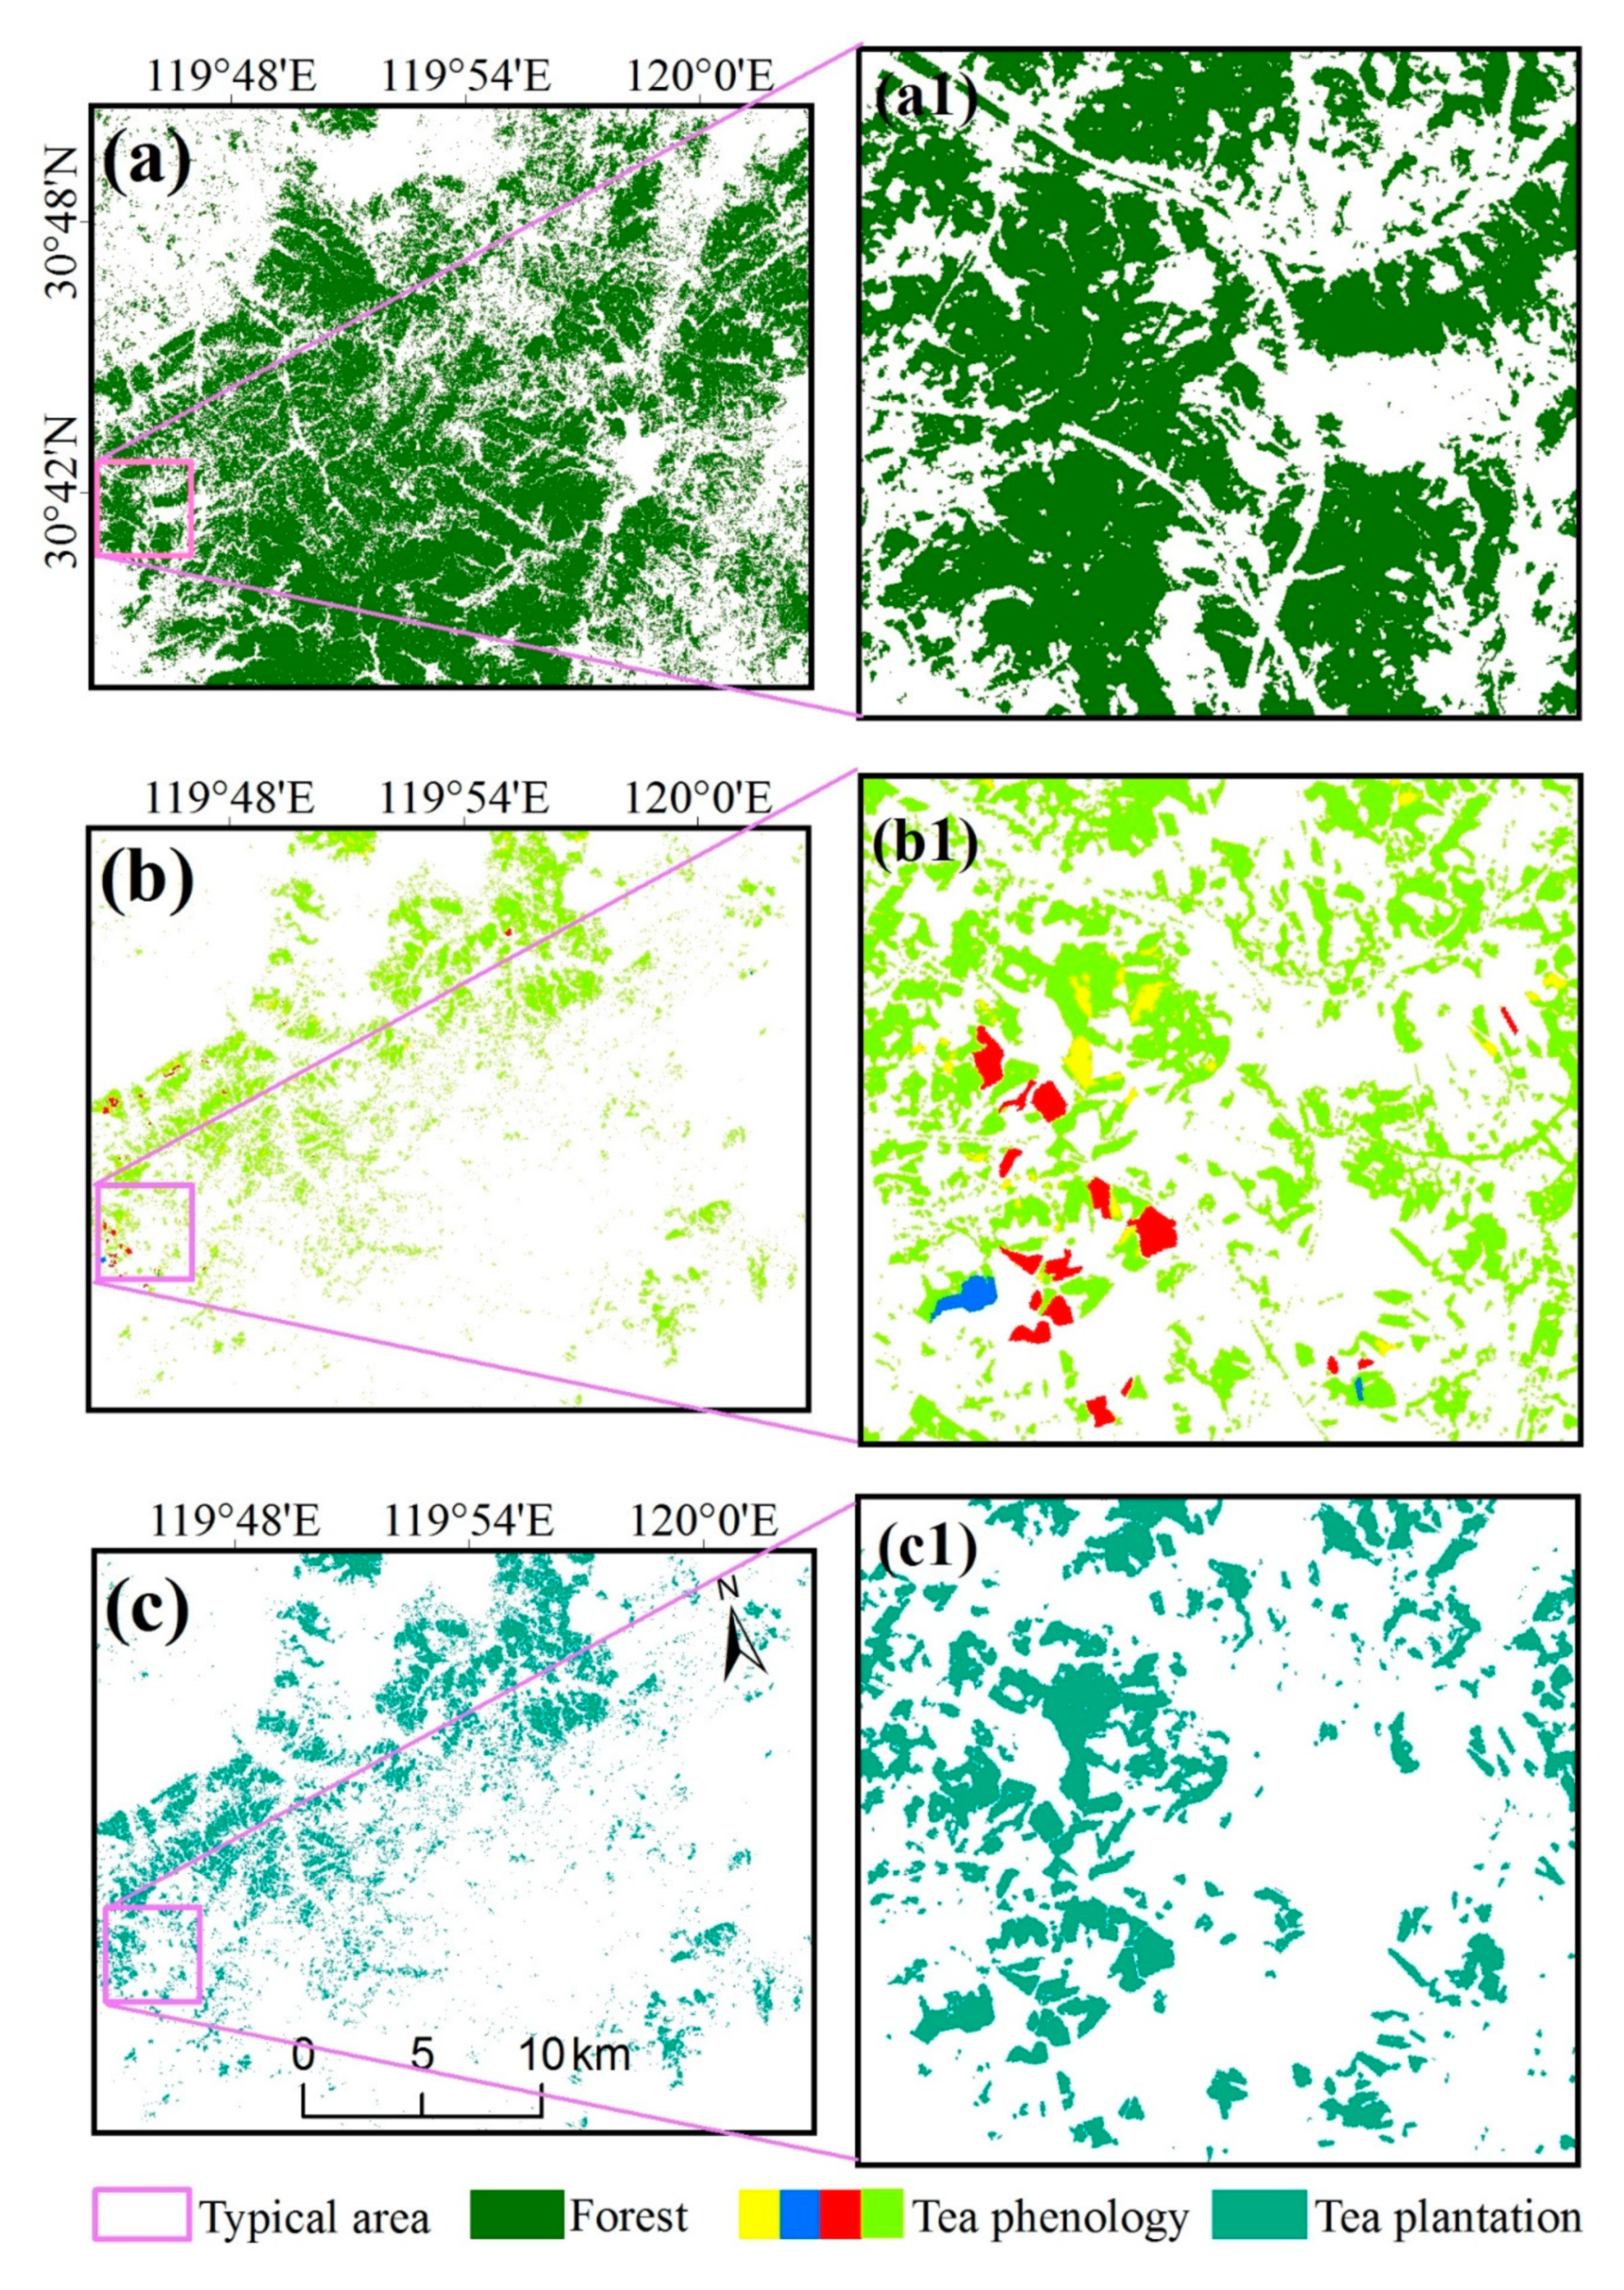
3.2. Mapping of Tea Plantations Based on VENμS Imagery at a Local Scale

Based on the vegetation cover map and the map of the tea plantation phenological information, spatial intersection analysis was used to obtain the distribution of tea plantations in the study area (Figure 5). The tea plantations are concentrated in the northwestern part of the study area, showing a patchy distribution in the southwest–northeast direction. Combined with the topographic map of the study area, this figure shows that the tea plantations are mainly distributed in the gentle hilly area at the junction of the mountain and the plain, mainly on the 5–25° slopes, which is consistent with the growth environment requirements of tea. The area of tea plantations in the study area is 77.97 km2, accounting for 10.2% of the total study area. According to the statistics for administrative divisions, the tea plantations in Heping town have the widest distribution, reaching 30.22 km2, followed by Meixi town and Dipu town, with 17.92 km2 and 9.55 km2, respectively.
The accuracy assessment results in Table 3 indicate that the method has high overall accuracy (95%) for tea plantation mapping. The tea plantations maps had a user’s accuracy of 95.9% and a producer’s accuracy of 94%. Therefore, the proposed method can successfully extract tea plantations in the study area.

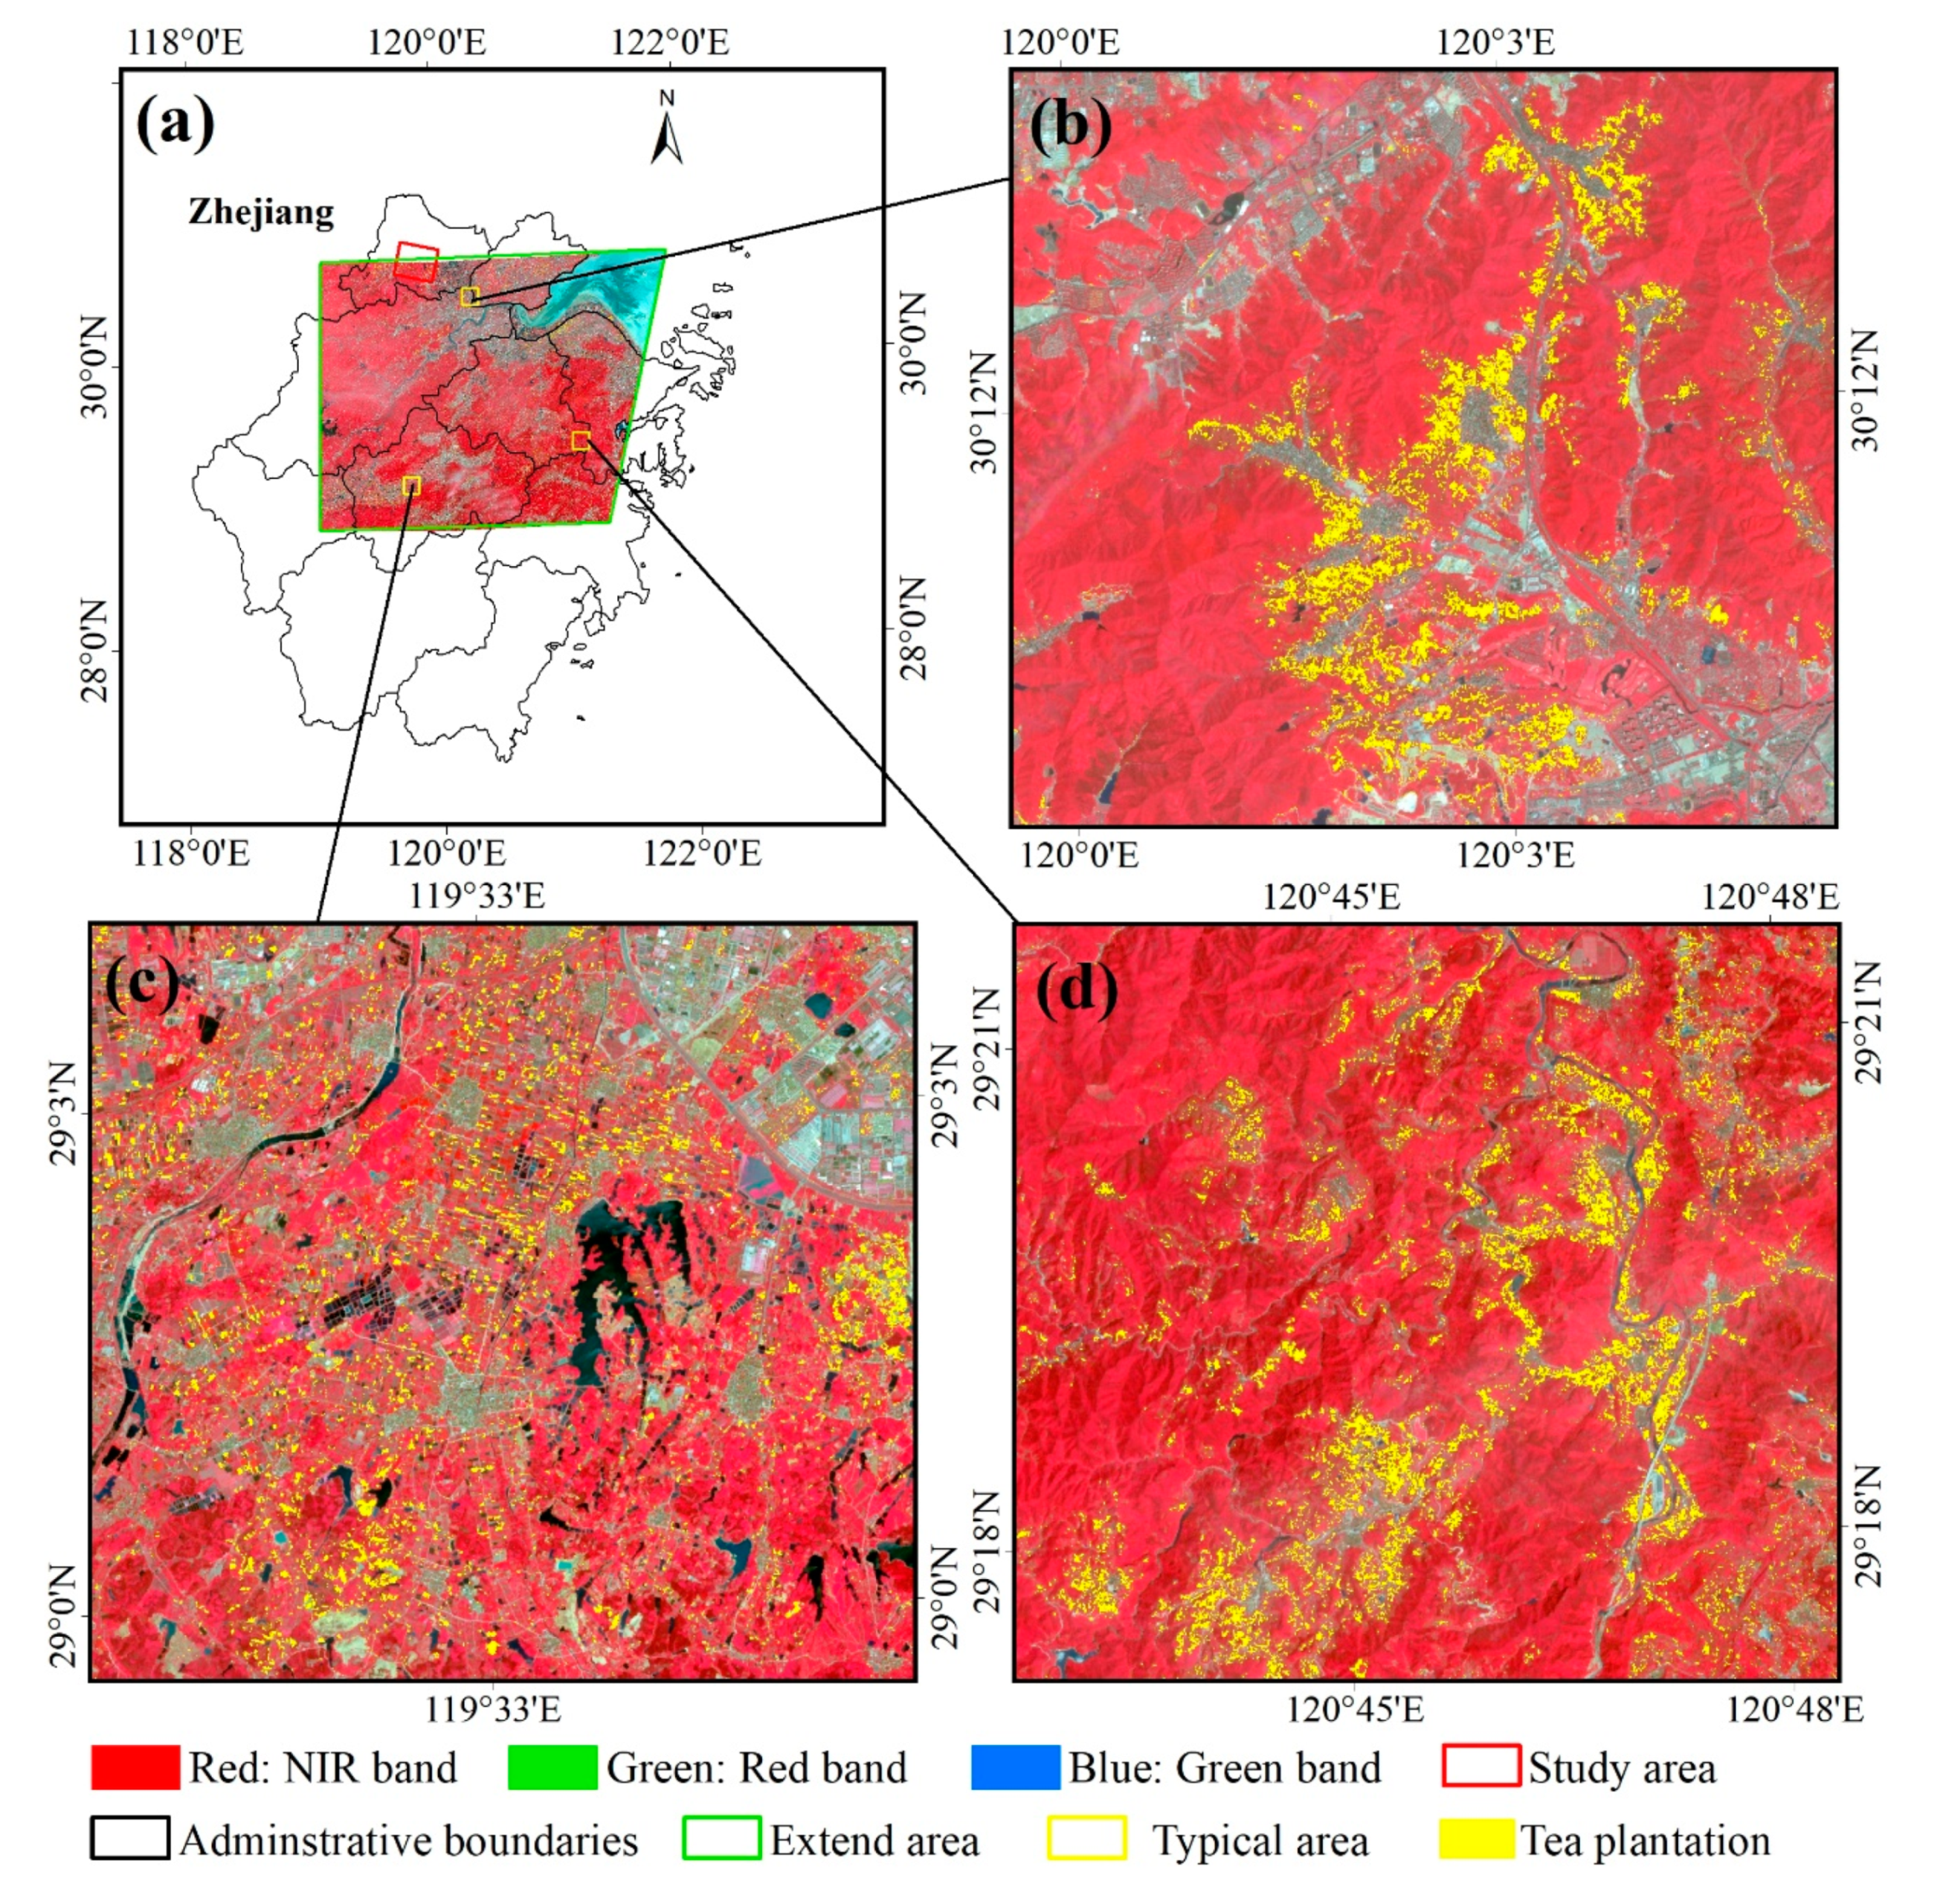
3.3. Mapping of Tea Plantations Based on Sentinel-2 Imagery at a Regional Scale

All types of tea plantations are pruned in order to increase the yield of tea and facilitate tea picking and management. Due to the limited area of the VENμS images, in order to explore whether this method can effectively identify different types of tea plantations, Sentinel-2 data covering the northern part of Zhejiang (Figure 6a) were used at a regional scale.
The distribution of tea plantations in Zhejiang Province is very fragmentary. In Figure 6b, the West Lake Longjing Tea Plantations [35] in Hangzhou also exhibit a deep pruning period in April–May, similar to the study area in VENμS imagery (red rectangle). In the mountains with steep slopes (Figure 6d), the distribution of tea plantations was more scattered. The overall accuracy of tea plantation detection was 88.7%, confirming the applicability of the mapping method. Short-term vegetables were planted in paddy fields during spring and then harvested, after which the paddy fields were bare. Therefore, this part of the area was covered by vegetables in February and by bare soil in May, similar to the phenological changes observed for tea plantations. In addition, some places were covered by vegetation on the previous date (23 February) and converted into construction land on the later date (4 May); as a result, these places were mistakenly divided into tea plantations. These patterns contributed to a decrease in overall accuracy.

4. Discussion

4.1. Phenological Periods of the Tea Plantations

Tea trees in subtropical regions, especially in China, are shrubs with multiple stems. Tea trees in plantations have the same phenological characteristics as other natural shrubs if they are not managed by humans. The most prominent phenological feature of managed tea plantations is their pruning period. Artificial pruning can improve tea production in the next year, and this pruning method is applied in the tea plantations of southern China [24]. However, pruning changes the canopy structure of tea trees and the spectral characteristics of tea plantations. After the tea plantations are deeply pruned, it takes a long period of time for them to recover. During the pruning period (which generally occurs after tea is picked), the area covered by the leaves of the tea plantations is limited, and the bare soil between the tea trees is exposed, causing the tea plantations to exhibit spectral characteristics similar to those of bare soil. At the same time, other forests, plantations or shrubs have typical vegetation spectral characteristics. Therefore, tea plantations can be distinguished from other vegetation by using their pruning period.
Due to management practices other than pruning, tea plantations are characterized by other phenological periods such as the irrigation period, weeding period, and fertilization period. However, these phenological periods are short (usually one or two days) and have limited representation in remote sensing images. In the future, if the data allow, we intend to analyze other phenological periods of the tea plantations through hyperspectral imagery or high-spatial-resolution/high-density time series images. Such analysis will facilitate the sustainable management of tea plantations.

4.2. Dataset Selection for Tea Plantation Mapping

Appropriate remote sensing data are the basis of research. Scholars have performed many studies on large areas of forests or crops based on medium-resolution and low-resolution images such as those obtained from Landsat and MODIS data [15,36,37]. The distribution of tea plantations and farmland in southern China is extensive, and the patches are small; as a result, such images are not applicable for tea plantation mapping. At the same time, high-spatial-resolution images have limited spectral bands (usually containing only red, green, blue, and near-infrared bands), making it difficult to identify tea plantations from evergreen vegetation.
The VENμS data have a high spatial resolution of 5.3 m and a short revisit period of 2 days and contain 12 multispectral bands (including three red-edged bands, see Table 1). A total of 180 VENμS images per year could be obtained from a single location under ideal weather conditions, but data are limited. In this study, only 40 images were collected, and other images were covered by clouds and could not be used for research. However, VENμS data generally meet the requirements of phenological analysis and can be used for time series analysis. More detailed spatial and temporal information on tea plantations or other land cover types can be observed from such intensive data. The Sentinel-2 data have a spatial resolution of 10 m and a revisit period of 5 days, covering most of the world. In this study, we applied a phenological approach to discriminate tea plantations in northern Zhejiang Province and obtained good validation accuracy.
In addition, VENμS and Sentinel-2 data also have red-edged bands. The red edge is the area where the reflectivity of the vegetation changes rapidly in the near-infrared band and approaches the red wavelength of light. This indicator band is important for describing plant pigmentation status and health status. Studies have shown that certain vegetation can be accurately detected based on time series variables generated by red-edge bands [38,39,40,41]. Future research will move in two directions. First, we will try to extract more variables (red-edge bands, spatial textures, and terrain) from the VENμS and Sentinel-2 data used for mapping tea plantations. Second, we will try to map tea plantations in southern China based on the Google Earth engine platform.

4.3. Applicability and Uncertainty Analysis

Tea plantations provide considerable economic benefits, causing local people to continually destroy forests and shrubs to plant tea trees. The expansion of tea plantations has caused environmental problems such as soil loss, which has drawn the attention of the government. However, tea plantations are widely distributed, and annual field surveys require a large amount of labor. Therefore, it is urgent to monitor the distribution and area of tea plantations by remote sensing data. Based on analysis of VENμS time series images, the phenological changes of tea plantations were found, and the tea plantations were effectively identified at a local scale. Then, the method was applied to Sentinel data, which effectively extracted tea plantations of different species at a regional scale. In general, tea plantations require human management and a pruning period. This study shows that the pruning period of tea plantations can be monitored using indices such as the NDVI and RGRI and that tea plantations can be discerned by the method proposed in this paper. The RGRI uses visible bands (red and green bands), which are suitable for most remote sensing data.
Green tea is the main tea species produced in the plantations in this study area (northern Zhejiang) and has an obvious pruning period, which is a characteristic of tea plantations. For different tea species, the pruning period varies depending on the picking period. For the same tea species in different regions (at different latitudes), the pruning periods are similar but may be inconsistent with the findings described here. In addition, climatic factors such as temperature and precipitation strongly affect the phenology of tea [24,42]. In the time series analysis, snowfall occurred on 6 February in some places, and such climatic events will inevitably affect the phenological period and health of tea plantations. Finally, there is also some uncertainty associated with remote sensing data. In the subtropical zone, there are few images available during the rainy season from April to June, which will become a limiting factor of the use of such data. Tea plantations can be more fully extracted from the VENμS data than from other data due to the high temporal resolution of the former. For Sentinel data, images from only three periods (February, April and May) were acquired for this study area due to the lower temporal resolution of the data. Some tea plantations that are pruned later than May will be omitted. More accurate extraction of tea plantations can be obtained only by acquiring more images during the pruning period (from April to May).

5. Conclusions

The tea industry is an important economic industry in southern China. In recent decades, the rapid expansion of tea plantations has caused ecological and environmental problems. An accurate distribution map of tea plantations is necessary for the government to formulate tea plantation management policies. In this study, we analyzed the phenological period of tea plantations based on VENμS time series remote sensing images and explored their potential use in extracting tea plantation distributions based on phenology. We found that the tea plantations in northern Zhejiang have a unique phenological period from April to May, with obvious deep pruning. Based on this critical phenological period, a spatial intersection analysis method can be used to effectively delineate tea plantations and map their distribution from VENμS images. This method has good applicability and can also be extended to Sentinel data in larger regions, achieving good classification accuracy.

Author Contributions

All authors contributed extensively to the work. N.L., D.Z. and L.L. performed the experiments and analyzed the data; N.L. wrote the manuscript, and L.L. and Y.Z. provided comments and suggestions to improve the manuscript. All authors contributed to the editing/discussion of the manuscript.

Funding

This research was funded by Zhejiang Provincial Natural Science Foundation under grant LQ19D010010, the Postgraduate Research and Practice Innovation Program of Jiangsu Province under grant KYCX170819.

Acknowledgments

The authors thank the support of the Priority Academic Program Development of Jiangsu Higher Education Institutions (PAPD), and the Doctorate Fellowship Foundation of Nanjing Forestry University. The authors thank CNES for providing VENμS data. The authors thank the anonymous reviewers who gave valuable suggestions and comments.

Conflicts of Interest

The authors declare no conflicts of interest.

References

  1. Gunathilaka, R.D.; Tularam, G.A. The tea industry and a review of its price modelling in major tea producing countries. J. Manag. Strategy 2016, 7, 21. [Google Scholar] [CrossRef]
  2. FAOSTAT Home Page. Available online: http://www.fao.org/faostat/en/?# (accessed on 5 December 2018).
  3. Su, S.; Wan, C.; Li, J.; Jin, X.; Pi, J.; Zhang, Q.; Weng, M. Economic benefit and ecological cost of enlarging tea cultivation in subtropical china: Characterizing the trade-off for policy implications. Land Use Policy 2017, 66, 183–195. [Google Scholar] [CrossRef]
  4. Chu, H.; Wang, C.; Kong, S.; Chen, K. Integration of full-waveform lidar and hyperspectral data to enhance tea and areca classification. GISci. Remote Sens. 2016, 53, 542–559. [Google Scholar] [CrossRef]
  5. Xu, W.; Qin, Y.; Xiao, X.; Di, G.; Doughty, R.B.; Zhou, Y.; Zou, Z.; Kong, L.; Niu, Q.; Kou, W. Quantifying spatial-temporal changes of tea plantations in complex landscapes through integrative analyses of optical and microwave imagery. Int. J. Appl. Earth Obs. Geoinform. 2018, 73, 697–711. [Google Scholar] [CrossRef]
  6. Dihkan, M.; Guneroglu, N.; Karsli, F.; Guneroglu, A. Remote sensing of tea plantations using an svm classifier and pattern-based accuracy assessment technique. Int. J. Remote Sens. 2013, 34, 8549–8565. [Google Scholar] [CrossRef]
  7. Huang, X.; Zhu, Z.; Li, Y.; Wu, B.; Yang, M. Tea garden detection from high-resolution imagery using a scene-based framework. Photogramm. Eng. Remote Sens. 2018, 84, 723–731. [Google Scholar] [CrossRef]
  8. Dong, J.; Xiao, X.; Chen, B.; Torbick, N.; Jin, C.; Zhang, G.; Biradar, C. Mapping deciduous rubber plantations through integration of palsar and multi-temporal landsat imagery. Remote Sens. Environ. 2013, 134, 392–402. [Google Scholar] [CrossRef]
  9. Wang, Y.; Lu, D. Mapping torreya grandis spatial distribution using high spatial resolution satellite imagery with the expert rules-based approach. Remote Sens. 2017, 9, 564. [Google Scholar] [CrossRef]
  10. Xi, Z.; Lu, D.; Liu, L.; Ge, H. Detection of drought-induced hickory disturbances in western Lin An county, China, using multitemporal landsat imagery. Remote Sens. 2016, 8, 345. [Google Scholar] [CrossRef]
  11. Li, N.; Lu, D.; Wu, M.; Zhang, Y.; Lu, L. Coastal wetland classification with multiseasonal high-spatial resolution satellite imagery. Int. J. Remote Sens. 2018, 39, 1–21. [Google Scholar] [CrossRef]
  12. Xie, Z.; Chen, Y.; Lu, D.; Li, G.; Chen, E. Classification of land cover, forest, and tree species classes with ziyuan-3 multispectral and stereo data. Remote Sens. 2019, 11, 164. [Google Scholar] [CrossRef]
  13. Su, S.; Yang, C.; Hu, Y.; Luo, F.; Wang, Y. Progressive landscape fragmentation in relation to cash crop cultivation. Appl. Geogr. 2014, 53, 20–31. [Google Scholar] [CrossRef]
  14. Ganguly, S.; Friedl, M.A.; Tan, B.; Zhang, X.; Verma, M. Land surface phenology from modis: Characterization of the collection 5 global land cover dynamics product. Remote Sens. Environ. 2010, 114, 1805–1816. [Google Scholar] [CrossRef]
  15. Chen, Y.; Lu, D.; Luo, L.; Pokhrel, Y.; Deb, K.; Huang, J.; Ran, Y. Detecting irrigation extent, frequency, and timing in a heterogeneous arid agricultural region using modis time series, landsat imagery, and ancillary data. Remote Sens. Environ. 2018, 204, 197–211. [Google Scholar] [CrossRef]
  16. Zhang, X.; Friedl, M.A.; Schaaf, C.B.; Strahler, A.H.; Hodges, J.C.F.; Gao, F.; Reed, B.C.; Huete, A. Monitoring vegetation phenology using modis. Remote Sens. Environ. 2003, 84, 471–475. [Google Scholar] [CrossRef]
  17. Melaas, E.K.; Friedl, M.A.; Zhu, Z. Detecting interannual variation in deciduous broadleaf forest phenology using landsat tm/etm+ data. Remote Sens. Environ. 2013, 132, 176–185. [Google Scholar] [CrossRef]
  18. Fisher, J.I.; Mustard, J.F.; Vadeboncoeur, M.A. Green leaf phenology at landsat resolution: Scaling from the field to the satellite. Remote Sens. Environ. 2005, 100, 265–279. [Google Scholar] [CrossRef]
  19. Drusch, M.; Bello, U.D.; Carlier, S.; Colin, O.; Fernandez, V.; Gascon, F.; Hoersch, B.; Isola, C.; Laberinti, P.; Martimort, P. Sentinel-2: Esa’s optical high-resolution mission for gmes operational services. Remote Sens. Environ. 2012, 120, 25–36. [Google Scholar] [CrossRef]
  20. Ferrier, P.; Crebassol, P.; Dedieu, G.; Hagolle, O.; Meygret, A.; Francesc, T.; Yoram, Y.; Jacob, H. Venµs (vegetation and environment monitoring on a new micro satellite). In Proceedings of the 2010 IEEE International Geoscience and Remote Sensing Symposium, Honolulu, HI, USA, 25–30 July 2010. [Google Scholar]
  21. Jacob, H.; Appel, L.; Barnett, D.L.; Baron, D.M.; Davidson, A.; Gontmacher, P. Venµs—A novel technological mission using electric propulsion. In Proceedings of the 35th International Electric Propulsion Conference, Atlanta, GA, USA, 8–12 October 2017. [Google Scholar]
  22. Hagolle, O.; Dedieu, G.; Mougenot, B.; Debaecker, V.; Duchemin, B.; Meygret, A. Correction of aerosol effects on multi-temporal images acquired with constant viewing angles: Application to formosat-2 images. Remote Sens. Environ. 2007, 112, 1689–1701. [Google Scholar] [CrossRef]
  23. Hagolle, O.; Huc, M.; Pascual, D.V.; Dedieu, G. A multi-temporal method for cloud detection, applied to formosat-2, venµs, landsat and sentinel-2 images. Remote Sens. Environ. 2010, 114, 1747–1755. [Google Scholar] [CrossRef]
  24. Huang, S. Meteorology of the tea plant in china: A review. Agric. For. Meteorol. 1989, 47, 19–30. [Google Scholar] [CrossRef]
  25. Leyser, O. The fall and rise of apical dominance. Curr. Opin. Genet. Dev. 2005, 15, 468–471. [Google Scholar] [CrossRef] [PubMed]
  26. Rouse, J.W.J.; Haas, R.H.; Schell, J.A.; Deering, D.W. Monitoring vegetation systems in the great plains with erts. NTRS 1974, 351, 309. [Google Scholar]
  27. Lee, R.; Yu, F.; Price, K.P.; Ellis, J.; Shi, P. Evaluating vegetation phenological patterns in inner mongolia using ndvi time-series analysis. Int. J. Remote Sens. 2002, 23, 2505–2512. [Google Scholar] [CrossRef]
  28. Nathalie, P.; Olav, V.J.; Atle, M.; Jean-Michel, G.; Compton, J.T.; Nils, C.S. Using the satellite-derived ndvi to assess ecological responses to environmental change. Trends Ecol. Evol. 2006, 20, 503–510. [Google Scholar]
  29. Estel, S.; Kuemmerle, T.; Alcántara, C.; Levers, C.; Prishchepov, A.; Hostert, P. Mapping farmland abandonment and recultivation across europe using modis ndvi time series. Remote Sens. Environ. 2015, 163, 312–325. [Google Scholar] [CrossRef]
  30. Verrelst, J.; Schaepman, M.E.; Koetz, B.; Kneubühler, M. Angular sensitivity analysis of vegetation indices derived from chris/proba data. Remote Sens. Environ. 2008, 112, 2341–2353. [Google Scholar] [CrossRef]
  31. Ritchie, G.L.; Sullivan, D.G.; Vencill, W.K.; Bednarz, C.W.; Hook, J.E. Sensitivities of normalized difference vegetation index and a green/red ratio index to cotton ground cover fraction. Crop Sci. 2010, 50, 1000–1010. [Google Scholar] [CrossRef]
  32. Motohka, T.; Nasahara, K.N.; Oguma, H.; Tsuchida, S. Applicability of green-red vegetation index for remote sensing of vegetation phenology. Remote Sens. 2010, 2, 2369–2387. [Google Scholar] [CrossRef]
  33. Savitzky, A.; Golay, M.J.E. Smoothing and differentiation of data by simplified least squares procedures. Anal. Chem. 1964, 36, 1627–1639. [Google Scholar] [CrossRef]
  34. Foody, G.M. Status of land cover classification accuracy assessment. Remote Sens. Environ. 2002, 80, 185–201. [Google Scholar] [CrossRef]
  35. Lou, W.; Sun, S.; Wu, L.; Sun, K. Effects of climate change on the economic output of the longjing-43 tea tree, 1972–2013. Int. J. Biometeorol. 2015, 59, 593–603. [Google Scholar] [CrossRef] [PubMed]
  36. Li, G.; Lu, D.; Moran, E.; Calvi, M.F.; Dutra, L.V.; Batistella, M. Examining deforestation and agropasture dynamics along the brazilian transamazon highway using multitemporal landsat imagery. GISci. Remote Sens. 2019, 56, 1–23. [Google Scholar] [CrossRef]
  37. Gao, Y.; Lu, D.; Li, G.; Wang, G.; Qi, C.; Liu, L.; Li, D. Comparative analysis of modeling algorithms for forest aboveground biomass estimation in a subtropical region. Remote Sens. 2018, 10, 627. [Google Scholar] [CrossRef]
  38. Li, L.; Li, N.; Lu, D.; Chen, Y. Mapping Moso bamboo forest and its on-year and off-year distribution in a subtropical region using time-series Sentinel-2 and Landsat 8 data. Remote Sens. Environ. 2019, 231, 111265. [Google Scholar] [CrossRef]
  39. Fernández-Manso, A.; Fernández-Manso, O.; Quintano, C. SENTINEL-2A red-edge spectral indices suitability for discriminating burn severity. Int. J. Appl. Earth Obs. Geoinform. 2016, 50, 170–175. [Google Scholar] [CrossRef]
  40. Sibanda, M.; Mutanga, O.; Rouget, M. Testing the capabilities of the new WorldView-3 space-borne sensor’s red-edge spectral band in discriminating and mapping complex grassland management treatments. Int. J. Remote Sens. 2017, 38, 1–22. [Google Scholar] [CrossRef]
  41. Forkuor, G.; Dimobe, K.; Serme, I.; Tondoh, J.E. Landsat-8 vs. Sentinel-2: Examining the added value of sentinel-2’s red-edge bands to land-use and land-cover mapping in Burkina Faso. GISci. Remote Sens. 2018, 55, 331–354. [Google Scholar] [CrossRef]
  42. Lou, W.; Sun, K.; Sun, S.; Ma, F.; Wang, D. Changes in pick beginning date and frost damage risk of tea tree in longjing tea-producing area. Theor. Appl. Climatol. 2013, 114, 115–123. [Google Scholar] [CrossRef]
Figure 1. The location of the study area in the Zhejiang Province of China and its topography. The red rectangle represents the study area covered by VENμS images, and the green polygon represents the extended area covered by Sentinel images.
Forests 10 00856 g001
Figure 2. Phenological features of tea plantations and other land cover types in the study area: (ac) are true color composites (band 7 in red, band 4 in green, and band 3 in blue) created from VENμS images taken in February, May, and August, 2018, respectively; A to E are tea plantation, broadleaf forest, bamboo forest, bare soil, and impervious surface, respectively; (df) are their spectral characteristics at the corresponding time; (gi) are photos of tea plantations at the corresponding time.
Forests 10 00856 g002
Figure 3. Framework for mapping tea plantations using dense VENμS time series data and multitemporal Sentinel-2 data.
Forests 10 00856 g003
Figure 4. Intra-annual variation in the normalized difference vegetation index (NDVI) and red–green ratio index (RGRI) for typical land cover types in the study area.
Forests 10 00856 g004
Figure 5. (a) The spatial distribution of forests; (b) the spatial distribution of the phenology of tea plantations; (c) distribution of tea plantations obtained from spatial intersection analysis. Yellow, blue, red, and green represent phenological information obtained for different dates. (a1), (b1) and (c1) are enlarged views of typical area.
Forests 10 00856 g005
Figure 6. The spatial distribution of tea plantations. (a) The location of the study area for which Sentinel imagery was used; (bd) are typical areas.
Forests 10 00856 g006
Table 1. Spectral characteristics of VENμS and Sentinel-2 satellite imagery.
VENμSSentinel-2ASentinel-2B
No.SRCWBWNo.SRCWBWCWBW
1542040160442.721442.221
2544340210492.466492.166
3549040310559.83655936
4555540410664.631664.931
5562040520704.115703.816
6562040620740.515739.115
7566730720782.820779.720
8570216810832.8106832.9106
95742168a20864.72186422
10578216960945.120943.221
1158654010601373.5311376.930
1259102011201613.7911610.494
12202202.41752185.7185
Note: No. represents band number; SR represents spatial resolution (m); CW represents central wavelength (nm); and BW represents bandwidth (nm).
Table 2. Acquisition time of VENμS data used in this research.
Acquisition DateDOY 1Acquisition DateDOYAcquisition DateDOYAcquisition DateDOY
29-Jan2911-Apr10110-Jul19128-Oct301
2-Feb3315-Apr10514-Jul19530-Oct303
4-Feb3517-Apr10726-Jul2071-Nov305
6-Feb3719-Apr10928-Jul2099-Nov313
8-Feb3929-Apr1195-Aug21713-Nov317
12-Feb433-May1237-Aug21927-Nov331
26-Feb5717-May13723-Aug23529-Nov333
28-Mar8714-Jun16529-Aug2411-Dec335
3-Apr9318-Jun16912-Oct28517-Dec351
9-Apr9926-Jun17724-Oct29719-Dec353
1 DOY means day of year.
Table 3. Accuracy assessment of tea plantation mapping based on VENμS imagery.
Classified DataTea PlantationOthersProducer’s Accuracy (%)User’s Accuracy (%)Overall Accuracy (%)
Tea plantation282129495.995
Others182889694.1

