Mapping the Spatial Distribution of Tea Plantations Using High-Spatiotemporal-Resolution Imagery in Northern Zhejiang, China
Abstract
:1. Introduction
2. Materials and Methods
2.1. Study Area
2.2. Data Collection and Preprocessing
2.3. VENμS-Based Spectral and Phenological Analyses
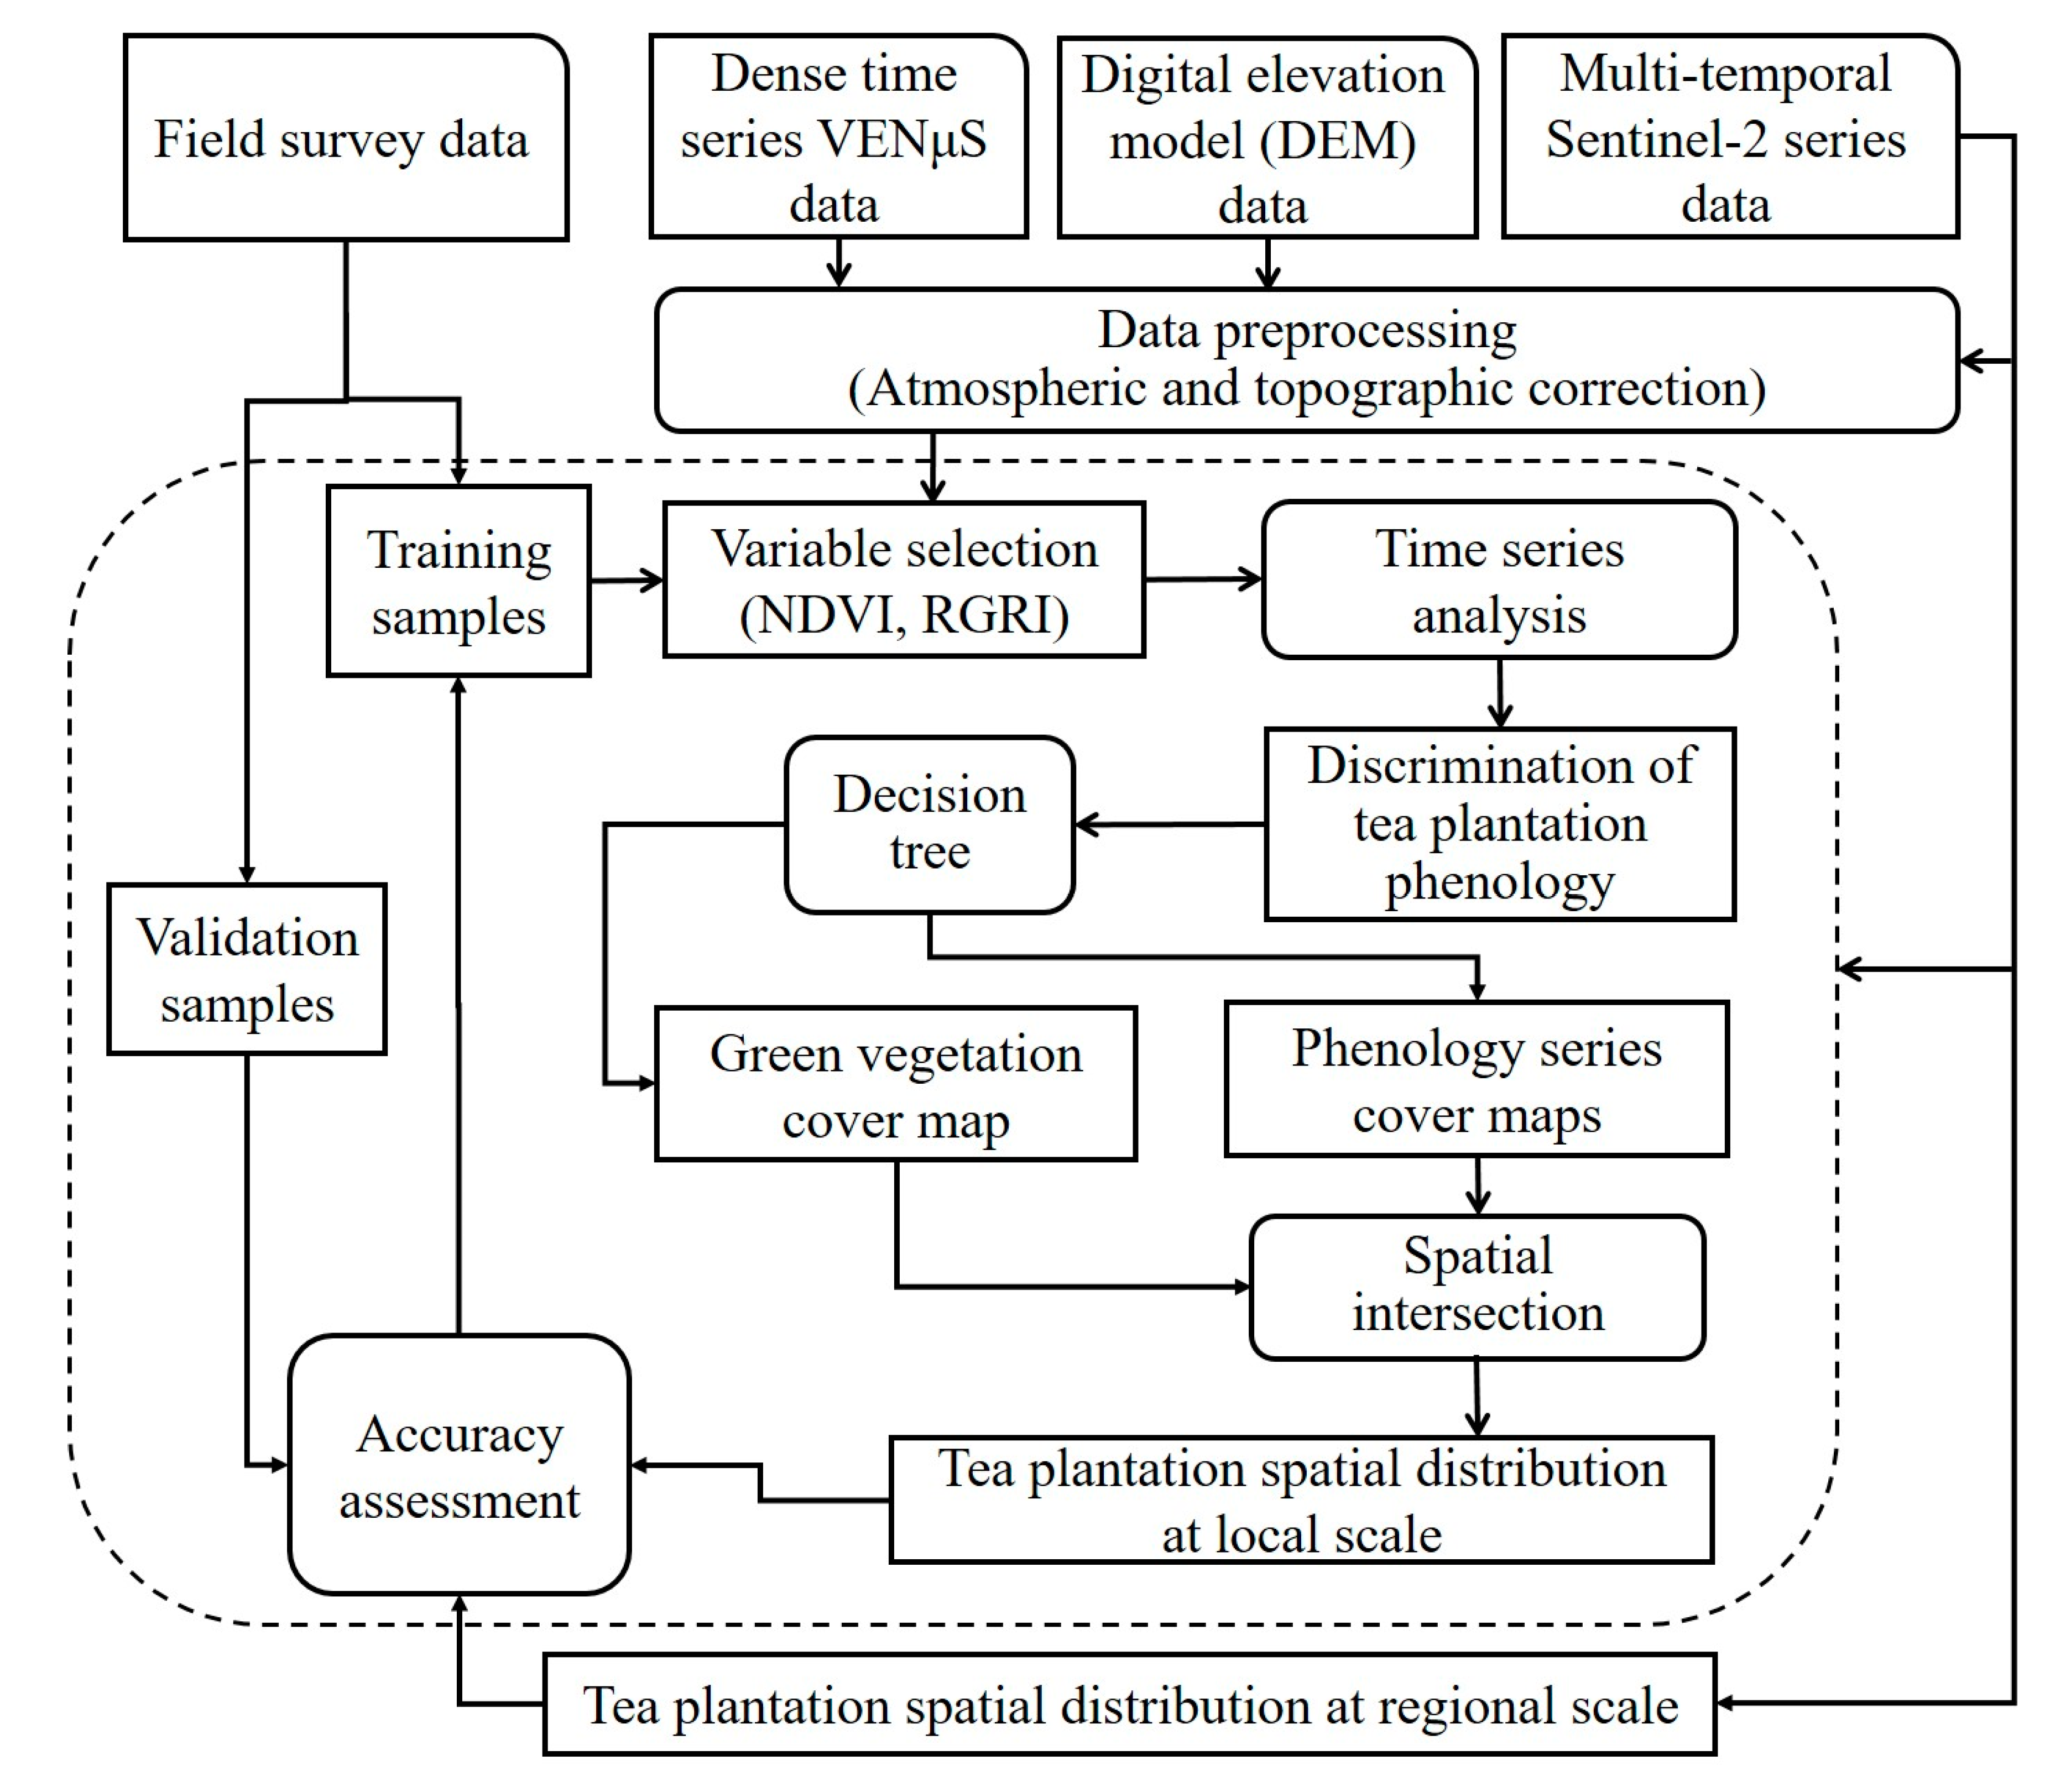
2.4. Mapping the Spatial Distribution of Tea Plantations
2.5. Accuracy Assessment
3. Results
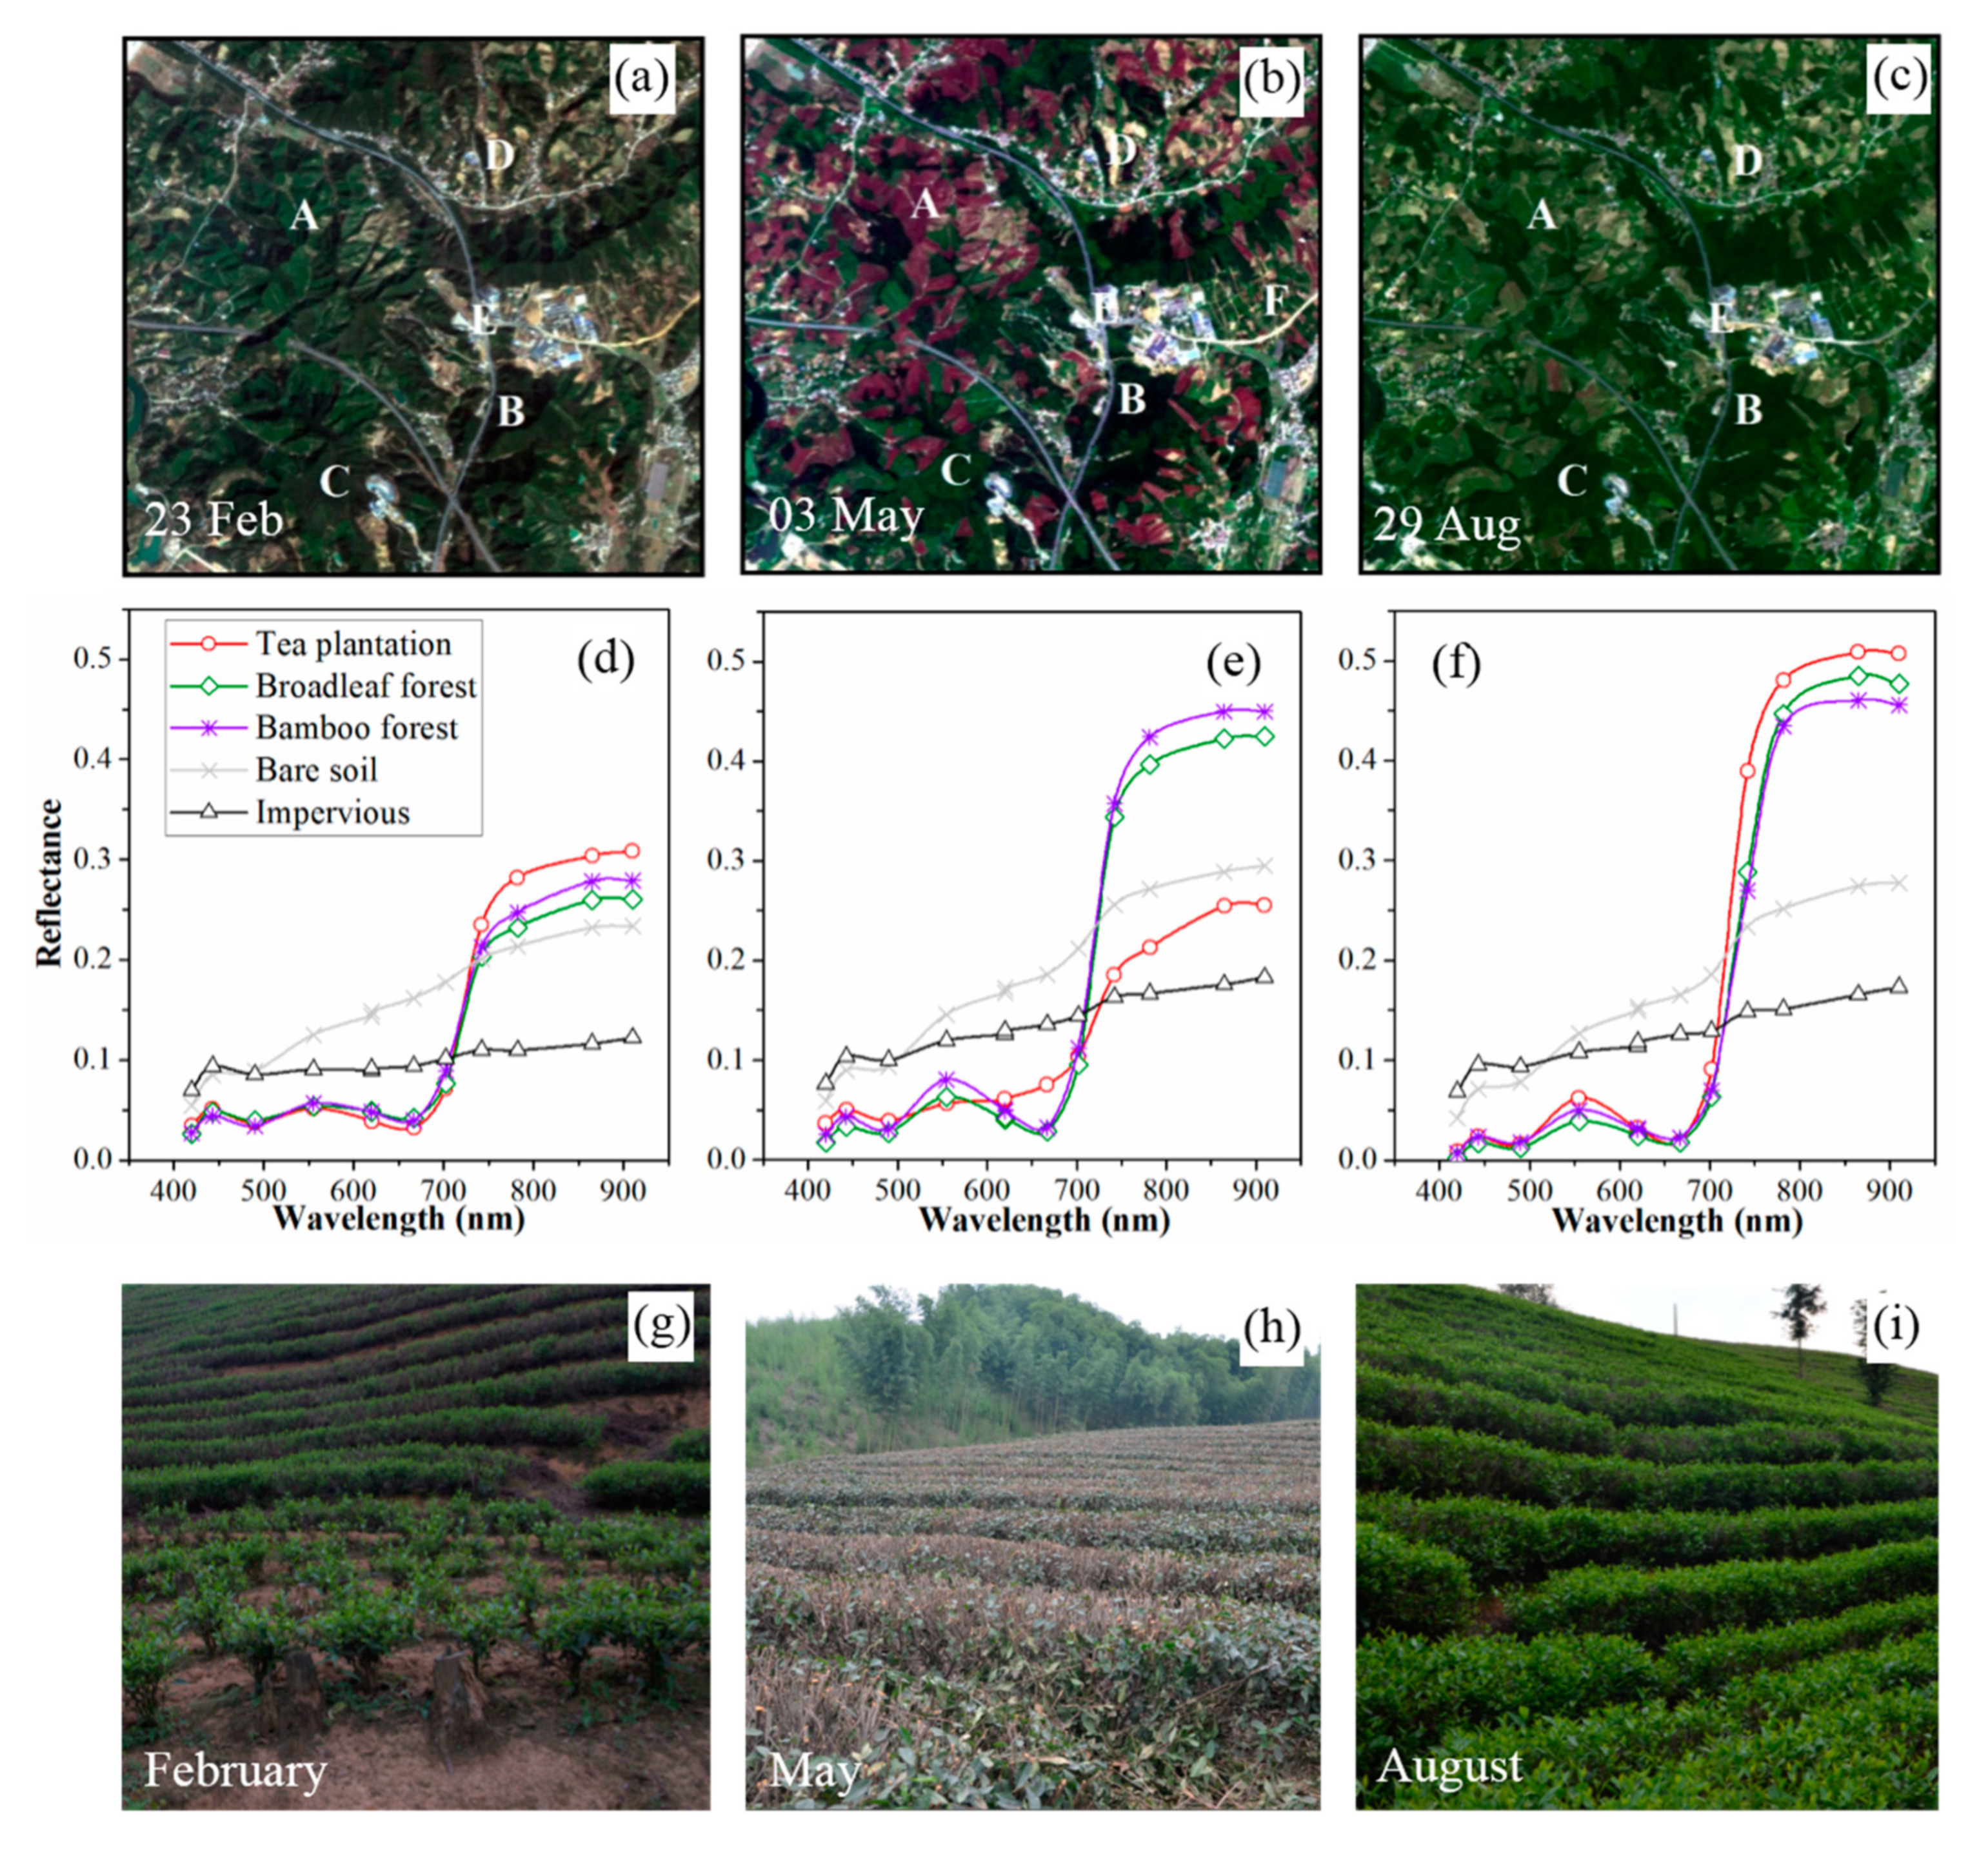
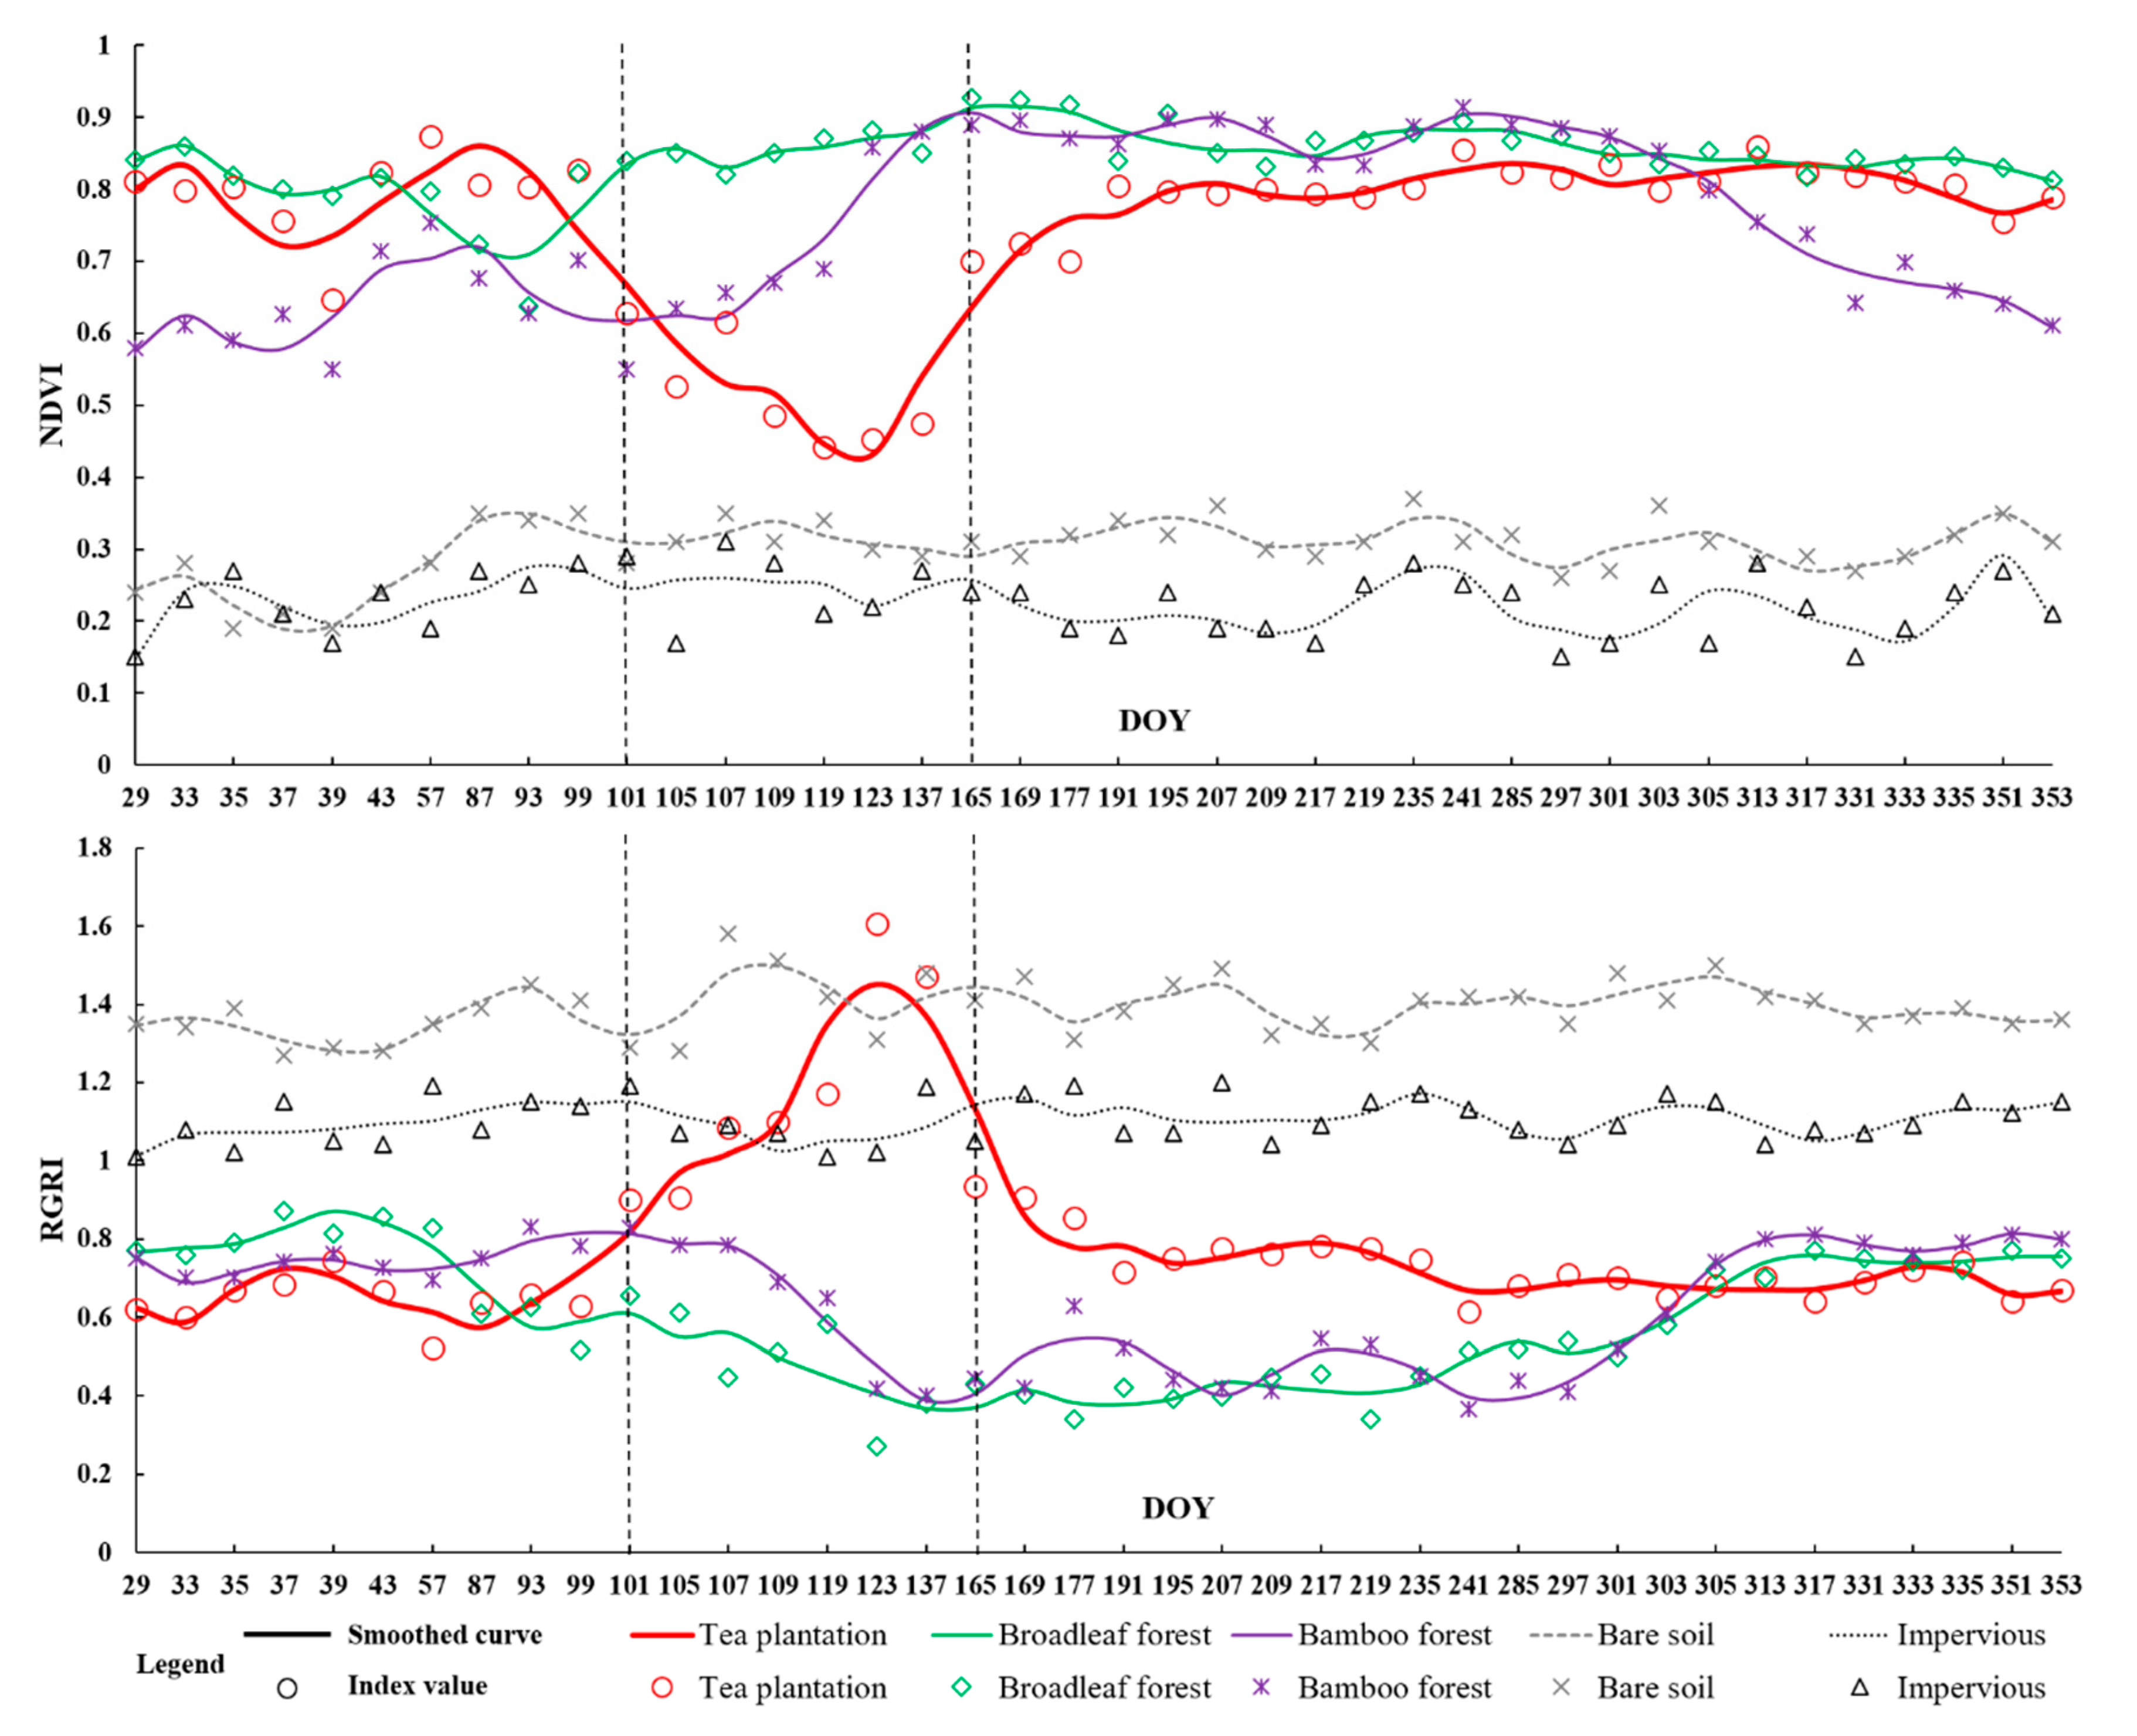
3.1. The Phenology of Tea Plantations and Its Potential for Mapping
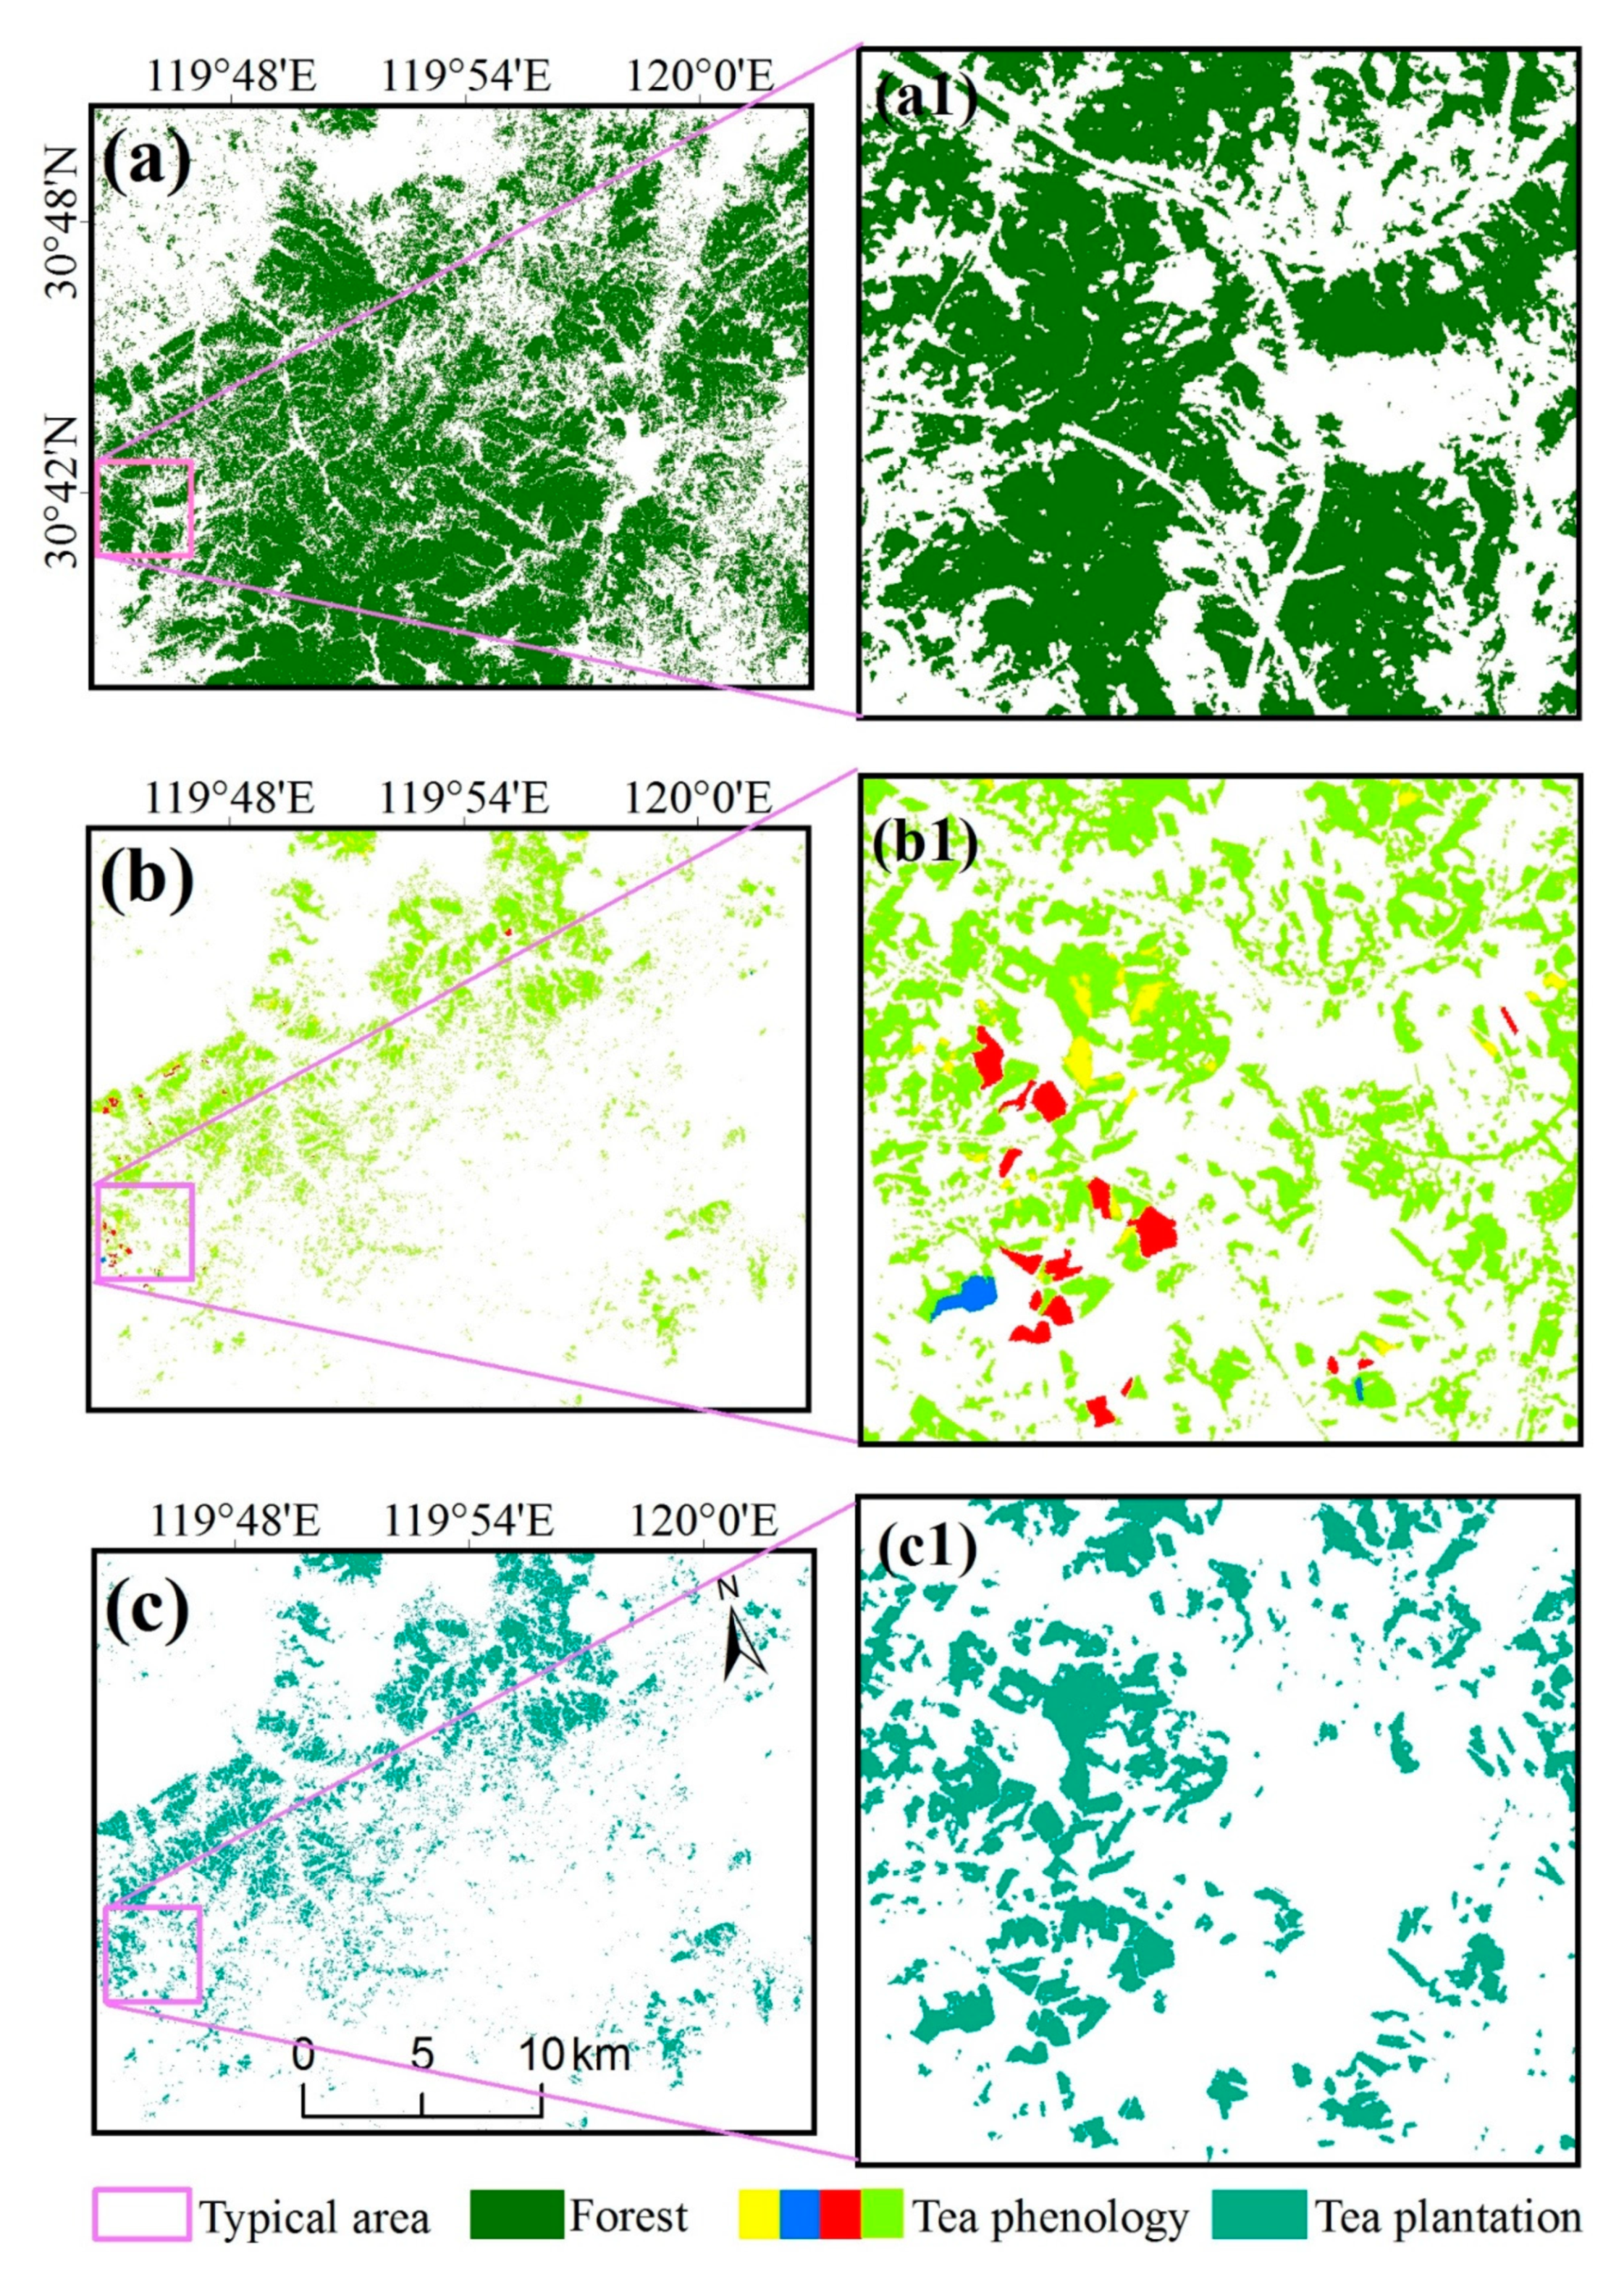
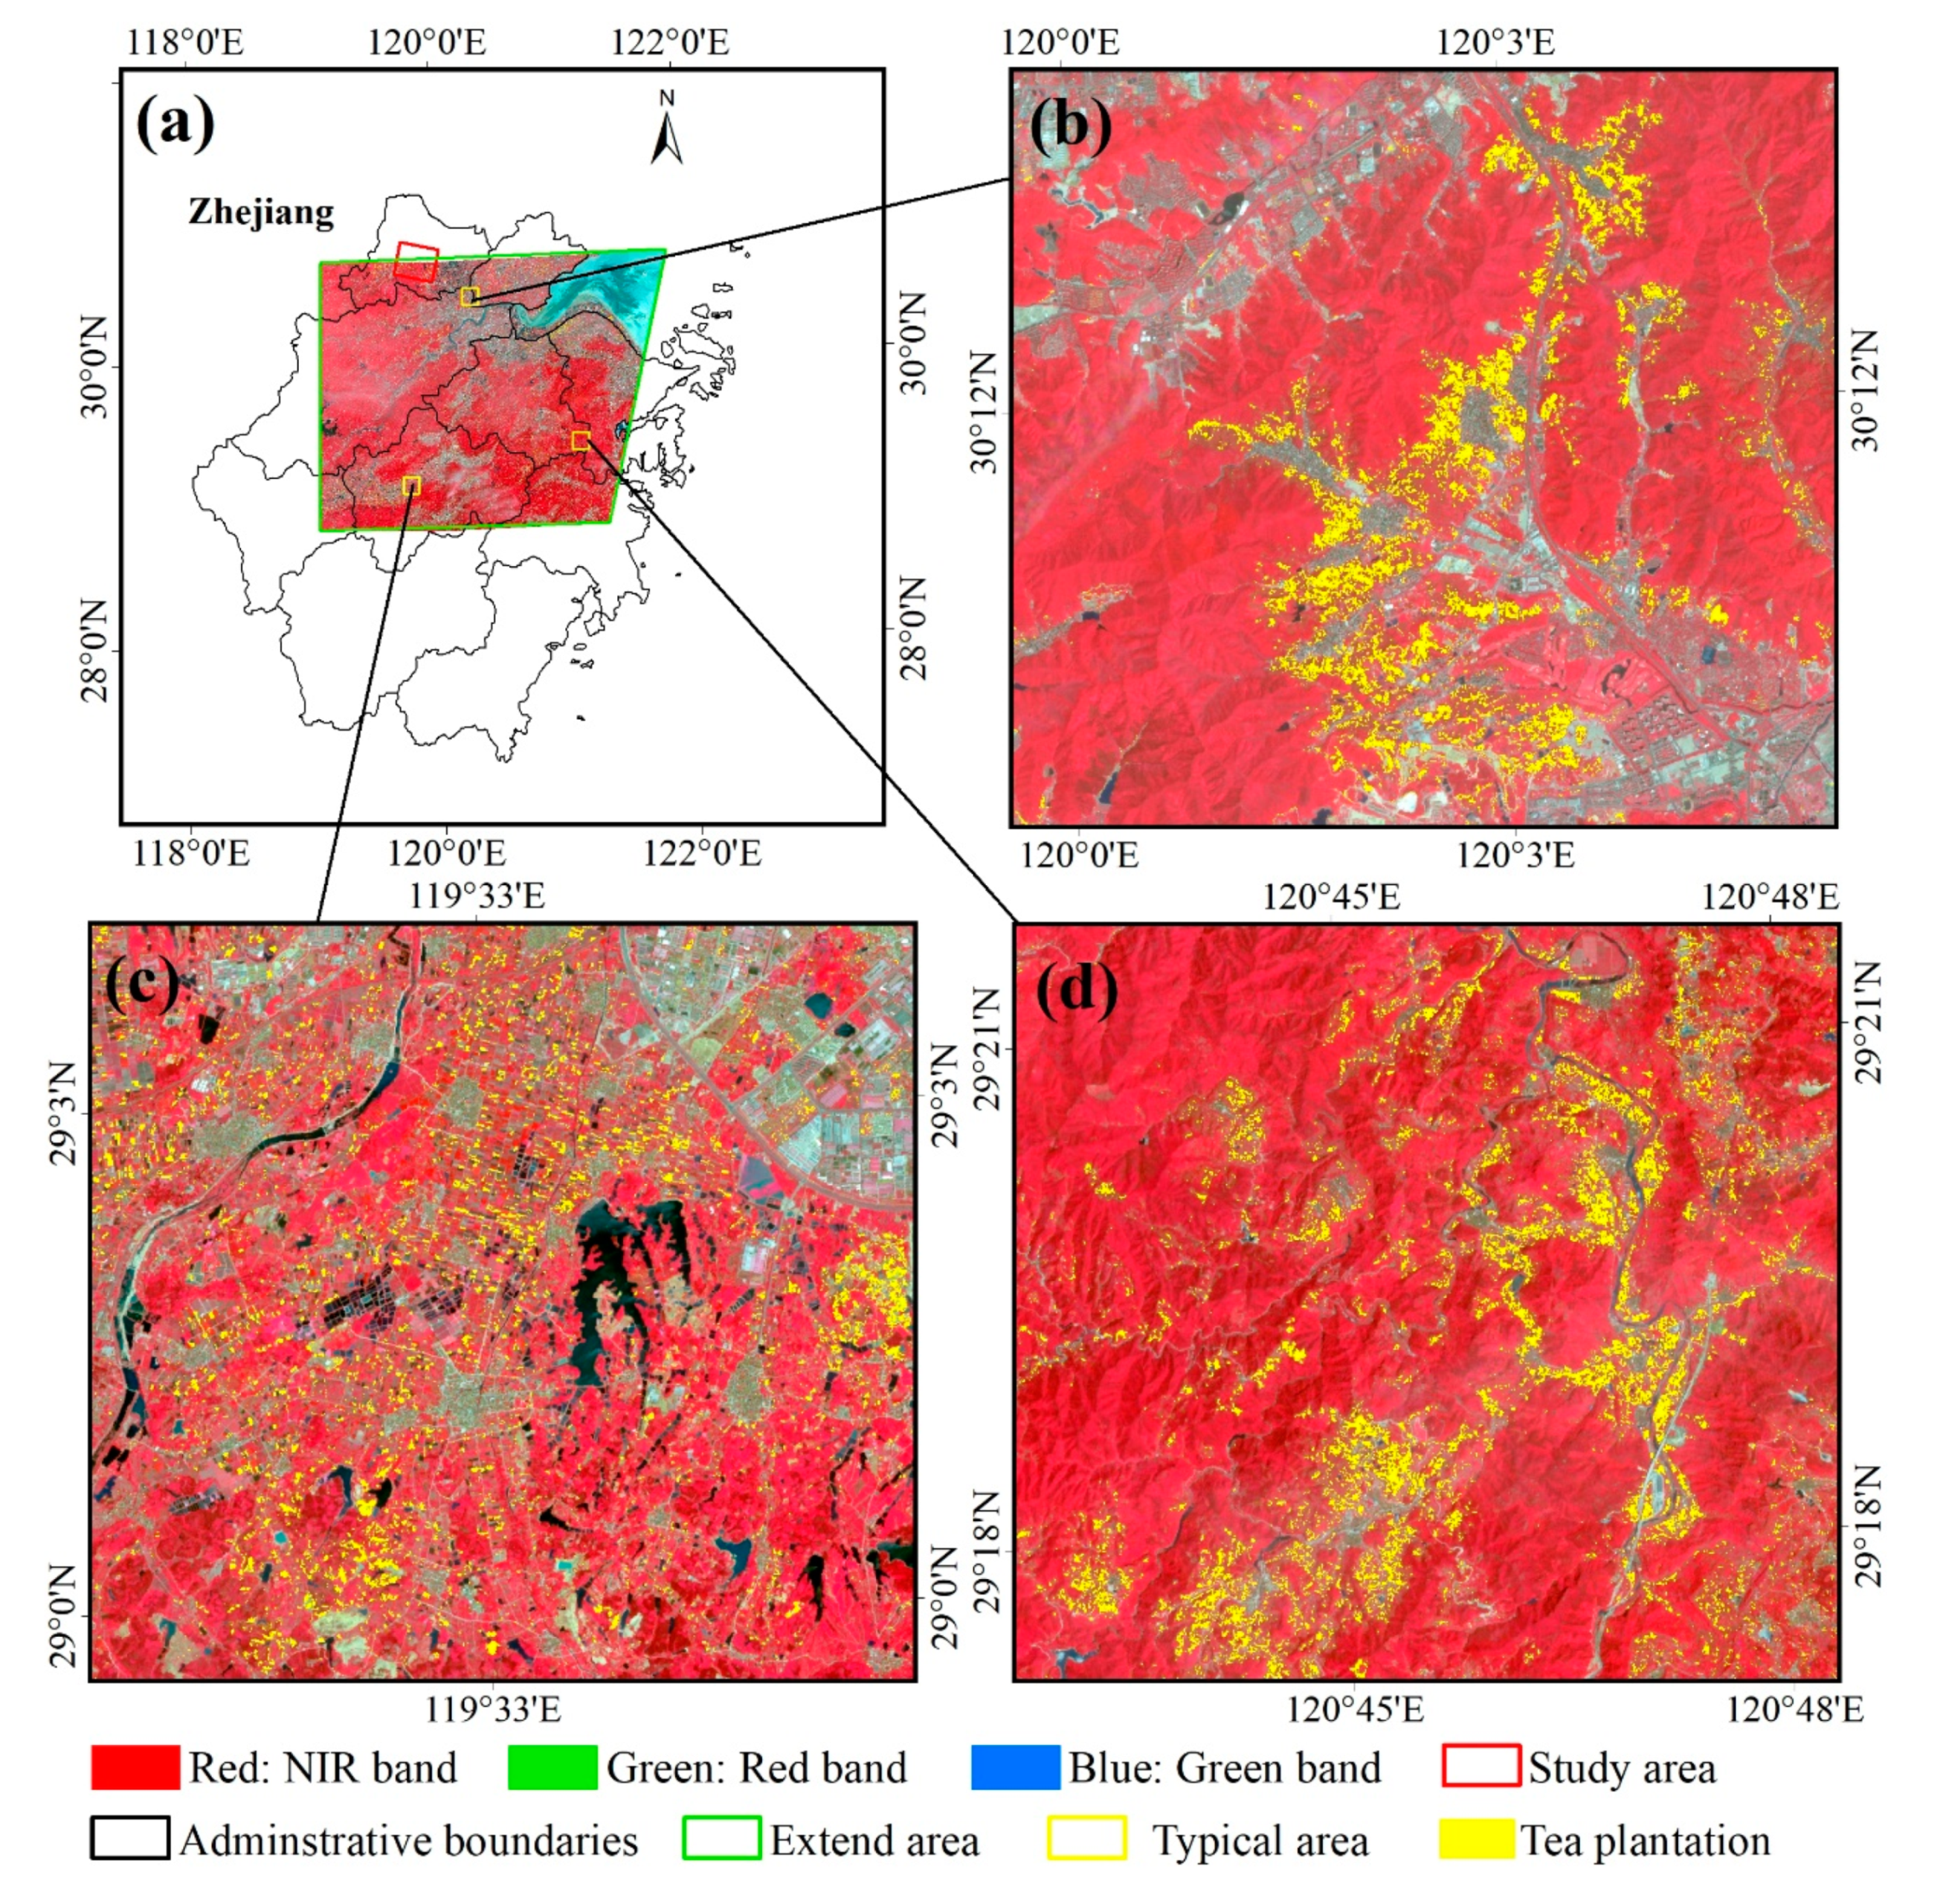
3.2. Mapping of Tea Plantations Based on VENμS Imagery at a Local Scale
3.3. Mapping of Tea Plantations Based on Sentinel-2 Imagery at a Regional Scale
4. Discussion
4.1. Phenological Periods of the Tea Plantations
4.2. Dataset Selection for Tea Plantation Mapping
4.3. Applicability and Uncertainty Analysis
5. Conclusions
Author Contributions
Funding
Acknowledgments
Conflicts of Interest
References
- Gunathilaka, R.D.; Tularam, G.A. The tea industry and a review of its price modelling in major tea producing countries. J. Manag. Strategy 2016, 7, 21. [Google Scholar] [CrossRef]
- FAOSTAT Home Page. Available online: http://www.fao.org/faostat/en/?# (accessed on 5 December 2018).
- Su, S.; Wan, C.; Li, J.; Jin, X.; Pi, J.; Zhang, Q.; Weng, M. Economic benefit and ecological cost of enlarging tea cultivation in subtropical china: Characterizing the trade-off for policy implications. Land Use Policy 2017, 66, 183–195. [Google Scholar] [CrossRef]
- Chu, H.; Wang, C.; Kong, S.; Chen, K. Integration of full-waveform lidar and hyperspectral data to enhance tea and areca classification. GISci. Remote Sens. 2016, 53, 542–559. [Google Scholar] [CrossRef]
- Xu, W.; Qin, Y.; Xiao, X.; Di, G.; Doughty, R.B.; Zhou, Y.; Zou, Z.; Kong, L.; Niu, Q.; Kou, W. Quantifying spatial-temporal changes of tea plantations in complex landscapes through integrative analyses of optical and microwave imagery. Int. J. Appl. Earth Obs. Geoinform. 2018, 73, 697–711. [Google Scholar] [CrossRef]
- Dihkan, M.; Guneroglu, N.; Karsli, F.; Guneroglu, A. Remote sensing of tea plantations using an svm classifier and pattern-based accuracy assessment technique. Int. J. Remote Sens. 2013, 34, 8549–8565. [Google Scholar] [CrossRef]
- Huang, X.; Zhu, Z.; Li, Y.; Wu, B.; Yang, M. Tea garden detection from high-resolution imagery using a scene-based framework. Photogramm. Eng. Remote Sens. 2018, 84, 723–731. [Google Scholar] [CrossRef]
- Dong, J.; Xiao, X.; Chen, B.; Torbick, N.; Jin, C.; Zhang, G.; Biradar, C. Mapping deciduous rubber plantations through integration of palsar and multi-temporal landsat imagery. Remote Sens. Environ. 2013, 134, 392–402. [Google Scholar] [CrossRef]
- Wang, Y.; Lu, D. Mapping torreya grandis spatial distribution using high spatial resolution satellite imagery with the expert rules-based approach. Remote Sens. 2017, 9, 564. [Google Scholar] [CrossRef]
- Xi, Z.; Lu, D.; Liu, L.; Ge, H. Detection of drought-induced hickory disturbances in western Lin An county, China, using multitemporal landsat imagery. Remote Sens. 2016, 8, 345. [Google Scholar] [CrossRef]
- Li, N.; Lu, D.; Wu, M.; Zhang, Y.; Lu, L. Coastal wetland classification with multiseasonal high-spatial resolution satellite imagery. Int. J. Remote Sens. 2018, 39, 1–21. [Google Scholar] [CrossRef]
- Xie, Z.; Chen, Y.; Lu, D.; Li, G.; Chen, E. Classification of land cover, forest, and tree species classes with ziyuan-3 multispectral and stereo data. Remote Sens. 2019, 11, 164. [Google Scholar] [CrossRef]
- Su, S.; Yang, C.; Hu, Y.; Luo, F.; Wang, Y. Progressive landscape fragmentation in relation to cash crop cultivation. Appl. Geogr. 2014, 53, 20–31. [Google Scholar] [CrossRef]
- Ganguly, S.; Friedl, M.A.; Tan, B.; Zhang, X.; Verma, M. Land surface phenology from modis: Characterization of the collection 5 global land cover dynamics product. Remote Sens. Environ. 2010, 114, 1805–1816. [Google Scholar] [CrossRef]
- Chen, Y.; Lu, D.; Luo, L.; Pokhrel, Y.; Deb, K.; Huang, J.; Ran, Y. Detecting irrigation extent, frequency, and timing in a heterogeneous arid agricultural region using modis time series, landsat imagery, and ancillary data. Remote Sens. Environ. 2018, 204, 197–211. [Google Scholar] [CrossRef]
- Zhang, X.; Friedl, M.A.; Schaaf, C.B.; Strahler, A.H.; Hodges, J.C.F.; Gao, F.; Reed, B.C.; Huete, A. Monitoring vegetation phenology using modis. Remote Sens. Environ. 2003, 84, 471–475. [Google Scholar] [CrossRef]
- Melaas, E.K.; Friedl, M.A.; Zhu, Z. Detecting interannual variation in deciduous broadleaf forest phenology using landsat tm/etm+ data. Remote Sens. Environ. 2013, 132, 176–185. [Google Scholar] [CrossRef]
- Fisher, J.I.; Mustard, J.F.; Vadeboncoeur, M.A. Green leaf phenology at landsat resolution: Scaling from the field to the satellite. Remote Sens. Environ. 2005, 100, 265–279. [Google Scholar] [CrossRef]
- Drusch, M.; Bello, U.D.; Carlier, S.; Colin, O.; Fernandez, V.; Gascon, F.; Hoersch, B.; Isola, C.; Laberinti, P.; Martimort, P. Sentinel-2: Esa’s optical high-resolution mission for gmes operational services. Remote Sens. Environ. 2012, 120, 25–36. [Google Scholar] [CrossRef]
- Ferrier, P.; Crebassol, P.; Dedieu, G.; Hagolle, O.; Meygret, A.; Francesc, T.; Yoram, Y.; Jacob, H. Venµs (vegetation and environment monitoring on a new micro satellite). In Proceedings of the 2010 IEEE International Geoscience and Remote Sensing Symposium, Honolulu, HI, USA, 25–30 July 2010. [Google Scholar]
- Jacob, H.; Appel, L.; Barnett, D.L.; Baron, D.M.; Davidson, A.; Gontmacher, P. Venµs—A novel technological mission using electric propulsion. In Proceedings of the 35th International Electric Propulsion Conference, Atlanta, GA, USA, 8–12 October 2017. [Google Scholar]
- Hagolle, O.; Dedieu, G.; Mougenot, B.; Debaecker, V.; Duchemin, B.; Meygret, A. Correction of aerosol effects on multi-temporal images acquired with constant viewing angles: Application to formosat-2 images. Remote Sens. Environ. 2007, 112, 1689–1701. [Google Scholar] [CrossRef]
- Hagolle, O.; Huc, M.; Pascual, D.V.; Dedieu, G. A multi-temporal method for cloud detection, applied to formosat-2, venµs, landsat and sentinel-2 images. Remote Sens. Environ. 2010, 114, 1747–1755. [Google Scholar] [CrossRef]
- Huang, S. Meteorology of the tea plant in china: A review. Agric. For. Meteorol. 1989, 47, 19–30. [Google Scholar] [CrossRef]
- Leyser, O. The fall and rise of apical dominance. Curr. Opin. Genet. Dev. 2005, 15, 468–471. [Google Scholar] [CrossRef] [PubMed]
- Rouse, J.W.J.; Haas, R.H.; Schell, J.A.; Deering, D.W. Monitoring vegetation systems in the great plains with erts. NTRS 1974, 351, 309. [Google Scholar]
- Lee, R.; Yu, F.; Price, K.P.; Ellis, J.; Shi, P. Evaluating vegetation phenological patterns in inner mongolia using ndvi time-series analysis. Int. J. Remote Sens. 2002, 23, 2505–2512. [Google Scholar] [CrossRef]
- Nathalie, P.; Olav, V.J.; Atle, M.; Jean-Michel, G.; Compton, J.T.; Nils, C.S. Using the satellite-derived ndvi to assess ecological responses to environmental change. Trends Ecol. Evol. 2006, 20, 503–510. [Google Scholar]
- Estel, S.; Kuemmerle, T.; Alcántara, C.; Levers, C.; Prishchepov, A.; Hostert, P. Mapping farmland abandonment and recultivation across europe using modis ndvi time series. Remote Sens. Environ. 2015, 163, 312–325. [Google Scholar] [CrossRef]
- Verrelst, J.; Schaepman, M.E.; Koetz, B.; Kneubühler, M. Angular sensitivity analysis of vegetation indices derived from chris/proba data. Remote Sens. Environ. 2008, 112, 2341–2353. [Google Scholar] [CrossRef]
- Ritchie, G.L.; Sullivan, D.G.; Vencill, W.K.; Bednarz, C.W.; Hook, J.E. Sensitivities of normalized difference vegetation index and a green/red ratio index to cotton ground cover fraction. Crop Sci. 2010, 50, 1000–1010. [Google Scholar] [CrossRef]
- Motohka, T.; Nasahara, K.N.; Oguma, H.; Tsuchida, S. Applicability of green-red vegetation index for remote sensing of vegetation phenology. Remote Sens. 2010, 2, 2369–2387. [Google Scholar] [CrossRef]
- Savitzky, A.; Golay, M.J.E. Smoothing and differentiation of data by simplified least squares procedures. Anal. Chem. 1964, 36, 1627–1639. [Google Scholar] [CrossRef]
- Foody, G.M. Status of land cover classification accuracy assessment. Remote Sens. Environ. 2002, 80, 185–201. [Google Scholar] [CrossRef]
- Lou, W.; Sun, S.; Wu, L.; Sun, K. Effects of climate change on the economic output of the longjing-43 tea tree, 1972–2013. Int. J. Biometeorol. 2015, 59, 593–603. [Google Scholar] [CrossRef] [PubMed]
- Li, G.; Lu, D.; Moran, E.; Calvi, M.F.; Dutra, L.V.; Batistella, M. Examining deforestation and agropasture dynamics along the brazilian transamazon highway using multitemporal landsat imagery. GISci. Remote Sens. 2019, 56, 1–23. [Google Scholar] [CrossRef]
- Gao, Y.; Lu, D.; Li, G.; Wang, G.; Qi, C.; Liu, L.; Li, D. Comparative analysis of modeling algorithms for forest aboveground biomass estimation in a subtropical region. Remote Sens. 2018, 10, 627. [Google Scholar] [CrossRef]
- Li, L.; Li, N.; Lu, D.; Chen, Y. Mapping Moso bamboo forest and its on-year and off-year distribution in a subtropical region using time-series Sentinel-2 and Landsat 8 data. Remote Sens. Environ. 2019, 231, 111265. [Google Scholar] [CrossRef]
- Fernández-Manso, A.; Fernández-Manso, O.; Quintano, C. SENTINEL-2A red-edge spectral indices suitability for discriminating burn severity. Int. J. Appl. Earth Obs. Geoinform. 2016, 50, 170–175. [Google Scholar] [CrossRef]
- Sibanda, M.; Mutanga, O.; Rouget, M. Testing the capabilities of the new WorldView-3 space-borne sensor’s red-edge spectral band in discriminating and mapping complex grassland management treatments. Int. J. Remote Sens. 2017, 38, 1–22. [Google Scholar] [CrossRef]
- Forkuor, G.; Dimobe, K.; Serme, I.; Tondoh, J.E. Landsat-8 vs. Sentinel-2: Examining the added value of sentinel-2’s red-edge bands to land-use and land-cover mapping in Burkina Faso. GISci. Remote Sens. 2018, 55, 331–354. [Google Scholar] [CrossRef]
- Lou, W.; Sun, K.; Sun, S.; Ma, F.; Wang, D. Changes in pick beginning date and frost damage risk of tea tree in longjing tea-producing area. Theor. Appl. Climatol. 2013, 114, 115–123. [Google Scholar] [CrossRef]

| VENμS | Sentinel-2A | Sentinel-2B | |||||||
|---|---|---|---|---|---|---|---|---|---|
| No. | SR | CW | BW | No. | SR | CW | BW | CW | BW |
| 1 | 5 | 420 | 40 | 1 | 60 | 442.7 | 21 | 442.2 | 21 |
| 2 | 5 | 443 | 40 | 2 | 10 | 492.4 | 66 | 492.1 | 66 |
| 3 | 5 | 490 | 40 | 3 | 10 | 559.8 | 36 | 559 | 36 |
| 4 | 5 | 555 | 40 | 4 | 10 | 664.6 | 31 | 664.9 | 31 |
| 5 | 5 | 620 | 40 | 5 | 20 | 704.1 | 15 | 703.8 | 16 |
| 6 | 5 | 620 | 40 | 6 | 20 | 740.5 | 15 | 739.1 | 15 |
| 7 | 5 | 667 | 30 | 7 | 20 | 782.8 | 20 | 779.7 | 20 |
| 8 | 5 | 702 | 16 | 8 | 10 | 832.8 | 106 | 832.9 | 106 |
| 9 | 5 | 742 | 16 | 8a | 20 | 864.7 | 21 | 864 | 22 |
| 10 | 5 | 782 | 16 | 9 | 60 | 945.1 | 20 | 943.2 | 21 |
| 11 | 5 | 865 | 40 | 10 | 60 | 1373.5 | 31 | 1376.9 | 30 |
| 12 | 5 | 910 | 20 | 11 | 20 | 1613.7 | 91 | 1610.4 | 94 |
| 12 | 20 | 2202.4 | 175 | 2185.7 | 185 | ||||
| Acquisition Date | DOY 1 | Acquisition Date | DOY | Acquisition Date | DOY | Acquisition Date | DOY |
|---|---|---|---|---|---|---|---|
| 29-Jan | 29 | 11-Apr | 101 | 10-Jul | 191 | 28-Oct | 301 |
| 2-Feb | 33 | 15-Apr | 105 | 14-Jul | 195 | 30-Oct | 303 |
| 4-Feb | 35 | 17-Apr | 107 | 26-Jul | 207 | 1-Nov | 305 |
| 6-Feb | 37 | 19-Apr | 109 | 28-Jul | 209 | 9-Nov | 313 |
| 8-Feb | 39 | 29-Apr | 119 | 5-Aug | 217 | 13-Nov | 317 |
| 12-Feb | 43 | 3-May | 123 | 7-Aug | 219 | 27-Nov | 331 |
| 26-Feb | 57 | 17-May | 137 | 23-Aug | 235 | 29-Nov | 333 |
| 28-Mar | 87 | 14-Jun | 165 | 29-Aug | 241 | 1-Dec | 335 |
| 3-Apr | 93 | 18-Jun | 169 | 12-Oct | 285 | 17-Dec | 351 |
| 9-Apr | 99 | 26-Jun | 177 | 24-Oct | 297 | 19-Dec | 353 |
| Classified Data | Tea Plantation | Others | Producer’s Accuracy (%) | User’s Accuracy (%) | Overall Accuracy (%) |
|---|---|---|---|---|---|
| Tea plantation | 282 | 12 | 94 | 95.9 | 95 |
| Others | 18 | 288 | 96 | 94.1 |
© 2019 by the authors. Licensee MDPI, Basel, Switzerland. This article is an open access article distributed under the terms and conditions of the Creative Commons Attribution (CC BY) license (http://creativecommons.org/licenses/by/4.0/).
Share and Cite
Li, N.; Zhang, D.; Li, L.; Zhang, Y. Mapping the Spatial Distribution of Tea Plantations Using High-Spatiotemporal-Resolution Imagery in Northern Zhejiang, China. Forests 2019, 10, 856. https://doi.org/10.3390/f10100856
Li N, Zhang D, Li L, Zhang Y. Mapping the Spatial Distribution of Tea Plantations Using High-Spatiotemporal-Resolution Imagery in Northern Zhejiang, China. Forests. 2019; 10(10):856. https://doi.org/10.3390/f10100856
Chicago/Turabian StyleLi, Nan, Dong Zhang, Longwei Li, and Yinlong Zhang. 2019. "Mapping the Spatial Distribution of Tea Plantations Using High-Spatiotemporal-Resolution Imagery in Northern Zhejiang, China" Forests 10, no. 10: 856. https://doi.org/10.3390/f10100856
APA StyleLi, N., Zhang, D., Li, L., & Zhang, Y. (2019). Mapping the Spatial Distribution of Tea Plantations Using High-Spatiotemporal-Resolution Imagery in Northern Zhejiang, China. Forests, 10(10), 856. https://doi.org/10.3390/f10100856


