Effects of Thinning on Microbial Community Structure in the Organic Horizon of Chinese Pine Plantations in Badaling, Beijing, China

Abstract
:1. Introduction
2. Materials and Methods
2.1. Study Area
2.2. Experimental Design and Sample
- Control plots with no thinning (henceforth, T0) had a typical stand density of 1600 individuals hm−1;
- Low-intensity thinning (10% of the trees removed, henceforth T10) created plots with a density of 1440 individuals hm−1;
- Medium-intensity thinning (20% of the trees removed, henceforth T20) created plots with a density of 1280 individuals hm−1;
- High-intensity thinning (50% of the trees removed, henceforth T50) created plots with a density of 800 individuals hm−1.
2.3. Laboratory Analysis
2.3.1. Chemical Properties
2.3.2. Microbial Community Structure
2.4. Statistical Analysis
3. Results
3.1. Plant Characteristics
3.2. Litter Mass and Chemical Characteristics
3.3. Litter Microbial Communities
Diversity of Litter PLFA
3.4. Composition of Litter Microbial Community Structure
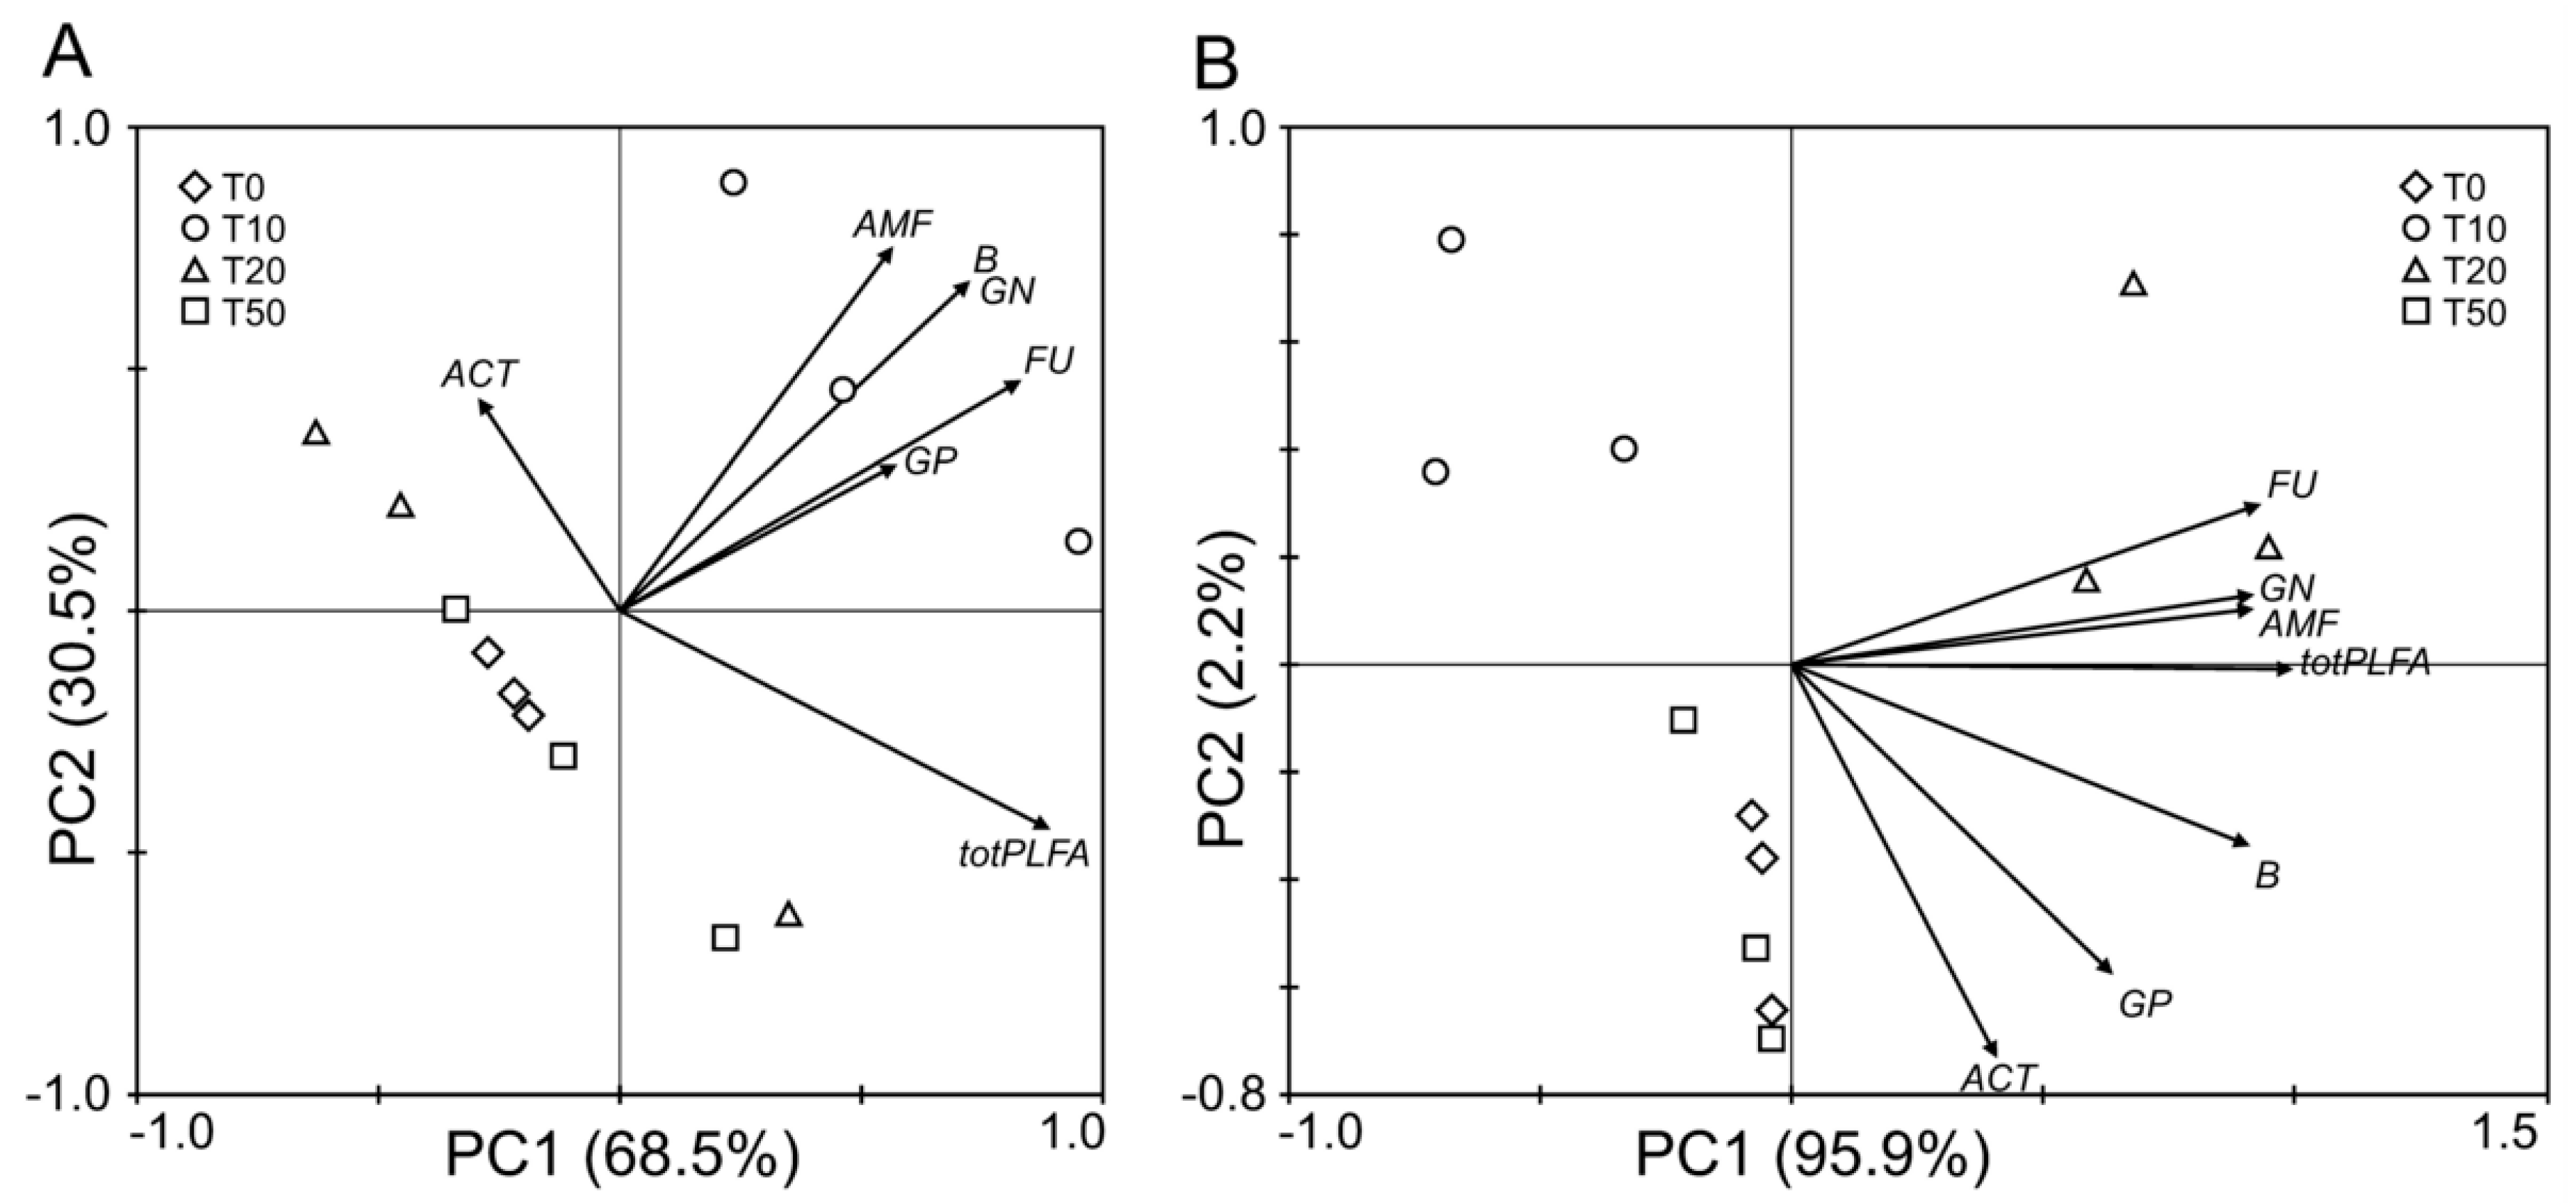
3.5. PCA Analysis of Litter Microbial Community Structure
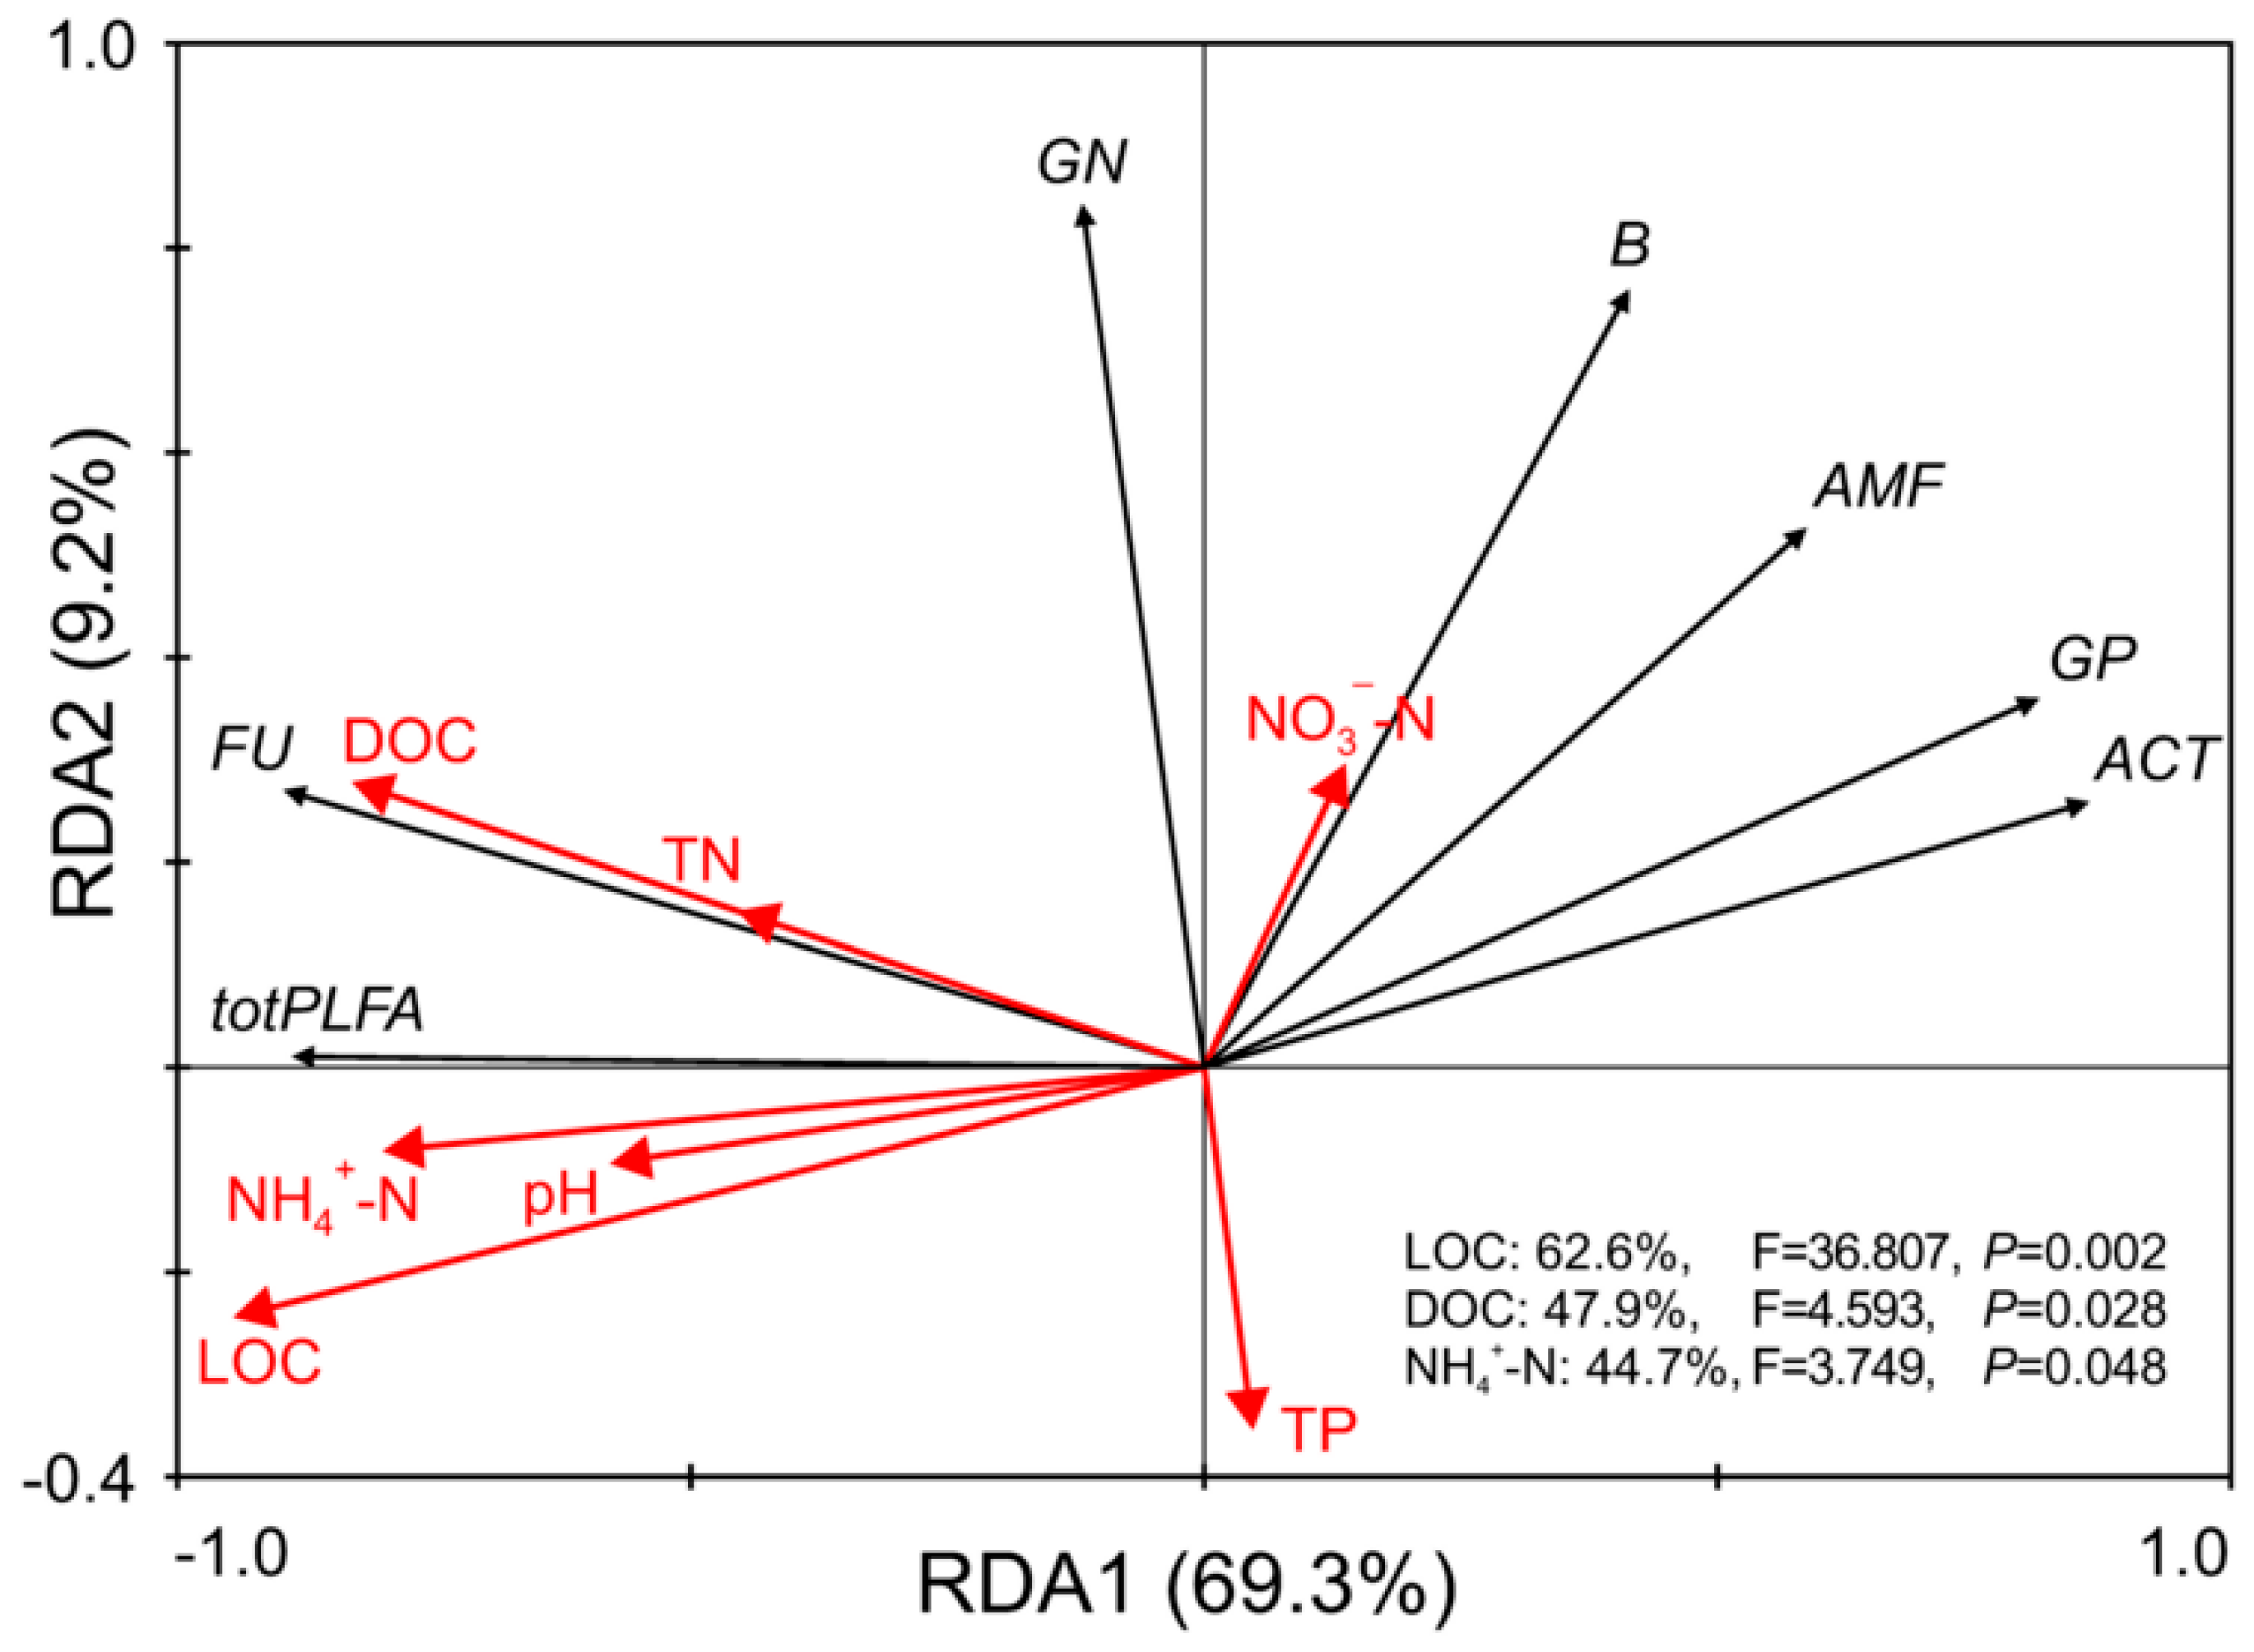
3.6. Relationships between Litter Chemical Properties and Microbial Communities
4. Discussion
4.1. Change Tendencies of Microbial Communities due to Thinning
4.2. The Effects of Organic Layer Changes on Microbial Community Structure
4.3. Factors Associated with the Microbial Community Variation
5. Conclusions
- One year after thinning, the richness and Shannon index of understory vegetation both increased with increasing thinning intensity.
- Low-intensity and medium-intensity thinning led to increases in the abundance of gram-negative bacteria, total bacteria, and fungi, and resulted in a decrease in the abundance of actinobacteria, while the abundance of arbuscular mycorrhizal fungi was only increased by medium-intensity thinning. The influences of different thinning intensities on microbial communities were more distinct in the semi-decomposed layer. Furthermore, the abundances of total PLFAs and fungi were higher in undecomposed organic layers, while the abundances of gram-positive bacteria, gram-negative bacteria, total bacteria, actinobacteria, and arbuscular mycorrhizal fungi were higher in the semi-decomposed layer.
- In the litter substrate, the litter contents of organic carbon, dissolved organic carbon, and ammonium nitrogen were determined to be primarily responsible for changes in microbial community structure.
Author Contributions
Funding
Acknowledgments
Conflicts of Interest
References
- Yang, T.R.; Lam, T.Y.; Kershaw, J.A., Jr. Developing relative stand density index for structurally complex mixed species cypress and pine forests. For. Ecol. Manag. 2018, 409, 425–433. [Google Scholar] [CrossRef]
- Padilha, D.L.; Júnior, P.D.M. A gap in the woods: Wood density knowledge as impediment to develop sustainable use in Atlantic Forest. For. Ecol. Manag. 2018, 424, 448–457. [Google Scholar] [CrossRef]
- Flathers, K.N.; Kolb, T.E.; Bradford, J.B.; Waring, K.M.; Moser, W.K. Long-term thinning alters ponderosa pine reproduction in northern Arizona. For. Ecol. Manag. 2016, 374, 154–165. [Google Scholar] [CrossRef]
- Razafindrabe, B.H.N.; He, B.; Inoue, S.; Ezaki, T.; Shaw, R. The role of forest stand density in controlling soil erosion: Implications to sediment-related disasters in Japan. Environ. Monit. Assess. 2010, 160, 337–354. [Google Scholar] [CrossRef] [PubMed]
- Öbayram, A.K.; Emrah Çiçek, E. Thinning experiments in narrow-leaved ash (Fraxinus angustifolia Vahl.) plantations: 10-year results. New For. 2018, 49, 585–598. [Google Scholar] [CrossRef]
- Rentini, C.P.; Campanello, P.I.; Villagra, M.; Ritter, L.; Ares, A.; Goldstein, G. Thinning of loblolly pine plantations in subtropical Argentina: Impact on microclimate and understory vegetation. For. Ecol. Manag. 2017, 384, 236–247. [Google Scholar] [CrossRef]
- Chase, C.W.; Kimsey, M.J.; Shaw, T.M.; Coleman, M.D. The response of light, water, and nutrient availability to pre-commercial thinning in dry inland Douglas-fir forests. For. Ecol. Manag. 2016, 363, 98–109. [Google Scholar] [CrossRef]
- Park, J.; Kimb, T.; Moonc, M.; Chod, S.; Ryua, D.; Kim, H.S. Effects of thinning intensities on tree water use, growth, and resultant water use efficiency of 50-year-old Pinus koraiensis forest over four years. For. Ecol. Manag. 2018, 408, 121–128. [Google Scholar] [CrossRef]
- Zhang, X.Z.; Guan, D.X.; Li, W.B.; Sun, D.; Jin, C.J.; Yuan, F.H.; Wang, A.Z.; Wu, J.B. The effects of forest thinning on soil carbon stocks and dynamics: A meta-analysis. For. Ecol. Manag. 2018, 429, 36–43. [Google Scholar] [CrossRef]
- Lee, B.J.; Eo, S.H. Metagenomic approach revealed effects of forest thinning on bacterial communities in the forest soil of Mt. Janggunbong South Korea. J. Mt. Sci. 2018, 15, 59–67. [Google Scholar] [CrossRef]
- Kazuo, I.; Hiroaki, O.; Tsunehiro, W.; Ryunosuke, T.; Rieko, U.; Chao, L.; Senoo, K.; Shibata, H. High soil microbial activity in the winter season enhances nitrogen cycling in a cool-temperate deciduous forest. Soil Biol. Biochem. 2018, 124, 90–100. [Google Scholar]
- Bani, A.; Pioli, S.; Ventura, M.; Panzacchi, P.; Borruso, L.; Tognetti, R.; Tonon, G.; Brusetti, L. The role of microbial community in the decomposition of leaf litter and deadwood. Appl. Soil Ecol. 2018, 126, 75–84. [Google Scholar] [CrossRef]
- Cai, Z.; Zhang, Y.; Yang, C.; Wang, S. Land-use type strongly shapes community composition, but not always diversity of soil microbes in tropical China. Catena 2018, 165, 369–380. [Google Scholar] [CrossRef]
- Tedersoo, L.; Bahram, M.; Põlme, S.; Kõljalg, U.; Yorou, N.S.; Wijesundera, R.; Ruiz, L.V.; Vasco-Palacios, A.M.; Thu, P.Q.; Suija, A.; et al. Global diversity and geography of soil fungi. Science 2014, 346, 1256688. [Google Scholar] [CrossRef] [PubMed] [Green Version]
- Nagati, M.; Roy, M.; Manzi, S.; Richard, F.; Desrochers, A.; Gardes, M.; Bergeron, Y. Impact of local forest composition on soil fungal communities in a mixed boreal forest. Plant Soil 2018, 432, 345–357. [Google Scholar] [CrossRef]
- Wang, Q.; Wang, C.; Yu, W.; Chen, D.; Huang, Y.; Ao, J.; Jiang, Y.; Huang, Z. Effects of nitrogen and phosphorus inputs on soil bacterial abundance, diversity, and community composition in Chinese Fir plantations. Front. Microbiol. 2018, 9, 1–8. [Google Scholar] [CrossRef] [PubMed]
- Frostegård, Å.; Tunlid, A.; Bååth, E. Use and misuse of PLFA measurements in soils. Soil Biol. Biochem. 2011, 43, 1621–1625. [Google Scholar] [CrossRef]
- Miura, T.; Makoto, K.; Niwa, S.; Kaneko, N.; Sakamoto, K. Comparison of fatty acid methyl ester methods for characterization of microbial communities in forest and arable soil: Phospholipid fraction (PLFA) versus total ester linked fatty acids (EL-FAME). Pedobiologia 2017, 63, 14–18. [Google Scholar] [CrossRef]
- Leckie, S.E. Methods of microbial community profiling and their application to forest soils. For. Ecol. Manag. 2005, 220, 88–106. [Google Scholar] [CrossRef]
- Willers, C.; Rensburg, P.J.J.V.; Claassens, S. Phospholipid fatty acid profiling of microbial communities—A review of interpretations and recent applications. Appl. Microbiol. 2015, 119, 1207–1218. [Google Scholar] [CrossRef]
- Richter, A.; SchöNing, I.; Kahl, T.; Bauhus, J.; Ruess, L. Regional environmental conditions shape microbial community structure stronger than local forest management intensity. For. Ecol. Manag. 2018, 409, 250–259. [Google Scholar] [CrossRef]
- Zhou, Y.; Clark, M.; Su, J.Q.; Xiao, C.W. Litter decomposition and soil microbial community composition in three Korean pine (Pinus koraiensis) forests along an altitudinal gradient. Plant Soil. 2015, 386, 171–183. [Google Scholar] [CrossRef]
- Wilkinson, S.C.; Anderson, J.M.; Scardelis, S.P.; Tisiafouli, M.; Taylor, A.; Wolters, V. PLFA profiles of microbial communities in decomposing conifer litters subject to moisture stress. Soil Biol. Biochem. 2002, 34, 189–200. [Google Scholar] [CrossRef]
- Xu, Z.; Yu, G.; Zhang, X.; He, N.; Wang, Q.; Wang, S.; Xu, X.; Wang, R.; Zhao, N. Divergence of dominant factors in soil microbial communities and functions in forest ecosystems along a climatic gradient. Biogeosciences 2018, 15, 1217–1228. [Google Scholar] [CrossRef] [Green Version]
- Yang, B.; Pang, X.Y.; Hu, B.; Bao, W.K.; Tian, G.L. Does thinning-induced gap size result in altered soil microbial community in pine plantation in eastern Tibetan Plateau? Ecol. Evol. 2017, 7, 2986–2993. [Google Scholar] [CrossRef] [PubMed]
- Mummey, D.L.; Clarke, J.T.; Cole, C.A.; ƠConnor, B.G.; Gannon, J.E.; Ramsey, P.W. Spatial analysis reveals differences in soil microbial community interactions between adjacent coniferous forest and clearcut ecosystems. Soil Biol. Biochem. 2010, 42, 1138–1147. [Google Scholar] [CrossRef]
- Overby, S.T.; Owen, S.M.; Hart, S.C.; Neary, D.G.; Johnson, N.C. Soil microbial community resilience with tree thinning in a 40-year-old experimental ponderosa pine forest. Appl. Soil Ecol. 2015, 93, 1–10. [Google Scholar] [CrossRef]
- Lewandowski, T.E.; Forrester, J.A.; Mladenoff, D.J.; D’Amato, A.W.; Fassnacht, D.S.A.; Padley, E.; Martin, K.J. Do biological legacies moderate the effects of forest harvesting on soil microbial community composition and soil respiration. For. Ecol. Manag. 2019, 432, 298–308. [Google Scholar] [CrossRef]
- Chen, X.L.; Wang, D.; Chen, X.; Wang, J.; Diao, J.J.; Zhang, J.Y.; Guan, Q.W. Soil microbial functional diversity and biomass as affected by different thinning intensities in a Chinese fir plantation. Appl. Soil Ecol. 2015, 92, 35–44. [Google Scholar] [CrossRef]
- Pfeiffer, B.; Fender, A.C.; Lasota, S.; Hertel, D.; Jungkunst, H.F.; Daniel, R. Leaf litter is the main driver for changes in bacterial community structures in the rhizosphere of ash and beech. Appl. Soil Ecol. 2013, 72, 150–160. [Google Scholar] [CrossRef]
- Campbell, E.E.; Parton, W.J.; Soong, J.L.; Paustian, K.; Hobbs, N.T.; Cotrufo, M.F. Using litter chemistry controls on microbial processes to partition litter carbon fluxes with the litter decomposition and leaching (LIDEL) model. Soil Biol. Biochem. 2016, 100, 160–174. [Google Scholar] [CrossRef]
- Pollierer, M.M.; Ferlian, O.; Scheu, S. Temporal dynamics and variation with forest type of phospholipid fatty acids in litter and soil of temperate forests across regions. Soil Biol. Biochem. 2015, 91, 248–257. [Google Scholar] [CrossRef]
- Bravo-Oviedo, A.; Ruiz-Peinado, R.; Onrubia, R.; del Río, M. Thinning alters the early-decomposition rate and nutrient immobilization-release pattern of foliar litter in Mediterranean oak-pine mixed stands. For. Ecol. Manag. 2017, 391, 309–320. [Google Scholar] [CrossRef]
- Kunhamu, T.K.; Kumar, B.M.; Viswanath, S. Does thinning affect litterfall, liter decomposition, and associated nutrient release in Acacia mangium stands of Kerala in peninsular India? Can. J. For. Res. 2009, 39, 792–801. [Google Scholar] [CrossRef]
- Lapointe, B.; Bradley, R.L.; Shipley, B. Mineral nitrogen and microbial dynamics in the forest floor of clearcut or partially harvested successional boreal forest stands. Plant Soil 2005, 271, 27–37. [Google Scholar] [CrossRef]
- Inagaki, Y.; Kuramoto, S.; Torii, A.; Shinomiya, Y.; Fukata, H. Effects of thinning on leaf-fall and leaf-litter nitrogen concentration in hinoki cypress (Chamaecyparis obtusa Endlicher) plantation stands in Japan. For. Ecol. Manag. 2008, 255, 1859–1867. [Google Scholar] [CrossRef]
- Blanco, J.A.; Imbert, J.B.; Castillo, F.J. Thinning affects Pinus sylvestris needle decomposition rates and chemistry differently depending on site conditions. Biogeochemistry 2011, 106, 397–414. [Google Scholar] [CrossRef]
- Xiao, W.Y.; Fei, F.; Diao, J.J.; Chen, B.J.W.; Guan, Q.W. Thinning intensity affects microbial functional diversity and enzymatic activities associated with litter decomposition in a Chinese fir plantation. J. For. Res. 2018, 29, 1337–1350. [Google Scholar] [CrossRef]
- Rietl, A.J.; Jackson, C.R. Effects of the ecological restoration practices of prescribed burning and mechanical thinning on soil microbial enzyme activities and leaf litter decomposition. Soil Biol. Biochem. 2012, 50, 47–57. [Google Scholar] [CrossRef]
- Zhou, L.L.; Cai, L.P.; He, Z.M.; Wang, R.W.; Wu, P.F.; Ma, X.Q. Thinning increases understory diversity and biomass, and improves soil properties without decreasing growth of Chinese fir in southern China. Environ. Sci. Pollut. Res. Int. 2016, 23, 24135–24150. [Google Scholar] [CrossRef]
- Dang, P.; Gao, Y.; Liu, J.L.; Yu, S.C.; Zhao, Z. Effects of thinning intensity on understory vegetation and soil microbial communities of a mature Chinese pine plantation in the Loess Plateau. Sci. Total Environ. 2018, 630, 171–180. [Google Scholar] [CrossRef] [PubMed]
- Ma, L.Y.; Li, C.Y.; Wang, X.Q.; Xu, X. Effects of thinning on the growth and the diversity of undergrowth of Pinus tabulaeformis plantation in Beijing mountainous areas. Sci. Silvae Sin. 2007, 43, 1–9. [Google Scholar]
- Cheng, X.Q.; Han, H.; Kang, F.F.; Liu, K.; Song, Y.L.; Zhou, B.; Li, Y. Short-term effects of thinning on soil respiration in a pine (Pinus tabulaeformis) plantation. Biol. Fertil. Soils 2014, 50, 357–367. [Google Scholar] [CrossRef]
- Han, W.J.; He, J.F.; Zhang, W.F.; Li, J.X. Effects of gap size on root growth of seedlings and soil physical and chemical properties in plantation in the Huanglong Forest. Sci. Silvae Sin. 2013, 49, 16–23. [Google Scholar]
- Bahnmann, B.; Mašínová, T.; Halvorsen, R.; Davey, M.L.; Sedlák, P.; Tomšovský, M.; Baldrian, P. Effects of oak, beech and spruce on the distribution and community structure of fungi in litter and soils across a temperate forest. Soil Biol. Biochem. 2018, 119, 162–173. [Google Scholar] [CrossRef]
- Gong, Z.T. Chinese Soil Taxonomy; Science Press: Beijing, China, 1999. [Google Scholar]
- Papa, S.; Cembrola, E.; Pellegrino, A.; Fuggi, A.; Fioretto, A. Microbial enzyme activities, fungal biomass and quality of the litter and upper soil layer in a beech forest of south Italy. Eur. J. Soil Sci. 2014, 65, 274–285. [Google Scholar] [CrossRef]
- Vogt, D.J.; Tilley, J.P.; Edmonds, R.L. Soil and Plant Analysis for Forest Ecosystem Characterization; Higher Education Press: Beijing, China, 2015. [Google Scholar]
- Kourtev, P.S.; Ehrenfeld, J.G.; Häggblom, M. Exotic plant species alter the microbial community structure and function in the soil. Ecology 2002, 83, 3152–3166. [Google Scholar] [CrossRef]
- Kaiser, C.; Koranda, M.; Kitzler, B.; Fuchslueger, L.; Schnecker, J.; Schweiger, P.; Rasche, F.; Zechmeister-Boltenstern, S.; Sessitsch, A.; Richter, A. Belowground carbon allocation by trees drives seasonal patterns of extracellular enzyme activities by altering microbial community composition in a beech forest soil. New Phytol. 2010, 187, 843–858. [Google Scholar] [CrossRef] [Green Version]
- Rosinger, C.; Rousk, J.; Sandén, H. Can enzymatic stoichiometry be used to determine growth-limiting nutrients for microorganisms?—A critical assessment in two subtropical soils. Soil Biol. Biochem. 2019, 128, 115–126. [Google Scholar] [CrossRef]
- Ruess, L.; Chamberlain, P.M. The fat that matters: Soil food web analysis using fatty acids and their carbon stable isotope signature. Soil Biol. Biochem. 2010, 42, 1898–1910. [Google Scholar] [CrossRef]
- Zelles, L. Fatty acid patterns of phospholipids and lipopolysaccharides in the characterisation of microbial communities in soil: A review. Biol. Fertil. Soils 1999, 29, 111–129. [Google Scholar] [CrossRef]
- Wallander, H.; Ekblad, A.; Godbold, D.L.; Johnson, D.; Bahr, A.; Baldrian, P.; Björk, R.G.; Kieliszewska-Rokicka, B.; Kjøller, R.; Kraigher, H.; et al. Evaluation of methods to estimate production, biomass and turnover of ectomycorrhizal mycelium in forests soils—A review. Soil Biol. Biochem. 2013, 57, 1034–1047. [Google Scholar] [CrossRef]
- Martínez-García, L.B.; Korthals, G.; Brussaard, L.; Jørgensen, H.B.; De Deyn, G.B. Organic management and cover crop species steer soil microbial community structure and functionality along with soil organic matter properties. Agric. Ecosyst. Environ. 2018, 263, 7–17. [Google Scholar] [CrossRef]
- Frostegård, Å.; Bååth, E. The use of phospholipid fatty acid analysis to estimate bacterial and fungal biomass in soil. Biol. Fertil. Soils 1996, 22, 59–65. [Google Scholar] [CrossRef]
- Fichtner, A.; von Oheimb, G.; Härdtle, W.; Wilken, C.; Gutknecht, J.L.M. Effects of anthropogenic disturbances on soil microbial communities in oak forests persist for more than 100 years. Soil Biol. Biochem. 2014, 70, 79–87. [Google Scholar] [CrossRef]
- Tscherko, D.; Hammesfahr, U.; Marx, M.C.; Kandeler, E. Shifts in rhizosphere microbial communities and enzyme activity of Poa alpina across an alpine chronosequence. Soil Biol. Biochem. 2004, 36, 1685–1698. [Google Scholar] [CrossRef]
- Grayston, S.J.; Rennenberg, H. Assessing effects of forest management on microbial community structure in a central European beech forest. Can. J. For. Res. 2006, 36, 2595–2604. [Google Scholar] [CrossRef]
- Kayang, H. Fungal and bacterial enzyme activities in Alnus nepalensis D. Don. Eur. J. Soil Biol. 2001, 37, 175–180. [Google Scholar] [CrossRef]
- Maassen, S.; Fritze, H.; Wirth, S. Response of soil microbial biomass, activities, and community structure at a pine stand in northeastern Germany 5 years after thinning. Can. J. For. Res. 2006, 36, 1427–1434. [Google Scholar] [CrossRef]
- Siles, J.A.; Cajthaml, T.; Hernández, P.; Pérez-Mendoza, D.; García-Romera, I. Shifts in soil chemical properties and bacterial communities responding to biotransformed dry olive residue used as organic amendment. Microb. Ecol. 2015, 70, 231–243. [Google Scholar] [CrossRef]
- Orwin, K.H.; Dickie, I.A.; Holdaway, R.; Wood, J.R. A comparison of the ability of PLFA and 16S rRNA gene metabarcoding to resolve soil community change and predict ecosystem functions. Soil Biol. Biochem. 2018, 117, 27–35. [Google Scholar] [CrossRef]
- Alarcón-Gutiérrez, E.; Floch, C.; Augur, C.; Petit, J.L.; Ziarelli, F.; Criquet, S. Spatial variations of chemical composition, microbial functional diversity, and enzyme activities in a Mediterranean litter (Quercus ilex L.) profile. Pedobiologia 2009, 52, 387–399. [Google Scholar] [CrossRef]
- Osono, T.; Hirose, D.; Fujimaki, R. Fungal colonization as affected by litter depth and decomposition stage of needle litter. Soil Biol. Biochem. 2006, 38, 2743–2752. [Google Scholar] [CrossRef]
- Šnajdr, J.; Valášková, V.; Merhautová, V.; Herinková, J.; Cajthaml, T.; Baldrian, P. Spatial variability of enzyme activities and microbial biomass in the upper layers of Quercus petraea forest soil. Soil Biol. Biochem. 2008, 40, 2068–2075. [Google Scholar] [CrossRef]
- Zheng, H.F.; Chen, Y.M.; Liu, Y.; Zhang, J.; Yang, W.Q.; Yang, L.; Li, H.J.; Wang, L.F.; Wu, F.Z.; Guo, L. Litter quality drives the differentiation of microbial communities in the litter horizon across an alpine treeline ecotone in the eastern Tibetan Plateau. Sci. Rep. 2018, 8, 10029. [Google Scholar] [CrossRef]
- Lee, H.; Fitzgerald, J.; Hewins, D.B.; McCulley, R.L.; Archer, S.R.; Rahn, T.; Throop, H. Soil moisture and soil-litter mixing effects on surface litter decomposition: A controlled environment assessment. Soil Biol. Biochem. 2014, 72, 123–132. [Google Scholar] [CrossRef]
- Otto, R.; García-del-Rey, E.; Méndez, J.; Fernández-Palacios, J.M. Effects of thinning on seed rain, regeneration and understory vegetation in a Pinus canariensis plantation (Tenerife, Canary Islands). For. Ecol. Manag. 2012, 280, 71–81. [Google Scholar] [CrossRef]
- Thoms, C.; Gattinger, A.; Jacob, M.; Thomas, F.M.; Gleixner, G. Direct and indirect effects of tree diversity drive soil microbial diversity in temperate deciduous forest. Soil Biol. Biochem. 2010, 42, 1558–1565. [Google Scholar] [CrossRef]
- Shanmugam, S.G.; Kingery, W.L. Changes in soil microbial community structure in relation to plant succession and soil properties during 4000 years of pedogenesis. Eur. J. Soil Biol. 2018, 88, 80–88. [Google Scholar] [CrossRef]
- Thoms, C.; Gleixner, G. Seasonal differences in tree species\” influence on soil microbial communities. Soil Biol. Biochem. 2013, 66, 239–248. [Google Scholar] [CrossRef]
- Liu, Z.F.; Liu, G.H.; Fu, B.J.; Zheng, X.X. Relationship between plant species diversity and soil microbial functional diversity along a longitudinal gradient in temperate grasslands of Hulunbeir, Inner Mongolia, China. Ecol. Res. 2008, 23, 511–518. [Google Scholar] [CrossRef]
- Zak, D.R.; Holmes, W.E.; White, D.C.; Peacock, A.; Tilman, D. Plant diversity, soil microbial communities, and ecosystem function: Are there any links? Ecology 2003, 84, 2042–2050. [Google Scholar] [CrossRef]
- Slodicak, M.; Novak, J.; Skovsgaard, J.P. Wood production, litter fall and humus accumulation in a Czech thinning experiment in Norway spruce (Picea abies (L.) Karst.). For. Ecol. Manag. 2005, 209, 157–166. [Google Scholar] [CrossRef]
- Wang, C.; Lu, X.; Mori, T.; Mao, Q.; Zhou, K.; Zhou, G.; Nie, Y.; Mo, J. Responses of soil microbial community to continuous experimental nitrogen additions for 13 years in a nitrogen-rich tropical forest. Soil Biol. Biochem. 2018, 121, 103–112. [Google Scholar] [CrossRef]
- Fanin, N.; Hättenschwiler, S.; Fromin, N. Litter fingerprint on microbial biomass, activity, and community structure in the underlying soil. Plant Soil 2014, 379, 79–91. [Google Scholar] [CrossRef]
- Sun, S.; Li, S.; Avera, B.N.; Strahm, B.D.; Badgley, B.D. Soil bacterial and fungal communities show distinct recovery patterns during forest ecosystem restoration. Appl. Environ. Microbiol. 2017, 83, e00966-17. [Google Scholar] [CrossRef]
- Haňáčková, Z.; Koukol, O.; Štursová, M.; Kolarik, M.; Baldrian, P. Fungal succession in the needle litter of a montane Picea abies forest investigated through strain isolation and molecular fingerprinting. Fungal Ecol. 2015, 13, 157–166. [Google Scholar] [CrossRef]
- Singh, B.K.; Dawson, L.A.; Macdonald, C.A.; Buckland, S.M. Impact of biotic and abiotic interaction on soil microbial communities and functions: A field study. Appl. Soil Ecol. 2009, 41, 239–248. [Google Scholar] [CrossRef]
- Lladó, S.; López-Mondéjar, R.; Baldrian, P. Drivers of microbial community structure in forest soils. Appl. Microbiol. Biotechnol. 2018, 102, 4331–4338. [Google Scholar] [CrossRef]

| Layer | Thinning Intensity | R | H | Coverage | Height (m) |
|---|---|---|---|---|---|
| Shrub | T0 | 5.67 ± 0.882b | 1.13 ± 0.68c | 0.19 ± 0.03c | 0.39 ± 0.29c |
| T10 | 7.67 ± 1.76b | 1.81 ± 0.31bc | 0.30 ± 0.01b | 0.52 ± 0.10bc | |
| T20 | 13.33 ± 0.67a | 3.05 ± 0.29a | 0.34 ± 0.04b | 0.79 ± 0.17ab | |
| T50 | 16.00 ± 1.53a | 2.77 ± 0.38ab | 0.41 ± 0.02a | 0.93 ± 0.17a | |
| Herb | T0 | 10.33 ± 1.48b | 1.72 ± 0.57a | 0.15 ± 0.02c | 0.08 ± 0.17a |
| T10 | 7.00 ± 1.53b | 2.55 ± 0.63a | 0.32 ± 0.03b | 0.08 ± 0.16a | |
| T20 | 15.67 ± 0.67a | 2.76 ± 0.45a | 0.35 ± 0.02b | 0.07 ± 0.10a | |
| T50 | 13.33 ± 0.89a | 2.22 ± 0.90a | 0.48 ± 0.01a | 0.06 ± 0.12a |
| Organic Layer | L Layer | F Layer | ||||||
|---|---|---|---|---|---|---|---|---|
| Thinning Intensity | T0 | T10 | T20 | T50 | T0 | T10 | T20 | T50 |
| Litter Mass/(t/hm−2) | 6.17 ± 0.58b | 6.00 ± 0.75b | 8.19 ± 0.79a | 4.62 ± 0.44c | 18.39 ± 1.24a | 14.10 ± 1.03b | 17.55 ± 1.45a | 10.31 ± 0.66c |
| pH (H2O) | 4.92 ± 0.04a | 5.13 ± 0.09a | 4.58 ± 0.12b | 4.88 ± 0.09a | 4.38 ± 0.15b | 4.86 ± 0.15a | 4.27 ± 0.06b | 4.29 ± 0.13b |
| LOC/(g/kg) | 466.10 ± 7.22a | 476.10 ± 10.38a | 480.10 ± 13.78a | 460.63 ± 16.99a | 350.52 ± 14.43a | 347.83 ± 19.85a | 359.19 ± 11.40a | 337.20 ± 8.36a |
| DOC/(g/kg) | 1.55 ± 0.07c | 2.37 ± 0.05a | 1.35 ± 0.05d | 1.79 ± 0.13b | 0.90 ± 0.04b | 1.09 ± 0.20ab | 1.02 ± 0.03b | 1.26 ± 0.14a |
| TN/(g/kg) | 13.17 ± 1.34a | 13.40 ± 1.79a | 14.23 ± 0.91a | 13.87 ± 0.26a | 11.50 ± 2.10a | 11.80 ± 1.15a | 15.53 ± 1.60a | 12.10 ± 0.94a |
| TP/(g/kg) | 1.07 ± 0.08a | 0.63 ± 0.34b | 0.63 ± 0.12b | 1.13 ± 0.13a | 0.87 ± 0.13a | 0.77 ± 0.14a | 1.00 ± 0.20a | 0.97 ± 0.03a |
| NH4+-N/(mg/kg) | 49.77 ± 1.36b | 56.92 ± 3.41a | 56.27 ± 0.97a | 56.58 ± 4.56a | 41.82 ± 1.03b | 46.94 ± 0.66a | 46.48 ± 3.31a | 48.18 ± 1.41a |
| NO3−-N/(mg/kg) | 65.17 ± 0.65b | 59.66 ± 0.75b | 137.69 ± 6.72a | 51.73 ± 1.43c | 64.96 ± 6.65c | 140.70 ± 9.93b | 303.36 ± 5.82a | 31.89 ± 2.97d |
| Organic Layer | Thinning Intensity | R | H |
|---|---|---|---|
| L layer | T0 | 53 ± 2b | 2.24 ± 0.13b |
| T10 | 54 ± 2b | 2.26 ± 0.03b | |
| T20 | 62 ± 1a | 3.14 ± 0.07a | |
| T50 | 51 ± 3b | 2.21 ± 0.23b | |
| F layer | T0 | 60 ± 2a | 3.09 ± 0.25a |
| T10 | 62 ± 4a | 3.17 ± 0.25a | |
| T20 | 61 ± 2a | 3.28 ± 0.08a | |
| T50 | 53 ± 4b | 2.38 ± 0.08b |
| Organic Layer | Thinning Intensity | totPLFAs | GP | GN | B | FU | ACT | AMF |
|---|---|---|---|---|---|---|---|---|
| L layer | T0 | 301.56 ± 16.72a | 8.88 ± 0.09ab | 3.96 ± 0.15c | 14.67 ± 0.68b | 55.64 ± 1.60b | 1.51 ± 0.06a | 0.55 ± 0.04b |
| T10 | 339.67 ± 46.74a | 10.26 ± 1.14a | 56.93 ± 0.69a | 70.89 ± 7.59a | 94.76 ± 8.53a | 1.52 ± 0.27a | 1.69 ± 0.06a | |
| T20 | 293.62 ± 67.61a | 7.90 ± 1.63b | 7.07 ± 1.64b | 16.98 ± 0.57b | 65.81 ± 11.08b | 1.47 ± 0.22a | 0.45 ± 0.43b | |
| T50 | 321.56 ± 39.46a | 8.55 ± 0.60ab | 3.83 ± 0.32c | 14.66 ± 0.58b | 57.97 ± 4.66b | 1.48 ± 0.04a | 0.58 ± 0.06b | |
| F layer | T0 | 185.53 ± 0.77b | 23.43 ± 3.06b | 20.40 ± 1.34b | 64.16 ± 2.44b | 26.60 ± 0.93b | 8.95 ± 0.43a | 3.39 ± 0.29b |
| T10 | 147.50 ± 19.64c | 18.21 ± 1.59c | 16.12 ± 0.64c | 43.72 ± 0.61c | 19.52 ± 2.72c | 5.72 ± 0.29c | 2.62 ± 0.09b | |
| T20 | 243.25 ± 16.32a | 25.61 ± 1.18a | 36.84 ± 3.99a | 75.64 ± 2.97a | 53.99 ± 5.01a | 7.88 ± 0.18b | 6.26 ± 0.73a | |
| T50 | 181.20 ± 7.296b | 26.43 ± 2.82a | 21.40 ± 2.24bc | 62.82 ± 3.96b | 25.93 ± 1.38b | 8.68 ± 0.64a | 3.52 ± 0.47b |
| Microbial Communities | Thinning Intensity | Organic Layer | Thinning Intensity × Organic Layer | |||||
|---|---|---|---|---|---|---|---|---|
| F | p | Sig.(Ti) | F | p | Sig.(Ll) | F | p | |
| totPLFAs | 0.710 | 0.560 | a,a,a,a | 80.320 | 0.000 | A,B | 4.473 | 0.018 |
| GP | 3.639 | 0.036 | ab,b,a,a | 396.165 | 0.000 | B,A | 10.111 | 0.001 |
| GN | 276.051 | 0.000 | c,a,b,c | 40.892 | 0.000 | B,A | 512.248 | 0.000 |
| B | 39.886 | 0.000 | c,a,b,c | 560.042 | 0.000 | B,A | 213.898 | 0.000 |
| FU | 18.376 | 0.000 | b,a,a,b | 258.354 | 0.000 | A,B | 34.285 | 0.000 |
| ACT | 30.538 | 0.000 | a,c,b,a | 2313.998 | 0.000 | B,A | 31.560 | 0.000 |
| AMF | 19.466 | 0.000 | b,b,a,b | 449.293 | 0.000 | B,A | 46.443 | 0.000 |
| Microbial Communities | pH (H2O) | LOC | DOC | TN | TP | NH4+-N | NO3−-N |
|---|---|---|---|---|---|---|---|
| totPLFAs | 0.548 ** | 0.837 ** | 0.731 ** | 0.404 | −0.039 | 0.731 ** | −0.129 |
| GP | −0.733 ** | −0.923 ** | −0.684 ** | −0.182 | 0.152 | −0.849 ** | 0.307 |
| GN | 0.079 | −0.074 | 0.392 | 0.150 | −0.367 | 0.105 | 0.197 |
| B | −0.404 | −0.598 ** | −0.148 | −0.032 | −0.169 | −0.440 * | 0.289 |
| FU | 0.538 ** | 0.803 ** | 0.796 ** | 0.453 * | −0.261 | 0.788 ** | 0.010 |
| ACT | −0.801 ** | −0.940 ** | −0.738 ** | −0.284 | 0.140 | −0.875 ** | 0.249 |
| AMF | −0.652 ** | −0.766 ** | −0.556 ** | 0.111 | 0.128 | −0.693 ** | 0.627 ** |
© 2019 by the authors. Licensee MDPI, Basel, Switzerland. This article is an open access article distributed under the terms and conditions of the Creative Commons Attribution (CC BY) license (http://creativecommons.org/licenses/by/4.0/).
Share and Cite
Wang, L.; Zhao, G.; Sun, Y.; Yang, Y.; Zhou, H. Effects of Thinning on Microbial Community Structure in the Organic Horizon of Chinese Pine Plantations in Badaling, Beijing, China. Forests 2019, 10, 828. https://doi.org/10.3390/f10100828
Wang L, Zhao G, Sun Y, Yang Y, Zhou H. Effects of Thinning on Microbial Community Structure in the Organic Horizon of Chinese Pine Plantations in Badaling, Beijing, China. Forests. 2019; 10(10):828. https://doi.org/10.3390/f10100828
Chicago/Turabian StyleWang, Ling, Guangliang Zhao, Yujun Sun, Ying Yang, and Hongjuan Zhou. 2019. "Effects of Thinning on Microbial Community Structure in the Organic Horizon of Chinese Pine Plantations in Badaling, Beijing, China" Forests 10, no. 10: 828. https://doi.org/10.3390/f10100828
APA StyleWang, L., Zhao, G., Sun, Y., Yang, Y., & Zhou, H. (2019). Effects of Thinning on Microbial Community Structure in the Organic Horizon of Chinese Pine Plantations in Badaling, Beijing, China. Forests, 10(10), 828. https://doi.org/10.3390/f10100828