Article

Landscape-Scale Mixtures of Tree Species are More Effective than Stand-Scale Mixtures for Biodiversity of Vascular Plants, Bryophytes and Lichens

1
Department Silviculture and Forest Ecology of the Temperate Zones, University of Goettingen, Büsgenweg 1, D-37077 Göttingen, Germany
2
Swiss Federal Research Institute WSL, Zürcherstrasse 111, CH-8903 Birmensdorf, Switzerland
3
Institute of Plant Sciences, University of Bern, CH-3013 Bern, Switzerland
4
Institute for Biochemistry and Biology, University of Potsdam, Maulbeerallee 1, 14469 Potsdam, Germany
5
Department of Nature Conservation, Heinz Sielmann Foundation, Unter den Kiefern 9, D-14641 Wustermark, Germany
6
Max-Planck Institute for Biogeochemistry, D-07745 Jena, Germany
*
Author to whom correspondence should be addressed.
Forests 2019, 10(1), 73; https://doi.org/10.3390/f10010073
Submission received: 27 December 2018 / Revised: 16 January 2019 / Accepted: 17 January 2019 / Published: 19 January 2019
(This article belongs to the Special Issue Causes and Consequences of Species Diversity in Forest Ecosystems)

Abstract

:
Tree species diversity can positively affect the multifunctionality of forests. This is why conifer monocultures of Scots pine and Norway spruce, widely promoted in Central Europe since the 18th and 19th century, are currently converted into mixed stands with naturally dominant European beech. Biodiversity is expected to benefit from these mixtures compared to pure conifer stands due to increased abiotic and biotic resource heterogeneity. Evidence for this assumption is, however, largely lacking. Here, we investigated the diversity of vascular plants, bryophytes and lichens at the plot (alpha diversity) and at the landscape (gamma diversity) level in pure and mixed stands of European beech and conifer species (Scots pine, Norway spruce, Douglas fir) in four regions in Germany. We aimed to identify compositions of pure and mixed stands in a hypothetical forest landscape that can optimize gamma diversity of vascular plants, bryophytes and lichens within regions. Results show that gamma diversity of the investigated groups is highest when a landscape comprises different pure stands rather than tree species mixtures at the stand scale. Species mainly associated with conifers rely on light regimes that are only provided in pure conifer forests, whereas mixtures of beech and conifers are more similar to beech stands. Combining pure beech and pure conifer stands at the landscape scale can increase landscape level biodiversity and conserve species assemblages of both stand types, while landscapes solely composed of stand scale tree species mixtures could lead to a biodiversity reduction of a combination of investigated groups of 7 up to 20%.

1. Introduction

In recent years, the effect of tree species diversity on forest ecosystem functions has been intensively investigated from local to continental scale (e.g., [1,2,3,4]). Research results generally hint towards a positive effect of tree species diversity on primary productivity [5] and stability [6] compared to respective monocultures, though depending on environmental conditions and species combinations [7] and varying in space and time [8]. Neighborhood interactions among different tree species in terms of stress release and facilitation have been shown to drive both diversity-productivity (e.g., [9,10]) and diversity-stability relationships [11,12]. This indicates the importance of a distinct intermingling of different tree species at the stand scale to support some key forest ecosystem functions.
Tree species mixtures within forest stands are also assumed to conserve and promote associated understory biodiversity better than monocultures (e.g., [13,14,15]). The understory is a key component of the diversity of primary producers in temperate forests and contributes to element cycling and functioning of above and belowground food webs [16,17,18]. Thus, understanding its responses to canopy changes is essential for implementing biodiversity-orientated forest management concepts including the broad promotion of mixed stands instead of monocultures.
Within mixtures, understory species (including vascular plants and soil dwelling and epiphytic cryptogams) may either respond positively to the presence of a specific host tree species (e.g., [19]) or may benefit from the small-scale heterogeneity within stands provided by different tree species in terms of light transmittance [20], nutrient and water availability [21] or litter accumulation [22]. These findings are in accordance with the positive heterogeneity-diversity relationship (e.g., [23,24]). However, pure additive effects of different tree species within a stand may lead to an accumulation of species associated to either tree species but they may not contribute to increased landscape-level diversity [25]. Interactive effects among tree species, on the other hand, may result in an increased species pool in mixtures compared to a combination of pure stands and thus increase diversity at the landscape level [13,26]. For example, shade-tolerant understory species can be impeded by a dense and persistent litter layer (e.g., due to a negative effect on seedling establishment or due to different morphological abilities of plants to emerge through layers of tree litter) in a closed-canopy monoculture of a given tree species [22], and the same species could be outcompeted by dominant light-demanding understory species in a more open stand of another tree species. Instead, within mixtures of both tree species where litter is reduced but the canopy is still closed, these understory species might find suitable conditions. In addition, a more efficient resource use of neighboring and complementary tree species in mixtures (e.g., by a more effective fine root system, [27]) might limit these resources for understory species in the direct vicinity creating wider resource gradients within mixed stands [13].
While additive [19] and interactive [26] effects among tree species have been verified for epiphytic communities such as bryophytes and lichens, there is not much scientific evidence for a positive effect of mixtures regarding understory vascular plant diversity. In their review studies, Barbier et al. [28] and Cavard et al. [25] showed that maximum diversity (mainly expressed as species richness or species diversity (Shannon-diversity) at the stand scale) was mainly observed in pure stands of different tree species and not in mixed stands composed of these species. So far, previous studies have generally focused on alpha diversity at a particular plot or stand level. This focus may have masked the heterogeneity among mixed stands, e.g. in terms of mixture ratios of different tree species, and potentially underestimated the supported species pool. Landscape-level comparisons are rare (see [29]) and have mainly contrasted species composition of mixtures to only one of the respective pure stand types [25].
Conifer monocultures of Scots pine (Pinus sylvestris L.) and Norway spruce (Picea abies (L.) H. Karst.) have been widely promoted outside their natural range on harvested sites across Central Europe since the 18th and 19th century. Their fast growth rate, undemanding regeneration and management, and manifold usability of their wood made them the economically most important tree species in temperate forests of Europe [30,31]. Decreasing site quality and growth reductions on soils with limited cation availability, the susceptibility to wind throw and pathogens [32,33], and the call for other ecosystem services apart from timber production have led to a large-scale conversion of pure conifer stands into mixed stands with site-adapted broadleaved tree species in recent decades [30,34,35]. As European beech (Fagus sylvatica L.) would naturally dominate large parts of Central Europe [36], beech is the main tree species used in this conversion process. A positive effect of forest conversion on forest biodiversity is widely assumed (e.g., [37,38]), but studies confirming this assumption, particularly with respect to understory biodiversity at the landscape scale, are missing.
Here, we assessed the effect of tree species mixtures of European beech (in the following beech) with a conifer species on plot level (alpha diversity) and landscape level (gamma diversity) diversity of vascular plants, bryophytes and lichens (including species growing on soil, deadwood or epiphytically on the bark of trees and shrubs) compared to the respective pure stands. We used data from four regions in Germany differing in climate, geology, tree species composition and forest management. While the western and eastern lowlands of northern Germany were largely forested with Scots pine (in the following pine) on exploited, nutrient poor sandy soils, Norway spruce (in the following spruce) was largely planted in mountain areas in central and southern Germany on different substrates. According to current management plans, mixtures with beech will largely replace these conifer monocultures in the future (e.g., [38,39]). The non-native Douglas fir (Pseudotsuga menziesii (Mirb.) Franco) shows higher growth rates and higher stability e.g. in terms of drought [40] than spruce in low mountain ranges, so that it is regarded as an important conifer species in mixture with beech under the expected climate change.
The objectives of our study were: (1) to quantify alpha and gamma diversity of understory vascular plants, bryophytes and lichens in pure and mixed stands by investigating tree species combinations of beech and pine, beech and spruce and beech and Douglas fir (no data for bryophytes and lichens); and (2) to identify an optimized composition of pure and mixed stands within hypothetical forest landscapes in favor of the three groups and in favor of a regional biodiversity when combining these groups.
We generally expected a higher gamma diversity in mixed compared to pure stands as mixtures should contain species that are associated to beech as well as species associated to conifer forests. By this, hypothetical forest landscapes comprising mixed stands only should be equally (only additive effects between tree species) or more (additive and interactive effects between tree species) diverse than a combination of monocultures of the given tree species. If the presence of pure and mixed stand types at the landscape level supports maximum gamma diversity (e.g., [26]), the different stand types should harbor characteristic species that either benefit from a gradient of resources in mixtures or from a higher resource quantity within pure stands [41].

2. Materials and Methods

2.1. Study Regions and Data Sampling

We analyzed data sampled in four regions in Germany (Table 1) ranging from the northern lowlands in western (Northwestern (NW-)Germany) and eastern Germany (Schorfheide-Chorin) to mountain areas of central (Solling Hills) and southern Germany (Schwäbische Alb). All four regions would be naturally dominated by beech (with a small contribution of sessile oak in eastern Germany) but are currently (co-) dominated by conifers, mainly by pine and spruce (Table 1).
In the four regions, vegetation surveys in 400 m2 plots (20 m × 20 m) were conducted as part of different research projects covering a range of tree species compositions (for details see, [42,43,44]). In all regions, plant species composition was assessed per plot for the tree layer (≥5 m height) and for the understory (woody species <5 m height and all herbaceous species) by recording the species presence and their cover value in %. In the study regions Schorfheide-Chorin and Schwäbische Alb, as part of the Biodiversity Exploratories, the presence of bryophyte and lichen species was additionally recorded on the ground, on deadwood and on the bark of shrubs and trees up to a height of about 2 m of the stem on a subset of the vegetation survey plots (for details see [45,46]). In this study, we excluded species growing on rocks to minimize potential impacts of local to regional differences in geology and geomorphology. By focusing on the understory, we may have underestimated the overall cryptogam species richness by not including species restricted to tree crowns. This bias can be particularly high for lichen diversity in beech forests [47], but can be neglected for bryophytes [47,48].
For the present analyses, we selected those surveys conducted in pure forest stands of beech or one conifer tree species and in forest stands representing mixtures of both tree species. In summary, three tree species combinations were studied: (1) beech and pine and respective mixtures in NW-Germany and Schorfheide-Chorin); (2) beech and Douglas fir and respective mixtures in NW-Germany; and (3) beech and spruce with respective mixtures in the regions Solling and Schwäbische Alb (Table 1). Thereby, plots were selected and classified as pure or mixed based on the species composition of the tree layer. When either beech or the conifer species had a share of >90% on the accumulated tree layer cover (=sum of cover values of all species of the tree layer), plots represented pure forest stands. In mixed stands, beech and conifers had a combined share of >70% on accumulated tree layer cover with no other tree species exceeding a 10% share. Thus, the mixed forests comprised a large gradient ranging from beech to conifer dominance (Table A1 in Appendix A). Since we were interested in the differences between the stand types independent of large-scale anthropogenic or natural disturbances, only survey plots with a minimum accumulated tree layer cover of 30% were included in this study. The third region of the Biodiversity Exploratories, the Hainich-Dün (see, [44,45,46]), was not considered, as studied plots mainly covered pure beech stands and mixtures of beech with other broadleaved tree species, while mixtures with conifers were missing.
In the stands of the regions Solling and NW-Germany, pH values of the upper mineral soil were measured in 1 M KCl and a soil/solution ratio of 1:2 [42,43]. In Schorfheide-Chorin and Schwäbische Alb, pH values of the upper mineral soil were determined across the investigated forest stands in 0.01 M CaCl2 using a soil/solution ratio of 1:2.5 [46].
All investigated stands represent regularly thinned (every 5 to 10 years) age class forests. Beech stands regenerated naturally after repeated shelterwood cuttings mainly on ancient forest sites, while conifer stands were planted after clear cutting in the past ([42,43,50,51]; Table 1). The mature mixtures of beech and pine date back to the beginning and middle of the 20th century when beech was planted into young pure pine stands to improve site conditions [51]. Beech/Douglas fir mixtures resulted from plantings of Douglas fir saplings into natural beech regeneration of similar age. Due to the fast growth rate of Douglas fir, these stands developed into two-layered stands. Spruce within mixtures is generally 15 to 25 years younger than beech and was introduced into beech forest gaps by planting [52]. Mixtures generally represent single tree to group mixtures of beech with conifers.
Stands of Schwäbische Alb were predominantly in the mature timber stage with beech stands and beech/spruce mixtures being 60 to 100 years old and pure spruce stands being 40 to 60 years old. In Solling, stand age ranged from 48 to 150 years with 40% (pure beech) to 60% (pure spruce) of the plots being younger than 90 years. In NW-Germany, stand age varied between 51 and 161 years with pure beech stands, beech/pine and beech/Douglas fir mixtures being mainly older than 90 years. Pure pine and pure Douglas fir stands were younger than 85 and 65 years, respectively. Pure pine stands in Schorfheide-Chorin were equally distributed between mature and immature timber with a stand age of ca. 30 to 70 years, while pure beech stands and beech/pine mixtures were almost exclusively represented by stands in the mature timber stage. While mixed stands were approximately 50 to 70 years (up to 130 years) old, beech stands were mainly older than 70 years up to 160 years (Table 1 and Table A1).
Selected plots were representative for the surrounding forest stands of ca. 0.5 to 4 ha size.

2.2. Data Analysis

Data analyses focused on two main points: (1) the characterization of pure and mixed stands of each region regarding mean tree layer cover, soil pH, alpha and gamma diversity, the average number of exclusive species per stand type and an identification of characteristic species per stand type. (2) The identification of a composition of pure and mixed stands in hypothetical forest landscapes that can maximize the gamma diversity of vascular plants for the four study regions and additionally for bryophytes and lichens for the regions Schorfheide-Chorin and Schwäbische Alb. For the latter regions, we further determined a stand type composition for a maximum combined regional diversity of vascular plants, bryophytes and lichens.
All analyses were conducted using the R software version 3.5.0 [53]. Nomenclature of vascular plant species follows Wisskirchen and Haeupler [54], of bryophyte species Koperski et al. [55], and of lichen species Wirth [56].

2.2.1. Analyzing Differences among Stand Types

Mean tree layer cover and soil pH were compared between pure and mixed stands across all available plots and soil sampling points within regions using the Kruskal-Wallis-H-test followed by the Mann-Whitney-U test. All other comparisons for vascular plants were based on 1000 resamplings of 17 plots per stand type to avoid effects of unequal sample sizes across stand types and regions on species richness [57]. Thus, from the number of available plots (Table A1) we randomly drew 17 plots per stand type and repeated this 1000 times. We focused on 17 plots to allow for at least 1000 unique plot combinations per region (e.g., for NW-Germany drawing 17 out of 20 plots results in 1140 unique plot combinations). Alpha diversity was quantified as mean species richness per plot per resampling. Gamma diversity represented the accumulated species richness across the 17 plots per resampling (R package iNEXT version 2.0.12, function ChaoRichness; [58]). For bryophytes and lichens, we increased the number of randomly drawn plots to the maximum number of plots allowing for at least 1000 unique plot combinations (i.e., 36 plots for bryophytes (minimum of 9139 unique combinations) and 22 plots for lichens in Schorfheide-Chorin (minimum of 2300 unique combinations); 26 plots for bryophytes in Schwäbische Alb (minimum of 3654 unique combinations)). For lichens in Schwäbische Alb, only 12 plots were available (Table A1). We therefore resampled 10 out of 12 plots up to 66 unique combinations only.

2.2.2. Finding an Optimized Composition of Stand Types for Gamma Diversity of Vascular Plants, Bryophytes and Lichens

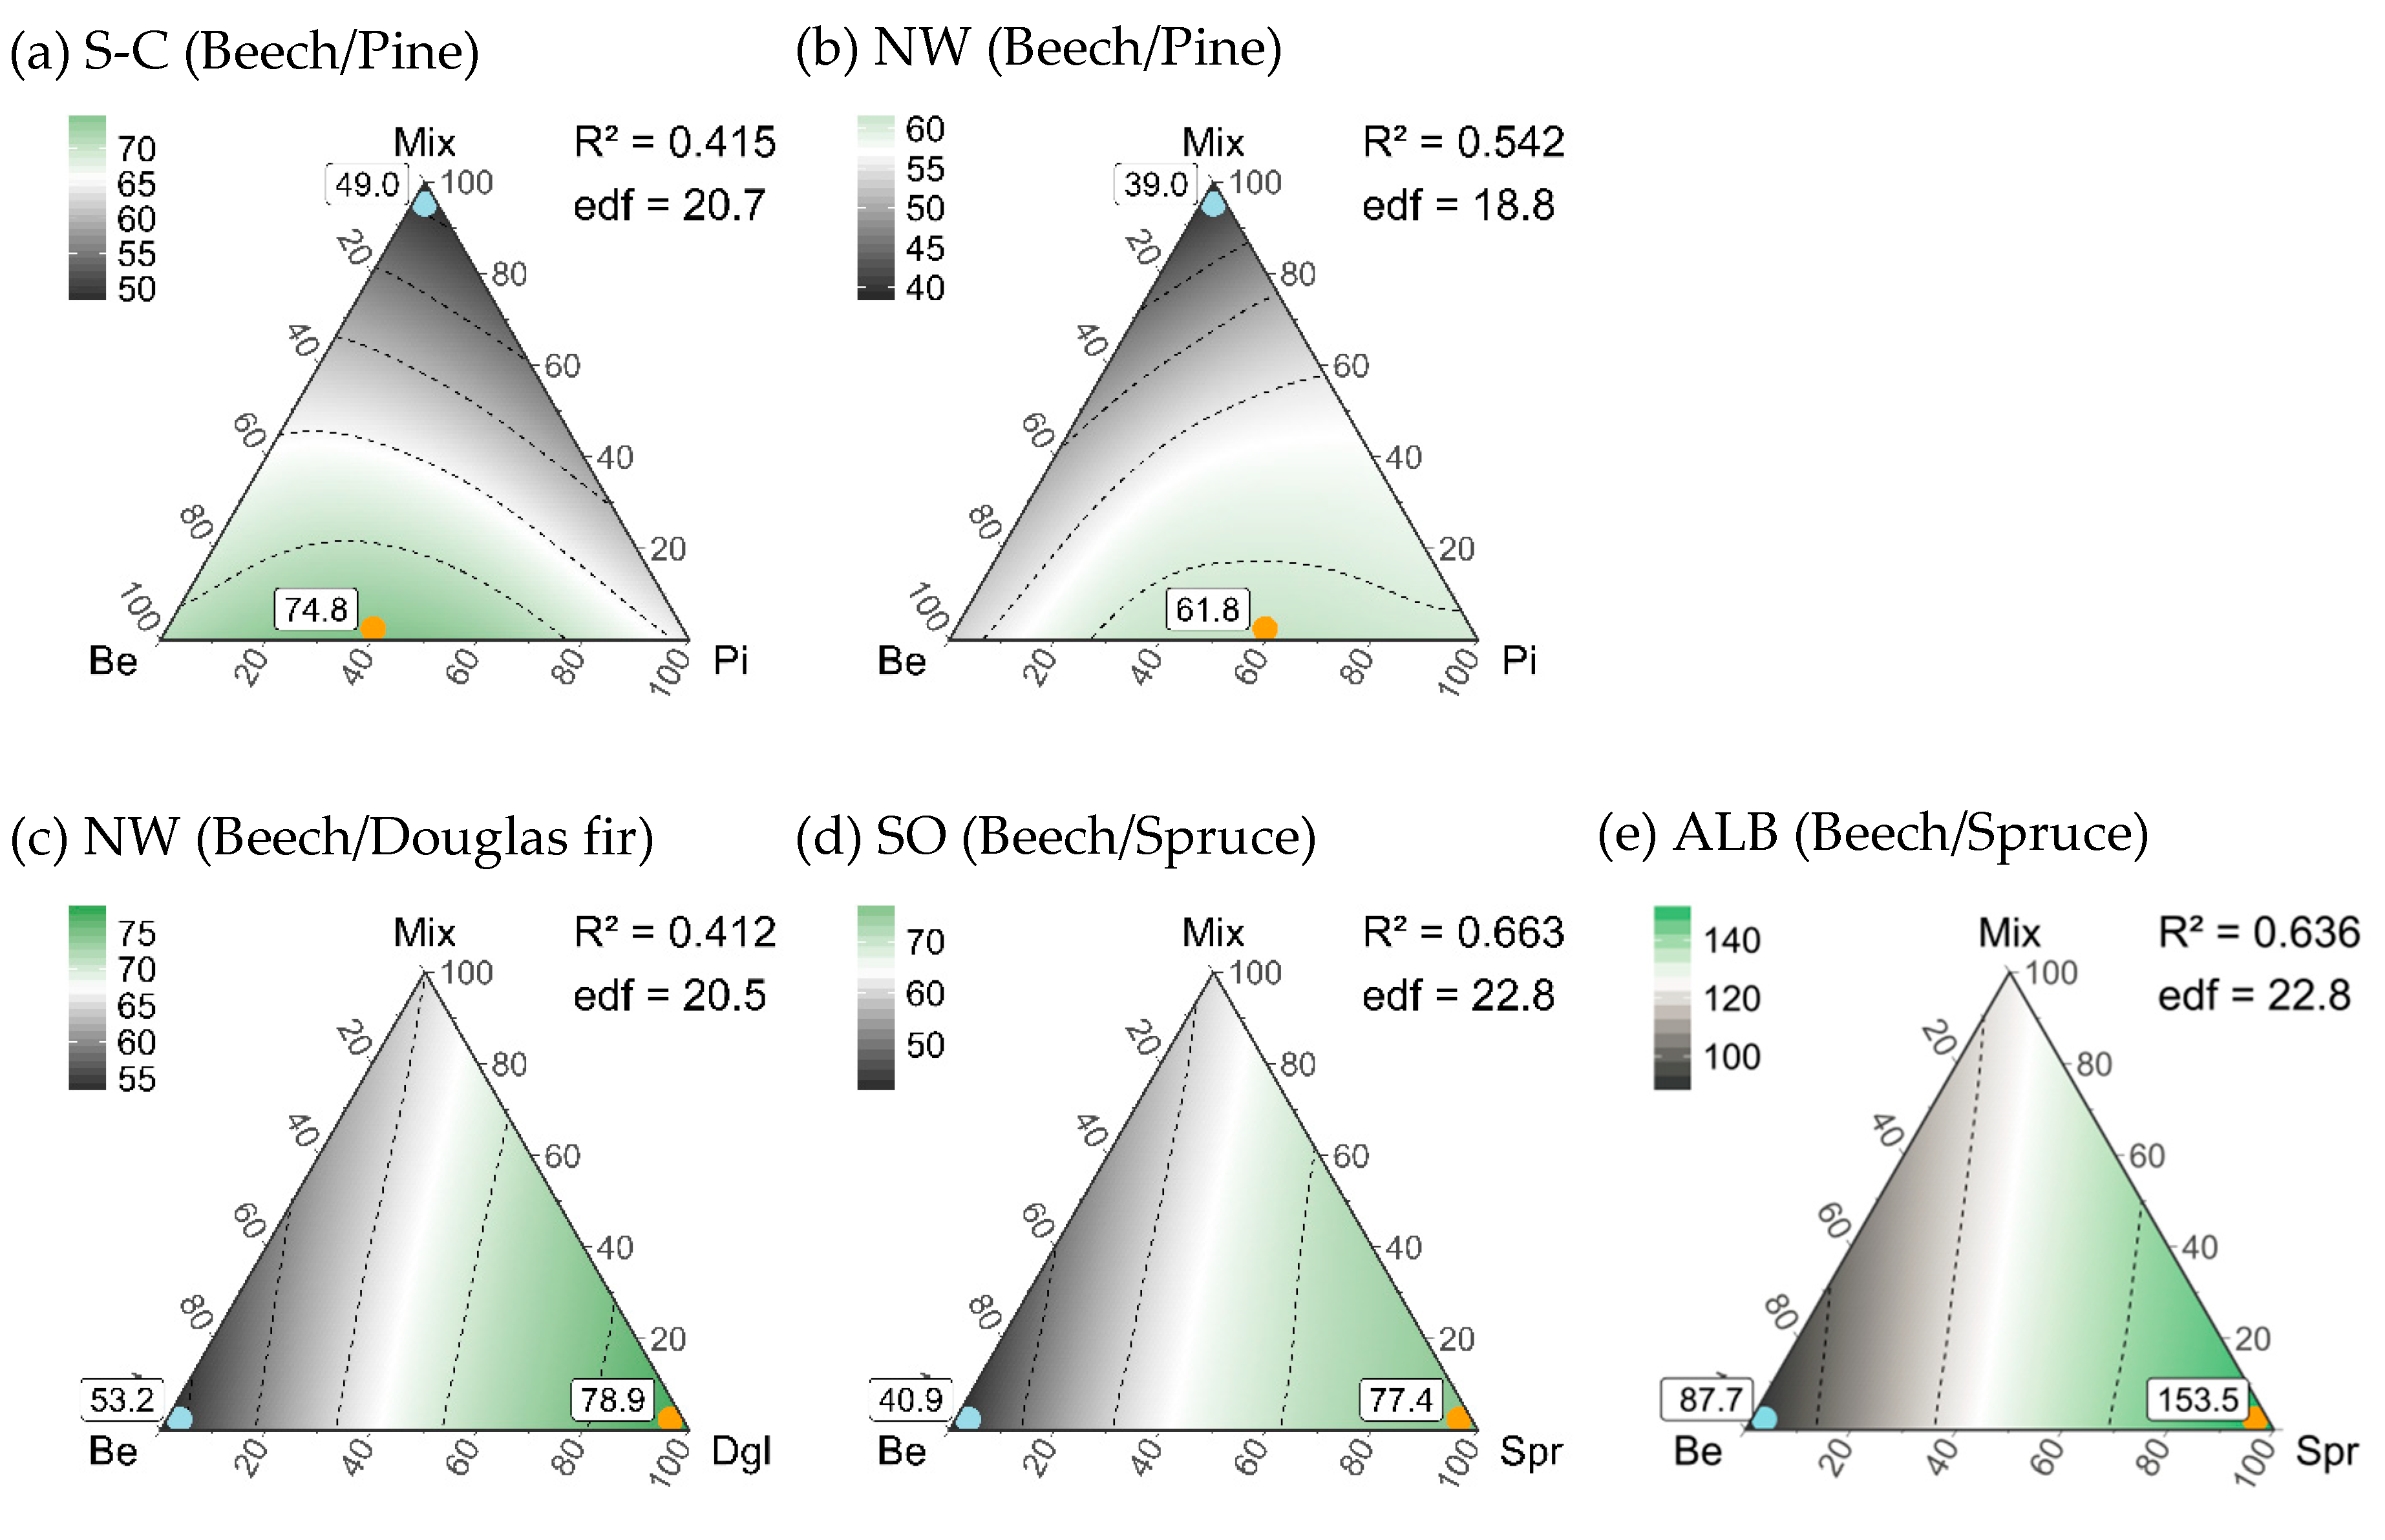
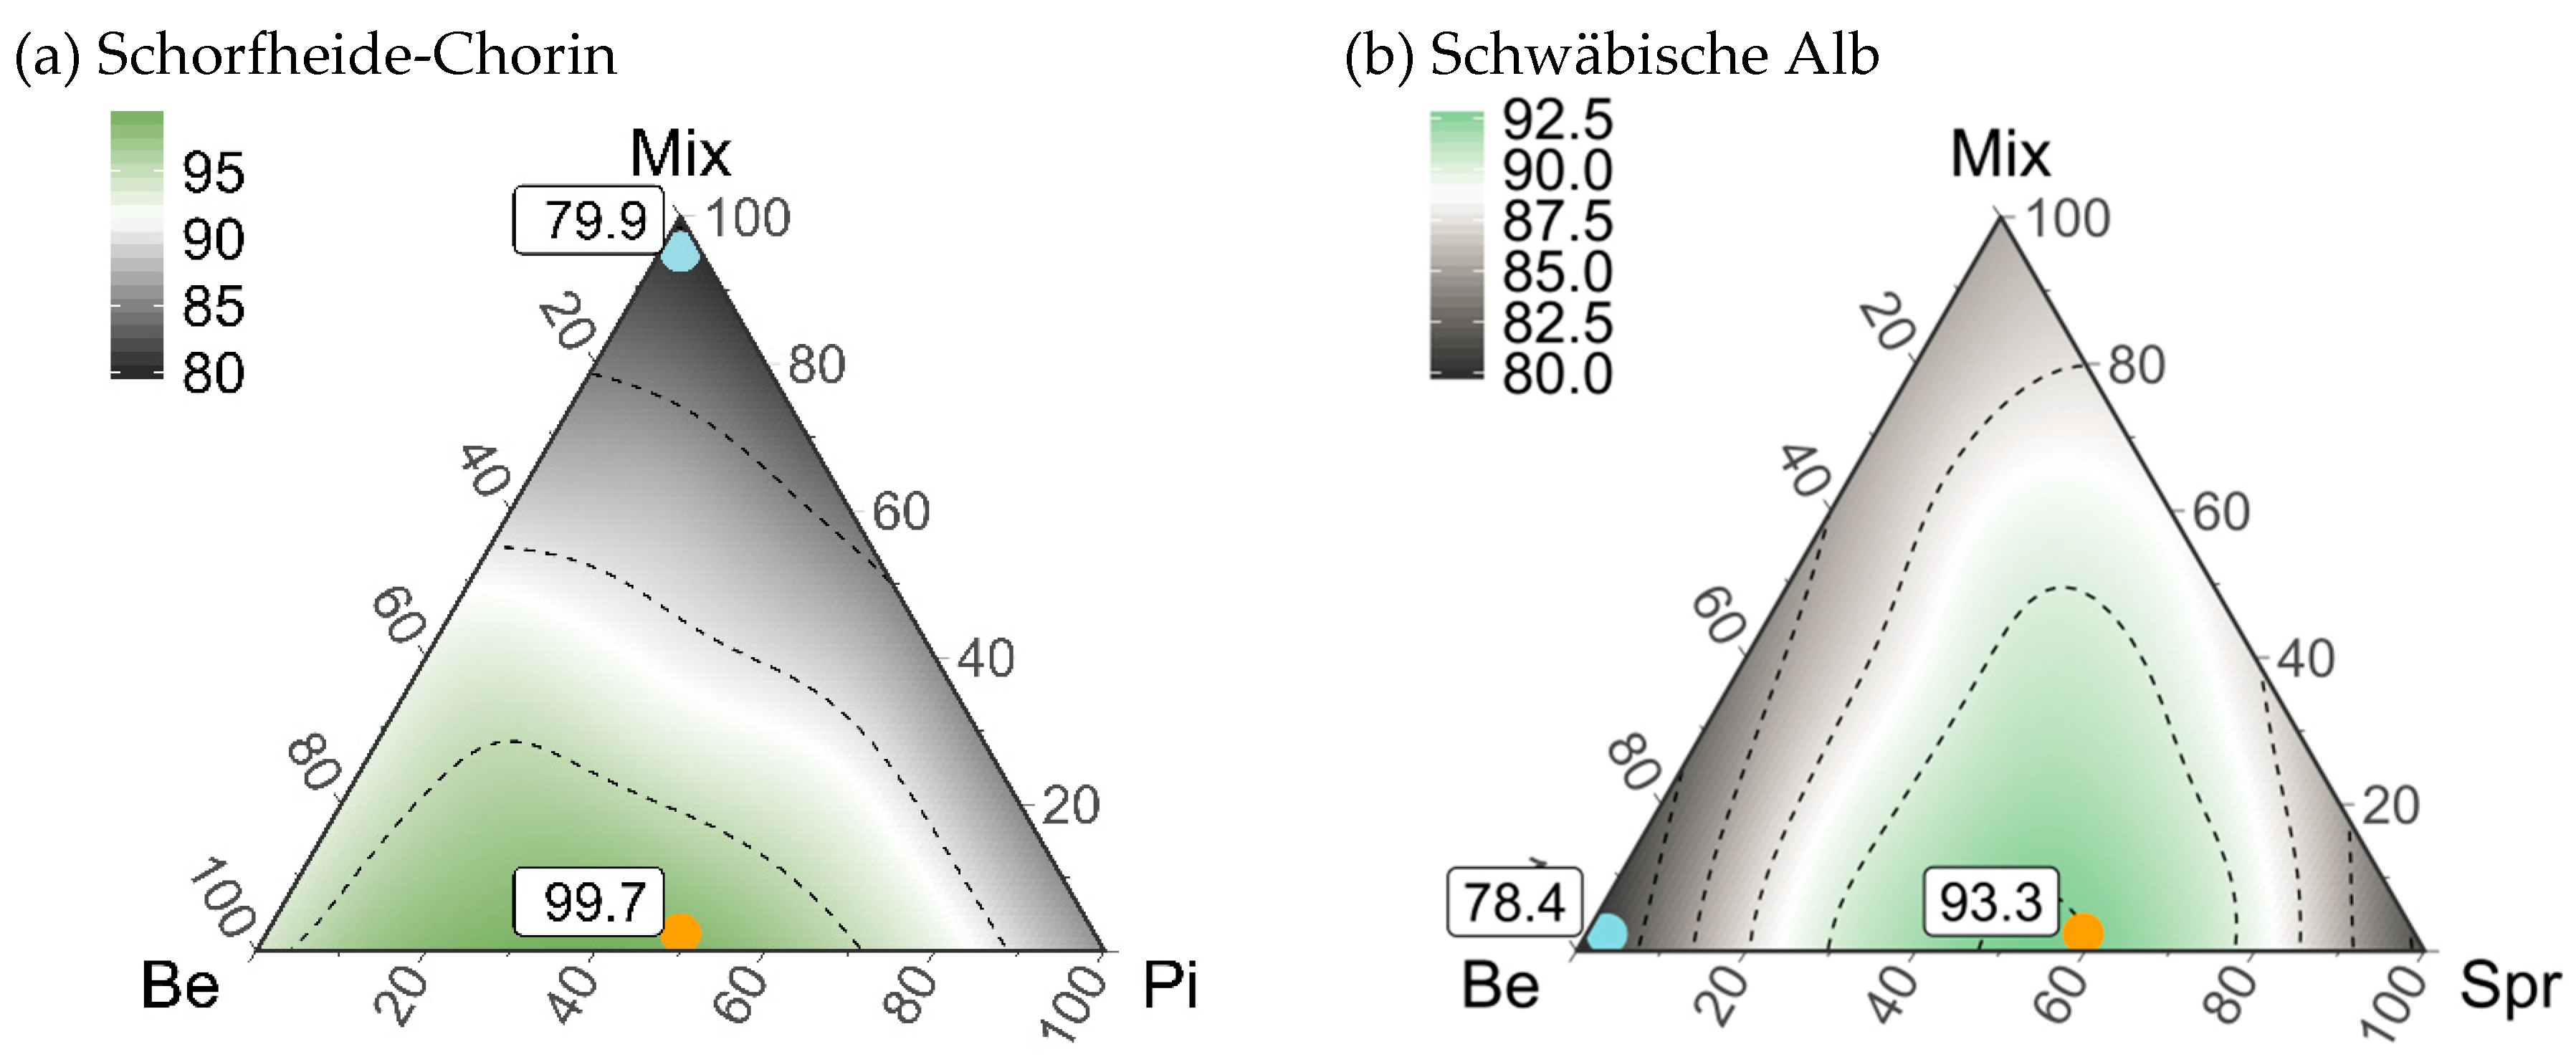
For identifying a composition of pure and mixed stands that can maximize gamma diversity of vascular plants, bryophytes and lichens, we resampled the same number of pure and mixed stands (see Section 2.2.1) in a way that all compositional combinations were represented in steps of 10% with 1000 replications (=hypothetical forest landscapes). In total, we built 66 compositions of stand types (=66 points in Figure 1) comprising only pure beech, pure conifer or mixed stands (cyan points; Figure 1) as well as compositions with almost equal proportions of the three stand types (orange point in Figure 1 with 40% mixed stands (=e.g., 7 of 17 resampled plots) and 30% pure beech and conifer stands (=e.g., 5 plots each of 17 resampled)). For each composition, gamma diversity was quantified per resampling using the accumulated species richness across resampled plots. We analyzed the effect of stand type composition on gamma diversity using general additive models with two factorial full tensor product spline smoothers with function te (R package mgcv version 1.8-23 [59] and function gam (gamma diversity ~ te(conifer, beech))). We report R2 and the degrees of freedom based on the 66,000 replications (66 compositions × 1000 resamplings) or the 4356 replications for lichens in Schwäbische Alb (66 compositions × 66 resamplings). Ternary diagrams were used to visualize response surfaces (R package ggtern version 2.2.1 [60]). We inferred for significant differences of gamma diversity between compositions by pairwise comparisons of resamplings between stand type compositions with average maximum and average minimum gamma diversity using the two-sided p < 0.05 (e.g., for the stand type composition with the on average highest gamma diversity at least 975 resamplings resulted in higher gamma diversity compared to the stand type composition with on average minimum gamma diversity). In the same way we checked for significant differences between the maximum diversity stand type composition and gamma diversity of 100% pure (pure beech and pure conifer) and 100% mixed stands.

2.2.3. Quantification of Exclusive Species Numbers per Stand Type

Stand types would contribute to gamma diversity at the landscape level, when they support exclusive species only occurring in a specific stand type. For mixed stands, if they contain both, species associated with beech and species associated with conifer stands, we hypothesized that the number of exclusive species should be low for pure and mixed stand types, when directly contrasted. To test this, we quantified the number of exclusive species per stand type for each tree species combination and taxonomic group investigated. Quantification of exclusive species was again based on 1000 resamplings.

2.2.4. Identification of Characteristic Species per Stand Type

The quantification of exclusive species only returns an absolute number of species per stand type and resampling independent of a species’ general specifity to or frequency in a specific stand type. To identify vascular plant and cryptogam species that are significantly associated with the investigated stand types (=characteristic species), we additionally conducted indicator species analyses according to Dufrêne and Legendre [61] using the R package indicspecies version 1.7.6 and the function strassoc. This analysis calculates the specifity of a species as the number of occurrences of a species within a stand type relative to the number of occurrences across all stand types (S = specifity) and the frequency of the species within the stand type (F = frequency). Multiplying S and F results in an indicator value between 0 (species not occurring in a specific stand type) and 1 (species occurring exclusively and always in a specific stand type). Based on resamplings of 17 plots per stand type, we calculated the values S and F per species and stand type for 1000 times (vascular plants in NW-Germany: 10 plots out of 20 plots for 1000 times; lichens in Schorfheide-Chorin: 12 plots out of a minimum of 25 plots for 1000 times; lichens in Schwäbische Alb: 6 plots out of a minimum of 12 for 500 times). Multiplying S and F then calculated the indicator value per species and stand type for all species with S > 0.4 and F > 0.2 in at least one stand type. By this, we excluded species with an average frequency lower than 20% across resamplings. Specifity was set to 40% to allow for species with preferences for two stand types (e.g., when S = 0.4 in a pure and in the mixed stand, both stand types cover 80% of the occurrences of a particular species). Characteristic species per stand type were determined by pairwise comparisons of calculated indicator values between the pure and the mixed stands (i.e., for two-sided p < 0.05 at least 975 of 1000 pairwise comparisons showed a larger indicator value for one stand type compared to the others). Species were characteristic for two stand types when indicator values did not differ between them but were larger compared to the third stand type. Identified species were categorized by the environmental Ellenberg indicator values (EIV) for light (L), moisture (M), nutrients (N) and acidity/reaction (R; [62]). EIV assign vascular plant, bryophyte and lichen species along 9-point scales with the value 1 representing species indicating deep shade, dry, nutrient poor or acidic conditions [62]. Species were further classified into forest affinity categories according to the forest species list for vascular plants, bryophytes and lichens ranging from closed forest species to those preferring open site conditions [63].

2.2.5. Finding an Optimized Composition of Stand Types for Regional Diversity

To summarize the effect of stand type composition across vascular plants, bryophytes and lichens for the regions Schorfheide-Chorin and Schwäbische Alb, we quantified multidiversity [64] as a measure for regional diversity combining the three investigated groups. This regional diversity was calculated as the average relative diversity of the taxonomic groups weighted by the species number of the groups (log weighting) to account for general differences in the number of vascular plants, bryophytes and lichens. When a composition of stand types shows a regional diversity of nearly 100%, then all three groups are equally supported close to the optimum. We analyzed the effect of stand type composition on regional diversity using general additive models with two factorial spline smoothers (as we did for single taxa), taking the relative diversity of the taxonomic groups as response variable and their species number as weight. For regional diversity, we additionally considered Shannon diversity (ChaoShannon function of the iNEXT R package [58]) which down weights infrequent species.

3. Results

3.1. Environmental Conditions

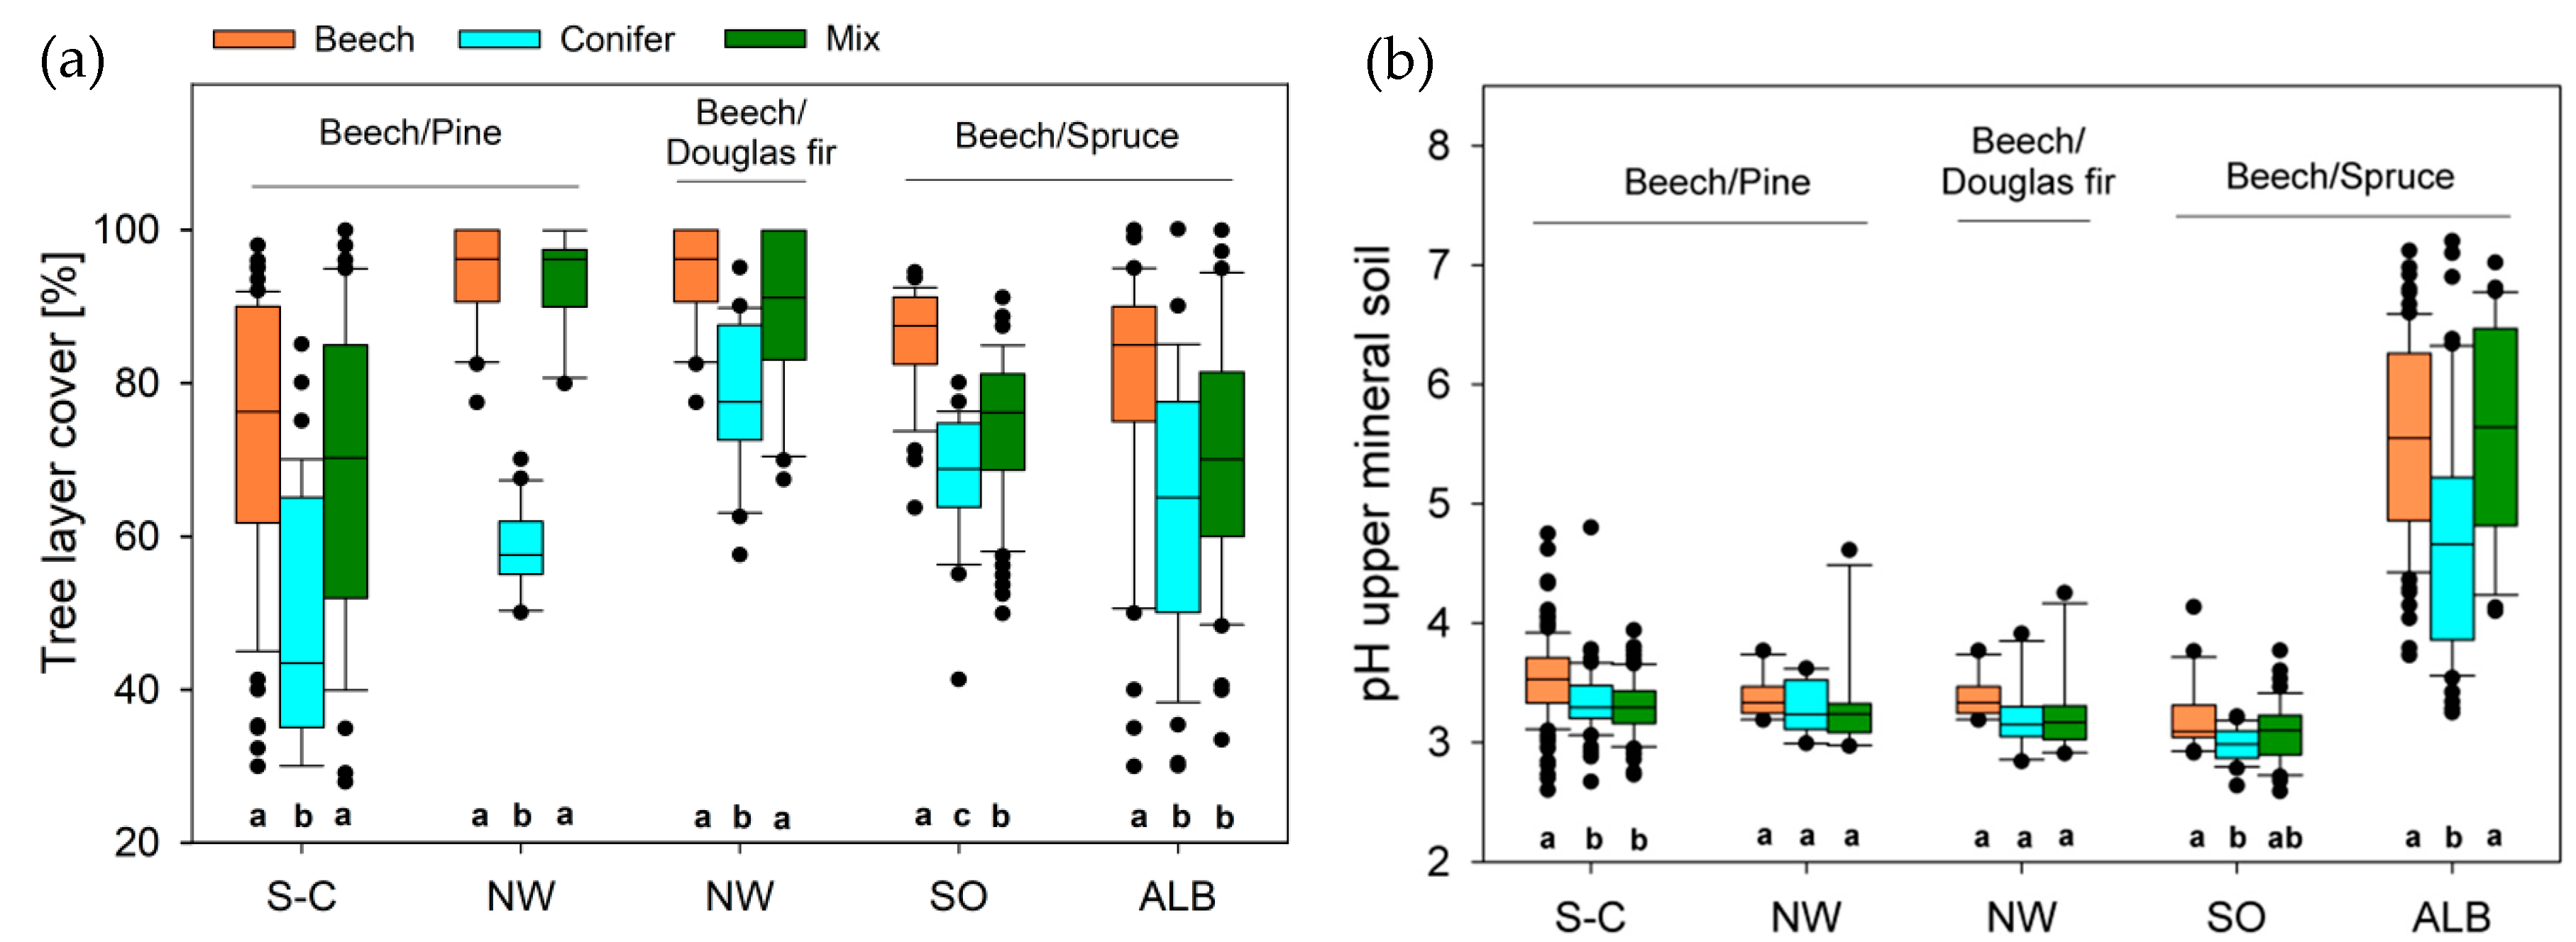
Pure conifer stands were characterized by lowest tree layer cover compared to the other stand types (except for beech/spruce mixtures in Schwäbische Alb), while pure beech stands showed highest values with no significant difference to beech/pine and beech/Douglas fir mixtures (Figure 2a).
There were no significant differences in soil pH among stand types in NW-Germany (for neither tree species combination, Figure 2b). For the other regions, pure beech stands showed higher soil pH values compared to pure pine and beech/pine mixtures in Schorfheide-Chorin and compared to pure spruce stands in Solling and Schwäbische Alb. Pure beech and beech/spruce mixtures showed no significant differences.

3.2. Diversity Patterns of Vascular Plants

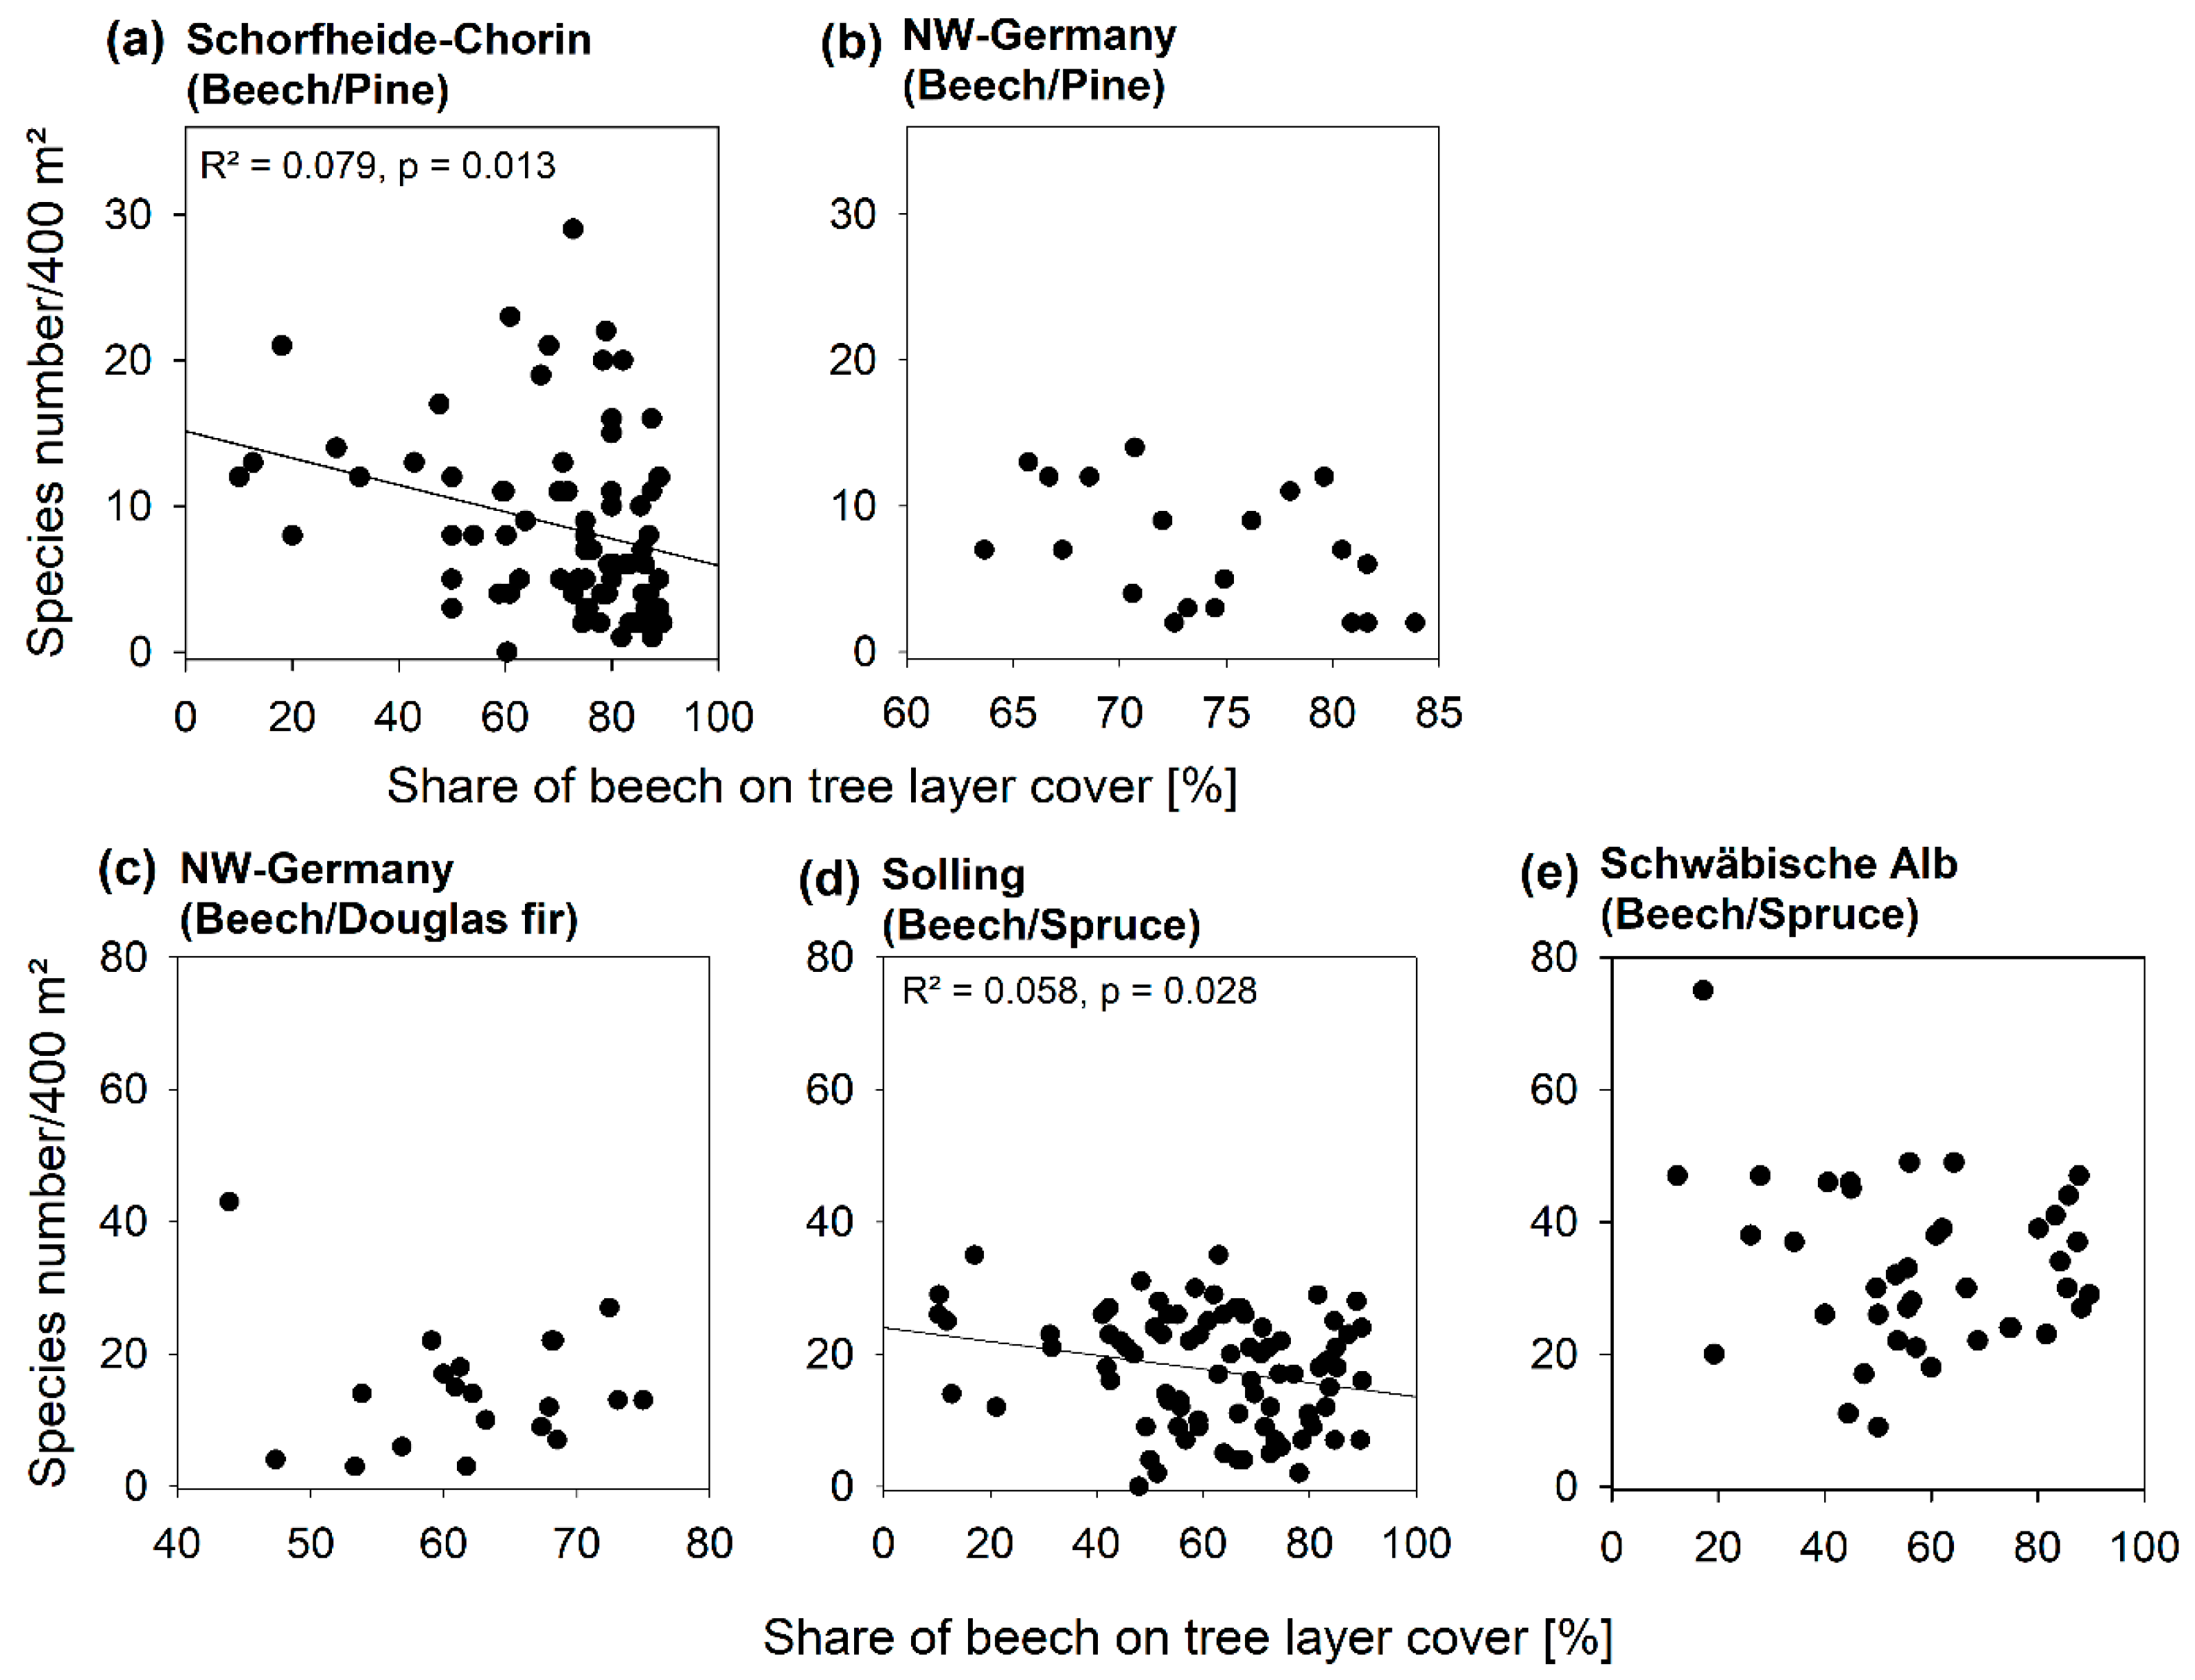
Alpha diversity of vascular plants was highest for all conifer stands with no significant difference to pure beech stands in Schorfheide-Chorin and to mixed stands in Schwäbische Alb. Beech/pine mixtures showed lowest values in both study regions, whereas diversity values of beech/Douglas fir and beech/spruce mixtures were intermediate (Table 2). Within mixtures, different proportions of the two tree species had only small effects on alpha diversity (Figure A1). Species richness slightly decreased with an increasing proportion of beech compared to pine in Schorfheide-Chorin and compared to spruce in Solling.
Gamma diversity patterns were similar with highest values for pure conifer stands across regions and tree species combinations except for Schorfheide-Chorin. For all regions, mixtures showed lower gamma diversity than at least one of the pure stand type (Table 2). Mixtures of beech and pine showed lowest gamma diversity values, whereas mixtures of beech and Douglas fir/spruce were intermediate between the respective pure stands.
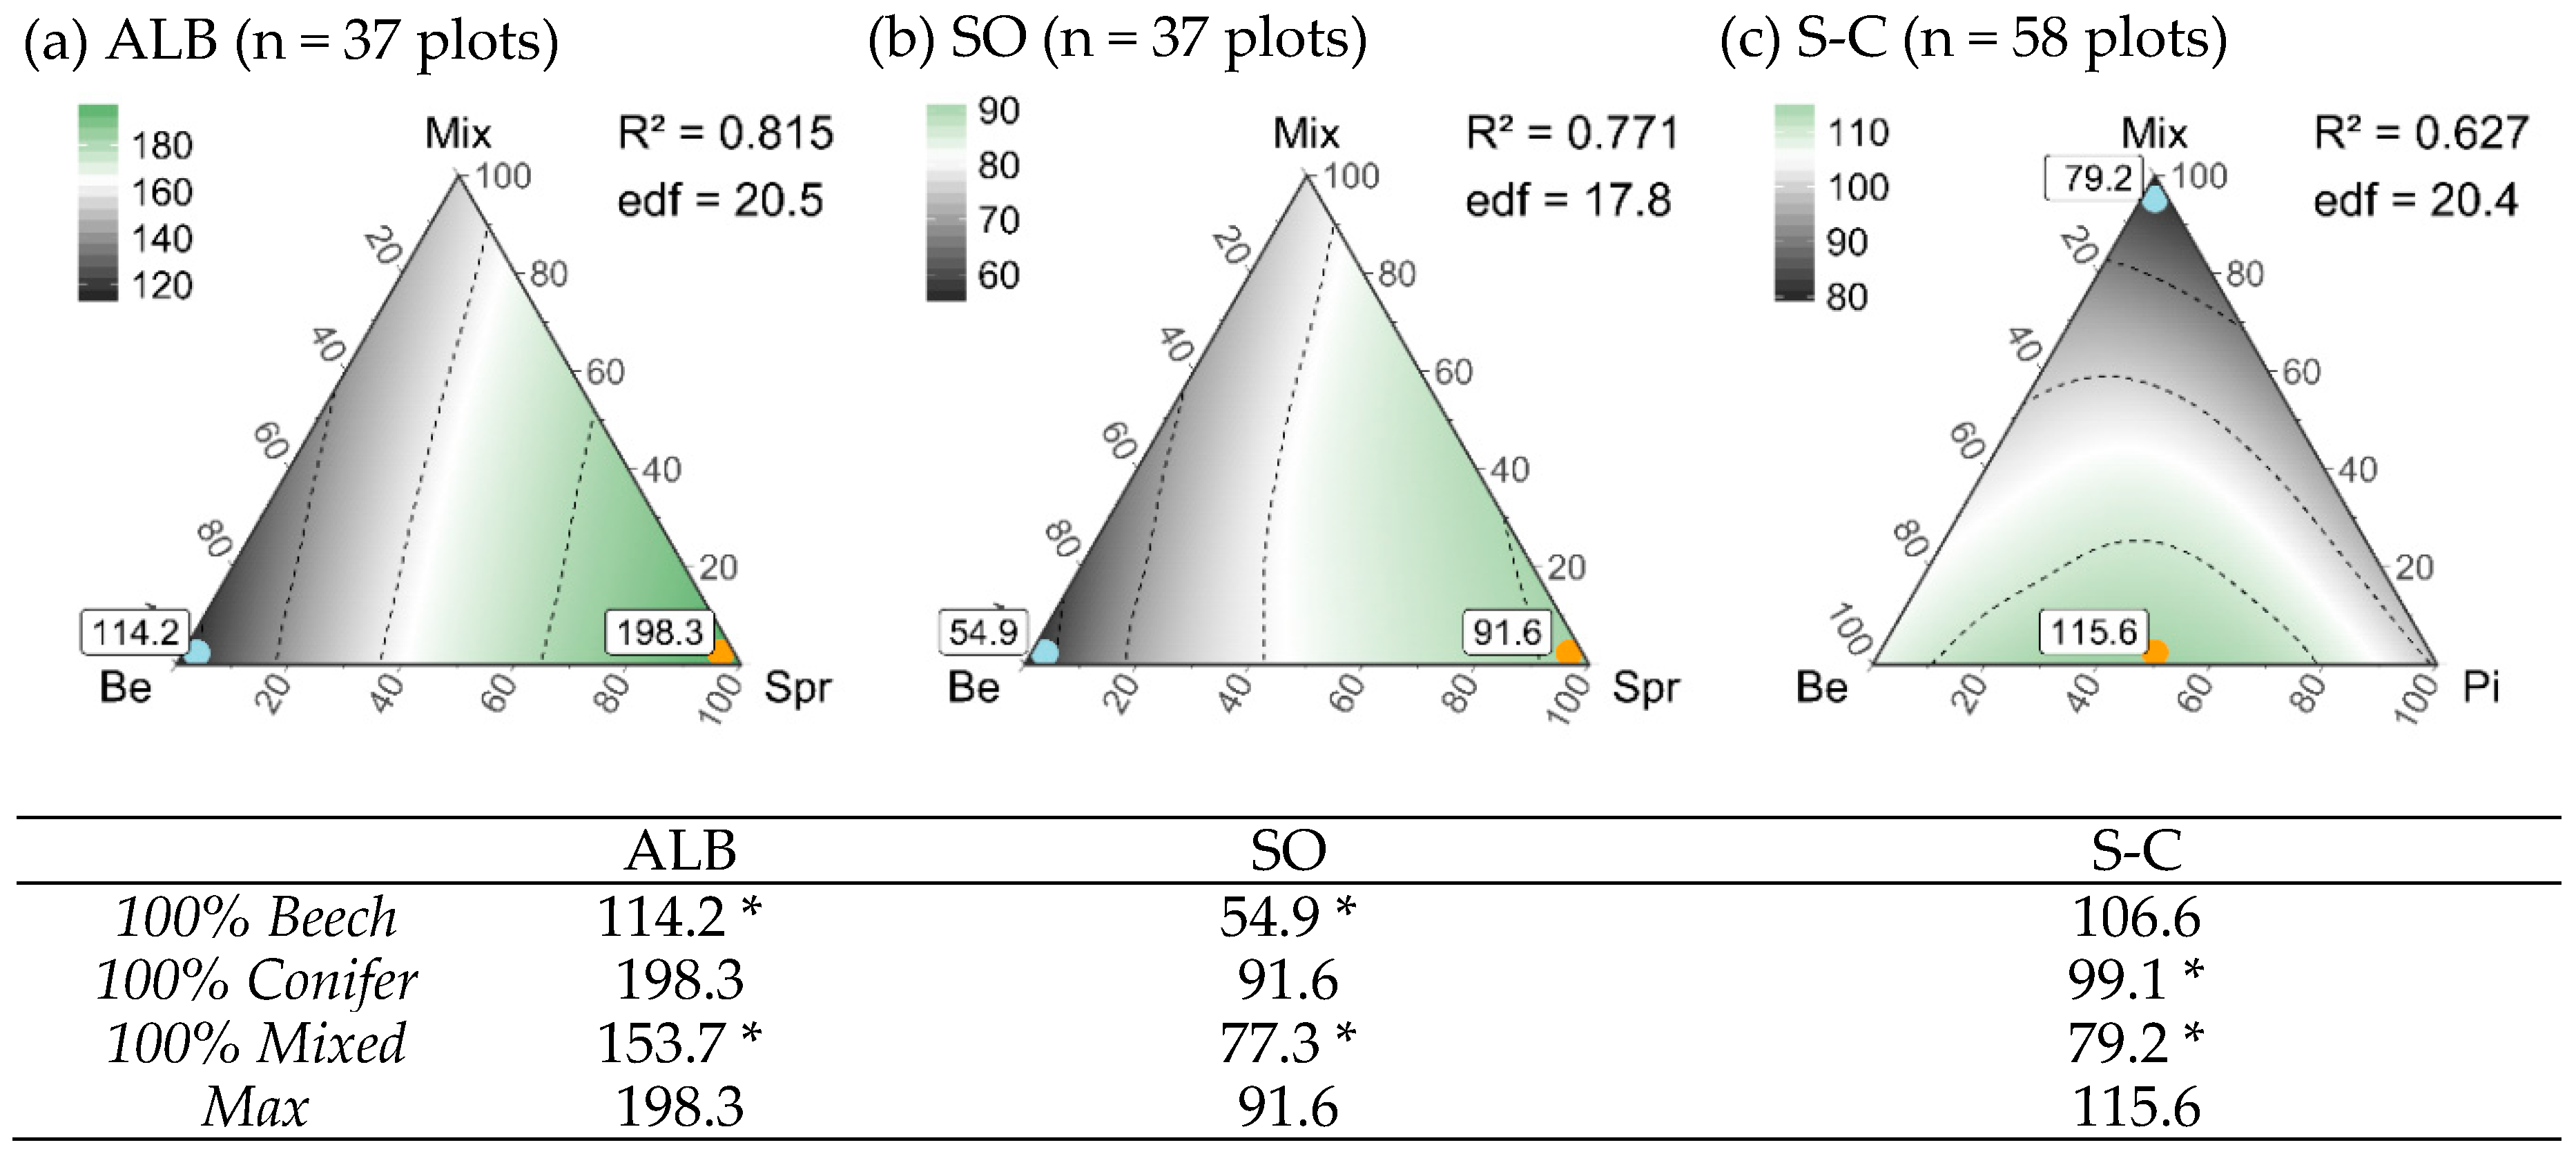
The composition approach showed that pure stand types supported a maximum gamma diversity of vascular plants (Figure 3a–e, Table 2). This accounted either for a combination of pure beech and pure pine stands (Figure 3a,b) or for pure Douglas fir or spruce stands only (Figure 3c–e). Maximum gamma diversity was significantly higher compared to the gamma diversity of a hypothetical landscape composed of mixed stands only (Table 2). On average beech/pine mixtures reduced the diversity of vascular plants by 34.5% (Schorfheide-Chorin) to 36.9% (NW-Germany) compared to the maximum, whereas the beech/Douglas fir mixture showed a reduction by 16.1% and the beech/spruce mixtures by 19.4% (Schwäbische Alb) to 20.4% (Solling). In both regions with pure pine stands, beech/pine mixtures supported minimum gamma diversity. For the Douglas fir and spruce combinations, 100% pure beech stands were least diverse. Maximum and minimum values were comparable among regions with acidic soil conditions (see Figure 2b), but were twice as much for the Schwäbische Alb on limestone. Nevertheless, the latter region showed a similar diversity pattern compared to Solling with the same tree species combination (Figure 3d,e).
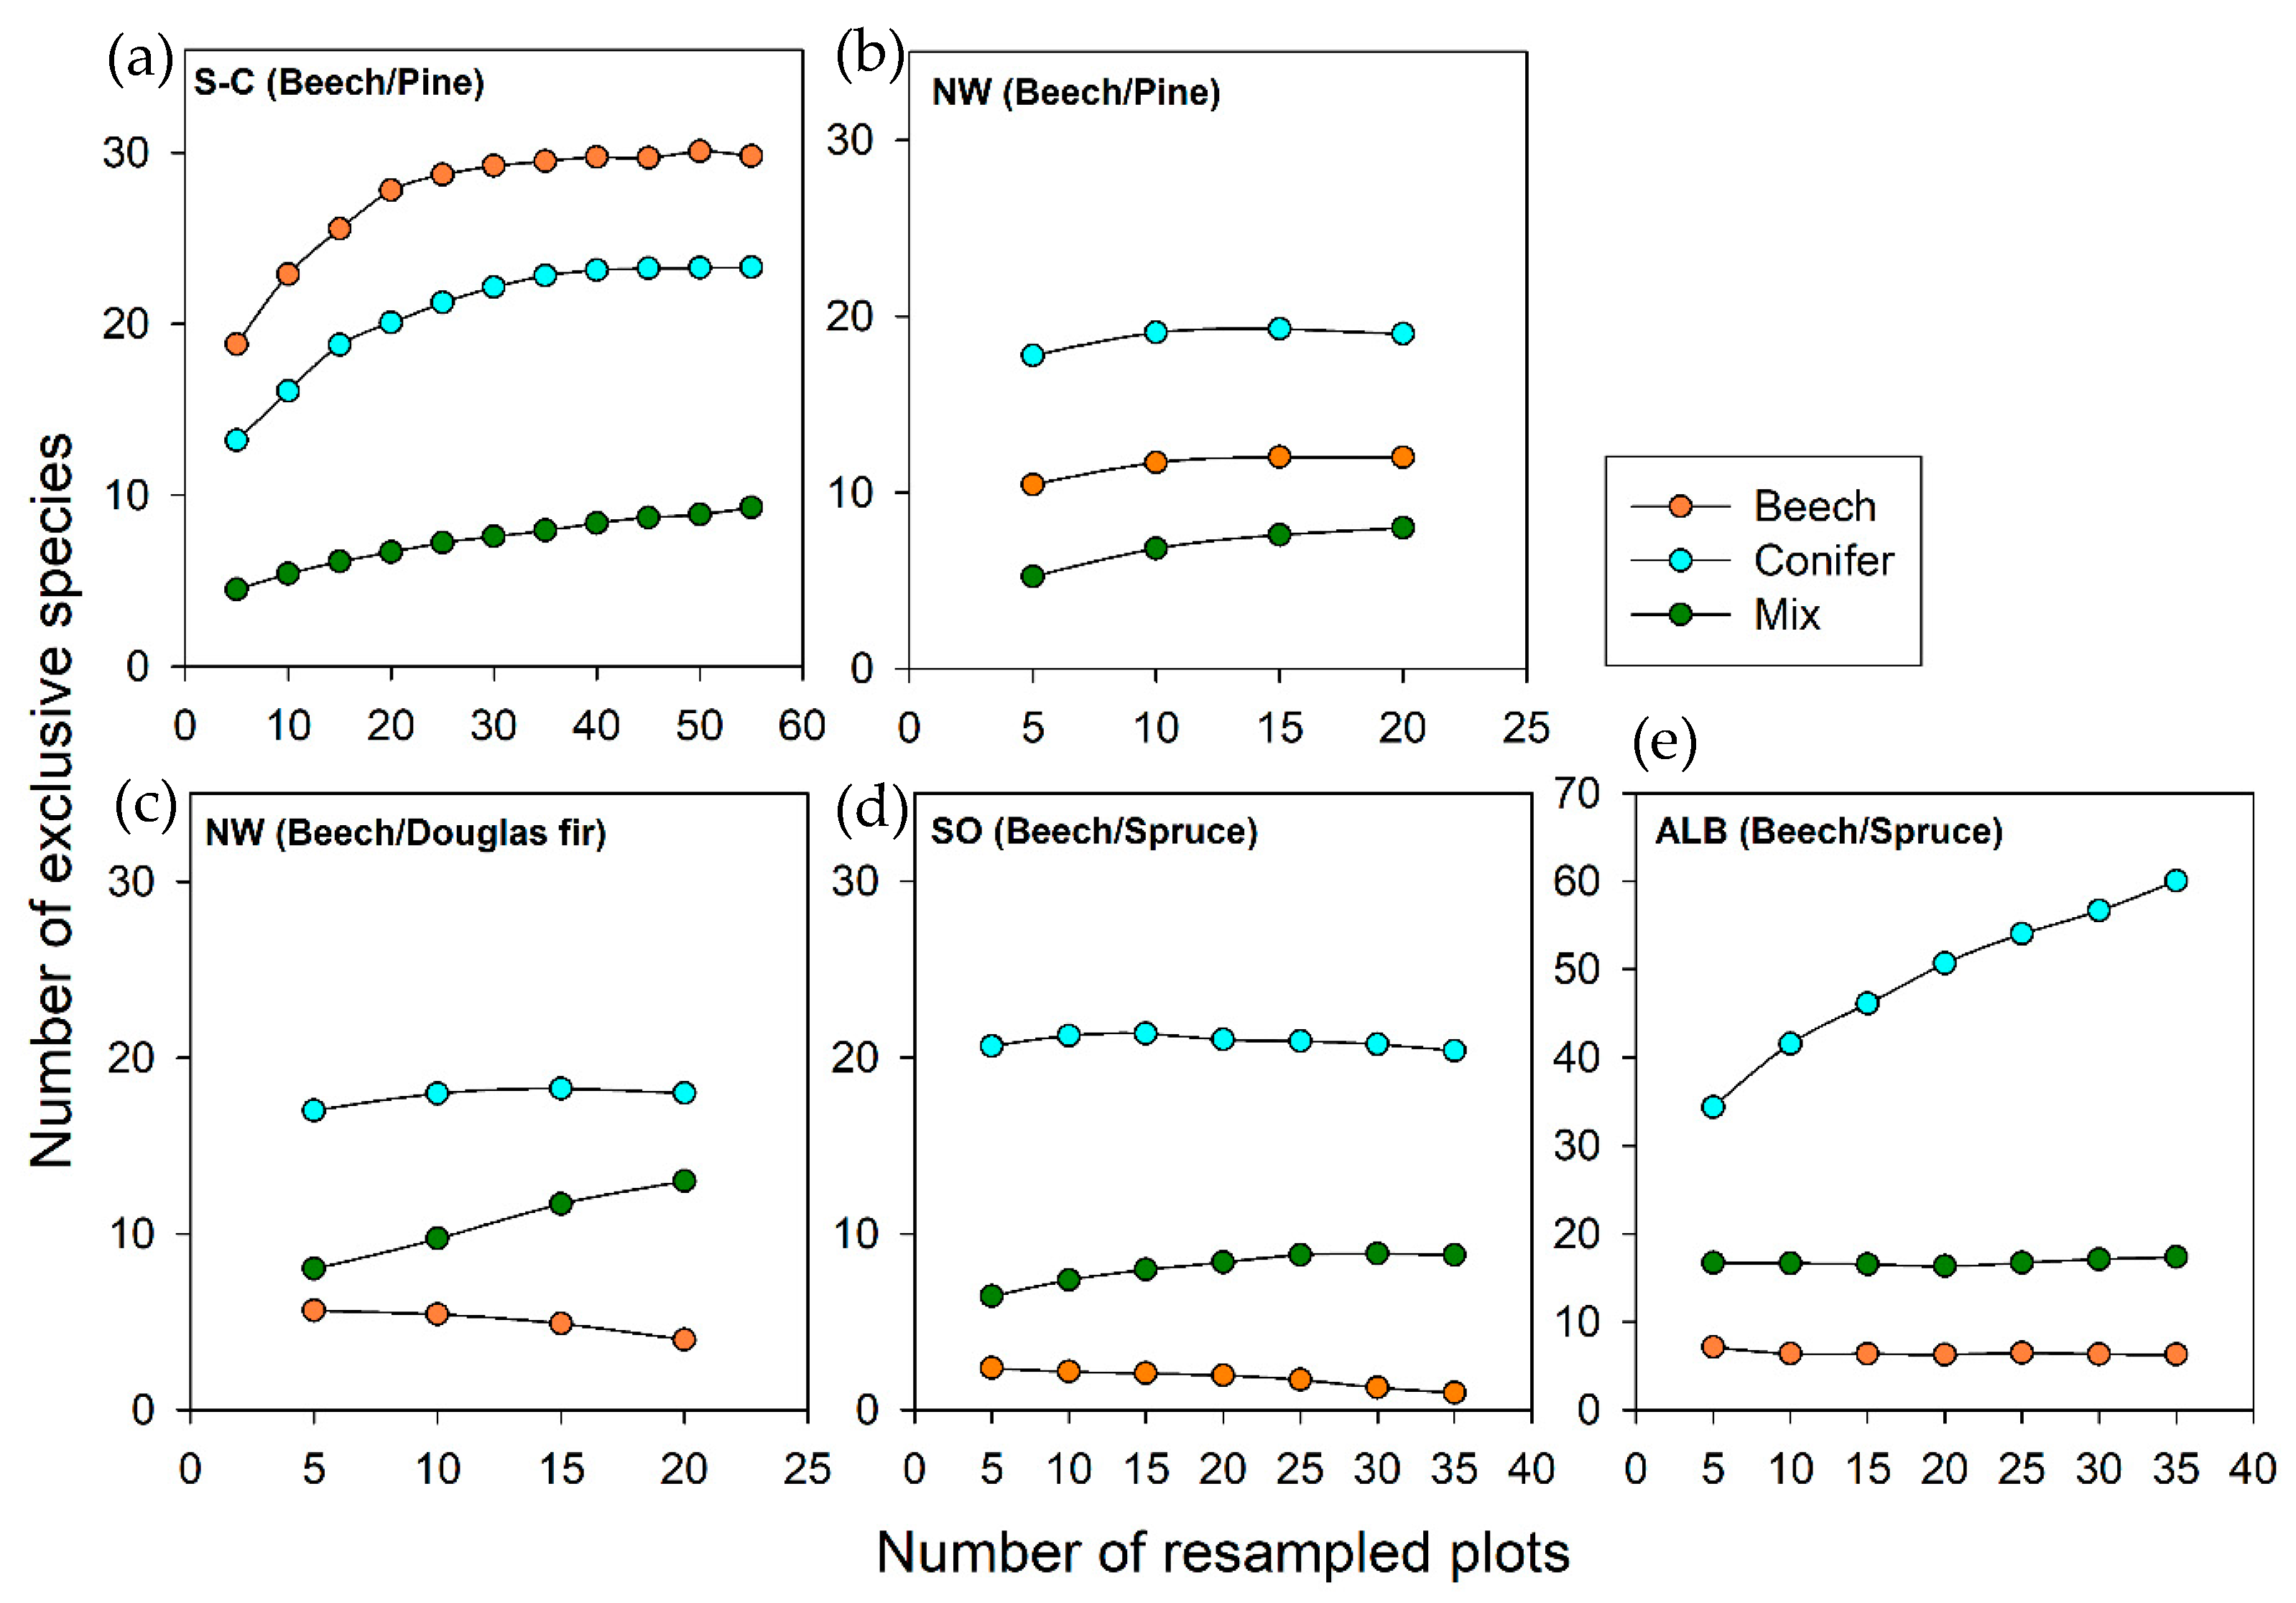
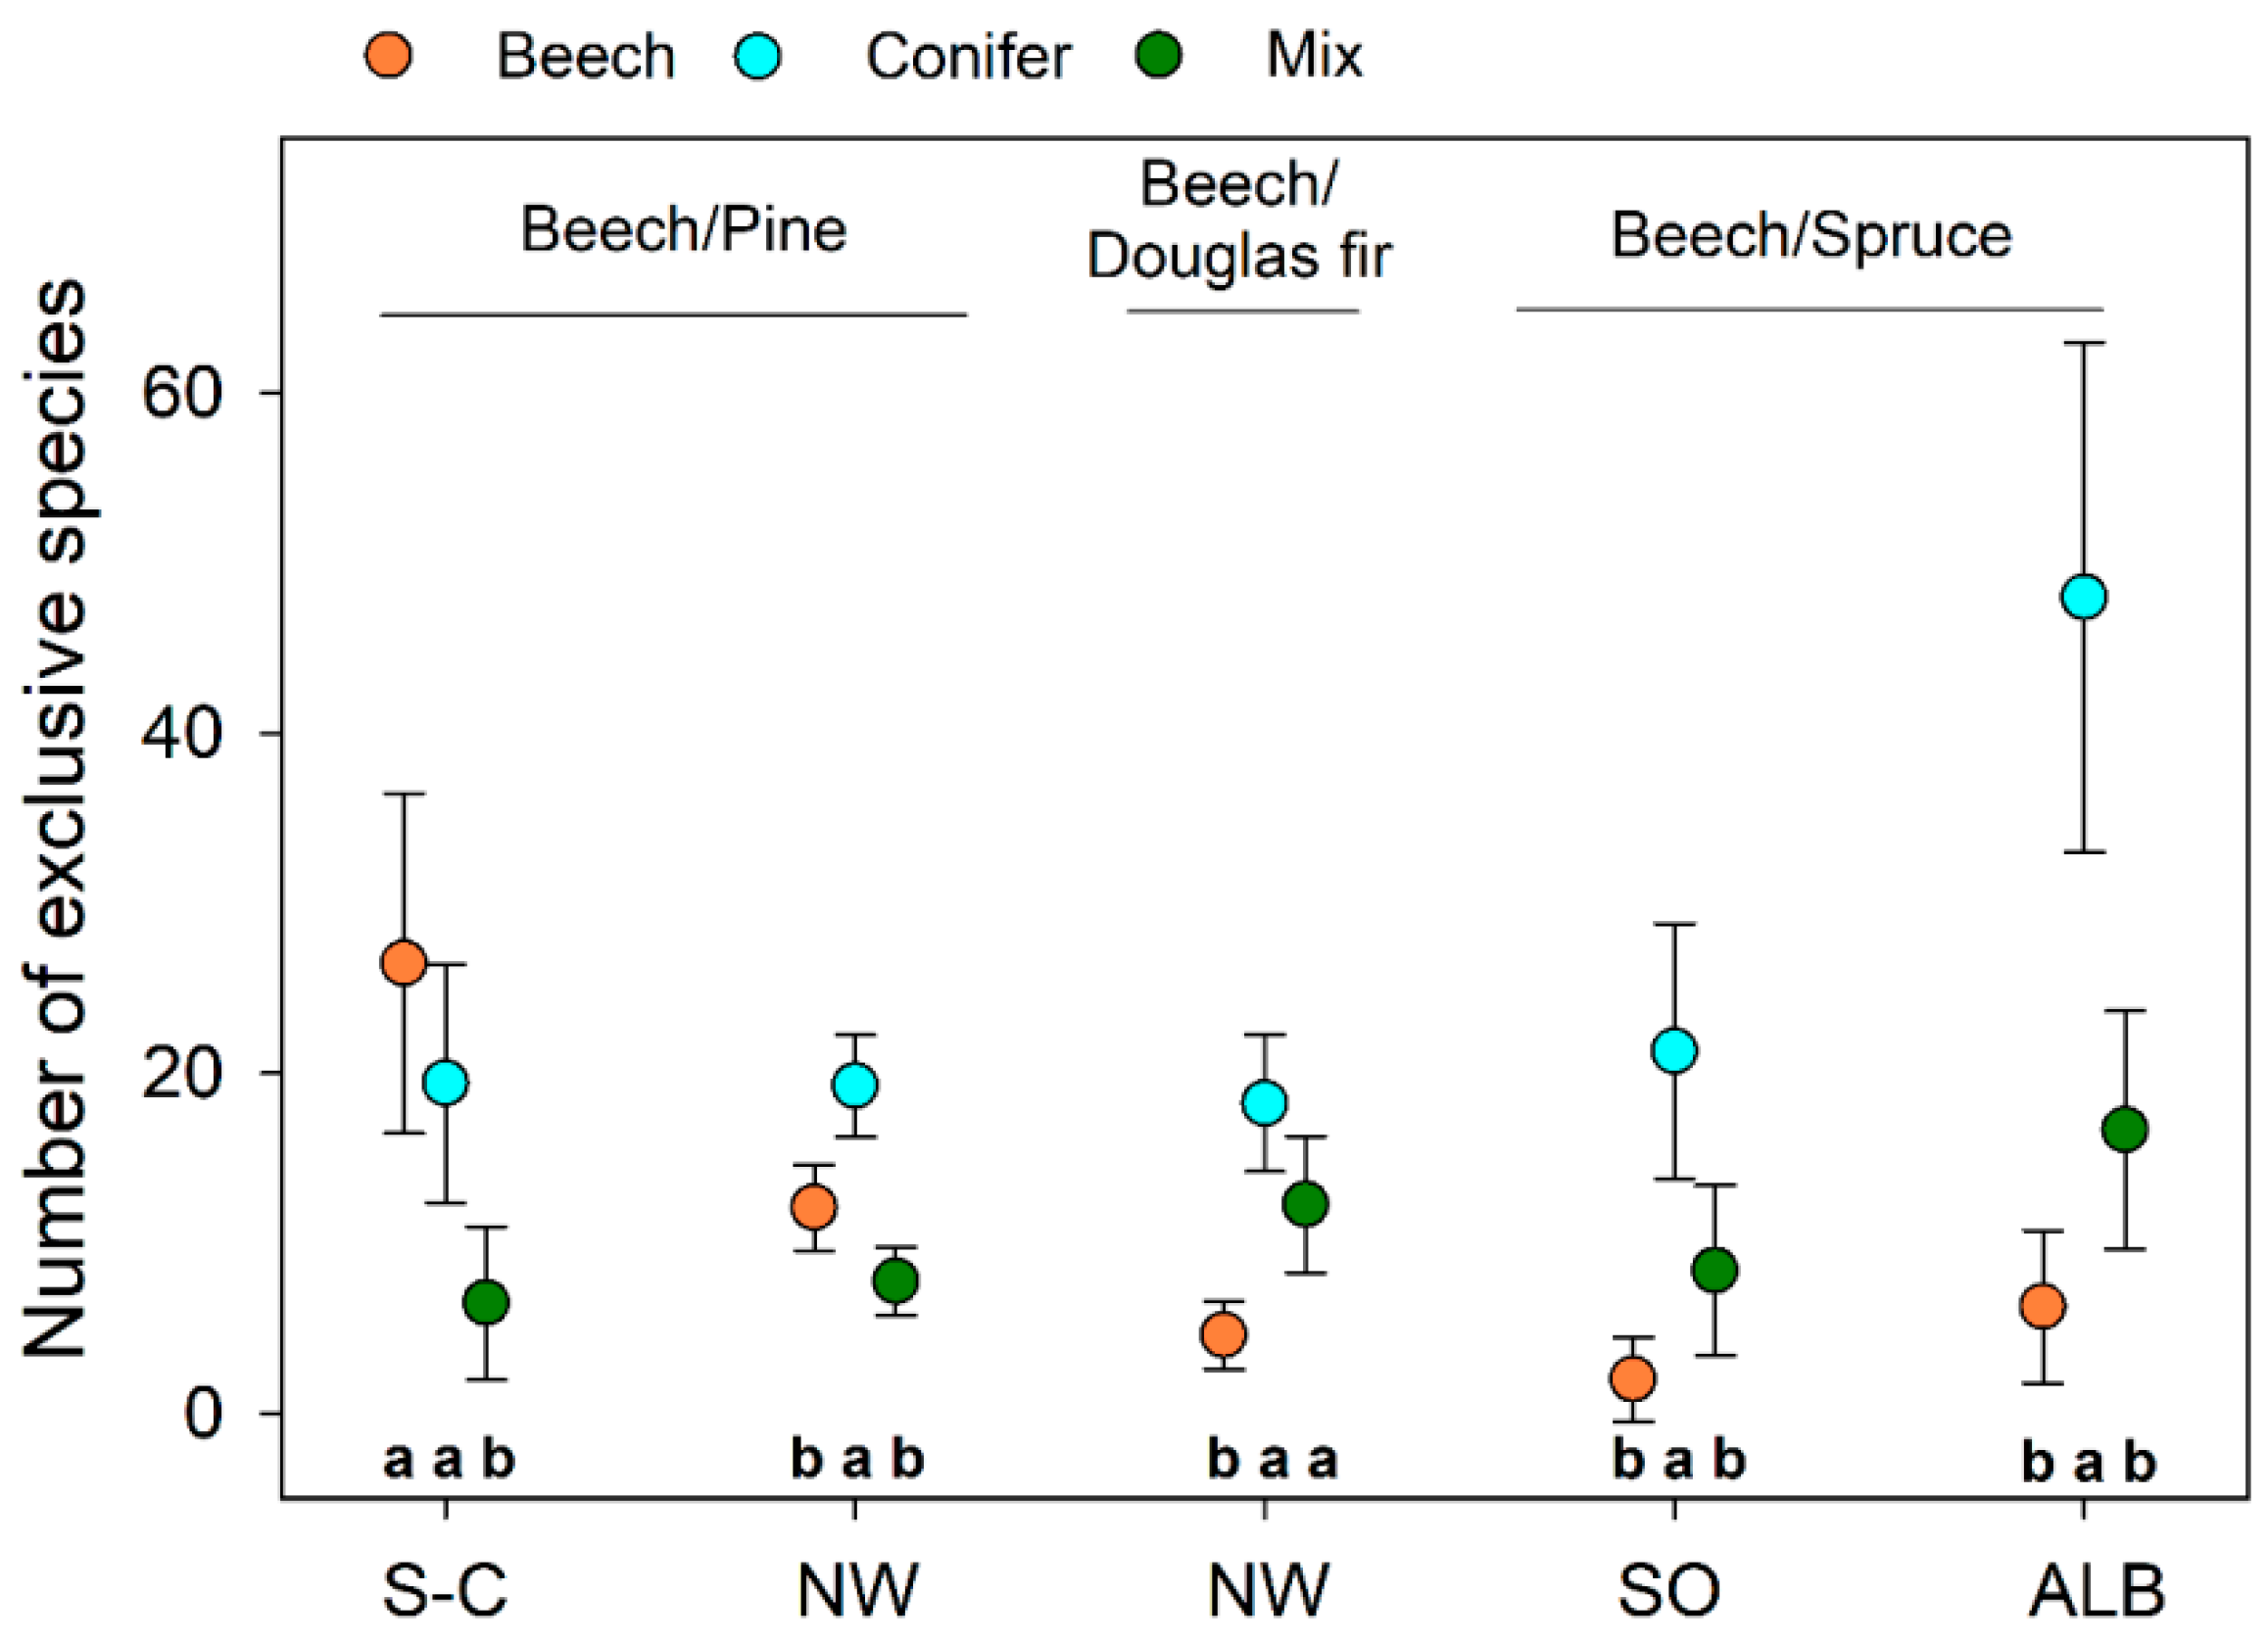
Stand type composition patterns for maximum diversity are in line with detected exclusive species numbers (Figure 4). While beech/pine mixtures had on average 6.5 (Schorfheide-Chorin) and 7.6 (NW-Germany) exclusive species per resampling when compared to the respective pure stands, pure pine stands supported on average 19.5 and 19.3 exclusive species. Mean exclusive species numbers of pure beech stands (26.5 species in Schorfheide-Chorin, 12.1 species in NW-Germany) also exceeded numbers of beech/pine mixtures.
When compared with pure spruce stands and beech/spruce mixtures, pure beech stands supported the lowest number of exclusive species (with no significant difference to mixtures). In general, the conifer stands on acidic sites (see Figure 2b) showed a remarkable constancy in exclusive species numbers across tree species ranging from on average 18.3 (Douglas fir) to 21.3 (spruce in Solling) exclusive species per resampling. On calcareous soils of Schwäbische Alb, stand types had twice as much exclusive species compared to the acidic Solling region. As the number of exclusive species characterizes resamplings (n = 17), numbers may change with increasing sampling completeness [65] indicating instable gamma diversity patterns. However, differences in exclusive species numbers remained relatively stable among stand types with an increasing number of resampled plots (Figure A2). Pure spruce stands of Schwäbische Alb and beech/Douglas fir mixtures showed a steady increase in exclusive species numbers with sampling effort. Thus, the detected stand type composition pattern for Schwäbische Alb even intensified with a higher number of resampled plots (Figure A3). A gamma diversity comparison of stand type combinations with pure Douglas fir stands and beech/Douglas fir mixtures, though, seems to require a higher sampling effort than covered by the present study.
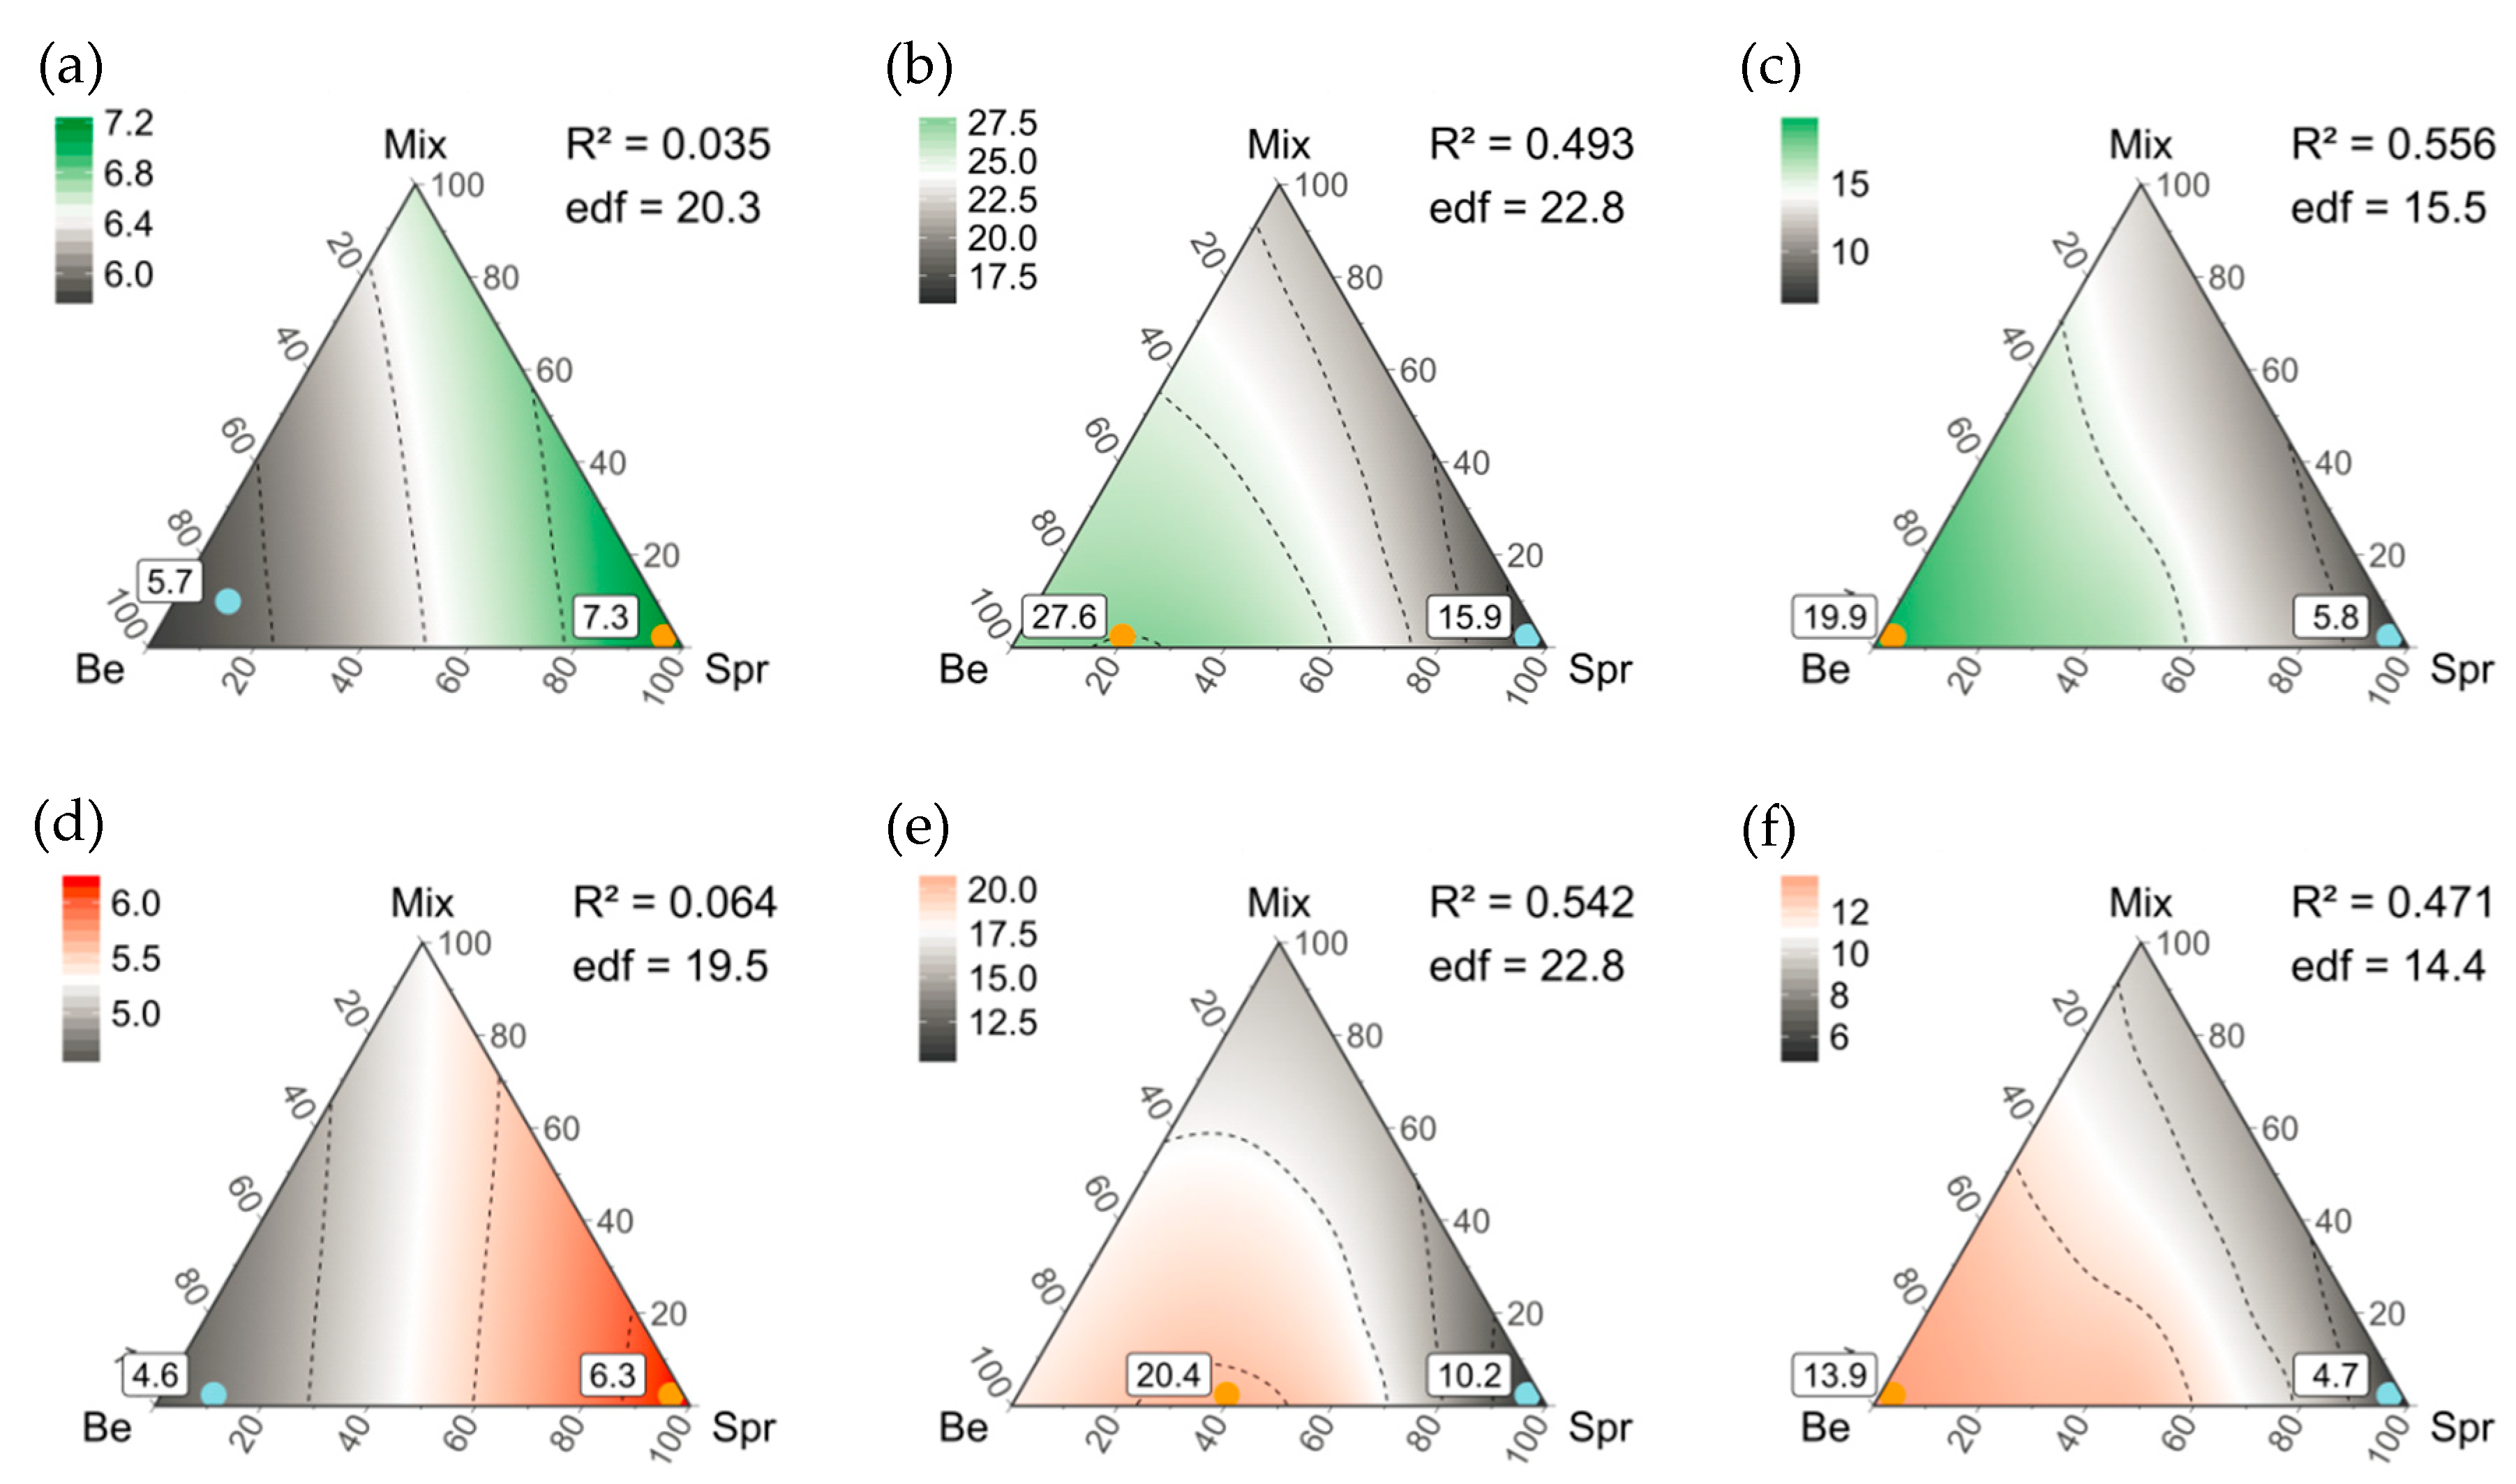
Threatened or protected vascular plant species mainly occurred in the Schwäbische Alb and showed no significant response to stand type composition (Figure A4a,d; Table A2).

3.3. Diversity Patterns of Bryophytes and Lichens

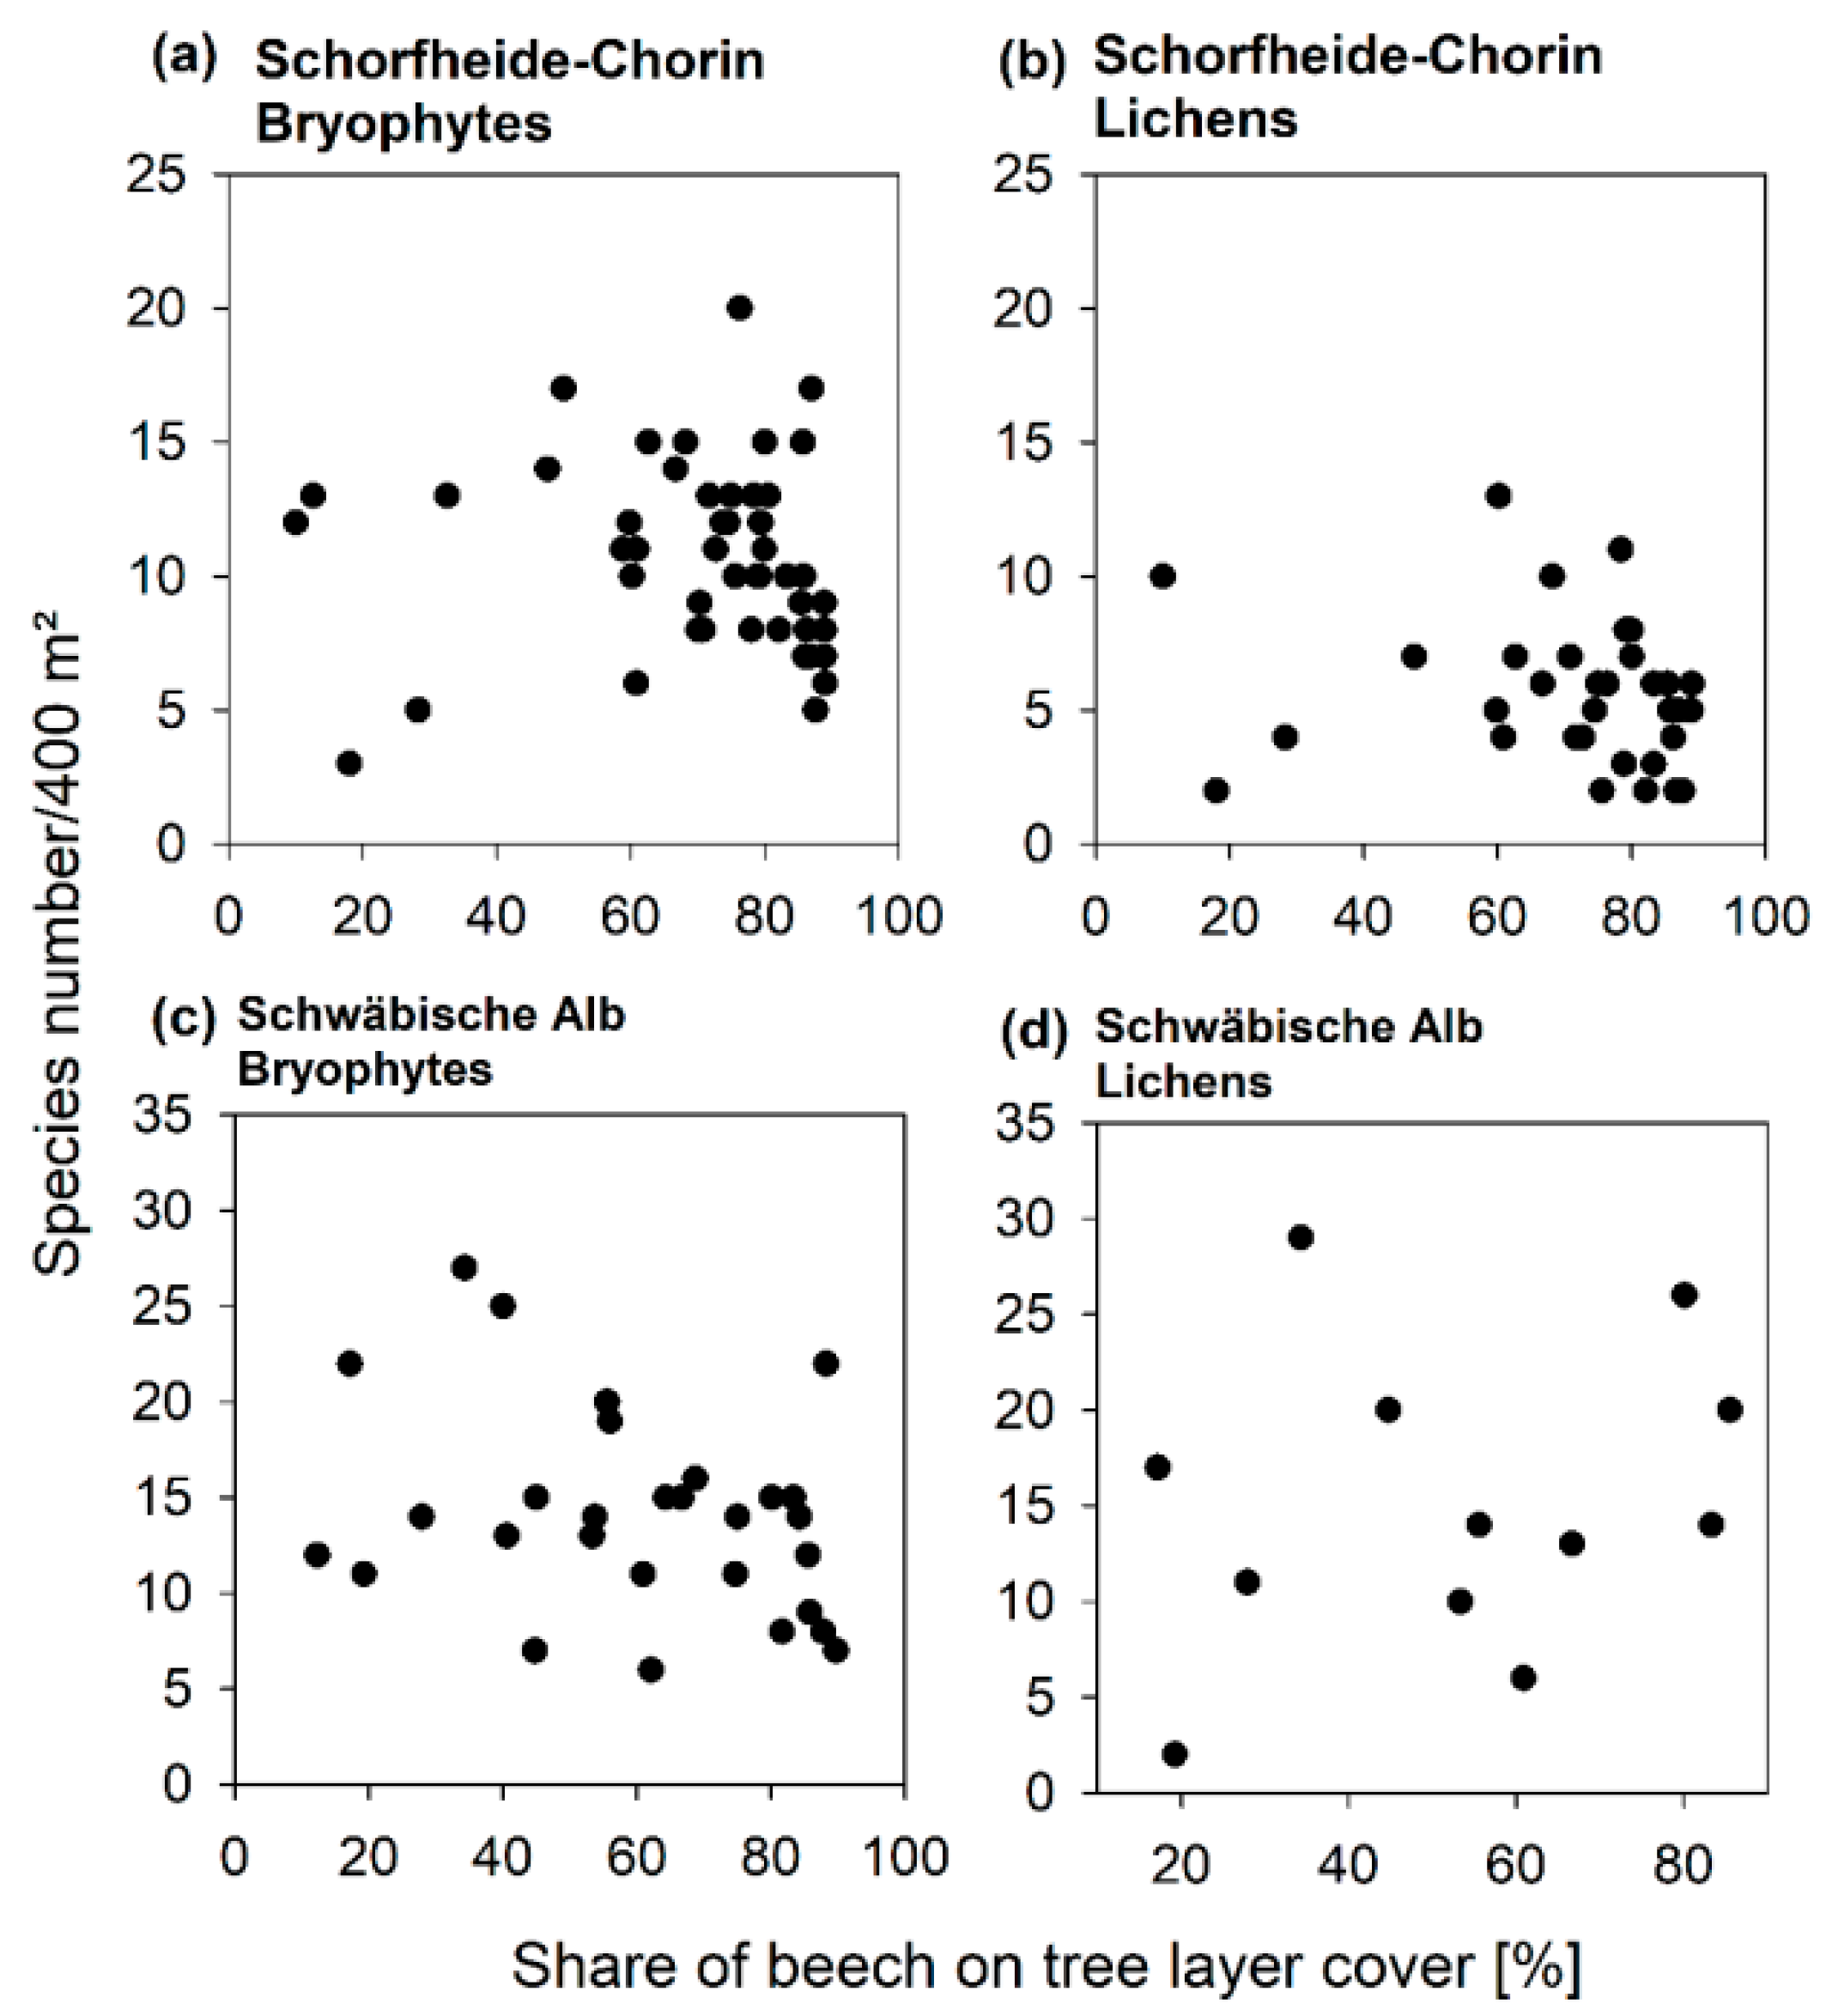
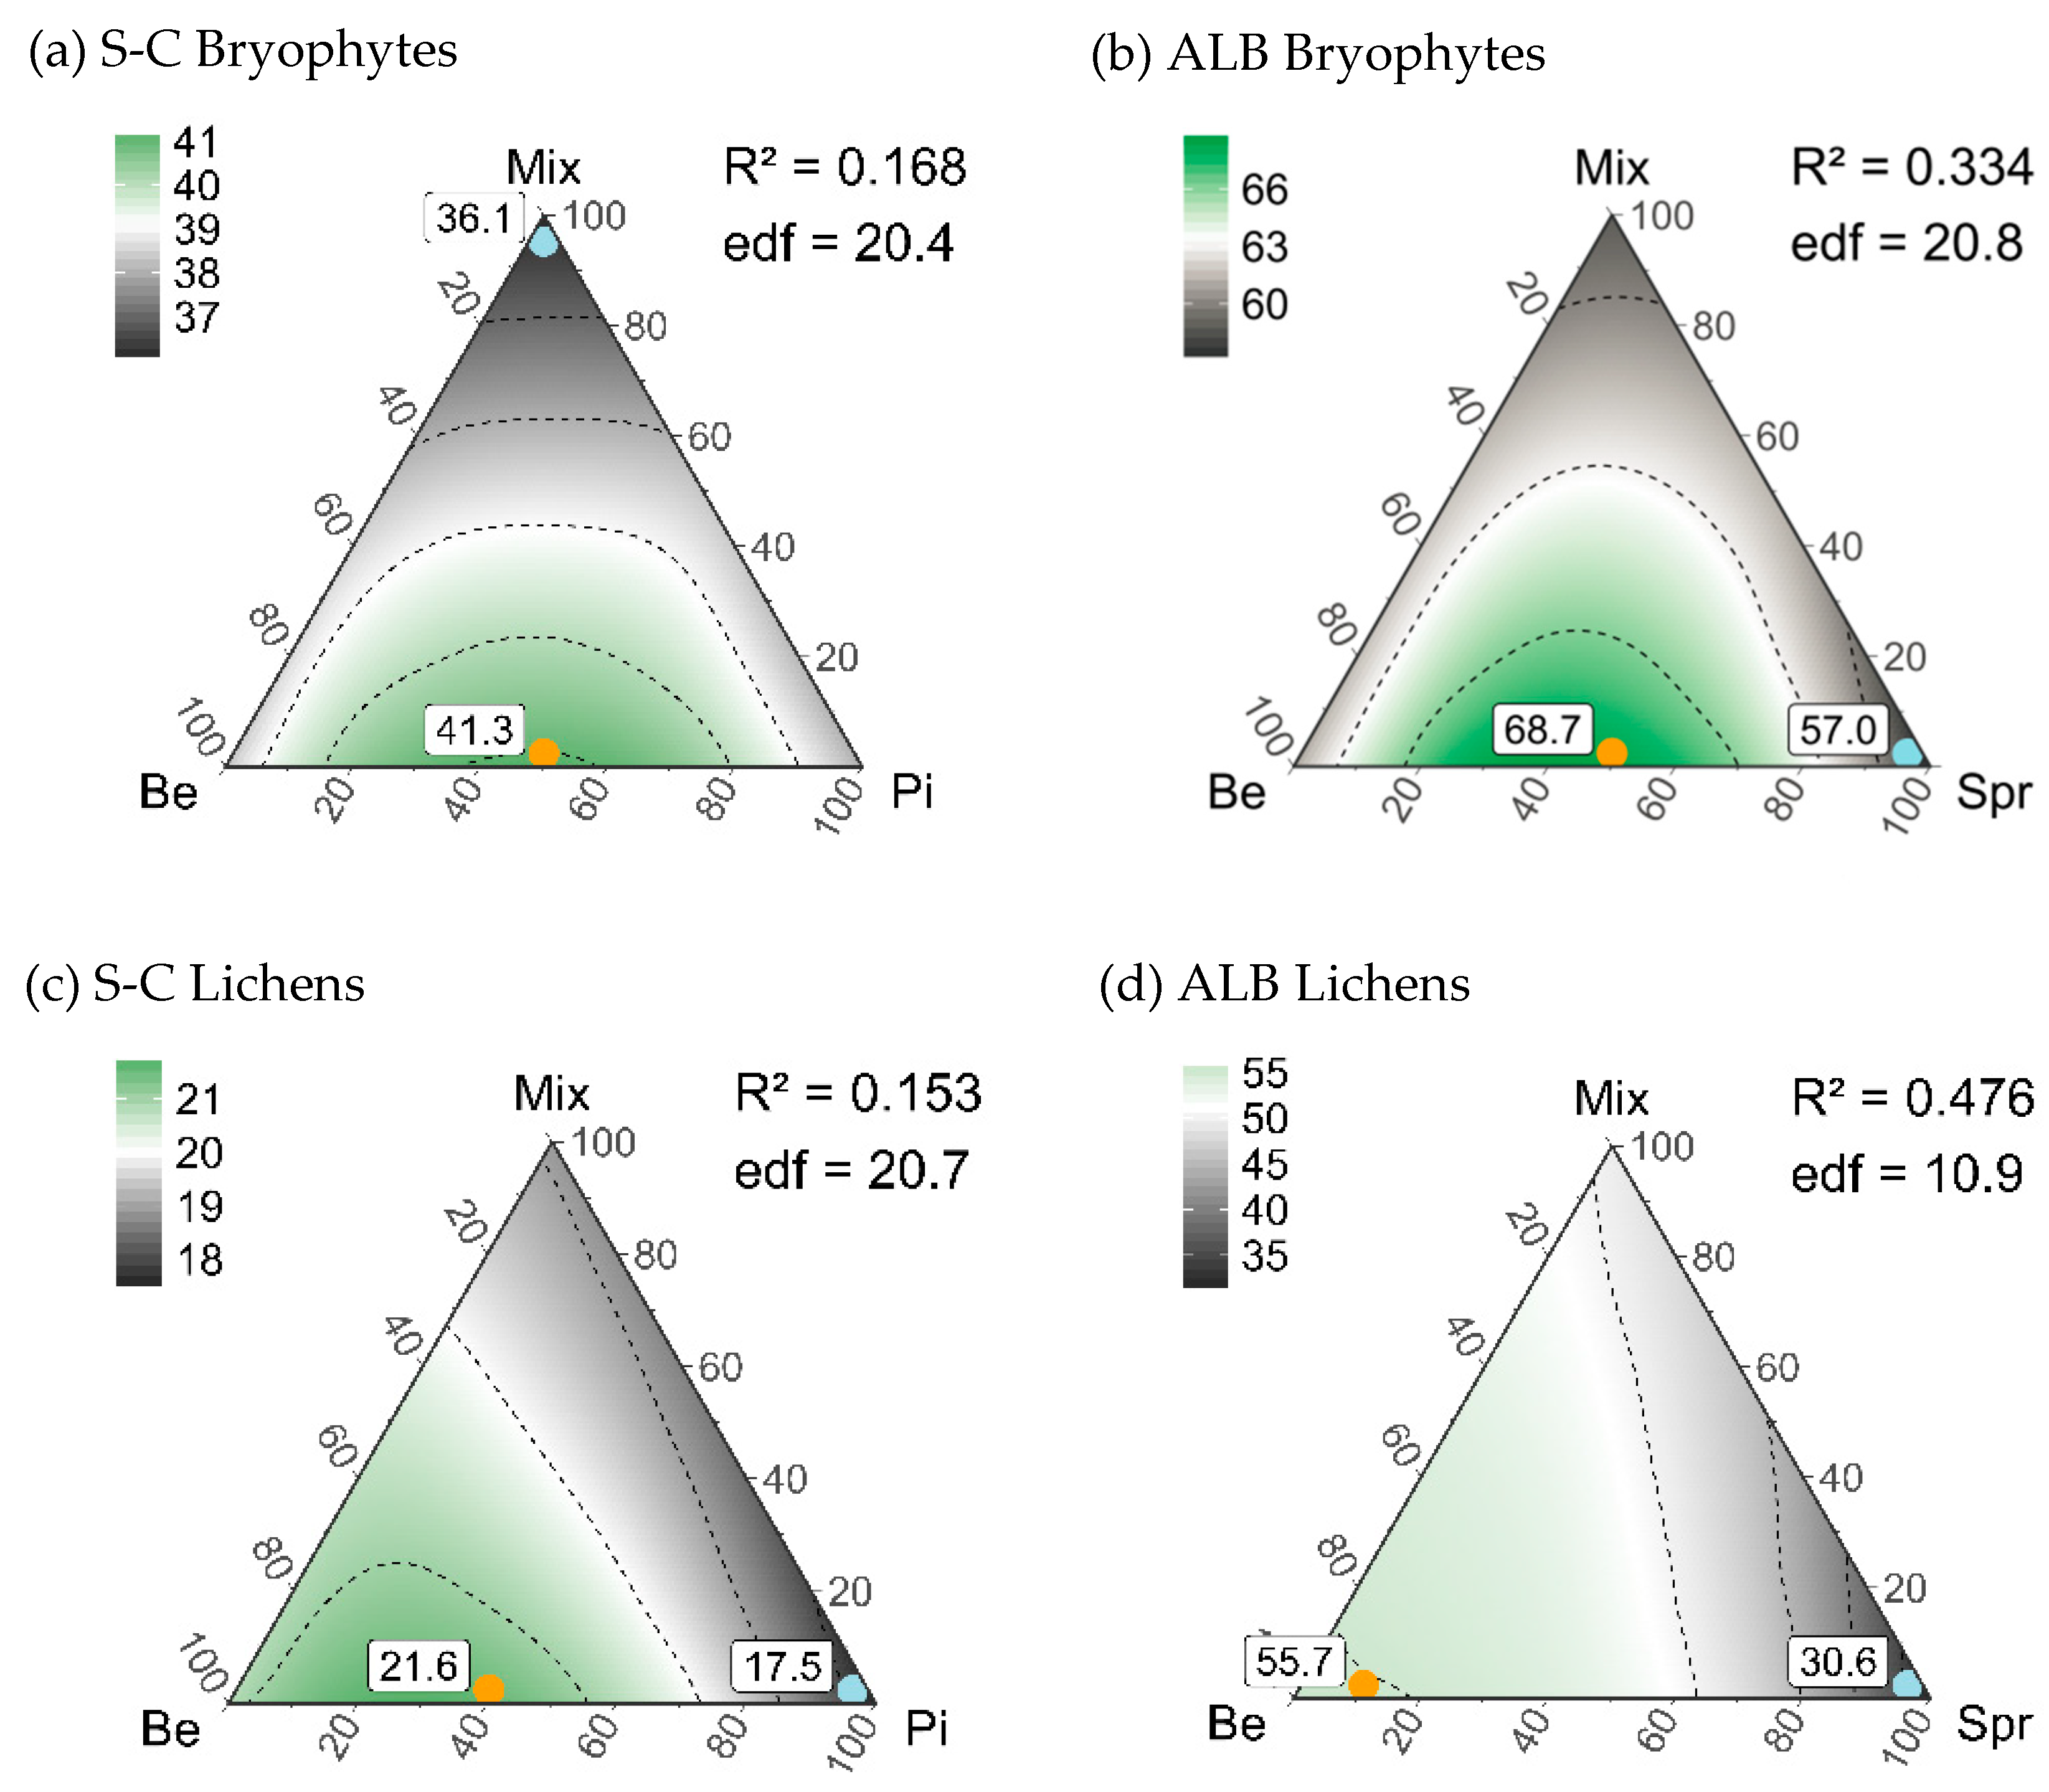
Stand types of Schorfheide-Chorin showed no significant difference in alpha or gamma diversity for bryophytes and lichens (Table 3). The share of beech and pine on the tree layer within mixtures also had no effect on alpha diversity of both taxonomic groups (Figure A5). Similar to vascular plants, maximum mean gamma diversity per resampling was detected for a combination of pure beech and pure pine stands within a landscape but with no significant difference to the minimum (=100% mixed stands for bryophytes and 100% pure pine stands for lichens; Figure 5a,c).
In Schwäbische Alb, we found highest alpha diversity of bryophytes in conifer stands and highest alpha diversity of lichens in beech stands. The share of beech and spruce within mixtures had no significant effect on alpha diversity of both taxonomic groups (Figure A5). At the landscape scale, an equal share of pure beech and pure spruce stands supported maximum gamma diversity of bryophytes (Figure 5b). Hypothetical landscapes composed of 100% mixed stands or 100% pure spruce stands were significantly less diverse (Table 3). Lichens showed a clear minimum in a pure conifer landscape and were mainly associated with beech stands (Figure 5d). A mean maximum diversity was detected for a combination of 90% pure beech and 10% pure spruce stands, but with no difference to a landscape composed of 100% pure beech stands.
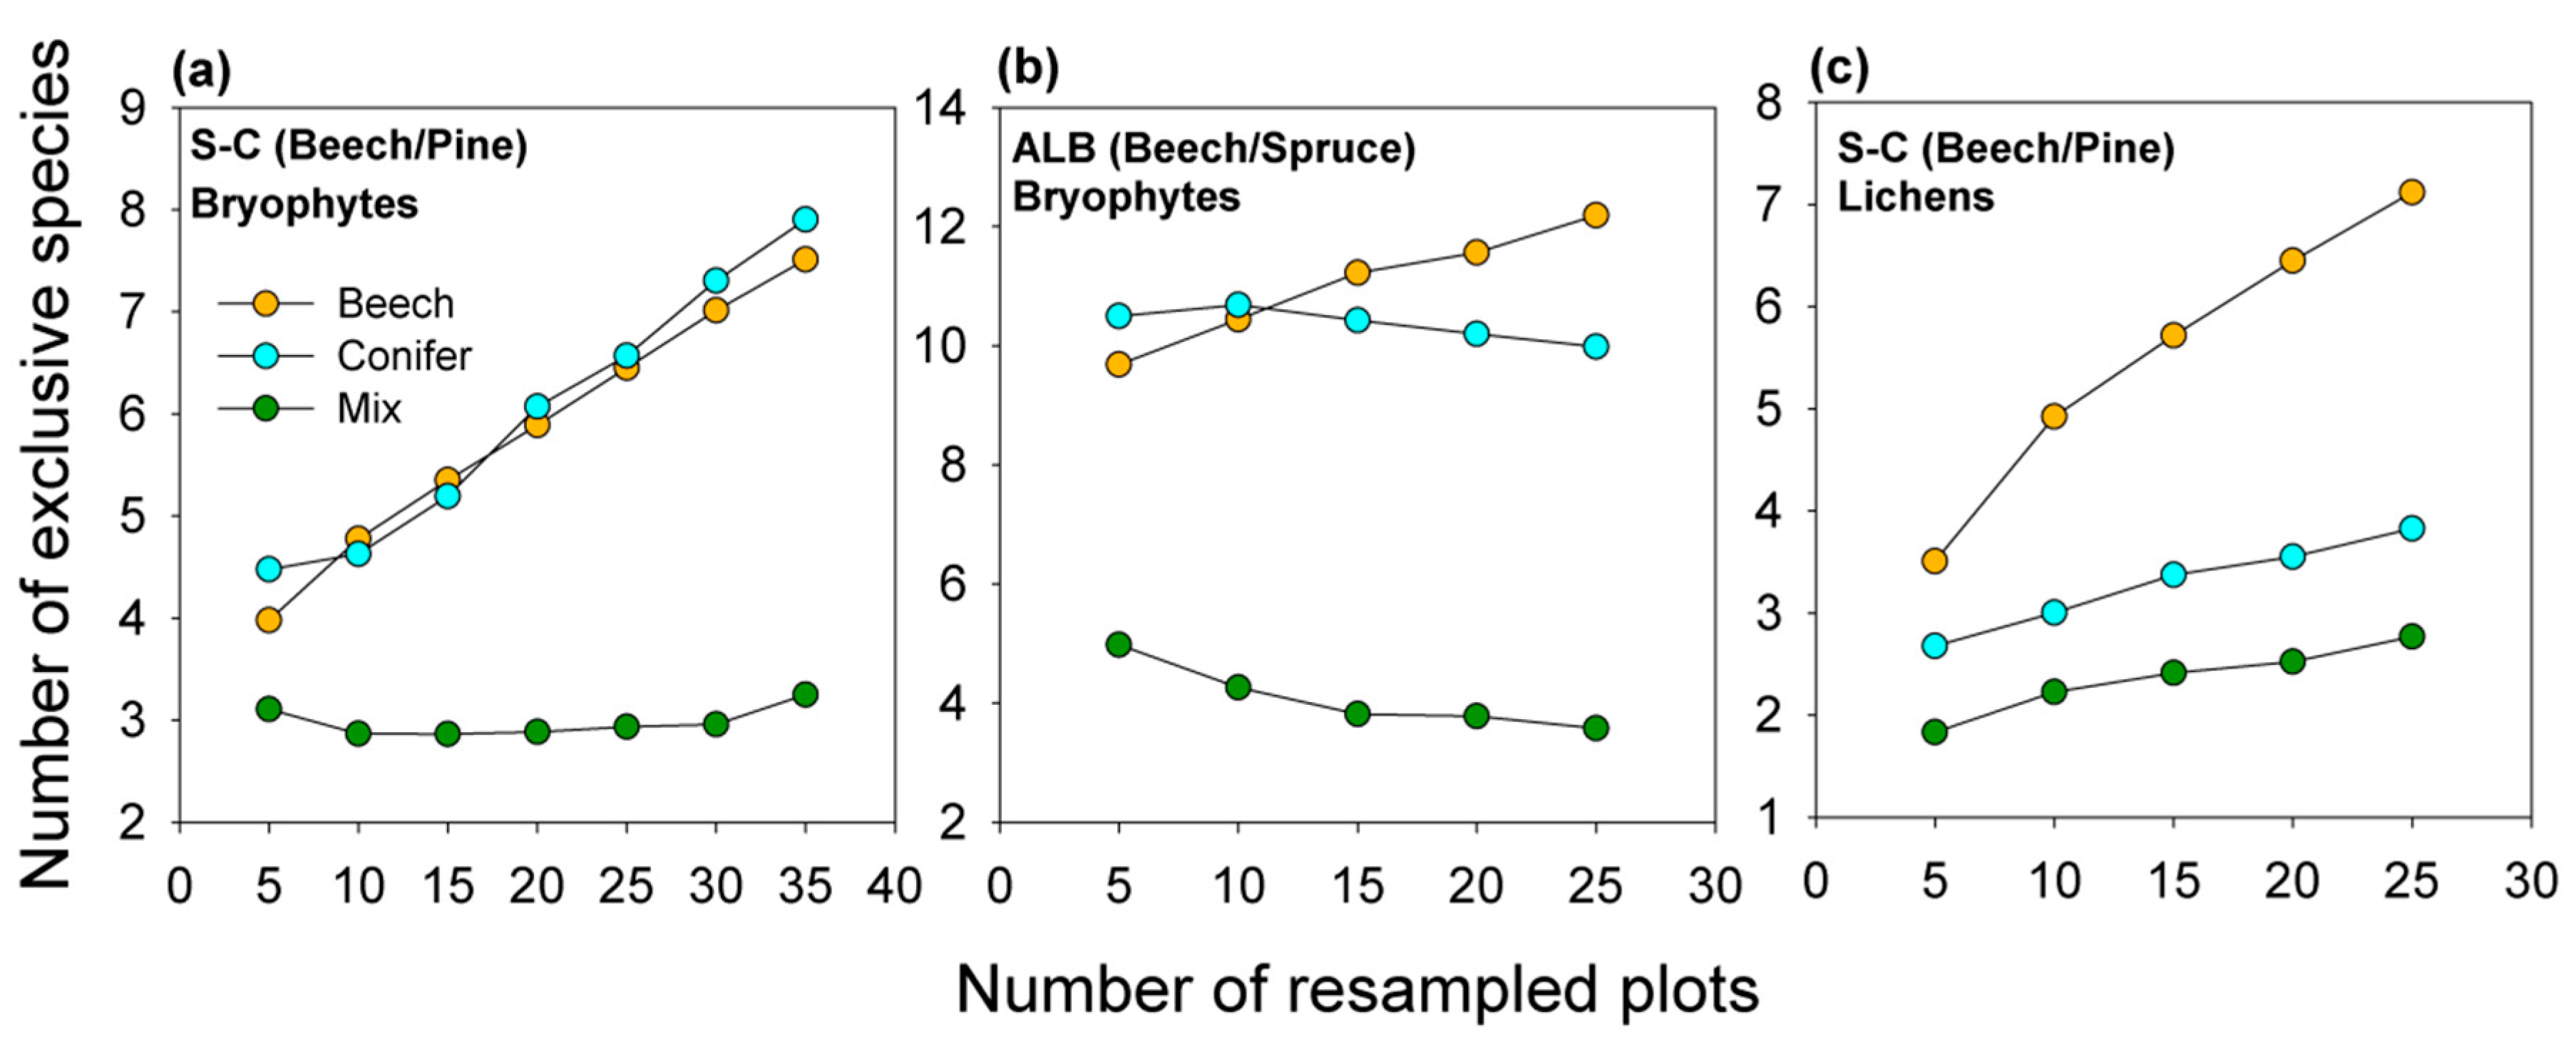
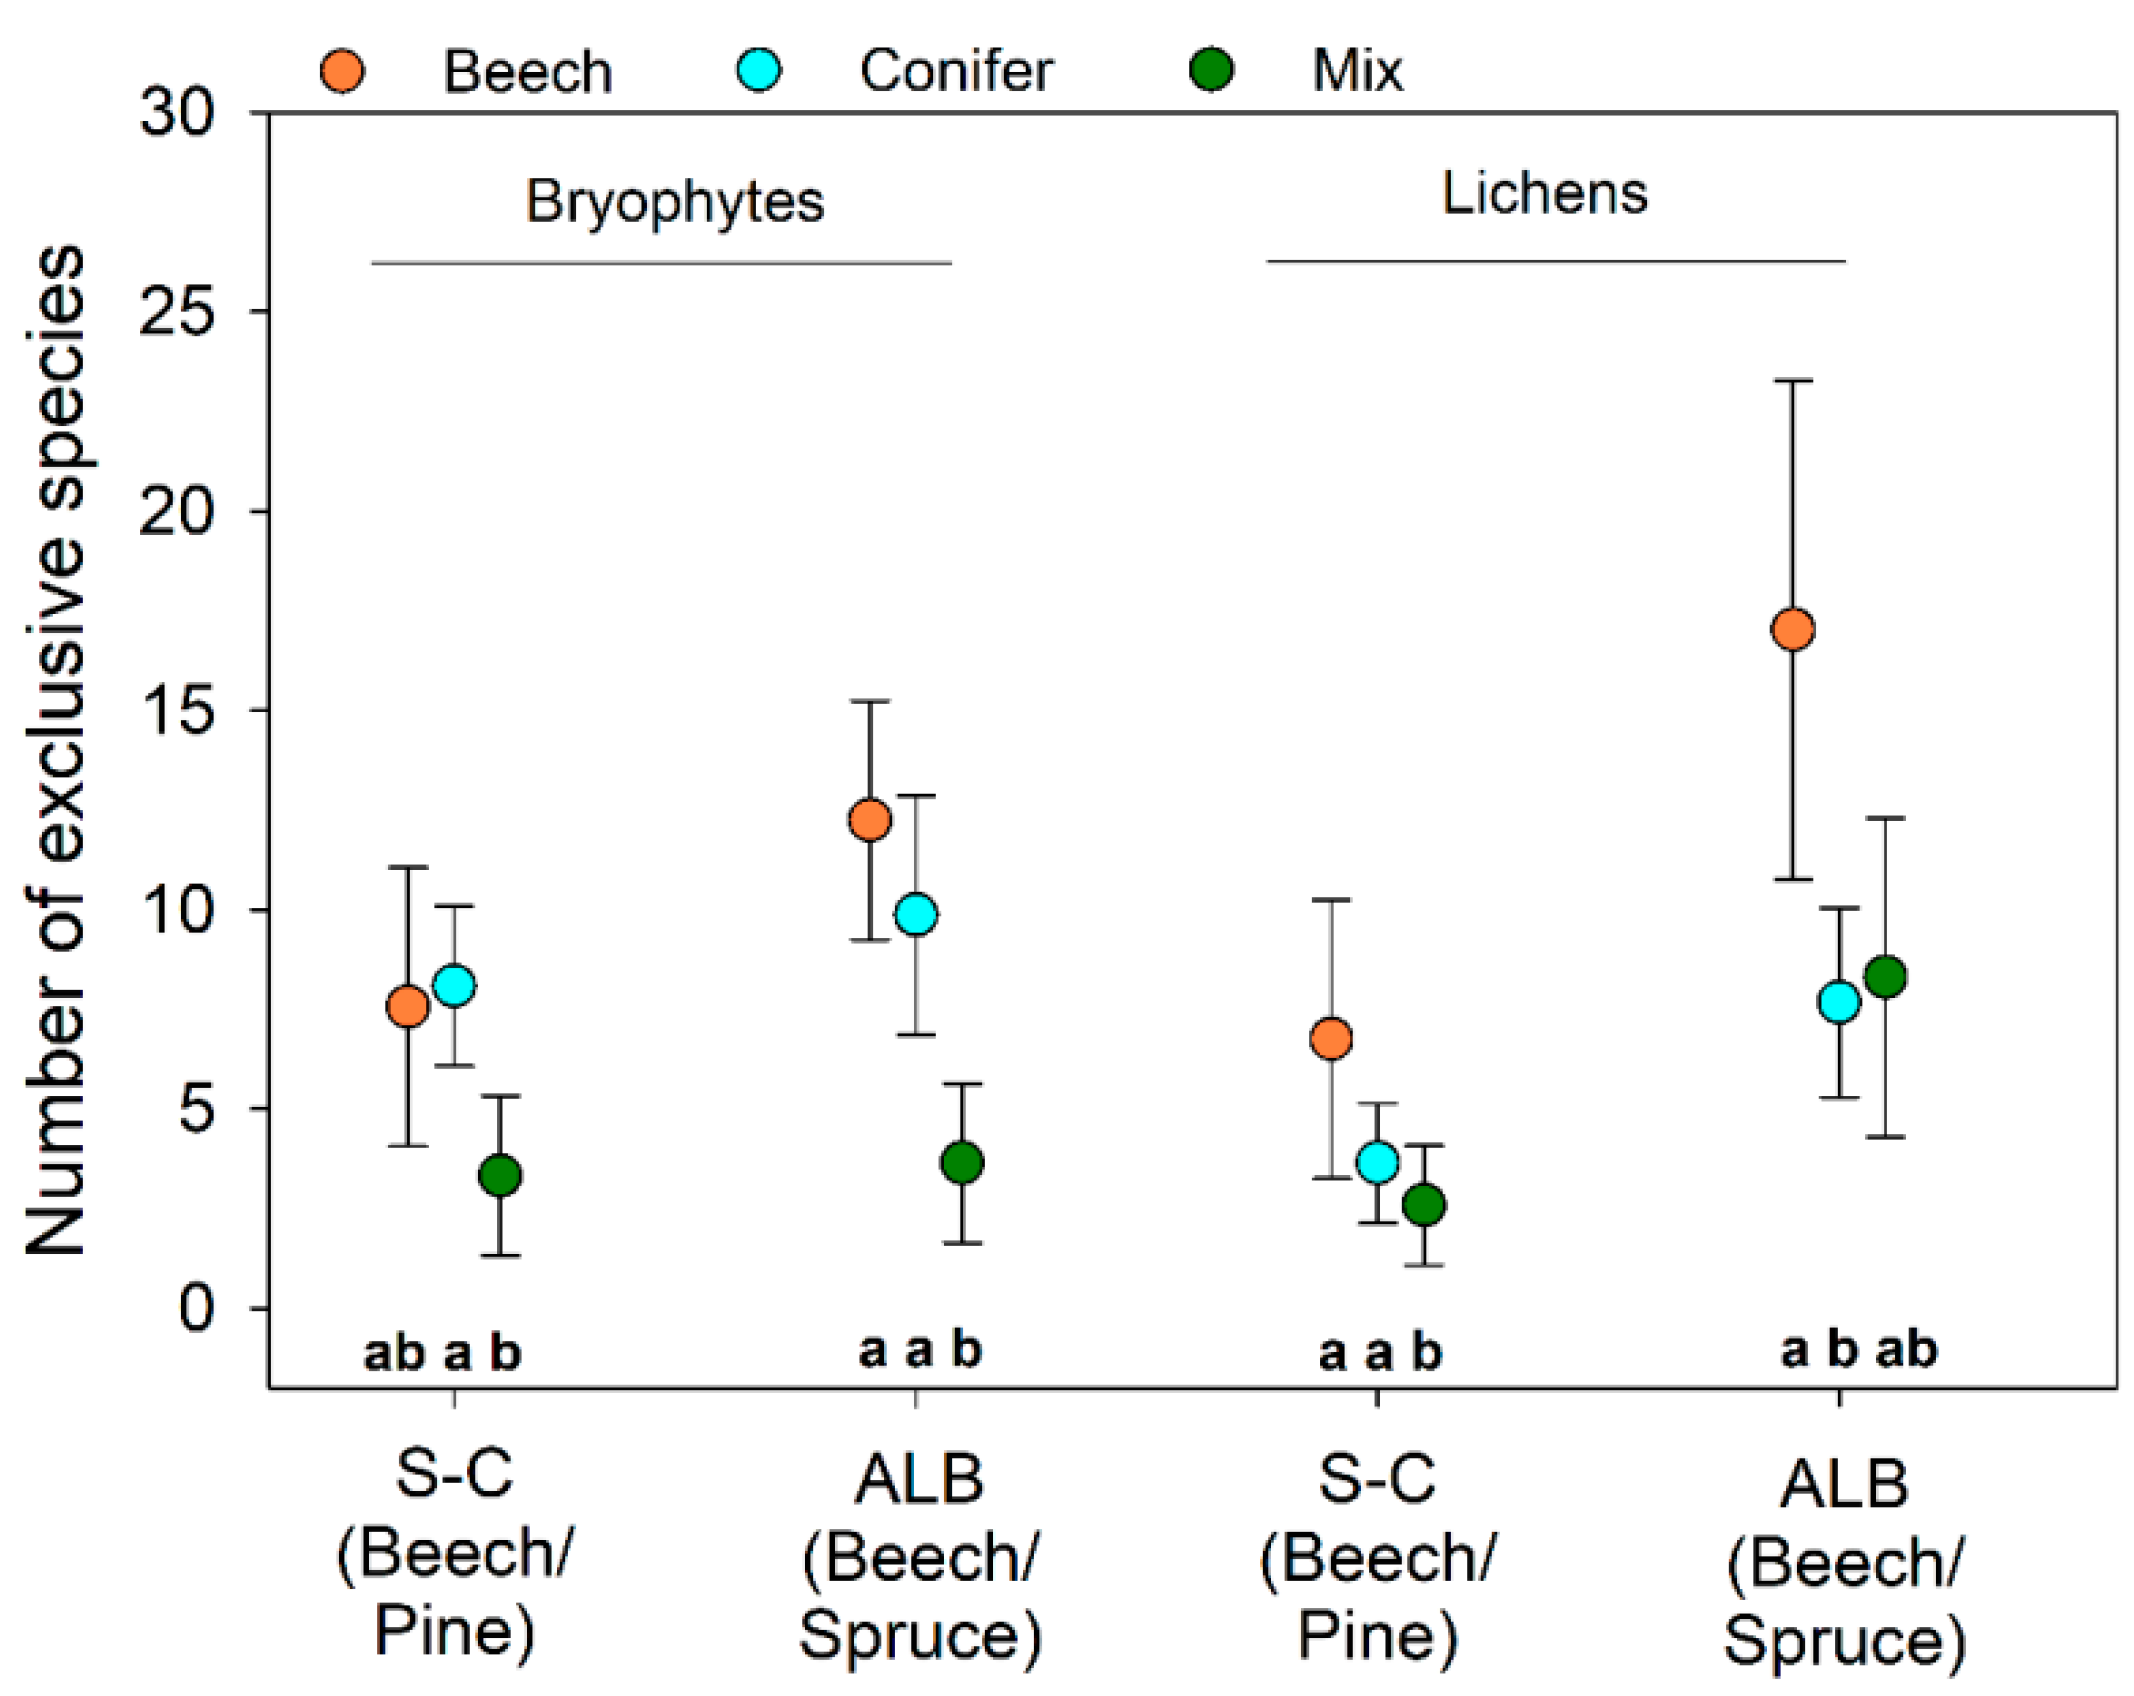
Mixed stands showed the lowest number of exclusive bryophyte species in Schorfheide-Chorin (with no significant difference to exclusive species numbers in pure beech stands) and Schwäbische Alb (Figure 6). For Schorfheide-Chorin, the total pool of exclusive bryophyte species within pure stands has not been reached yet, indicating a stabilization of the detected stand type composition pattern with increasing sampling effort (Figure A6). For lichens, beech stands showed the highest number of exclusive species, but with no significant difference to pure pine stands in Schorfheide-Chorin and to mixed stands in Schwäbische Alb.
Threatened and protected species of bryophytes and lichens rarely occurred in surveyed plots of Schorfheide-Chorin (in less than 20% of surveyed plots per stand type) not allowing for a robust resampling (Table A3 and Table A4). In Schwäbische Alb, threatened and protected lichen species responded similarly as overall lichen diversity to stand type composition (Figure A4c,f). Threatened bryophyte species were promoted by a high share of pure beech stands (Figure A4b) or by pure beech and pure spruce stands when single occurrences were not considered (Shannon diversity, Figure A4e).

3.4. Characteristic Species within Stand Types

While differences in exclusive species numbers among stand types can explain the contribution of each stand type to gamma diversity, this measure gives no information on the identity of species or their specifity to or frequency in a stand type. Using indicator species analyses, we therefore identified those species that were significantly more strongly associated with one or two stand types compared to the third (see Table 4, Table 5 and Table 6). These characteristic species were presumably often exclusive per resampling in the specific stand type.
Among vascular plants, we found no characteristic species for mixed stands compared to both pure stands except for Pteridium aquilinum in NW-Germany when compared to pure beech and pine stands. The same species, though, characterized pure pine stands in Schorfheide-Chorin. In contrast, 25 species were significantly more strongly associated with pure conifer stands compared to pure beech and mixed stands across regions and tree species combinations (Table 4). In addition, 19 species were characteristic for mixed and pure conifer stands at the same time compared to pure beech stands in at least one region (=C/M; Table 4).
Despite a high number of exclusive species in beech stands of Schorfheide-Chorin, only few species occurred with a sufficient average frequency of more than 20% per resampling to be categorized as being characteristic for beech stands in Schorfheide-Chorin. However, six recorded species (including Anemone nemorosa) were significantly more strongly associated with beech stands compared to pure pine stands and beech/pine mixtures. Compared to pure spruce stands and beech/spruce mixtures, no species was significantly more strongly associated with beech stands. With A. nemorosa and A. ranunculoides, two species were associated with pure beech stands and with beech/spruce mixtures (B/M; Table 4).
Species characteristic of pure conifer stands are more light demanding (higher mean light indicator value) compared to species of beech stands or compared to species also associated with mixtures. A lower share of species closely associated to forests also characterizes them (=forest affinity categories). Species assigned to the categories 1.1 (closed forests species) and 1.2 (species of edges and clearings) within the list of forest species [63] made up 24% among conifer associated species, 80% among beech associated species and 50% among those species also associated with mixtures in at least one region (Table 4).
Twelve bryophyte species were characteristic of pure conifer stands compared to the other stand types in at least one region, while four species were characteristic of pure beech stands. Ten species were also associated with mixed stands in combination with one of the pure stand types (C/M and B/M: 5 species each). Most of the identified bryophyte species are able to grow on different substrates. Among species that were significantly more strongly associated with pure beech stands or beech stands and mixtures, four species do not use soil as substrate (Table 5).
Characteristic lichen species of pure and mixed stands were mainly identified for Schwäbische Alb (Table 6). For this region, three species were significantly more strongly associated with conifer stands and four species with beech stands. Five additional species were characteristic in pure beech stands and beech/spruce mixtures compared to pure spruce stands. In Schorfheide-Chorin, three lichen species were associated with mixed stands in combination with one pure stand type. All identified lichen species grow either epiphytic or on deadwood. However, 80% of the identified species associated with beech either in pure stands or in mixtures are obligatory epiphytes. For the five species that were more strongly associated with conifers, only two are obligatory epiphytes.
Differences in light indicator values among stand types for characteristic cryptogam species are not as pronounced as for vascular plants (see Table 5 and Table 6). However, conifer associated cryptogam species supported a lower share of closely associated forest species (categories 1.1 and 1.2; 26.7%) compared to characteristic species of pure beech (37.5%) or of pure and mixed stands (38.8%).

3.5. Composition of Stand Types for Highest Regional Diversity

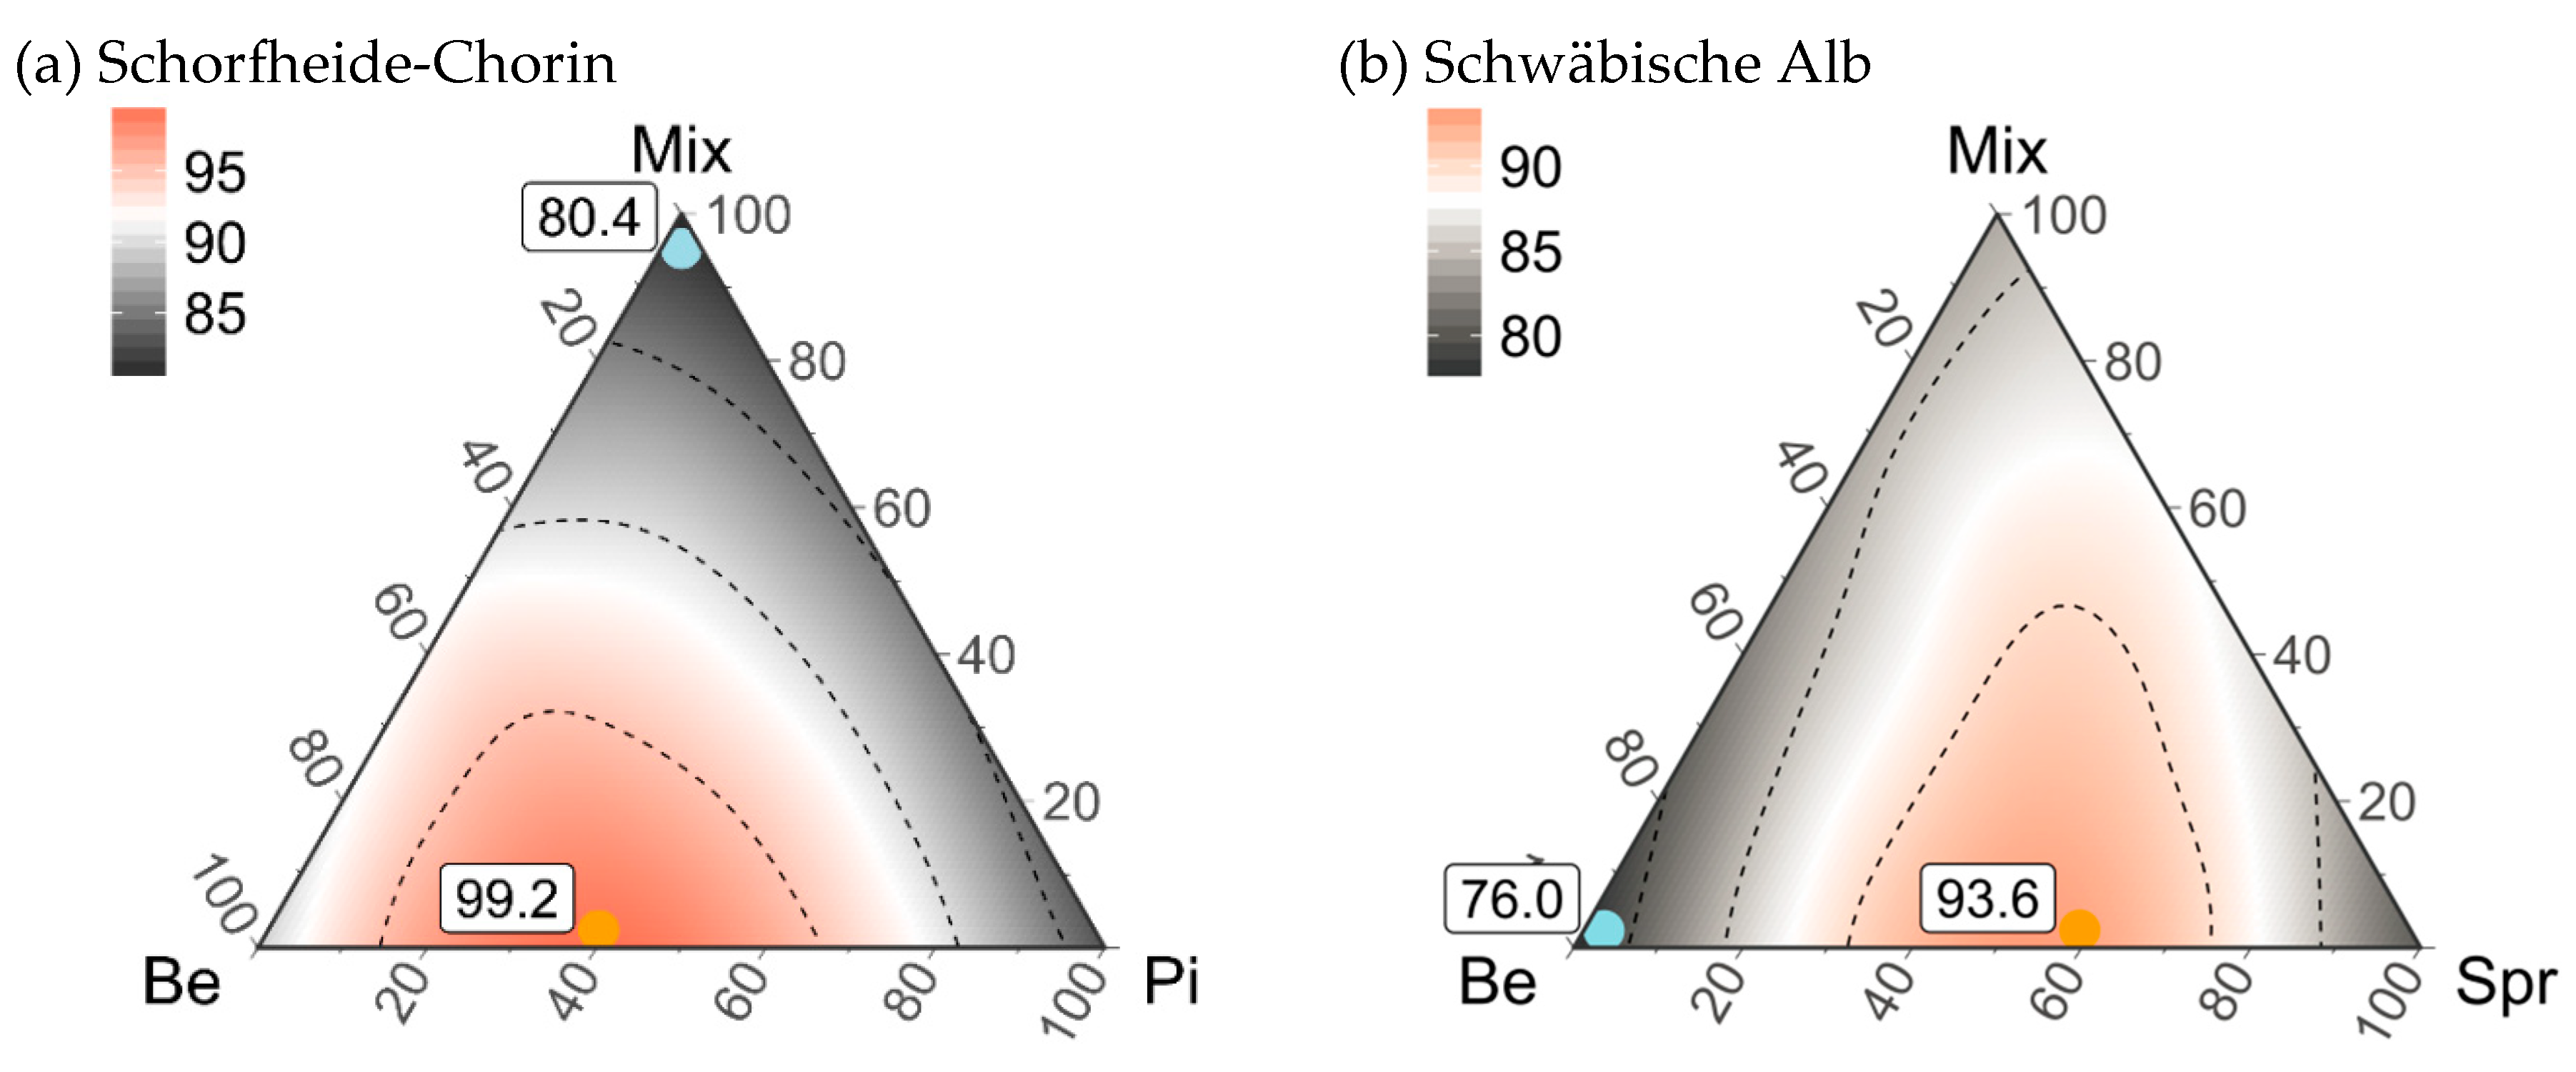
Combining gamma diversity of the three investigated taxonomic groups into a regional diversity measure for Schorfheide-Chorin and Schwäbische Alb resulted in an optimized stand type composition for biodiversity of 50% pure beech and 50% pure pine stands or 60% pure spruce and 40% pure beech stands, respectively (Figure 7).
With 99.7% of regional diversity, a combination of pure beech and pure pine stands supported almost the total diversity of the three groups that was sampled in Schorfheide-Chorin, whereas a hypothetical forest landscape with 100% mixed stands reduced the maximum diversity by 19.8%. 100% pine stands supported a regional diversity of 86.1% (−13.6% of maximum gamma diversity), a hypothetical pure beech landscape of 93.8% (−5.9%). For Schwäbische Alb, a maximum regional diversity of 93.3% was reached. 100% mixed stands reduced the maximum diversity by 7.3%. This reduction was lower compared to hypothetical forest landscapes of 100% pure beech (−14.9%) or 100% pure spruce stands (−12.7%). Results for both regions were consistent for Shannon diversity (=down-weighting of infrequent species) with a slight shift of maximum diversity towards a higher share of pure beech stands in Schorfheide-Chorin (optimized composition of 40% pure pine and 60% pure beech stands; Figure A7).

4. Discussion

In contrast to our expectations we did not find higher gamma diversity in mixed compared to pure stands showing that neither additive nor interactive effects between the investigated tree species within a stand promoted the diversity of vascular plants, bryophytes or lichens better than pure stands. For no investigated taxonomic group, study region or tree species combination, a hypothetical forest landscape composed of only mixed stands was significantly more diverse than a landscape composed only of pure stands of a single or of different tree species. This was also the case for threatened and protected species. In addition, we found no stand type combination supporting maximum gamma diversity that included a share of mixed stands.
In the following, we discuss our findings for the different taxonomic groups separately and end with findings on regional diversity combining the investigated groups.

4.1. An Optimized Stand Type Composition for Vascular Plant Diversity

Pure beech and pure pine stands showed a certain degree of complementarity between their species assemblages (compare [65]). Thus, mixing of beech and pine stands at the landscape scale is effective for the gamma diversity of vascular plants (landscape scale diversity), mixing the two tree species at the stand level (=stand scale mixture) led to a reduced gamma diversity. Species that were more associated with beech stands (e.g., Anemone nemorosa, Carex remota, Milium effusum and the neophyte Impatiens parviflora) are species of closed forests, whereas species characteristic of pine stands can occur both in forests and at open sites (e.g., Rubus fruticosus agg.) or at edges and clearings (e.g., Epilobium angustifolium). Thus, differences in canopy cover and consequently light availability are most likely responsible for the detected complementarity between beech and pine stands in the study regions Schorfheide-Chorin and NW-Germany. In addition, species such as Calluna vulgaris or Vaccinium myrtillus, characteristic for pine stands, are adapted to nutrient deficient habitats and may be relict species of former agricultural and heathland management of sites now dominated by pine [43]. Some characteristic species of beech stands, on the other hand, have been identified as ancient woodland indicators for northern Germany (e.g., Carex remota, Milium effusum, Viola riviniana, [67]). While pure pine stands supported a higher gamma diversity of vascular plants in NW-Germany than pure beech stands, the latter were more diverse than pine stands in Schorfheide-Chorin. In the latter region, beech stands often grow on slightly more favorable soil conditions compared to pine and benefit from a heterogeneous geomorphology of the young Pleistocene landscape [68] compared to the homogeneous sandy sedimentations across northwestern Germany.
For both regions, though, beech/pine mixtures resulted in minimum gamma diversity. Vegetation composition in mixtures of beech and pine has already been described as being similar to beech due to the competitive strength of beech with no differences in the overall species pool [13,69]. Our results, however, show that beech/pine mixtures can neither accumulate beech and pine associated species nor can they fulfill the habitat function of pure beech stands. In a mixture with pine, beech trees may benefit from the lower intraspecific competition [70] and respond with an increased horizontal crown expansion leading to higher structural heterogeneity [71] as well as light absorption [72]. While an optimized use of canopy space can increase forest productivity or maintain a moist microclimate supporting decomposition processes or mitigating effects of global warming (summarized in [73]), the reduced light availability is detrimental for the understory diversity in the studied regions. In addition, belowground complementarity of the two tree species may negatively affect understory diversity. Brassard et al. [27] showed that mixtures of complementary tree species (e.g., early and late-successional, coniferous and deciduous species) enhance fine-root productivity by a more complete filling of the environment, including a higher horizontal volume filling [74,75]. This may increase root competition for the understory. The species that are partly associated with beech/pine mixtures in the two regions, Vaccinium myrtillus, Pteridium aquilinum, can grow in nutrient deficient habitats. In addition, Pteridium aquilinum indicates disturbances. Thus, the unidirectional loss of plant species in mixtures that are associated with both, pure beech and pure pine stands, indicates negative interactive effects among the tree species on a neighborhood scale that can decrease vascular plant understory diversity up to 37%.
No complementarity effects on species assemblages were found for tree species combinations with beech and spruce. Hypothetical forest landscapes of only pure spruce stands supported maximum gamma diversity in both study regions independent of soil type. This shows that pure spruce stands can support almost the total pool of vascular plant species associated with the investigated tree species within the regions. In contrast to Máliš et al. [76], our results give no evidence for a negative effect on typical beech forest species in the understory by pure spruce stands neither on acidic nor on calcareous soils. In fact, we found the lowest number of exclusive species within beech stands when contrasted to spruce stands and beech/spruce mixtures. Anemone nemorosa and A. ranunculoides were the only species mainly associated with beech both in pure stands and in mixtures (B/M in Table 4). Both spring geophytes are adapted to the high light availability before leaf unfolding and to a protective litter layer [22]. The minimum gamma diversity in beech forest stands can be explained by the low light availability (highest tree layer cover in beech forests), a thick impeding leaf litter layer [77] and a dense root system [76,78]. In addition, across the management cycle of beech, the canopy is intentionally kept relatively dense to ensure stem quality. In contrast, thinning in spruce stands starts early with effects on light availability and soil disturbance by management operations [79]. An admixture of spruce to beech stands presumably increased light availability as shown by Lücke and Schmidt [20] with a positive effect on gamma diversity compared to pure beech stands. However, mixtures have not reached the maximum diversity values of the hypothetical pure spruce landscapes. The resource availability in terms of light seems to be not sufficient in these mixtures. They rather represent intermediate conditions as described by Cavard et al. [25]. This is confirmed by the Ellenberg light indicator values of species associated with pure conifer (mean value 6.3), pure beech (4.2) or pure and mixed stands (5.4; see Table 4).
Besides a higher light availability in pure spruce stands, their maximum gamma diversity both on acidic and on calcareous soils shows that acidification (the pH was significantly lower under spruce compared to beech) has not led to biodiversity loss as stated by different authors [37,76]. While amelioration by liming on acidic soils may have counteracted negative acidification effects in the past [42], the high buffer capacity of calcareous soils has reduced the acidifying impact of spruce [80]. It rather seems that pure spruce stands can support wider acidity gradients compared to mixed stands. Species characteristic of spruce stands showed acidity indicator values ranging from very acidic to weakly basic sites (EIV R 2–7), whereas species also associated with mixed stands indicate moderate acidic to basic conditions (EIV R = 5–8). Thus, resource quantities in terms of light and resource heterogeneity in terms of soil conditions seem to be more effectively provided in pure spruce stands than in mixtures [41].
The tree layer structure of beech/Douglas fir mixtures resembles beech/pine mixtures with a two-layered closed canopy. The gamma diversity pattern, however, is similar to beech/spruce mixtures. In contrast to the spare crown of pine trees, Douglas fir trees may cast more shade on the slower growing beech leading to gaps in the beech cover [43]. This can have a positive effect on other (tree) species in the understory. In addition, Douglas fir has a less acidifying litter with lower C/N ratios compared to pine which can increase nutrient availability [21]. This higher heterogeneity in light and soil conditions may allow for a larger coexistence of plant species compared to beech/pine mixtures. Thus, mixtures of beech and Douglas fir seem to be able to support similar plant diversity than the pure conifer variant. This view is underlined by a number of species characteristic in pure Douglas fir and in mixed stands. In fact, the number of exclusive species did not significantly differ between pure Douglas fir and mixed stands. Concerning the establishment of the non-native Douglas fir, nature conservation calls for mixtures with beech instead of pure Douglas fir stands to counter potential negative effects on native flora and fauna [81]. Our results show that vascular plant diversity will not necessarily differ between pure and mixed stands of Douglas fir.

4.2. An Optimized Composition of Forest Stands for Bryophyte and Lichen Diversity

Bryophytes showed complementarity in species composition between pure conifer and pure beech stands at a hypothetical landscape level, whereas mixed stands were significantly less diverse. Lichens were promoted by a high share of pure beech stands.
Schorfheide-Chorin in eastern Germany is generally less diverse in bryophytes and lichens than the region Schwäbische Alb due to differences in elevation, precipitation (higher in Schwäbische Alb, see Table 1) and former air pollution with its acidic depositions (higher in Schorfheide-Chorin; [45,46]). Thus, in Schorfheide-Chorin we could only find non-significant tendencies indicating that bryophytes and lichens are not as sensitive as vascular plants to the composition of stand types in this region or have not been sufficiently covered by the available number of plots.
For bryophytes in Schwäbische Alb, we found a significant complementarity between pure beech and pure spruce stands. In particular, bryophytes growing on mineral soil and on deadwood can benefit from a coniferous canopy [46]. They are promoted by a thin leaf litter layer [82] and by the higher light availability linking ground dwelling bryophyte and vascular plant species diversity [46,83]. Bryophyte species significantly associated with conifer stands in the investigated regions are predominantly growing on soil (e.g., Pleurozium schreberi, Scleropodium purum, Rhytidiadelphus loreus) or are able to grow on needle litter (e.g., Orthodontium lineare, [84]). These species are often characterized by high abundances in coniferous forests [69] with important implications for carbon and nutrient cycling [85,86] and providing important resources for animals [87]. On the other hand, epiphytic bryophyte diversity was shown to be negatively affected by conifer stands due to lower forest continuity [88,89]. Stand age was generally lower in pure conifer stands compared to pure beech and mixed stands. In addition, management in conifer stands generally starts earlier compared to beech stands with conifer trees having shorter rotation periods [79]. Bryophyte species associated with beech stands were often found as epiphytes on beech presumably benefiting from the higher stand age but also from moist conditions in the lower stem region as a consequence of stem flow. Some characteristic species of beech stands were also associated with mixed stands. Thus, it seems that mixtures of spruce and beech can mainly promote species associated with beech due to the presence of the specific host tree species, while conifer specialists require a higher resource quantity either in substrate (=open soil or soil or deadwood not covered by leaf litter) or in light availability. In addition, similar to vascular plants, spruce stands of Schwäbische Alb seem to offer a higher heterogeneity in soil conditions promoting a co-existence of species preferring limestone (e.g., Eurhynchium angustirete, a typical species for spruce forests growing on soil over limestone) as well as acidophytic species (e.g., Dicranella heteromalla, Pleurozium schreberi) that are promoted by the acidifying needle litter. Mixed stands, on the other hand, were similar to beech with regard to their soil pH.
Epiphytic lichens constitute the main part of the lichen diversity in both study regions [45]. Their gamma diversity was negatively affected by pure conifer stands that were mainly younger than investigated beech stands or beech/conifer mixtures leading to lower habitat continuity compared to pure beech stands [88]. Differences between pure beech and mixed stands were, however, not significant, as some species within mixed stands are either able to colonize both broadleaved and coniferous trees (e.g., Arthonia spadicea, Phlyctis argena) or just require beech (or other broadleaved tree species) as a host tree within mixtures (e.g., Pertusaria leioplaca). Characteristic species within the investigated stand types generally cover large gradients in terms of light and moisture conditions. They are partly early colonizers of trees (e.g., Graphis scripta, Porina aenea) or can indicate disturbance or eutrophication (Scoliciosporum chlorococcum, Xanthoria polycarpa). Thus, they are rather generalists able to tolerate the heterogeneous habitat conditions created by forest management either in pure or mixed stands. It has also to be noted here that restricting cryptogam sampling to the lower stem region presumably has caused an underestimation of lichen alpha diversity both in beech and in conifer stands [47]. Assuming that beech and conifer crowns harbor different species assemblages due to differences in stand continuity but also in microclimate, detected gamma diversity patters for lichens might strongly change with a more complete sampling.

4.3. An Optimized Composition of Pure and Mixed Stands for Regional Diversity

Combining the three taxonomic groups studied here resulted in a general diversity pattern. It seems that combining pure beech and pure conifer stands at the landscape scale maximizes the regional diversity of vascular plants, bryophytes and lichens in contrast to tree species mixtures at the stand scale. The latter either were most species poor (beech/pine) or took an intermediate position. This shows that interactions among tree species at the stand scale can be too small to affect diversity positively or can even be negative when complementary tree species such as beech and pine are mixed. Results also show that the quantity of resources in terms of light or suitable substrate, particularly important for conifer specialists, is only adequately provided within pure conifer stands, while mixtures are often more similar to beech forests. This finding is in accordance with the area heterogeneity tradeoff, indicating that a decreasing quantity of resources may reduce the size of local populations and may increase the likelihood of local extinctions [90]. With regard to the ongoing fragmentation and loss of non-woodland habitats within intensively used landscapes, forests may represent important refuges also for species that are not solely associated with forests [91]. Our results show that pure beech stands, complemented by pure conifer stands can maintain these species better than stand scale tree species mixtures. In lowland landscapes with beech and pine, almost the complete biodiversity of vascular plants, bryophytes and lichens associated with these tree species can be supported by such a mosaic of different pure stands. In montane regions with higher diversity of epiphytic bryophytes and lichens, including many threatened and protected species, a regional diversity maximum of only ca. 93% was reached by combining the different pure stand types. Epiphytic species seem to benefit from a higher stand age that is provided by beech stands in contrast to conifer stands. This indicates, that the maintenance of large and old trees within managed (conifer) forest types [92] or a certain share of unmanaged beech forests [45,93] may be able to complement the existing managed forests in particular for epiphytic species as they allow for habitat continuity. Pure spruce stands will mainly promote vascular plants and soil-dwelling bryophytes. Both groups are important biomass components within forests and important resources for other trophic levels [86].

5. Conclusions

Our results show that assuming an increase in tree species diversity and, consequently, an increase of structural heterogeneity at the stand scale will, per se, result in an increased biodiversity appears to be too general. Actually, mixtures with beech can reduce biodiversity of vascular plants, bryophytes and lichens by up to 20%. Instead, our results suggest that higher tree species diversity matters at larger spatial scales when beech is involved.
The result that regional diversity benefits, if beech and conifers are available at the landscape scale is in line with recent findings that a single tree species or forest type cannot fulfill all forest functions in temperate managed forests of Europe [4]. For supporting the diversity of the studied taxonomic groups, tree species should be arranged in different pure stands combined at the landscape scale and not in stand scale mixtures that are often dominated by the highly competitive beech. Therefore, future research should focus more on the spatial configuration of different pure stands in order to support overall biodiversity. However, spatial configurations of pure stands may be associated with unintended effects on other ecosystem functions. Productivity and stability, for example, have been shown to be positively influenced by within stand tree species mixtures [7,32,94]. Thus, where pure stands are for example susceptible to extreme events [35,94], trade-offs between high landscape biodiversity and high productivity or stability may occur. Future studies may also explore which key structural attributes (including tree crowns as habitats for epiphytes) are related to biodiversity at different spatial scales and how dispersal abilities of certain species are influenced by different configurations [95]. This should also include the evaluation of the effect of maintaining old trees and unmanaged stands for epiphytic species, many of them being protected. In addition, the investigation of a broader portfolio of mixture types of conifers with broadleaved species other than European beech or of different conifers will give further insights on the effect of tree species diversity and tree species identity on associated biodiversity as well as on other important ecosystem functions, and it may provide alternative future management options within forest landscapes in the light of global change.

Author Contributions

Conceptualization, S.H., P.S., M.M., C.A.; Methodology, P.S. and S.H; Formal analysis, S.H. and P.S.; Data sampling and investigation, S.B. (Steffen Boch), J.M., S.B. (Sabine Budde), M.W., I.S., M.F., E.-D.S., W.S.; Writing—original draft preparation, S.H.; Writing—review and editing, P.S., C.A., M.M., W.S., E.-D.S., S.B (Steffen Boch), J.M., I.S., S.B. (Sabine Budde), M.W.; Project administration, C.A., P.S., M.F., W.S.; Funding acquisition, C.A., M.F., W.S.

Funding

The work has been partly funded by the German Science Foundation (DFG) Priority Program 1374 “Infrastructure-Biodiversity-Exploratories” (Fi-1246/6-1; Am 149/17-1; Am 149/16-2) and by other projects funded by the DFG (Schm-319/13) and the German Federal Ministry of Education and Research (BMBF; FKZ 0339474C/3). Fieldwork permits were issued by the responsible state environmental offices of Baden-Württemberg, Brandenburg and Lower Saxony. We also acknowledge the support by the Open Access Publication Funds of the Göttingen University.

Acknowledgments

We thank A. Bauer, L. Beenken, A. Hemp, A. Parth, U. Pommer, H. Rubbert, S. Socher and B. Witt for support during data collection in all regions; A. Hemp, K. Wells and S. Pfeiffer and their teams for maintaining the plot and project infrastructure during data sampling in Schorfheide-Chorin and Schwäbische Alb; J. Nieschulze, M. Owonibi and A. Ostrowski for managing the central database of the Biodiversity Exploratories (BE), and K.E. Linsenmair, D. Hessenmöller, D. Prati, F. Buscot, W.W. Weisser and the late E. Kalko for their role in setting up the BE project.

Conflicts of Interest

The authors declare no conflict of interest.

Appendix A

Table A1. Number of 400 m2 plots (n) for the analyses of vascular plants for the study regions and stand types. For mixed stands, also the plot distribution across dominance classes of beech or conifer dominance or an equal share of both species on accumulated tree layer cover is given. For the regions Schorfheide-Chorin and Schwäbische Alb bryophytes (Bry) and lichens (Li) were sampled in a smaller subset of vegetation survey plots. Also given is the share of plots younger or older than 90 years for Northwestern Germany and Solling [42,43] and the share of plots representing the immature (dbh > 15 ≤ 30 cm) and mature (dbh > 30 cm) developmental phase in Schorfheide-Chorin and Schwäbische Alb [50].
Northwestern GermanySchorfheide-ChorinSollingSchwäbische Alb
Stand Age [% Share] Developmental Phase [% Share] Stand Age [% Share] Developmental Phase [% Share]
n<90 yrs>90 yrsnImmatureMaturen<90 yrs>90 yrsnImmatureMature
Pure stand types
Beech2020.080.0141
Bry: 108
Li: 76
5.194.94337.262.895
Bry: 64
Li: 34
31.868.2
Pine20100.00.060
Bry: 39
Li: 25
50.050.0------
Spruce------4062.537.561
Bry: 40
Li: 20
31.668.4
Douglas fir20100.00.0---------
Mixed stand types
Beech/Pine2010.090.077
Bry: 48
Li: 34
2.697.4------
Beech dominance (>60% share)2010.090.061
Bry: 39
Li: 29
1.698.4------
Pine dominance(>60% share)---6
Bry: 5
Li: 3
16.783.3------
Equal share---10
Bry: 4
Li: 2
0.0100.0------
Beech/Douglas fir2020.080.0---------
Beech dominance (>60% share)1315.484.6---------
Douglas fir dominance (>60% share)0-----------
Equal share728.671.4---------
Beech/Spruce------8454.845.240
Bry: 29
Li: 12
33.366.7
Beech dominance (>60% share)------4652.247.817
Bry: 16
Li: 5
43.856.3
Spruce dominance (>60% share)------887.512.55
Bry: 4
Li: 3
2080
Equal share------3050.050.018
Bry: 9
Li: 4
26.773.3
Table A2. Number of occurrences of threatened and protected vascular plant species in the survey plots (n = total number of plots) of pure and mixed stands in the Schwäbische Alb (ALB), Schorfheide-Chorin (S-C), Solling (SO) and NW-Germany. Be = pure beech stands, Spr = pure spruce stands, Pi = pure pine stands, Be/Spr = beech/spruce mixture, Be/Pi = beech/pine mixture, Be/Dgl = beech/Douglas fir mixture. Species with single occurrences are listed at the end of the table. * marks species not listed in the red list of vascular plants of Germany but protected by law.
ALBS-CSONW-Germany
BeBe/SprSprBeBe/PiPiBeBe/SprSprBeBe/DglBe/PiDglPi
n95406114177604384402020202020
Abies alba 1 528
Carex canescens 188
Cephalanthera damasonium*436
Daphne mezereum*301110
Epipactis helleborine*2 3 1 1
Epipactis purpurata 2
Erica tetralix 2
Helleborus foetidus*1295
Ilex aquifolium* 26 41
Juniperus communis 1 8
Lilium martagon*3
Listera ovata*1 2
Neottia nidus-avis*211
Platanthera bifolia112
Primula elatior191112
Ulmus minor 2
Taxus baccata3 1
Asplenium scolopendrium* 1
Cephalanthera rubra 1
Corallorhiza trifida1
Hypericum montanum 1
Liparis loeselii 1
Lunaria rediviva 1
Luzula campestris 1
Lycopodium annotinum 1
Monotropa hypophegea1
Orthilia secunda 1
Platanthera chlorantha111
Total species number13111410213222122
Table A3. Number of occurrences of threatened and protected bryophyte species in the survey plots (n = total number of plots) of pure and mixed stands in Schwäbische Alb and Schorfheide-Chorin. Species with single occurrences are listed at the end of the table. All species are listed in the red list of bryophytes of Germany.
Schwäbische AlbSchorfheide-Chorin
BryophytesPure BeechMixedPure SprucePure BeechMixedPure Pine
n6429401084839
Amblystegium subtile202
Anomodon viticulosus2
Brachythecium oedipodium 533
Ctenidium molluscum212
Fissidens exilis2
Frullania dilatata2261 1
Homalia trichomanoides193
Hylocomium splendens310332 3
Isothecium alopecuroides55184
Leucobryum glaucum 271
Leucodon sciuroides5
Metzgeria furcata3192
Mnium marginatum4
Nowellia curvifolia 13
Orthotrichum affine38118143
Orthotrichum lyellii9
Orthotrichum pallens5
Orthotrichum patens21
Orthotrichum pumilum18333
Orthotrichum speciosum1331
Orthotrichum stramineum84 1
Orthotrichum striatum92
Plagiochila asplenioides4320
Plagiothecium undulatum 6 1
Platygyrium repens821134
Porella platyphylla4
Pseudoleskeella nervosa1321
Pterigynandrum filiforme289
Ptilium crista-castrensis 21
Pylaisia polyantha75
Radula complanata46214 1
Rhytidiadelphus loreus38201
Rhytidiadelphus triquetrus41024
Tortella tortuosa3
Ulota bruchii5724872
Ulota crispa7
Anomodon attenuatus1
Campylium calcareum 1
Dicranum flagellare 1
Homomallium incurvatum1 1
Marchantia polymorpha 1
Metzgeria temperata 1
Orthotrichum obtusifolium11
Pleuridium acuminatum 1
Pleuridium subulatum1
Polytrichum commune 1
Ptilidium ciliare 1
Rhodobryum roseum 1
Sanionia uncinata1 1
Total species number3625221097
Table A4. Number of occurrences of threatened and protected lichen species in the survey plots (n = total number of plots) of pure and mixed stands in the Schwäbische Alb and Schorfheide-Chorin. Species with single occurrences are listed at the end of the table. * marks species not listed in the red list of lichens of Germany but protected by law.
Schwäbische AlbSchorfheide-Chorin
LichensPure BeechMixedPure SprucePure BeechMixedPure Pine
n341220763425
Arthonia punctiformis2
Arthonia radiata305
Bacidina arnoldiana*1224152
Bacidina delicata*31
Chaenotheca trichialis 2
Graphis scripta288161
Lecania cyrtella*4 1
Lecanora intumescens91
Lecanora subcarpinea9
Lecanora subrugosa5
Mycobilimbia epixanthoides2
Opegrapha rufescens2
Parmelia saxatilis*2
Parmelia sulcata*2369
Peltigera praetextata4
Pertusaria leioplaca295
Pertusaria pertusa2
Physcia aipolia3
Pyrenula nitida72
Pyrrhospora quernea101
Ramalina farinacea*512
Strigula stigmatella2
Bacidia arceutina1
Bacidia rubella1
Bacidina chloroticula* 1
Calicium salicinum 1
Cetrelia olivetorum1
Chaenotheca chrysocephala 111
Chaenotheca stemonea 1
Chrysothrix candelaris1
Cladonia ramulosa 1
Cliostomum griffithii1
Fellhanera bouteillei 1
Lecanora albella1
Lecanora argentata11
Leptogium plicatile1
Melanelia exasperata11
Parmelia ernstiae*1
Pertusaria hymenea1
Placynthiella uliginosa 1
Sarea resinae 1
Usnea filipendula 11
Total species number32149731
Figure A1. Vascular plant species numbers per 400 m2 plots in relation to the percentage share of beech on tree layer cover within mixtures (a) of beech and pine in Schorfheide-Chorin and (b) NW-Germany, (c) of beech and Douglas fir in NW-Germany, (d) beech and spruce in Solling and (e) Schwäbische Alb. Plots were characterized as mixtures when both target species (beech and conifer) had a minimum of 10% or maximum of 90% share on accumulated tree layer cover. Regression lines and results are printed when relationships were significant. Note that the scale of the y-axis differs for Beech/Pine and Beech/Spruce(Douglas fir) combinations.
Forests 10 00073 g0a1
Figure A2. Number of exclusive vascular plant species in relation to the number of resampled plots in pure beech and conifer stands and respective mixtures in (a) Schorfheide-Chorin (S-C) and (b,c) northwestern Germany (NW), (d) Solling (SO) and (e) Schwäbische Alb (ALB). Note that y-axis of ALB is double the size of the other regions.
Forests 10 00073 g0a2
Figure A3. Gamma diversity (species richness) of vascular plants along compositional gradients of pure beech (Be), pure conifer (Pi = Pine, Spr = Spruce) and mixed stands (Mix) in (a) Schwäbische Alb (ALB), (b) Solling (SO) and (c) Schorfheide-Chorin (S-C). Stand type composition varied in steps of 10% using 1000 resamplings of 37 (ALB, SO) and 58 plots (S-C) per step (66 unique compositions), the maximum number of plots allowing for more than 1000 resamplings at each corner of the triangle. The diversity response to composition is characterized by R2 and estimated degrees of freedom (edf). Labelled dots mark the maximum (orange) and minimum (light blue). Numbers below the triangles show gamma diversity values for 100% beech stands, 100% conifer stands (either spruce (Spr) or pine (Pi)), 100% mixed stands and the composition of stand types supporting maximum gamma diversity (Max). * mark significant differences to the maximum gamma diversity.
Forests 10 00073 g0a3
Figure A4. Gamma diversity (ac: species richness; df: Shannon diversity) for threatened and protected (a,d) vascular plant species, (b,e) bryophyte species and (c,f) lichen species in Schwäbische Alb along compositional gradients of pure beech (Be), pure spruce (Spr) and mixed stands (Mix). The composition of stand types was varied in steps of 10% using 1000 resamplings of 17 (vascular plants) and 26 (bryophytes) plots per step or 66 resamplings of 10 plots per step (lichens). Labelled dots mark the maximum (orange) and minimum (light blue) gamma diversity.
Forests 10 00073 g0a4
Figure A5. Bryophyte and lichen species numbers per 400 m2 plots in relation to the percentage share of beech on tree layer cover within mixtures of (a,b) beech and pine in Schorfheide-Chorin and (c,d) beech and spruce in Schwäbische Alb. Plots were characterized as mixtures when both target species (beech and conifer) had a minimum of 10% or maximum of 90% share on accumulated tree layer cover. Note that the scale of the y-axis differs for Beech/Pine in Schorfheide-Chorin and the Beech/Spruce combination in Schwäbische Alb.
Forests 10 00073 g0a5
Figure A6. Number of exclusive bryophyte (a,b) and lichen (c) species in relation to the number of resampled plots in pure beech and conifer stands and respective mixtures in (a,c) Schorfheide-Chorin (S-C) and (b) Schwäbische Alb (ALB).
Forests 10 00073 g0a6
Figure A7. Regional diversity (Shannon diversity) in % for (a) Schorfheide-Chorin and (b) Schwäbische Alb combining vascular plants, bryophytes and lichens along compositional gradients of pure beech (Be), pure conifer (Pi = Pine, Spr = Spruce) and mixed stands (Mix). The composition of stand types was varied in steps of 10% using 1000 resamplings of 22 plots per step for Schorfheide-Chorin and using 66 resamplings of 10 plots per step for Schwäbische Alb. The regional diversity quantifies the mean relative gamma diversity of taxonomic groups accounting for the absolute diversity within groups (log weighting of diversity). Labelled dots mark the maximum (orange) and minimum (light blue) regional diversity.
Forests 10 00073 g0a7

References

  1. Gamfeldt, L.; Snall, T.; Bagchi, R.; Jonsso, M.; Gustafsson, L.; Kjellander, P.; Ruiz-Jaen, M.C.; Froberg, M.; Stendahl, J.; Philipson, C.D.; et al. Higher levels of multiple ecosystem services are found in forests with more tree species. Nat. Commun. 2013, 4, 1340. [Google Scholar] [CrossRef] [PubMed] [Green Version]
  2. Schuler, L.J.; Bugmann, H.; Snell, R.S. From monocultures to mixed-species forests: Is tree diversity key for providing ecosystem services at the landscape scale? Landsc. Ecol. 2017, 32, 1499–1516. [Google Scholar] [CrossRef]
  3. Ratcliffe, S.; Wirth, C.; Jucker, T.; van der Plas, F.; Scherer-Lorenzen, M.; Verheyen, K.; Allan, E.; Benavides, R.; Bruelheide, H.; Ohse, B.; et al. Biodiversity and ecosystem functioning relations in European forests depend on environmental context. Ecol. Lett. 2017, 20, 1414–1426. [Google Scholar] [CrossRef]
  4. Felipe-Lucia, M.R.; Soliveres, S.; Penone, C.; Manning, P.; van der Plas, F.; Boch, S.; Prati, D.; Ammer, C.; Schall, P.; Gossner, M.M.; et al. Multiple forest attributes underpin the provision of multiple ecosystem services. Nat. Commun. 2018, 9, 4839. [Google Scholar] [CrossRef] [PubMed]
  5. Chamagne, J.; Tanadini, M.; Frank, D.; Matula, R.; Paine, C.E.T.; Philipson, C.D.; Svátek, M.; Turnbull, L.A.; Volařík, D.; Hector, A. Forest diversity promotes individual tree growth in central European forest stands. J. Appl. Ecol. 2017, 54, 71–79. [Google Scholar] [CrossRef]
  6. Jucker, T.; Bouriaud, O.; Avacaritei, D.; Coomes, D.A. Stabilizing effects of diversity on aboveground wood production in forest ecosystems. Linking patterns and processes. Ecol. Lett. 2014, 17, 1560–1569. [Google Scholar] [CrossRef] [PubMed]
  7. Ammer, C. Diversity and forest productivity in a changing climate. New Phytol. 2019, 221, 50–66. [Google Scholar] [CrossRef] [PubMed]
  8. Mina, M.; Huber, M.O.; Forrester, D.I.; Thürig, E.; Rohner, B. Multiple factors modulate tree growth complementarity in central European mixed forests. J. Ecol. 2018, 106, 1106–1119. [Google Scholar] [CrossRef]
  9. Pretzsch, H.; Dieler, J.; Seifert, T.; Rötzer, T. Climate effects on productivity and resource-use efficiency of Norway spruce (Picea abies [L.] Karst.) and European beech (Fagus sylvatica [L.]) in stands with different spatial mixing patterns. Trees 2012, 26, 1343–1360. [Google Scholar] [CrossRef]
  10. Fichtner, A.; Härdtle, W.; Bruelheide, H.; Kunz, M.; Li, Y.; von Oheimb, G. Neighbourhood interactions drive overyielding in mixed-species tree communities. Nat. Commun. 2018, 9, 1144. [Google Scholar] [CrossRef]
  11. Pretzsch, H.; Schütze, G.; Uhl, E. Resistance of European tree species to drought stress in mixed versus pure forests. Evidence of stress release by inter-specific facilitation. Plant Biol. 2013, 15, 483–495. [Google Scholar] [CrossRef]
  12. Metz, J.; Annighöfer, P.; Schall, P.; Zimmermann, J.; Kahl, T.; Schulze, E.-D.; Ammer, C. Site-adapted admixed tree species reduce drought susceptibility of mature European beech. Glob. Chang. Biol. 2016, 22, 903–920. [Google Scholar] [CrossRef]
  13. Simmons, E.A.; Buckley, G.P. Ground vegetation under planted mixtures of trees. In The Ecology of Mixed-Species Stands of Trees; Cannell, M.G.R., Malcolm, D.C., Robertson, P.A., Eds.; Blackwell Scientific Publications: Oxford, UK, 1992; pp. 211–231. [Google Scholar]
  14. Felton, A.; Lindbladh, M.; Brunet, J.; Fritz, Ö. Replacing coniferous monocultures with mixed-species production stands: An assessment of the potential benefits for forest biodiversity in northern Europe. For. Ecol. Manag. 2010, 260, 939–947. [Google Scholar] [CrossRef]
  15. Scherer-Lorenzen, M. The functional role of biodiversity in forests. In Integrative Approaches as an Opportunity for the Conservation of Forest Biodiversity; Kraus, D., Krumm, F., Eds.; European Forest Institute: Freiburg, Germany, 2013; pp. 216–223. [Google Scholar]
  16. Gilliam, F.S. The ecological significance of the herbaceous layer in temperate forest ecosystems. BioScience 2007, 57, 845–858. [Google Scholar] [CrossRef]
  17. Scherber, C.; Eisenhauer, N.; Weisser, W.W.; Schmid, B.; Voigt, W.; Fischer, M.; Schulze, E.-D.; Roscher, C.; Weigelt, A.; Allan, E.; et al. Bottom-up effects of plant diversity on multitrophic interactions in a biodiversity experiment. Nature 2010, 468, 553–556. [Google Scholar] [CrossRef] [PubMed] [Green Version]
  18. Handa, I.T.; Aerts, R.; Berendse, F.; Berg, M.P.; Bruder, A.; Butenschoen, O.; Chauvet, E.; Gessner, M.O.; Jabiol, J.; Makkonen, M.; et al. Consequences of biodiversity loss for litter decomposition across biomes. Nature 2014, 509, 218–221. [Google Scholar] [CrossRef] [Green Version]
  19. Ódor, P.; Király, I.; Tinya, F.; Bortignon, F.; Nascimbene, J. Patterns and drivers of species composition of epiphytic bryophytes and lichens in managed temperate forests. For. Ecol. Manag. 2013, 306, 256–265. [Google Scholar] [CrossRef] [Green Version]
  20. Lücke, K.; Schmidt, W. Vegetation und Standortsverhältnisse in Buchen-Fichten Mischbeständen des Sollings. Forstarchiv 1997, 68, 135–143. [Google Scholar]
  21. Augusto, L.; Dupouey, J.; Ranger, J. Effects of tree species on understory vegetation and environmental conditions in temperate forests. Ann. For. Sci. 2003, 60, 823–831. [Google Scholar] [CrossRef] [Green Version]
  22. Sydes, C.; Grime, J.P. Effects of tree leaf litter on herbaceous vegetation in deciduous woodland. I. Field investigations. J. Ecol. 1981, 69, 237–248. [Google Scholar] [CrossRef]
  23. Wilson, S.D. Heterogeneity, diversity and scale in plant communities. In The Ecological Consequences of Environmental Heterogeneity; Hutchings, M.J., John, E.A., Stewart, A.J.A., Eds.; Blackwell Science: Oxford, UK, 2000; pp. 53–69. [Google Scholar]
  24. Stein, A.; Gerstner, K.; Kreft, H. Environmental heterogeneity as a universal driver of species richness across taxa, biomes and spatial scales. Ecol. Lett. 2014, 17, 866–880. [Google Scholar] [CrossRef] [Green Version]
  25. Cavard, X.; Macdonald, S.E.; Bergeron, Y.; Chen, H.Y.H. Importance of mixedwoods for biodiversity conservation: Evidence for understory plants, songbirds, soil fauna, and ectomycorrhizae in northern forests. Environ. Rev. 2011, 19, 142–161. [Google Scholar] [CrossRef]
  26. Gosselin, M.; Fourcin, D.; Dumas, Y.; Gosselin, F.; Korboulewsky, N.; Toïgo, M.; Vallet, P. Influence of forest tree species composition on bryophytic diversity in mixed and pure pine (Pinus sylvestris L.) and oak (Quercus petraea (Matt.) Liebl.) stands. For. Ecol. Manag. 2017, 406, 318–329. [Google Scholar] [CrossRef]
  27. Brassard, B.W.; Chen, H.Y.H.; Cavard, X.; Langanière, J.; Reich, P.B.; Bergeron, Y.; Paré, D.; Yuan, Z. Tree species diversity increases fine root productivity through increased soil volume filling. J. Ecol. 2013, 101, 210–219. [Google Scholar] [CrossRef]
  28. Barbier, S.; Gosselin, F.; Balandier, P. Influence of tree species on understory vegetation diversity and mechanisms involved—A critical review for temperate and boreal forests. For. Ecol. Manag. 2008, 254, 1–15. [Google Scholar] [CrossRef]
  29. MacDonald, S.E.; Fenniak, T.E. Understory plant communities of boreal mixedwood forests in western Canada: Natural patterns and response to variable-retention harvesting. For. Ecol. Manag. 2007, 242, 34–48. [Google Scholar] [CrossRef]
  30. Spiecker, H. Silvicultural management in maintaining biodiversity and resistance of forests in Europe—temperate zone. J. Environ. Manag. 2003, 67, 55–65. [Google Scholar] [CrossRef]
  31. Spathelf, P.; Ammer, C. Forest management of Scots pine (Pinus sylvestris L.) in northern Germany—A brief review of the history and current trends. Forstarchiv 2015, 86, 59–66. [Google Scholar]
  32. Knoke, T.; Ammer, C.; Stimm, B.; Mosandl, R. Admixing broadleaved to coniferous tree species: A review on yield, ecological stability and economics. Eur. J. For. Res. 2008, 127, 89–101. [Google Scholar] [CrossRef]
  33. Brang, P.; Spathelf, P.; Larsen, J.B.; Bauhus, J.; Boncčìna, A.; Chauvin, C.; Drössler, L.; García-Güemes, C.; Heiri, C.; Kerr, G.; et al. Suitability of close-to-nature silviculture for adapting temperate European forests to climate change. Forestry 2014, 87, 492–503. [Google Scholar] [CrossRef] [Green Version]
  34. Von Lüpke, B.; Ammer, C.; Braciamacchie, M.; Brunner, A.; Ceitel, J.; Collet, C.; Deuleuze, C.; Di Placido, J.; Huss, J.; Jankovic, J.; et al. Silvicultural strategies for conversion. In Norway Spruce Conversion—Options and Consequences; European Forest Institute Research Report 18; Spiecker, H., Hansen, J., Klimo, E., Skovsgaard, J.P., Sterba, H., von Teuffel, K., Eds.; Brill: Leiden, The Netherlands, 2004; pp. 121–164. [Google Scholar]
  35. Ammer, C.; Bickel, E.; Kölling, C. Converting Norway spruce stands with beech—A review on arguments and techniques. Austrian J. For. Sci. 2008, 125, 3–26. [Google Scholar]
  36. Leuschner, C.; Ellenberg, H. Ecology of Central European Forests; Springer International Publishing: Cham, Switzerland, 2017; ISBN 978-3-319-43040-9. [Google Scholar]
  37. Emmer, I.M.; Fanta, J.; Kobus, A.T.; Kooijman, A.; Sevink, J. Reversing borealization as a means to restore biodiversity in Central-European mountain forests—An example from the Krkonoše Mountains, Czech Republic. Biodivers. Conserv. 1998, 7, 229–247. [Google Scholar] [CrossRef]
  38. MLUR-Ministerium für Landwirtschaft, Umweltschutz und Raumordnung des Landes Brandenburg. Waldbaurichtlinie 2004—“Grüner Ordner“ der Landesforstverwaltung Brandenburg; Ministerium für Landwirtschaft, Umweltschutz und Raumordnung: Berlin, Germany, 2004; Available online: http://forst.brandenburg.de/media_fast/4055/wbr2004.pdf (accessed on 18. January 2019).
  39. Borrass, L.; Kleinschmit, D.; Winkel, G. The “German model” of integrative multifunctional forest management—Analysing the emergence and political evolution of a forest management concept. For. Policy Econ. 2017, 77, 16–23. [Google Scholar] [CrossRef]
  40. Vitali, V.; Büntgen, U.; Bauhus, J. Silver fir and Douglas fir are more tolerant to extreme droughts than Norway spruce in south-western Germany. Glob. Chang. Biol. 2017, 23, 5108–5119. [Google Scholar] [CrossRef] [PubMed]
  41. Bartels, S.F.; Chen, H.Y.H. Is understory plant species diversity driven by resource quantity or resource heterogeneity? Ecology 2010, 91, 1931–1938. [Google Scholar] [CrossRef] [PubMed]
  42. Weckesser, M. Die Bodenvegetation von Buchen-Fichten-Mischbeständen im Solling—Struktur, Diversität und Stoffhaushalt; Cuvillier-Verlag: Göttingen, Germany, 2003; ISBN 3898737373. [Google Scholar]
  43. Budde, S. Auswirkungen des Douglasienanbaus auf die Bodenvegetation im Nordwestdeutschen Tiefland; Cuvillier-Verlag: Göttingen, Germany, 2006; ISBN 978-3-86727-079-3. [Google Scholar]
  44. Boch, S.; Prati, D.; Müller, J.; Socher, S.; Baumbach, H.; Buscot, F.; Gockel, S.; Hemp, A.; Hessenmöller, D.; Kalko, E.K.V.; et al. High plant species richness indicates management-related disturbances rather than the conservation status of forests. Basic Appl. Ecol. 2013, 14, 496–505. [Google Scholar] [CrossRef]
  45. Boch, S.; Prati, D.; Hessenmöller, D.; Schulze, E.-D.; Fischer, M. Richness of lichen species, especially of threatened ones, is promoted by management methods furthering stand continuity. PLoS ONE 2013, 8, e55461. [Google Scholar] [CrossRef] [PubMed]
  46. Müller, J.; Boch, S.; Prati, D.; Socher, S.A.; Pommer, U.; Hessenmöllder, D.; Schall, P.; Schulze, E.-D.; Fischer, M. Effects of forest management on bryophyte species richness in Central European forests. For. Ecol. Manag. 2019, 432, 850–859. [Google Scholar] [CrossRef]
  47. Boch, S.; Müller, J.; Prati, D.; Blaser, S.; Fischer, M. Up in the tree—The over-looked richness of bryophytes and lichens in tree crowns. PLoS ONE 2013, 8, e84913. [Google Scholar] [CrossRef]
  48. Kiebacher, T.; Keller, C.; Scheidegger, C.; Bergamini, A. Hidden crown jewels: The role of tree crowns for bryophyte and lichen species richness in sycamore maple wooded pastures. Biodivers. Conserv. 2016, 25, 1605–1624. [Google Scholar] [CrossRef]
  49. Gauer, J.; Aldinger, E. Waldökologische Naturräume Deutschlands—Forstliche Wuchsgebiete und Wuchsbezirke. Mitt. Ver. Forstl. Standortskde. Forstpflanzenz. 2005, 43, 1–324. [Google Scholar]
  50. Hessenmöller, D.; Nieschulze, J.; von Lüpke, N.; Schulze, E.-D. Identification of forest management types from ground-based and remotely sensed variables and the effects of forest management on forest structure and composition. Forstarchiv 2011, 82, 171–183. [Google Scholar]
  51. Schall, P.; Schulze, E.-D.; Fischer, M.; Ayasse, M.; Ammer, C. Relations between forest management, stand structure and productivity across different types of Central European forests. Basic Appl. Ecol. 2018, 32, 39–52. [Google Scholar] [CrossRef]
  52. Ganz, M. Entwicklung von Baumartenzusammensetzung und Struktur der Wälder vom Schwarzwald bis auf die Schwäbische Alb—mit besonderer Berücksichtigung der Buche. Dissertation Thesis, University of Freiburg, Freiburg im Breisgau, Germany, 2004. Available online: https://freidok.uni-freiburg.de/data/1616 (accessed on 18. January 2019).
  53. R Core Team. R: A Language and Environment for Statistical Computing; R Foundation for Statistical Computing: Vienna, Austria, 2018; Available online: https://www.R-project.org/ (accessed on 18. January 2019).
  54. Wisskirchen, R.; Haeupler, H. Standardliste der Farn-und Blütenpflanzen Deutschlands; Ulmer: Stuttgart, Germany, 1998; ISBN 978-3800133604. [Google Scholar]
  55. Koperski, M.; Sauer, M.; Braun, W.; Gradstein, S.R. Referenzliste der Moose Deutschlands; Bundesamt für Naturschutz: Bonn, Germany, 2000; ISBN 3-7843-3504-7. [Google Scholar]
  56. Wirth, V. Flechtenflora, 2nd ed.; Ulmer: Stuttgart, Germany, 1995; ISBN 3-82521062-6. [Google Scholar]
  57. Crowley, P.H. Resampling methods for computation-intensive data analysis in ecology and evolution. Annu. Rev. Ecol. Syst. 1992, 23, 405–447. [Google Scholar] [CrossRef]
  58. Chao, A.; Gotelli, N.J.; Hsieh, T.C.; Sander, E.L.; Ma, K.H.; Colwell, R.K.; Ellison, A.M. Rarefaction and extrapolation with Hill numbers: A framework for sampling and estimation in species diversity studies. Ecol. Monogr. 2014, 84, 45–67. [Google Scholar] [CrossRef]
  59. Wood, S.N. Fast stable restricted maximum likelihood and marginal likelihood estimation of semiparametric generalized linear models. J. R. Stat. Soc. B 2011, 73, 3–36. [Google Scholar] [CrossRef]
  60. Hamilton, N. Ggtern: An Extension to ’ggplot2’, for the Creation of Ternary Diagrams. R package version 2.2.1. 2017. Available online: https://CRAN.R-project.org/package=ggtern (accessed on 18. January 2019).
  61. Dufrêne, M.; Legendre, P. Species assemblages and indicator species: The need for a flexible asymetrical approach. Ecol. Monogr. 1997, 67, 345–366. [Google Scholar]
  62. Ellenberg, H.; Weber, H.E.; Düll, R.; Wirth, V.; Werner, W. Zeigerwerte von Pflanzen in Mitteleuropa. Scr. Geobot. 2001, 18, 1–262. [Google Scholar]
  63. Schmidt, M.; Kriebitzsch, W.-U.; Ewald, J. Waldartenlisten der Farn-und Blütenpflanzen, Moose und Flechten Deutschlands; Bundesamt für Naturschutz: Bonn, Germany, 2011; ISBN 978-3-89624-034-7. [Google Scholar]
  64. Allan, E.; Bossdorf, O.; Dormann, C.F.; Prati, D.; Gossner, M.M.; Tscharntke, T.; Blüthgen, N.; Bellach, M.; Birkhofer, K.; Boch, S.; et al. Interannual variation in land-use intensity enhances grassland multidiversity. Proc. Natl. Acad. Sci. USA 2014, 111, 308–313. [Google Scholar] [CrossRef]
  65. Colwell, R.K.; Coddington, J.A. Estimating terrestrial biodiversity through extrapolation. Philos. Trans. R. Soc. B 1994, 345, 101–118. [Google Scholar] [Green Version]
  66. Landolt, E.; Bäumler, B.; Erhardt, A.; Hegg, O.; Klötzli, F.; Lämmler, W.; Nobis, M.; Rudmann-Maurer, K.; Schweingruber, F.H.; Theurillat, J.-P.; et al. Flora Indicative—Ecological Indicator values and Biological Attributes of the Flora of Switzerland and the Alps; Haupt Verlag: Bern, Switzerland, 2010; ISBN 978-3-258-07461-0. [Google Scholar]
  67. Schmidt, M.; Mölder, A.; Schönfelder, E.; Engel, F.; Schmiedel, I.; Culmsee, H. Determining ancient woodland indicator plants for practical use: A new approach developed in northwest Germany. For. Ecol. Manag. 2014, 330, 228–239. [Google Scholar] [CrossRef]
  68. Hofmann, G.; Pommer, U. Potentielle Natürliche Vegetation von Brandenburg und Berlin; Eberswalder Forstliche Schriftenreihe 24: Berlin, Germany, 2005; ISBN 3-933352-62-2. [Google Scholar]
  69. Budde, S.; Schmidt, W.; Weckesser, M. Impact of the admixture of European beech (Fagus sylvatica L.) on plant species diversity and naturalness of conifer stands in Lower Saxony. Wald. Landsch. Nat. 2011, 11, 49–61. [Google Scholar]
  70. Metz, J.; Seidel, D.; Schall, P.; Scheffer, D.; Schulze, E.-D.; Ammer, C. Crown modeling by terrestrial laser scanning as an approach to assess the effect of aboveground intra- and interspecific competition on tree growth. For. Ecol. Manag. 2013, 310, 275–288. [Google Scholar] [CrossRef]
  71. Pretzsch, H.; del Río, M.; Schütze, G.; Ammer, C.; Annighöfer, P.; Avdagic, A.; Barbeito, I.; Bielak, K.; Brazaitis, G.; Coll, L.; et al. Mixing of Scots pine (Pinus sylvestris L.) and European beech (Fagus sylvatica L.) enhances structural heterogeneity, and the effect increases with humidity. For. Ecol. Manag. 2016, 373, 149–166. [Google Scholar] [CrossRef]
  72. Forrester, D.; Ammer, C.; Annighöfer, P.; Barbeito, I.; Bielak, K.; Bravo-Oviedo, A.; Coll, L.; del Río, M.; Drössler, L.; Heym, M.; et al. Effects of crown architecture and stand structure on light absorption in mixed and monospecific Fagus sylvatica and Pinus sylvestris forests along a productivity and climate gradient through Europe. J. Ecol. 2018, 106, 746–760. [Google Scholar] [CrossRef]
  73. Jucker, T.; Bouriaud, O.; Coomes, D.A. Crown plasticity enables trees to optimize canopy packing in mixed-species forests. Funct. Ecol. 2015, 29, 1078–1086. [Google Scholar] [CrossRef] [Green Version]
  74. Bolte, A.; Villanueva, I. Interspecific competition impacts on the morphology and distribution of fine roots in European beech (Fagus sylvatica L.) and Norway Spruce (Picea abies (L.) Karst. Eur. J. For. Res. 2006, 125, 15–26. [Google Scholar] [CrossRef]
  75. Ma, Z.; Chen, H.Y.H. Effects of species diversity on fine root productivity increase with stand development and associated mechanisms in a boreal forest. J. Ecol. 2017, 105, 237–245. [Google Scholar] [CrossRef]
  76. Máliš, F.; Ujházy, K.; Vodálová, A.; Barka, I.; Čaboun, V.; Sitková, Z. The impact of Norway spruce planting on herb vegetation in the mountain beech forests on two bedrock types. Eur. J. For. Res. 2012, 131, 1551–1569. [Google Scholar] [CrossRef]
  77. Mölder, A.; Bernhardt-Römermann, M.; Schmidt, W. Herb-layer diversity in deciduous forests: Raised by tree richness or beaten by beech? For. Ecol. Manag. 2008, 256, 272–281. [Google Scholar] [CrossRef]
  78. Schmid, I.; Leuschner, C. Warum fehlt den Gipsbuchenwäldern des Kyffhäusers (Thüringen) eine Krautschicht? Forstwiss. Centralbl. 1998, 117, 277–288. [Google Scholar] [CrossRef]
  79. Röhrig, E.; Bartsch, N.; von Lüpke, B. Waldbau auf Ökologischer Grundlage; Ulmer: Stuttgart, Germany, 2006; ISBN 3825283100. [Google Scholar]
  80. Ulrich, B. Stabilität von Waldökosystemen unter dem Einfluss des Sauren Regens. Allg. Forstz. 1983, 26/27, 670–677. [Google Scholar]
  81. Höltermann, A.; Klingenstein, F.; Ssymank, A. Naturschutzfachliche Bewertung der Douglasie aus Sicht des Bundesamtes für Naturschutz (BfN). LWF Wissen 2008, 59, 74–81. [Google Scholar]
  82. Márialigeti, S.; Németh, B.; Tinya, F.; Ódor, P. The effects of stand structure on ground-floor bryophyte assemblages in temperate mixed forests. Biodivers. Conserv. 2009, 18, 2223–2241. [Google Scholar] [CrossRef]
  83. Tinya, F.; Márialigeti, S.; Király, I.; Németh, B.; Ódor, P. The effect of light conditions on herbs, bryophytes and seedlings of temperate mixed forests in Örség, Western Hungary. Plant Ecol. 2009, 204, 69–81. [Google Scholar] [CrossRef]
  84. Nebel, M.; Philippi, G. Die Moose Baden-Württembergs, Band 2; Verlag Eugen Ulmer: Stuttgart, Germany, 2001; ISBN 3800135302. [Google Scholar]
  85. Turetsky, M.R. The role of bryophytes in carbon and nitrogen cycling. Bryologist 2003, 106, 395–409. [Google Scholar] [CrossRef]
  86. Woziwoda, B.; Parzych, A.; Kopeć, D. Species diversity, biomass accumulation and carbon sequestration in the understorey of post-agricultural Scots pine forests. Silva Fenn. 2014, 48, 1119. [Google Scholar] [CrossRef]
  87. Boch, S.; Berlinger, M.; Fischer, M.; Knop, E.; Nentwig, W.; Türke, M.; Prati, D. Fern and bryophyte endozoochory by slugs. Oecologia 2013, 172, 817–822. [Google Scholar] [CrossRef] [PubMed]
  88. Fritz, Ö.; Gustafsson, L.; Larsson, K. Does forest continuity matter in conservation?—A study of epiphytic lichens and bryophytes in beech forests of southern Sweden. Biol. Conserv. 2008, 141, 655–668. [Google Scholar] [CrossRef]
  89. Brunialti, G.; Frati, L.; Aleffi, M.; Marignani, M.; Rosati, L.; Burrascano, S.; Ravera, S. Lichens and bryophytes as indicators of old-growth features in Mediterranean forests. Plant Biosyst. 2010, 144, 221–233. [Google Scholar] [CrossRef]
  90. Allouche, O.; Kalyuzhny, M.; Moreno-Rueda, G.; Pizarro, M.; Kadmon, R. Area–heterogeneity tradeoff and the diversity of ecological communities. Prod. Natl. Acad. Sci. USA 2012, 109, 17495–17500. [Google Scholar] [CrossRef] [PubMed]
  91. Kriebitzsch, W.-U.; Bültmann, H.; von Oheimb, G.; Schmidt, M.; Thiel, H.; Ewald, J. Forest-specific diversity of vascular plants, bryophytes, and lichens. In Integrative Approaches as an Opportunity for the Conservation of Forest Biodiversity; Kraus, D., Krumm, F., Eds.; European Forest Institute: Freiburg, Germany, 2013; pp. 158–169. [Google Scholar]
  92. Hofmeister, J.; Hošek, J.; Malíček, J.; Palice, Z.; Syrovátková, L.; Steinová, J.; Černajová, I. Large beech (Fagus sylvatica) trees as ‘lifeboats’ for lichen diversity in central European forests. Biodivers. Conserv. 2016, 25, 1073–1090. [Google Scholar] [CrossRef]
  93. Schall, P.; Gossner, M.M.; Heinrichs, S.; Fischer, M.; Boch, S.; Prati, D.; Jung, K.; Baumgartner, V.; Blaser, S.; Böhm, S.; et al. The impact of even-aged and uneven-aged forest management on regional biodiversity of multiple taxa in European beech forests. J. Appl. Ecol. 2018, 55, 267–278. [Google Scholar] [CrossRef]
  94. Neuner, S.; Albrecht, A.; Cullmann, D.; Engels, F.; Griess, V.C.; Hahn, W.A.; Hanewinkel, M.; Härtl, F.; Kölling, C.; Staupendahl, K.; Knoke, T. Survival of Norway spruce remains higher in mixed stands under a dryer and warmer climate. Glob. Chang. Biol. 2015, 21, 935–946. [Google Scholar] [CrossRef] [PubMed]
  95. Ammer, C.; Fichtner, A.; Fischer, A.; Gossner, M.M.; Meyer, P.; Seidl, R.; Thomas, F.M.; Annighöfer, P.; Kreyling, J.; Ohse, B.; Berger, U.; et al. Key ecological research questions for Central European forests. Basic Appl. Ecol. 2018, 32, 3–25. [Google Scholar] [CrossRef]
Figure 1. Stand type compositions (66 points) representing all combinations of pure beech, pure conifer and mixed stands in steps of 10% and arranged within a schematic triangle. The corners represent hypothetical forest landscapes of 100% pure beech, pure conifer and mixed stands, respectively (cyan points). Towards the center of the triangle, the three stand types are mixed with the center point (orange point) representing a composition with 40% mixed, 30% pure beech and 30% pure conifer stands.
Forests 10 00073 g001
Figure 2. (a) Tree layer cover and (b) soil pH for pure and mixed stands sampled in four regions across Germany. Diagrams are arranged according to the considered tree species combination. Tree layer cover is based on the number of vegetation survey plots listed in Table A1. Soil pH is based on the following sample sizes: S-C: beech n = 139, pine n = 60, mix n = 76; NW (both combinations): n = 10 per forest type; SO: beech n = 23, spruce n = 24, mix n = 47; ALB: beech n = 87, spruce n = 53; mix n = 32. Different lowercase letters mark significant differences between stand types within regions (S-C: Schorfheide-Chorin, NW: Northwestern Germany, SO: Solling, ALB: Schwäbische Alb).
Forests 10 00073 g002
Figure 3. Gamma diversity (species richness) of vascular plants along compositional gradients of pure beech (Be), pure conifer (Pi = Pine, Dgl = Douglas fir, Spr = Spruce) and mixed stands (Mix) for (a) Schorfheide-Chorin (S-C), (b,c) Northwestern Germany (NW), (d) Solling (SO), (e) Schwäbische Alb (ALB). The stand type composition was varied in steps of 10% using 1000 resamplings of 17 plots per step (66 unique stand type compositions). The diversity response to stand type composition is characterized by R2 and estimated degrees of freedom (edf). Labelled dots mark the maximum (orange) and minimum (light blue) gamma diversity.
Forests 10 00073 g003
Figure 4. Mean number of exclusive species in pure beech, pure conifer and mixed stands of the four study regions based on pairwise comparisons of 1000 resamplings of 17 plots per stand type and region. Error bars indicate the 95% quantile of resamplings. Diagrams are arranged according to the considered tree species combination. Different lowercase letters indicate significant differences among stand types within regions (i.e., at least 975 of 1000 pairwise comparisons showed higher number of exclusive species of one stand type compared to the others), S-C: Schorfheide-Chorin, NW: Northwestern Germany, SO: Solling, ALB: Schwäbische Alb.
Forests 10 00073 g004
Figure 5. Gamma diversity (species richness) of bryophytes (a,b) and lichens (c,d) along compositional gradients of pure beech (Be), pure conifer (Pi = Pine, Spr = Spruce) and mixed stands (Mix) in Schorfheide-Chorin (S-C; (a,c)) and Schwäbische Alb (ALB; (b,d)). The stand type composition was varied in steps of 10% using 1000 resamplings of 36 (bryophytes S-C), 26 (bryophytes ALB), 22 (lichens S-C) plots per step (66 unique stand type compositions). For lichens of ALB 10 plots out of 12 were resampled for 66 times. The diversity response to stand type composition is characterized by R2 and estimated degrees of freedom (edf). Labelled dots mark the maximum (orange) and minimum (light blue) gamma diversity.
Forests 10 00073 g005
Figure 6. Mean number of exclusive bryophyte and lichen species in pure beech, pure conifer and mixed stands of Schorfheide-Chorin (S-C) and Schwäbische Alb (ALB) based on pairwise comparisons of 1000 resamplings of plots per stand type and region (number of resampled plots see Table 3). Error bars indicate the 95% quantile of resamplings. Different lowercase letters indicate significant differences among stand types within regions (i.e., at least 975 of 1000 pairwise comparisons showed higher number of exclusive species of one stand type compared to the others).
Forests 10 00073 g006
Figure 7. Regional diversity (species richness) in % for (a) Schorfheide-Chorin and (b) Schwäbische Alb combining vascular plants, bryophytes and lichens along compositional gradients of pure beech (Be), pure conifer (Pi = Pine, Spr = Spruce) and mixed stands (Mix). The stand type composition was varied in steps of 10% using 1000 resamplings of 22 plots per step for Schorfheide-Chroin and using 66 resamplings of 10 plots per step for Schwäbische Alb. The regional diversity quantifies the mean relative gamma diversity of taxonomic groups accounting for the absolute diversity within groups (log weighting of diversity). Labelled dots mark the maximum (orange) and minimum (light blue) regional diversity.
Forests 10 00073 g007
Table 1. Characteristics of the study regions. Data are based on information on forest growth regions and districts provided by Gauer and Aldinger [49].
Northwestern GermanySchorfheide-ChorinSolling HillsSchwäbische Alb
Area~25,000 km2~1300 km2~350 km2~420 km2
Coordinates53°18′ N–53°39′ N; 8°30′ E–10°40′ E52°52′ N–53°12′ N; 13°37′ E–14°1′ E51°40′ N–51°50′ N; 9°26′ E–9°44′ E48°21′ N–48°31′ N; 9°13′ E–9°31′ E
Elevation0–150 m a.s.l.3–140 m a.s.l.300–450 m a.s.l.460–860 m a.s.l.
BedrockGlacial sedimentary deposits (partly with loess cover); old PleistoceneGlacial series; young PleistoceneRed sandstone with loess coverJurassic limestone
Predominant soil typeSandy-podsol-cambisolCambisolAcid silty loam cambisolCambisol and leptosol
Mean annual temperature8.1–9.3 °C8.2–8.6 °C7.3–7.8 °C5.7–7.6 °C
Annual Precipitation560–840 mm555–590 mm915–1030 mm843–1096 mm
Potential natural vegetationAcidic beech forestAcidic to mesic beech forests (partly with sessile oak)Acidic beech forestBeech forests on limestone
Tree species compositionForest area ~ 27%
Share pine ~ 37%
Spruce ~ 25%
Beech ~ 5%
Other conifers ~ 7%
Forest area ~ 48%
Share pine ~ 69%
Beech ~ 7%
Oak ~ 6%
Forest area ~ 94%
Share spruce ~ 62%
Beech ~ 30%
Oak ~ 8%
Forest area ~ 47%
Share beech ~ 39%
Spruce ~ 38%
Other broadleaves ~ 12%
Investigated forest types (stand age, establish-ment)Pure beech
(76–120 yrs, natural regeneration)
Pure pine
(51–82 yrs, planted)
Pure Douglas fir
(53–64 yrs, planted)
Beech/pine mixture
(79–161 yrs, beech planted under pine)
Beech/Douglas fir mixture
(61–98 yrs, Douglas fir planted in beech regeneration)
Pure beech
(~70–160 yrs, natural regeneration)
Pure pine
(~30–70 yrs, planted)
Beech/pine mixture
(46–130 yrs, beech planted under pine)
Pure beech
(52–150 yrs, natural regeneration)
Pure spruce
(54–132 yrs, planted)
Beech/spruce mixture
(48–149 yrs, spruce planted in beech regeneration gaps)
Pure beech
(~60–100 yrs, natural regeneration)
Pure spruce
(~40–60 yrs, planted)
Beech/spruce mixture
(~60–100 yrs, spruce planted in beech regeneration gaps)
No. of plots100278167196
Table 2. Alpha and gamma diversity (species richness) of vascular plants in pure beech, pure conifer and mixed stands (=corners of the triangle in Figure 1), and the composition of pure and mixed stands within hypothetical forest landscapes that supports maximum and minimum gamma diversity of vascular plants. Given are mean values of the 1000 resamplings based on 17 plots per resampling. Minimum and maximum resampling values are given in parenthesis a.
Beech/Pine (Be/Pi)Beech/Douglas fir (Be/Dgl)Beech/Spruce (Be/Spr)
RegionSchorfheide-ChorinNorthwestern GermanySollingSchwäbische Alb
n1717171717
Alpha Diversity
Beech14.0a
(7.2–20.8)
9.0b
(6.7–10.2)
8.9c
(6.7–10.2)
10.4c
(6.1–14.8)
22.5b
(16.8–28.8)
Conifer15.9a
(13.1–18.7)
18.8a
(17.8–19.8)
21.4a
(18.6–23.4)
26.1a
(20.7–31.8)
36.9a
(25.8–48.7)
Mixed8.6b
(4.9–13.1)
7.1c
(6.1–8.0)
14.7b
(11.9–16.7)
17.7b
(11.6–23.6)
33.1a
(25.7–40.6)
Gamma Diversity
Beech71.2a
(49–94)
53.3b *
(41–56)
53.2c *
(41–56)
40.9c *
(22–56)
87.7c *
(60–114)
Conifer64.5ab
(48–83)
60.9a
(54–64)
78.9a
(67–83)
77.4a
(62–88)
153.5a
(117–187)
Mixed49.0b *
(29–64)
39.0c *
(30–42)
66.2b *
(44–70)
61.6b*
(43–78)
123.7b *
(101–148)
Stand Type Composition
Maximum gamma diversity60%Be-40%Pi-0%Mix40%Be-60%Pi-0%Mix0%Be-100%Dgl-0%Mix0%Be-100%Spr-0%Mix0%Be-100%Spr-0%Mix
74.8
(49–97)
61.8
(47–76)
78.9
(67–83)
77.4
(62–88)
153.5
(117–187)
Minimum gamma diversity0%Be-0%Pi-100%Mix0%Be-0%Pi-100%Mix100%Be-0%Dgl-0%Mix100%Be-0%Spr-0%Mix100%Be-0%Spr-0%Mix
49.0 *
(29–64)
39.0 *
(30–42)
53.2 *
(41–56)
40.9 *
(22–56)
87.7 *
(60–114)
a Significant difference among stand types and among stand type compositions was inferred by pairwise comparisons of resamplings (i.e., for two-sided p < 0.05 at least 975 of 1000 comparisons showed larger values for one stand type compared to the other). Different lowercase letters mark significant differences in alpha and gamma diversity among the three stand types. * marks a significant difference to the landscape composition supporting maximum gamma diversity.
Table 3. Alpha and gamma diversity (species richness) of bryophytes and lichens in pure beech, pure conifer and mixed stands (=corners of the triangel in Figure 1), and the composition of pure and mixed stands that supports maximum and minimum gamma diversity of bryophytes and lichens in Schorfheide-Chorin and Schwäbische Alb. Given are mean values of 1000 resamplings based on the number of plots (n) per resampling. Minimum and maximum resampling values are given in parenthesis.a
Schorfheide-Chorin (Beech(Be)/Pine(Pi))Schwäbische Alb (Beech(Be)/Spruce(Spr))
BryophytesLichensBryophytesLichens
n36222610
Alpha Diversity
Beech9.8b
(8.8–10.9)
5.0a
(3.8–6.3)
13.4b
(11.3–15.7)
19.5a
(15.4–24.0)
Conifer11.2a
(10.8–11.7)
5.4a
(5.0–5.8)
16.1a
(14.1–17.8)
9.0c
(6.8–11.4)
Mixed10.7ab
(9.9–11.7)
5.5a
(4.6–6.4)
14.1b
(13.0–14.9)
15.1b
(12.7–17.4)
Gamma Diversity
Beech38.0a
(29–48)
20.9a
(12–32)
60.7a
(49–69)
55.7a
(44–64)
Conifer38.1a
(35–39)
17.5a
(15–18)
57.0a *
(50–63)
30.6b *
(23–37)
Mixed36.1a
(31–38)
19.0a
(13–22)
58.8a *
(53–60)
49.7a
(41–54)
Stand Type Composition
Maximum gamma diversity50%Be-50%Pi-0%Mix60%Be-40%Pi-0%Mix50%Be-50%Spr-0%Mix90%Be-10%Spr-0%Mix
41.3
(34–50)
21.6
(15–31)
68.7
(57–79)
55.7
(44–67)
Minimum gamma diversity0%Be-0%Pi-100%Mix0%Be-100%Pi-0%Mix0%Be-100%Spr-0%Mix0%Be-100%Spr-0%Mix
36.1
(31–38)
17.5
(15–18)
57.0
(50–63)
30.6
(23–37)
a Significant differences among stand types and minimum and maximum diversity stand type combinations were inferred by pairwise comparison of resamplings (i.e., for two-sided p < 0.05 at least 975 of 1000 comparisons showed larger values for one stand type compared to the others). For lichens in Schwäbische Alb only 10 out of 12 plots were resampled up to 66 times. Different lowercase letters mark significant differences in alpha and gamma diversity among the three stand types. * marks a significant difference from the stand type composition supporting maximum gamma diversity.
Table 4. Vascular plant species associated with pure conifer (C), pure beech (B) or mixed stands (M) in the four investigated regions based on indicator species analyses. a S-C = Schorfheide-Chorin, NW = Northwestern Germany, SO = Solling, ALB = Schwäbische Alb. Species order follows a decreasing Ellenberg indicator value (EIV) for light (L); x = indifferent species; Ø = mean EIV values.
Characteristic Species ofBeech/PineBeech/Douglas FirBeech/Spruce EIVFA
S-CNWNWSOALB LMRN
pure conifer stands
Calluna vulgaris C 8x112.1
Epilobium angustifolium C C 85581.2
Rumex acetosellaC 83222.2
Rubus fruticosus agg. b CC 7.75.04.84.62.1
Agrostis capillaris C 7x442.1
Betula pendulaCC 7xxx2.1
Cirsium palustre C 78432.1
Digitalis purpurea C 75361.2
Galeopsis tetrahit C 75x62.1
Galium mollugo agg. c C 75752.2
Galium saxatile C C 75232.1
Molinia caerulea C 77x22.1
Pinus sylvestris C 7xxx2.1
Quercus robur C 7xxx2.1
Taraxacum sect. Ruderalia C 75x82.1
Cerastium holosteoides C 65x52.2
Frangula alnusC 684x2.1
Myosotis sylvatica C 65x71.2
Stellaria media C 6x782.2
Veronica officinalis C 64342.1
Ceratocapnos claviculata C 55361.2
Dryopteris carthusiana C 5x432.1
Epilobium montanum C 45662.1
Athyrium filix-femina C 37x61.1
Galium rotundifolium C 25541.1
Ø6.35.44.14.8
pure stands
Moehringia trinervia C/B 45671.1
pure beech stands
Carex pilulifera B 55332.1
Viola rivinianaB 544x1.1
Impatiens parvifloraB 45x61.1
Milium effusumB 45551.1
Carex remota B 38xx1.1
Ø4.25.44.04.7
pure and mixed stands in at least one region
Urtica dioica C/M x6792.1
Euphorbia cyparissias C/M 83x32.1
Hypericum perforatum C/M 74642.1
Rubus idaeus CC/M C/M 7xx61.2
Sambucus nigra C/M 75x92.1
Sambucus racemosa C/M 65582.1
Deschampsia flexuosaCCC/MC 6x232.1
Pteridium aquilinumCM 65331.1
Sorbus aucupariaCCC/MCC 6x4x2.1
Geranium robertianum C/M 5xx72.1
Picea abies C/MC/M 5xxx2.1
Trientalis europaea CC/MC 5x321.1
Vaccinium myrtillusC/MCCC 5x232.1
Dryopteris dilatata CC/MC/M 46x71.1
Impatiens noli-tangere C/M 47761.1
Mycelis muralis C/MCC/M 45x62.1
Abies alba C/M 3xxx1.1
Pseudotsuga menziesiid C/M 36331.1
Oxalis acetosella C/M 15461.1
Anemone nemorosaB B/M x5xx1.1
Anemone ranunculoides B/M 36881.1
Fagus sylvatica B/MB/M 35xx1.1
Ø5.45.24.75.6
a Species selection was restricted to species with a mean specifity of S > 40% and a mean frequency of F > 20% per resampling in at least one stand type. A significant association is based on pairwise comparisons of indicator values (=S × F) among stand types across resamplings (e.g., for a species characteristic of pure conifer stands (C), indicator values were higher in 975 of 1000 resamplings for conifer stands compared to beech and mixed stands; B = species characteristic for beech stands; M = characteristic in mixed stands). Species with higher indicator values in one pure and the mixed stand were categorized as conifer/mixed (C/M) or beech/mixed characteristic species (B/M); Ellenberg indicator values (EIV) for light (L), moisture (M), reaction/acidity (R) and nutrients (N). Forest affinity (FA; 1.1 = species of closed forests, 1.2 = species of edges and clearings, 2.1 = species of forests and open sites, 2.2 = species predominantly in open sites). b indicator values represent the mean of all Rubus species assigned to this taxonomic aggregate. c indicator values for Galium album as the most common species of this aggregate used. d Indicator values according to Landolt et al. [66] adjusted to the Ellenberg-scale.
Table 5. Bryophyte species associated with pure conifer, pure beech or mixed stands in Schorfheide-Chorin (S-C) and Schwäbische Alb (ALB). For details see Table 4. SUB gives the preferred substrate species grow on (S = soil, B = bark, D = deadwood) as listed by Schmidt et al. [63]. Rocks as substrate was not included. * marks threatened and protected species (see Table A3).
Characteristic Species ofBeech/PineBeech/Spruce EIVFASUB
S-CALB LMR
pure conifer stands
Hypnum jutlandicumC 7222.1S,B,D
Lophocolea bidentata C 7652.1S,B,D
Rhytidiadelphus squarrosus C 7652.2S,D
Hylocomium splendens * C 6452.1S,D
Pleurozium schreberiCC 6422.1S,D
Scleropodium purumCC 6452.1S,D
Dicranella heteromalla C 5422.1S,B,D
Eurhynchium angustirete C 5471.1S,B,D
Orthodontium lineareC 4522.1S,B,D
Plagiochila asplenioides * C 4661.1S,D
Plagiomnium undulatum C 4662.1S,B,D
Thuidium tamariscinum C 4642.1S,B,D
Ø5.44.84.3
pure beech stands
Amblystegium subtile * B 7561.1B
Atrichum undulatumB 6642.1S,D
Dicranum montanumB 6522.1S,B,D
Isothecium alopecuroides * B 5561.1S,B,D
Ø6.05.34.5
pure and mixed stands in at least one region
Rhytidiadelphus triquetrus * C/M 7452.1S,D
Dicranum polysetumCC/M 6452.1S
Dicranum scopariumC/M 5442.1S,B,D
Herzogiella seligeri C/M 5541.1S,B,D
Rhytidiadelphus loreus C/M 4631.1S,D
Frullania dilatata * B/M 8452.1B
Radula complanata * B/M 7572.1S,B,D
Pterigynandrum filiforme B/M 6541.1B
Metzgeria furcata * B/M 5462.1S,B,D
Ulota bruchii * B/M 4542.1B,D
Ø5.74.64.7
Table 6. Lichen species associated with pure conifer, pure beech and mixed stands in Schorfheide-Chorin (S-C) and Schwäbische Alb (ALB). For details see Table 4. nd = no data available. SUB gives the preferred substrate species grow on (B = bark, D = deadwood) as listed by Schmidt et al. [63]. Rocks as substrate was not included. * marks threatened and protected species (see Table A4).
Characteristic Species ofBeech/PineBeech/Spruce EIVFASUB
S-CALB LMRN
pure conifer stands
Platismatia glauca C 75221.1B,D
Scoliciosporum chlorococcum C 63362.1B
Micarea prasina C 34441.1B,D
Ø5.34.03.04.0
pure beech stands
Xanthoria polycarpa B 73782.1B,D
Arthonia radiata * B 34541.1B
Lecanora subcarpinea * B ndndndnd2.2B
Lecanora subrugosa * B ndndndnd2.1B
Ø5.03.56.06.0
pure and mixed stands in at least one region
Lecanora conizaeoidesC/M 73252.2B
Hypocenomyce scalarisC/M 63222.1B,D
Lecanora chlarotera B/M 63652.2B
Phlyctis argena B/M 53452.1B
Pertusaria leioplaca * B/M 44521.1B
Graphis scripta * B/M 34531.1B
Porina aeneaB/M 34541.1B
Arthonia spadicea B/M 24431.1B,D
Ø4.53.54.13.6