Article

Logging Contractors’ Growth in the Southern Cone: An Analysis of Contractor Business Strategies, Innovation, and Mechanization

by
Patricio Mac Donagh
1,*,
Santiago José Elías Velazco
2,
Guido F. Botta
3,
Tomas Schlichter
4 and
Frederick Cubbage
5
1
Facultad de Ciencias Forestales, UNaM, Eldorado N3380, Misiones, Argentina
2
IBS CONICET UNaM, Bertoni 85, Iguazú N3370BFA, Misiones, Argentina
3
EPG, FAUBA, CABA, C1417DSE, Universidad Nacional de Luján, Luján PC 6700, Argentina
4
EPG, FAUBA, Ciudad Autónoma de Buenos Aires (CABA) C1417DSE, Argentina
5
Department of Forestry and Environmental Resources, North Carolina State University, Raleigh, NC 27695-8008, USA
*
Author to whom correspondence should be addressed.
Forests 2019, 10(1), 69; https://doi.org/10.3390/f10010069
Submission received: 13 December 2018 / Revised: 9 January 2019 / Accepted: 12 January 2019 / Published: 16 January 2019
(This article belongs to the Section Forest Ecology and Management)

Abstract

:
Forest plantations have increased in South America for several decades. Harvesting is performed mainly through contractor companies. Our hypothesis is that logging contractors that innovate, grow more than others. We analyzed logging contractors through production and innovation, working in Argentina (22), Brazil (35) and Uruguay (10), through surveys between 2008 and 2012. Factors that affected firm growth were analyzed with linear mixed effect models. In all three countries there was a preponderance of logging contractors with cellulose companies. Our results show that logging firms that had mutualistic supply chain relations with the contracting organizations had better production indicators and lower cost per ton than other independent harvesting contractors. In the last 10 years, mechanization increased significantly, reducing the number of employees. Innovation was the most significant variable in enhanced logging production. For the period from 10 to 5 years before the survey period, the number of employees and type of contracting company were most significant on loggers’ growth. During the last 5-year period before the survey period, the number of employees and innovation were significant. Thus, during the last 10 years, logging companies shifted from growth based on type of the firm to the amount of innovation by firms, and contracting companies.

1. Introduction

Timber harvesting is one of the primary costs of supplying raw material to forest products firms, often exceeding the cost to grow the trees themselves. The timber harvesting (including transport) in forest plantations is considered as one of the main activities in the determination of the costs of the raw material for industries [1,2,3]. In the Southern Cone of South America, forest harvesting activities are carried out through logging contractors that have emerged through the phenomenon known as outsourcing. This is the most common approach for a company that owns forest plantations. In forest products timber harvesting, relations are determined by asymmetric situations, where contract negotiations take place at multiple levels, and involving contract price, working conditions, financial support, professionalization, and processes of certification [2,4,5,6,7]. Logging firms occupy a unique position in the innovation system, because they are the only unit that routinely communicates with all others in the supply chain [8].
Many contractors have been attracted to the logging industry in the Southern Cone, but have failed, because they were not able to maintain both the requirements of the contracting company, and their own company’s profitability [2,3,7,9]. It can be inferred that many of the successful contractors could be, in practice, employees under contract to the larger companies, or in other cases, leading entrepreneurs, who have been able to innovate in the business, and thus develop agile and flexible companies that make a successful long-term relationship [2,4,5,6,8,10].
Recently, Eriksson et al. [2,11] conducted a survey of 74 loggers working for the same Swedish forestry company. The survey was performed through contractor data and questionnaires to the company managers. They found four generic alignment approaches for each contractor group: active sourcing, adapted incentives, active use of power advantage, and tailored contractor development programs. The first were contractors who can provide services of better quality at a lower price. The second means that contractor incentives need to be aligned with what the customer requires. The third approach is to help struggling contractors to align, or to strategically develop the resources or performance of contractors to meet future needs. Per the fourth approach, when there is an asymmetry in power between contractor and customer, the customer can make use of its relative power to directly promote certain behaviors from the contractor. The authors conclude that there is a need for a differentiated approach to contractor alignment response from each group of contractors.
To meet the increases in demand, to lower logging costs, to reduce environmental damage, or to achieve or maintain levels of global competition, the introduction of technology was one key driver in expansion of the forest products sector in the Southern Cone. For much of the 1980s and the 1990s, the introduction of technology occurred through machinery investment, and from about 1990, technology has included investment in hard technologies (equipment) and soft (training, computer programs). Increasingly more companies incorporate soft technologies in timber harvesting, which will increase in the future. However, the total amount of investment still is larger for machinery [8,12,13]. Logging innovation appears to require a large amount of capital and, subsequently, the risk to the logging firm is extraordinarily high. A relatively low pay rate for logging services, combined with short-term contracts, was found to compound these problems and further inhibit logging innovation efforts [8].
Little research has focused on the business performance of harvesting contractors. In Scandinavia, there was found that relations between harvesting contractors and contracting companies are often defined as “mutual” in the long term, but the contracting company sets most of the contract conditions [5]. This approach might be contrasted with the premise that loggers are independent contractors that lack long-term supply arrangements, and commonly move among different forest products firm consumers.
These two views contrast the degree to which investment decisions of contractors are driven by the contracting company, which sets deadlines for contracts, guarantees the financing, and determines many of the other working conditions, versus loggers as independent contractors with little permanent relationships. In addition, there are very few logging companies that perform short-term financial analysis, or even less use long-term analysis. Most often it has been found that logging companies only analyze margins (price less cost). There are also cases in which contracting companies require their contractors to submit details of their costs. In these cases, this detail of the costs is based on discussion between contracting and contracted, so the margin and the price are fixed by the contracting party, and accepted by the contractor [2,6,8].
In this situation, the main reasons for investment in equipment replacement are high costs of operation and maintenance due to physical wear of old equipment; failure to be able to meet an increase in demand; and comparison to technologically better new equipment that produces better quality products. Moreover, local or global competitiveness among companies can affect forest products firms and their logging contractors. Another aspect that may drive technology changes is related to improving the safety standards, which implies discarding old machines and replacing them with newer and improved models. Lastly, the environmental considerations impacts, which affected the cost of the operation, were considered [2,5,6,8,10].
The productive restructuring in enterprises is occurring mainly under the introduction of both technological and organizational innovations and management, seeking to achieve integrated and flexible forms of work. Forestry companies are developing and implementing different business models of management and organizational structures, in order to modify their forms of production and/or provide services required.
Hodgson [14] presents three explanations about why the firm can grow and why there may be limits to the growth of the firm—internal conditions (capacity directive), external conditions (product or market factors), and the internal combination (uncertainty and risk).
It should be noted a related question is whether harvest contractors have exceptional entrepreneurship; or better yet whether successful contractors are those that have used innovation as a tool for growth. However, this question could be at odds with the outsourcing, in some cases, where the contracting firm has a large measure of control over contractors. Too much corporate control negates the advantages of independent contractors, giving them very little ability to innovate, and its growth would be strongly linked to the designs of the contracting company [2,6,8]. In fact, integrated forest products firms had their own logging crews in the U.S. South in the 1950s and 1960s, but those crews were less productive and required greater fringe benefits for social insurance payments than small independent crews. Thus the large companies dropped their own crews and moved to independent contractors.
Hultåker and Bohlin [5], through interviews developed with contractors, harvest manufacturers, entrepreneurs and forest owners, identified three types of contractors according to the intensity of the activity: (i) contractors who took active initiatives and were trying to develop products and services for the market, (ii) contractors who reacted to the customers’ demands but did not take their own initiatives, and (iii) passive contractors who did not make efforts to develop new products or services. The development efforts of the contractors were in many cases triggered by external factors beyond their control. However, there also seemed to be a need or predisposing factor to the action prompting the developments when opportunities appeared.
Commonly, forestry has a close interdependence of contractors and customers in most of the countries where this activity is important [8,13,15]. Mäkinen [16] applied the Porter’s competitive strategies and found that successful contractors of Finland showed a very long-term relationship with a client—up to 20 years—a good use of operational capability, and not too large an operating radius. Prudham [4] in Oregon, USA, has recorded two different contractors’ patterns. The first one was based on a relatively broad contracting offer, the other presented repeated contracts between the same parties over a long period of years.
Here, we (i) developed production models of logging contractors that consider innovation and management skills in each sector and country in the Southern Cone—Argentina, Brazil and Uruguay—in order to identify necessary attributes of progress as a company and the relationships among logging contractors in the forest products supply chain; and (ii) evaluated the growth of logging contractor companies in the last 10 years, related to contractors, mechanization, operation, age of company, and country effect. We examined these two perspectives in this research, which are likely to influence the efficiency and profitability of logging contractors.

2. Materials and Methods

The framework employed in this study was in part previously described in Mac Donagh et al. [9] and was based on personal interviews with logging contractors working in timber plantations in three countries of the Southern Cone: Argentina (Misiones and Corrientes Provinces), Brazil (Parana, Santa Catarina and Rio Grande do Sul States), and Uruguay. Personal interviews were a common method previously employed [2,6,8]. Authors like Okey and Visser [17] and Conrad et al. [10] have used information from large surveys involving government and loggers’ associations. As we included loggers from three different countries, so personal interviews were the most appropriate method to obtain the information. The data survey was carried out between years 2008–2012, and in total we interviewed 67 logging contractors—22 from Argentina, 35 from Brazil, and 10 from Uruguay. All the interviews used the same questionnaire, which provided the data for the models described below. This covered production, costs, the level of mechanization, species, type of operation, type of contracting, and country. With the aim to validate the questionnaire, an independent sample test was made in Brazil, by one researcher from Santa Catarina State University, with five logging contractors, giving congruent results.

The Evolution of the Contractors as Entrepreneurs

Interviews with the contractors included both successful and unsuccessful firms in terms of the company’s growth, to obtain a wide variation in the sample. This range of firm levels allowed us to characterize entrepreneur profiles in each situation and distinguish the better from the poorer entrepreneurs. Successful contractors demonstrated an entrepreneurial spirit [5,8]. They expressed motivation, positive attitude, spirit of innovation, and transformation of difficulties into opportunities. In this context, innovation becomes the new paradigm to motivate the development of enterprises. Innovation is defined as the realization, combination, or the synthesis of knowledge in new, relevant, valuable products, processes or services. This definition of innovation is the most frequently used in the literature of the forestry industry [8,18]. In an organization, innovation capacity is a cultural attribute of companies ([19]).
Hultåker and Bohlin [5], Benjamin et al. [20], and Okey and Visser [17] found that success was demonstrated by firm growth, despite being a contractor. Successful firms had productive diversification, a multiplicity of customers, professionalism, and the use of management tools for the enterprise. These factors typified an innovative attitude. In contrast, some less-successful contractors acted more as implicit, dependent employees of a company. They had more of a mutualistic relationship with their success linked exclusively to the level of production and did not for example, have a cost management system. Per the previous studies, the various criteria and parameters of the innovation that might lead to loggers´ success were synthesized to guide review of the survey results for this research. Those factors used here are presented in Table 1.
With five exceptions in Brazil, all the interviews were carried out by the lead author. The data were used as continuous variables in mixed linear regression analysis such as those described by Bell and Jones [21]. For this, the eight parameters assessed were grouped into two major groups that focused on two concepts of innovation and the business [2,11,22], which as described above are not necessarily competing.
We adopted the postulate for characterizing firms developed by Cameron and Quinn [19], Crespel and Hansen [22] and Milner and Kubota [23] in the sense of considering the organizational environment of enterprises, and grouping the arguments of the Table 1 according to the dimensions laid down in four quadrants. These are administrative (bureaucratic) companies versus entrepreneurs in the horizontal shafts; and companies with a focus on the organization, or with a focus on the market in the vertical (Figure 1). Hierarchy culture, is evidenced by large numbers of standardized procedures, multiple hierarchical levels and an emphasis on rule reinforcement. Market culture, is based on the transaction costs. Typical characteristics of clan-type firms were teamwork, employee involvement programs, and corporate commitment to employees. The adhocracy assumptions were that innovative and pioneering initiatives are what leads to success, and these organizations are mainly in the business of developing new products and services and preparing for the future. The major task of management is to foster entrepreneurship, creativity, and activity “on the cutting edge”.
In this sense, the arguments of the Table 1, were regrouped to transform into a Likert scale format [11], so that:
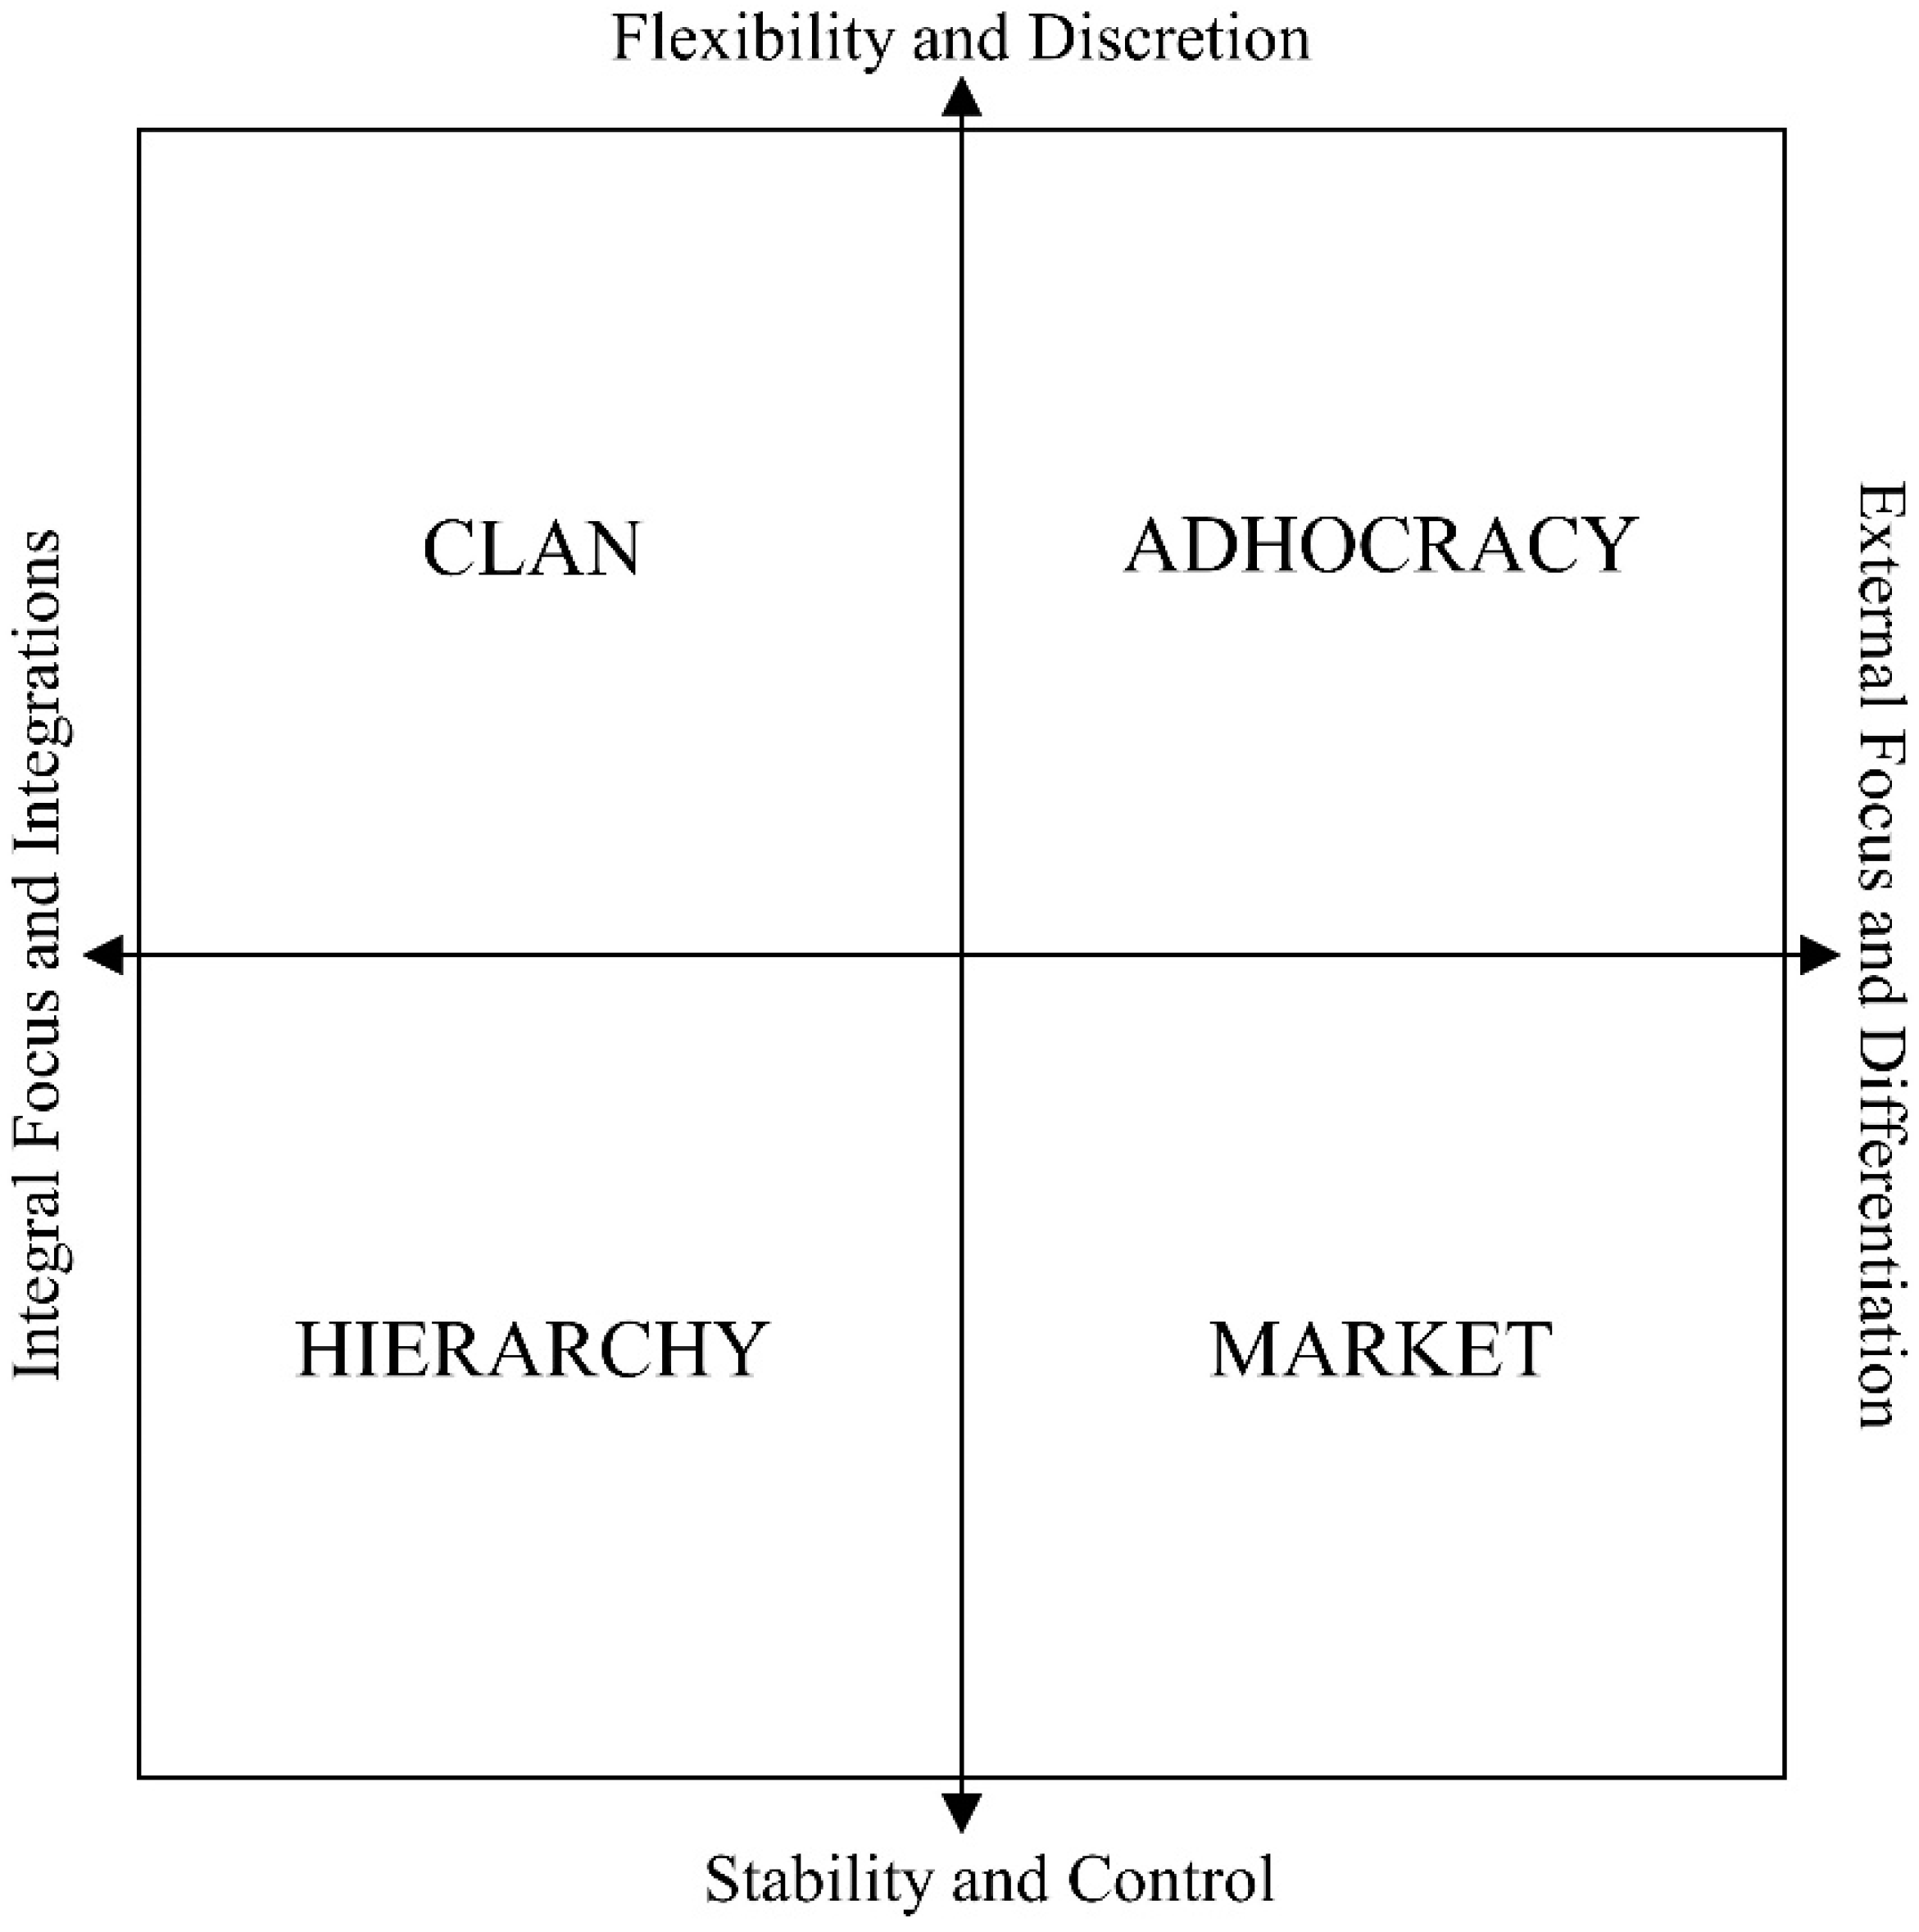
  • Innovation ability and interest in innovation were related to the entrepreneurial dimension, related to an adhocracy company.
  • Job satisfaction and the company’s management were related to the administrative dimension, related to an hierarchy company.
  • Commitment to the organization and innovation strategy were related to the dimension of organization of the company, related to a clan company.
  • Results of the company and management of the company were related to the dimension of market, related to a market company.
So as noted in Table 1 and Figure 1, we collected data from the contract loggers in the three countries that allowed us to obtain production and cost data, but more importantly for this research, to classify loggers’ levels of management ability and innovation. Eight broad concepts were identified as adapted from Crespell and Hansen [22]. Interviewees’ answers were transformed to a scale of success from 1 (worst) to 5 (best) in each individual concept. Some of these scaled responses were then used to estimate the interest of the loggers in innovation—the first four in Table 1. Similarly, the last four concepts in Table 1 were used to estimate management skill. These scaled variables were then combined as independent variables to estimate the growth of contracting firms over the previous decade. Then, any surveyed company, would receive the ranking from 1–5 for each concept, and the sum for the first four concepts compose innovation values (20 maximum), and the last four concepts compose management skills values (20 maximum). Then the sum for each group was used as independent variables. Therefore, in the models tested below, two independent variables were composed, called innovation and business strategy.
According to the questionnaires, and in comparison with sectoral analyses, statistical data, and the evolution of the contractors, we analyzed by sector and by country, in time periods covering the last 5 and 10 years. Also, company age was considered in each period. This time period is congruent with the mechanization process in these countries, and with the expected life time of a forest machinery. The values of monthly average production in tons, and the number of employees were recorded for both periods for each month/year [9]. Also, for each period, it estimates of the innovation characteristics outlined in Table 1 were recorded in the interviews.
We used linear and linear mixed model approaches. The random effect of mixed models was parametrized in order to nest companies within the country to which they belonged. This was because the economic and political features specific of studied countries could determine companies’ productivity, growth and performance. We parametrized some interaction between predictors variables based on previous exploratory graphs of raw data.
The collinearity between continuous variables was analyzed by conditional index. For this method, a conditional index ≥30 indicated collinearity for those variables with a proportion of variance-decomposition <0.90 (90%). The predictor variables used in our models lacked multicollinearity problem because no conditional index surpassed this threshold (See in Supplementary Materials Tables S1 and S2). Normality and homoscedasticity of models’ residuals were visually inspected, as well as the presence of outliers. In this case of the productivity model, response variable (i.e., production in t/month) was transformed based on Napierian logarithm in order to meet the preview models’ residuals assumptions. The significance of the predictor values was acceded by Wald chi-square tests. Because the data were unbalanced, and models accounted with interaction we used sums of square type III. Models were compared based on the Akaike Information Criterion (AIC). Analyses were conducted with the R programming environment v.3.5.0 [24]. We used the packages nlme [25] and lsmeans [26] to construct mixed and estimate models respectively, car [27] to perform Wald test, and perturb [28] to calculate the conditional index.
Four model types were evaluated.
  • Model 1 is a linear model considering capital, number of employees, and companies’ age as covariates. The fixed effects where contracting, mechanization and the time period—either 0 to 5 years before the survey, or 6 to 10 years before.
  • Model 2 is a mixed linear model with capital, number of employees, and companies’ age as covariates and the same fixed effects than Model 1.
  • Model 3 added to the linear model 1 the random effects such as moment, innovation and business strategy—either as an independent firm or mutualistic relations with the wood consumer. These last two variables were composed from the results of surveys as mentioned in Table 1.
  • Model 4 is a mixed linear model, which included as random effects the moment, innovation and business strategy.

3. Results

The sampled companies produced an average of 17.7 million cubic meters per year, which represented 21% of the total production of all logging companies in the three countries (83 million cubic meters per year). In three countries, the greatest roundwood demand came from cellulosic (pulp and paper) companies, accounting for 83% of total demand. Sawmills, and medium enterprises, are more important in Uruguay (30%) and in Argentina (21.5%) than in Brazil (8%) [9].
The production mixed models employed in our study, estimated the production of company contractors over time, as a function of capital and the number of employees. The capital investment was directly related to the amount of equipment that any contractor owned. Then the amount of capital increased through more mechanization, and the production increases at inflection points about 50,000 t/month and turns asymptotic at 100,000 t/month.
For the fixed effects, we used the dummies that were significant in the regression analysis, which are the type of contracting, the level of mechanization, and the period in their history, five or ten years ago. Regarding the type of contracting, we found that the contractors developed long contractual relationships with the contracting companies, enduring over time. As described above, the changes in mechanization also are associated with the number of employees (Table 2).
The results of survey for innovation, showed that many companies include resources for research and development. Many contractors argue that they use research and development results to discuss the company strategy (Table 1, Innovation strategy, Resources for R & D). Some of these are growing companies, but with two or three business units. In the other extreme, there were some companies that eschew innovation, and think that the best solution is buying the newest machine to come out.
Innovative logging companies do not always employ necessarily the ABC cost method or use more than one business strategy. We found many well-organized companies which were weak on innovation, and so did not have better growth.
Overall, for the logging contractors’ production, Model 2 was the best when the AIC is considered. Between the covariates, the number of employees was significant in all models, but not the capital. The average value of the number of employees decreased when the mixed model with random effects was considered, but still remained significant. Among the fixed effects, mechanization and contracting were significant in all models. For the fixed effects models the period was significant either in the linear or in mixed linear model. When the random effects were included, the innovation was significant for both models, with interaction with the period (Table 2).
Table 3 presents contractor results for the logging companies´ growth for the most recent five year period. The dependent response variable was the average tons produced per month and per year, which was obtained from the surveys. The models analyzed were the same four used than in the case of the production. Also, as in the previous case, better indicators were found for the Model 2, the linear mixed with fixed effects.
In Model 2, only the number of employees was significant, with interaction with the contracting company. When the random effects were considered, the innovation and the number of employees were significant in the Model 4. This shows that for the logging contractors’ growth capacities, the innovation was more important than the business skills. From the point of view of the objective raised in this paper, this is an important result, since it clearly helps to explain the effect of innovation.
Table 4 presents the results for the period between 5 and 10 years before the surveys. In this period, Model 4 showed the lowest AIC, therefore it was the best model. Again, number of employees was significant for all the four models. However, contracting by employees or by capital was only significant for the fixed effects model.
During the earlier period neither innovation nor the ability to do business were significant, in contrast to the period from 0 to 5 years. The inclusion in the Model 3 and Model 4 improves indicators such as the AIC, but does not produce such pronounced effect as in the period from 0 to 5 years.
When the 10-year period as a whole is considered, it can be analyzed whether it is suitable to perform analysis for a decade or five-year period, and also to see if there is any change in results when considering the degree of mechanization 10 years ago and today (Table 5).
Overall, there is an improvement in the indicators of the models by the incorporation of the random effects, particularly the innovation. The linear model with random effects (Model 3) showed the lowest AIC. However, when the fixed models were considered, the contracting company was significant (Table 5).
The results of the growth of the last five years are perhaps best suited to predict what will happen in the next five. Or put another way, the intervals of five years, and no longer, are best suited to predict changes in the forest harvesting contractors sector.

4. Discussion

This research analyzed the management and innovation effects on the production of logging contractors in the Sothern Cone countries of Argentina, Brazil, and Uruguay. This survey covered 21% of total production in this region, and a large sample of loggers in each country, obtaining data on production, costs, type of harvest, and type of contract. We assessed the management skills and innovation using a quantitative assessment that allowed us to find out the influence of Contractor Company and mechanization.
Loggers that had mutualistic, cooperative relations with contracting pulp and paper companies, as indicated by the business strategy variable, had the highest production rates and the lowest production costs per ton. This mutualistic relationship largely corresponds with behavior of forest sectors such as those in Oregon, Maine and Wisconsin (USA) and Scandinavia [2,3,4,5,6]. Other independent logging firms with many contracts with medium-sized contractors (sawmills) had lower production levels and higher costs per ton. The findings indicate that the stability of a largely single or quite limited long-term supply relationship did foster more profitable and competitive logging contractors [9], rather than the typical independent and atomistic competition commonly posited as best for market success. At best, what happened is that they added more contracts with other companies. This is consistent with that found for Finland [5], for Sweden [2,6,13], and for the USA [4,8,10]. The changes in mechanization were reflected in each period.
At this point it is important to mention that there were no differences in prices or in cost per ton between loggers working for sawmills or for pulp mills in the three countries [9]. Even in that survey the assorted log dimensions were not analyzed, and it should be noted that in the Southern Cone the sawmill logs are generally smaller than in the EU or the US. Also, trees from plantations are generally smaller, and rotation ages are shorter [9,29]. In this context, we hypothesize that the cost or the price of logging service follows an oligopoly pulp market behavior.
In the three countries analyzed, there was a preponderance of logging companies that are contractors with large pulp and paper cellulose companies. Market conditions, such as price of services, wage levels, or input prices, were not as important in company performance as the possibility of increasing production and increased investment and capital. Innovation, mechanization with the highest technology, and pulp contracting companies produced the best production results.
Macroeconomic variables, such as interest rates, taxes, and access to credit, were not limiting for the development of contractors [9]. Thus, in Argentina and Brazil, with interest rates above 15% a year, and despite greater difficulties to access credit, important processes of mechanization were developed, which allowed them to obtain better cost results than those of Uruguay. The low taxes found in Argentina, as opposed to the high values of Brazil, did not affect the production activities of these contracting companies. This is particularly important, because the study period was coincident with the worldwide financial crisis of 2008, and it seems to not have been affected by logging companies’ activities, for example in the acquisition of machinery.
Overall, the mutualist relationships between forest products companies and contract loggers, and in particular the possibility of increasing production contracts, have been more important than other factors such as macroeconomic conditions, or prices of wages, or inputs.
Our results indicate that a five-year period was more suitable to analyze mechanization processes than a 10-year period. When production is analyzed, the moment (period) was significant. And when each period was considered, different effects were significant.
In this research, the logging innovation capacities were more important than the business skills for production and growth. In comparison, other researchers focus on the framework organization or in the alignment with the pulp mill [2,6]. Only a few focused on logging contractors as innovators, and developed semi-structured interviews to obtain qualitative results. The research in Maine, USA, follows the same innovation classification that is used in our study, and their study found that the most successful logging contractors were the most innovative in products or processes [11].
The growth of a wood harvesting contractor was associated with the state of mechanization of the sector. The growth that occurred in the last five years analyzed was different from that which occurred in the previous five years. The percentage of mechanized companies varied considerably between these two periods. The percentage of mechanized companies was 17% between 5 and 10 years ago, rising to 41% at 5 years and reaching 95% in the current period. This would be demonstrating that today, mechanization is less a problem or challenge than it was a decade ago, and the big jump in mechanization occurred in the last 5 years. This is also corroborated with the average equipment age that the companies reported.
This analysis of the growth of harvesting contractors reflects the processes of mechanization in the forest sector of the Southern Cone. The findings of rapid mechanization are consistent with the earlier findings in different regions of the USA [1,3,11,20,29,30,31,32].
It is appropriate to signal that during the analyzed period, there were also changes in the employment rules and environmental aspects in the three countries. Sustainable forest management practices, and thus certification processes, are defining a new scenario in the Southern Cone, and the logging contractors are not an exception [29].

5. Conclusions

To our knowledge, this is a unique research in three countries about logging contractors and their behaviour as independent or mutualistic. In the three countries, contractors working for pulp mills showed the better production and growth results.
The mechanization process observed in these three countries happened in periods of around five years each, linked to the lifetime of the machinery. Fully mechanized companies are bigger in production, and have greater growth than semi-mechanized companies. This mechanization process is strongly related with the reduction of the number of employees.
The innovation on process, products or markets was one of the most important factors that affects the logging companies’ growth, and provides a way to differentiate best performers from poorer ones. Overall, our results extend those from prior research, mostly in the northern hemisphere and more developed countries. The results do show that the mechanization and innovation process has now been through the diffusion and adoption process throughout much of the plantation forestry sector in the Southern Cone, and that good management will lead to more profits there as in other parts of the world.

Supplementary Materials

The following are available online at https://www.mdpi.com/1999-4907/10/1/69/s1. Table S1. Conditional index and proportion of variance-decomposition of continuous predictors variables used to construct production models. Table S2. Conditional index and proportion of variance-decomposition of continuous predictors variables used to construct growth models for different time periods.

Author Contributions

Concept and research idea, P.M.D.; Bibliography, P.M.D., F.C. and S.J.E.V.; Methodology, P.M.D., S.J.E.V. and F.C.; Survey, P.M.D.; Compilation of data, preparation of results, and statistical elaboration, P.M.D., S.J.E.V. and F.C.; Writing—original draft preparation, review and editing, P.M.D., S.J.E.V., G.F.B., T.S. and F.C.

Funding

This work was supported by the lead author, and the EPG FAUBA.

Acknowledgments

We thank the Agronomy Graduate School at the Buenos Aires University (EPG FAUBA) for their support in this research and Ph.D. program. We also thank the 67 logging contractors who took the time for the interviews that are the foundation for this research.

Conflicts of Interest

The authors declare no conflict of interest.

References

  1. Siry, J.; Greene, W.D.; Harris, T.; Izlar, R.; Hamsley, A.; Eason, K.; Tye, T.; Baldwin, S.; Hyldahl, C. Wood supply chain and fiber cost. What can we do better? For. Prod. J. 2006, 56, 5–10. [Google Scholar]
  2. Eriksson, M.; LeBel, L.; Lindroos, O. The effect of customer–contractor alignment in forest harvesting services on contractor profitability and the risk for relationship breakdown. Forests 2017, 8, 360. [Google Scholar] [CrossRef]
  3. Conrad, J.L., IV; Greene, W.D.; Hiesl, P. A review of rhanges in US logging businesses 1980s–Present. J. For. 2018, 116, 291–303. [Google Scholar] [CrossRef]
  4. Prudham, W.S. Downsizing nature: Managing risk and knowledge economies through production subcontracting in the Oregon logging sector. Environ. Plan. 2002, 34, 145–166. [Google Scholar] [CrossRef]
  5. Hultåker, O.; Bohlin, F. Developing the Business: Logging Contractors’ Strategic Choices for Profitability and Work Environment. In Proceedings of the Biennial Meeting of the Scandinavian Society of Forest Economics, Vantaa, Finland, 12–15 May 2004; pp. 13–22. [Google Scholar]
  6. Erlandsson, E. The Impact of Industrial Context on Procurement, Management and Development of Harvesting Services: A Comparison of Two Swedish Forest Owners Associations. Forests 2013, 4, 1171–1198. [Google Scholar] [CrossRef] [Green Version]
  7. Fernandes, O. Diretrizes estratégicas para a consolidação da terceirização no setor florestal Brasileiro. [Strategic guidelines to consolidate the outsourcing in Brazilian forest sector]. In 12° Seminário de Atualização em Sistemas de Colheita de Madeira e Transporte Florestal; Anais UFPR Ed.: Curitiba, Brazil, 2002; pp. 19–36. (In Portuguese) [Google Scholar]
  8. Stone, I.J.; Benjamin, J.G.; Leahy, J. Applying Innovation Theory to Maine’s Logging Industry. J. For. 2011, 109, 462–469. [Google Scholar]
  9. Mac Donagh, P.; Botta, G.; Schlichter, T.; Cubbage, F. Harvesting contractor production and costs in forest plantations of Argentina, Brazil, and Uruguay. Int. J. For. Eng. 2017, 28, 157–168. [Google Scholar] [CrossRef]
  10. Conrad, J.; Vokoun, M.; Prisley, S.P.; Bolding, C.M. Barriers to logging production and efficiency in Wisconsin. Int. J. For. Eng. 2017, 28, 57–65. [Google Scholar] [CrossRef]
  11. Eriksson, M.; LeBel, L.; Lindroos, O. Management of outsourced forest harvesting operations for better customer-contractor alignment. For. Policy Econ. 2015, 53, 45–55. [Google Scholar] [CrossRef]
  12. Parise, D.; Malinovski, J. Análisis y reflexiones, sobre el desarrollo tecnológico de la cosecha forestal en el Brasil. [Forest harvesting technological development, analysis and reflections]. In XII Seminário de Atualização em Sistemas de Colheita de Madeira e Transporte Florestal; Anais UFPR Ed.: Curitiba, Brazil, 2002; pp. 78–109. [Google Scholar]
  13. Häggström, C.; Kawasaki, A.; Lidestav, G. Profiles of forestry contractors and development of the forestry-contracting sector in Sweden. Scand. J. For. Res. 2013, 28, 395–404. [Google Scholar] [CrossRef]
  14. Hodgson, G. Evolutionary and Competence-Based Theories of the Firm. J. Econ. Stud. 1998, 25, 25–56. [Google Scholar] [CrossRef]
  15. Gustafsson, Å. Assessing work order information quality in harvesting. Silva Fenn. 2017, 51, 6989. [Google Scholar] [CrossRef]
  16. Mäkkinen, P. Success factors for forest machine entrepreneurs. J. For. Eng. 1997, 8, 27–35. [Google Scholar]
  17. Okey, F.O.; Visser, R. Operational efficiency analysis of New Zealand timber harvesting contractors using data envelopment analysis. Int. J. For. Eng. 2017, 28, 85–93. [Google Scholar] [CrossRef]
  18. Hovgaard, A.; Hansen, E. Innovativeness in the forest products industry. For. Prod. J. 2004, 54, 26–33. [Google Scholar]
  19. Cameron, K.S.; Quinn, R.E. Diagnosing and Changing Organizational Culture: Based on the Competing Values Framework, Revised ed.; The Jossey-Bass Business & Management Series; Jossey-Bass, Ed.; A Wiley Imprint: San Francisco, CA, USA, 2006; p. 258. ISBN 13 978-0-7879-8283-6. [Google Scholar]
  20. Benjamin, J.G.; Bick, S.; Farrand, W.; Germain, R. Characteristics of Successful and Innovative Logging Contractors in the Northeast US. In Proceedings of the 37th Council on Forest Engineering Annual Meeting, Moline, IL, USA, 22–25 June 2014. [Google Scholar]
  21. Bell, A.; Jones, K. Explaining Fixed Effects: Random Effects Modeling of Time-Series Cross-Sectional and Panel Data. Political Sci. Res. Methods 2015, 3, 133–153. [Google Scholar] [CrossRef]
  22. Crespel, P.; Hansen, E. Managing for innovation: Insights into a successful company. For. Prod. J. 2008, 58, 9. [Google Scholar]
  23. Milner, H.; Kubota, K. Why the move to free trade? Democracy and trade policy in the developing countries. Int. Organ. 2004, 59, 107–143. [Google Scholar] [CrossRef]
  24. R Core Team. R: A Language and Environment for Statistical Computing; R Foundation for Statistical Computing: Vienna, Austria, 2018; Available online: https://www.R-project.org/ (accessed on 13 December 2018).
  25. Pinheiro, J.; Bates, D.; DebRoy, S.; Sarkar, D. R Core Team nlme: Linear and Nonlinear Mixed Effects Models. 2018. Available online: https://CRAN.R-project.org/package=nlme (accessed on 13 December 2018).
  26. Lenth, R.V. Least-Squares Means: The R Package lsmeans. J. Stat. Softw. 2016, 69, 1–33. [Google Scholar] [CrossRef]
  27. Fox, J.; Weisberg, S. Multivariate Linear Models in R—An Appendix to an R Companion to Applied Regression, 2nd ed.; SAGE Publications, Inc.: Thousand Oaks, California, USA, 2011; ISBN 978-1-4129-7514-8. [Google Scholar]
  28. Hendrickx, J. Tools for Evaluating Collinearity Usage and Environment for Statistical Computing; R Foundation for Statistical Computing: Vienna, Austria, 2012; Available online: https://CRAN.R-project.org/package=perturb (accessed on 13 December 2018).
  29. Cubbage, F.; Koesbandana, S.; Mac Donagh, P.; Rubilar, R.; Balmelli, G.; Morales Olmos, V.; De La Torre, R.; Murara, M.; Hoeflich, V.; Kotze, H.; et al. Global timber investments, wood costs, regulation, and risk. Biomass Bioenergy 2010, 34, 1667–1678. [Google Scholar] [CrossRef]
  30. Carter, D.; Cubbage, F. Technical efficiency and industrial evolution in southern US pulpwood harvesting. Can. J. For. Res. 1994, 24, 217–224. [Google Scholar] [CrossRef]
  31. Siry, J.; Cubbage, F.; Sills, E. Forest Production. In Forest in a Market Economy; Sills, E., Abt, K., Eds.; Kluwer Academic Publishers: Dordrecht, The Netherlands, 2003; pp. 59–78. [Google Scholar]
  32. Baker, S.A.; Greene, W.D. Changes in Georgia’s logging workforce, 1987–2007. South. J. Appl. For. 2008, 32, 60–68. [Google Scholar]
Figure 1. The framework of values of competition, extracted from Cameron and Quinn (2006).
Forests 10 00069 g001
Table 1. Criteria and parameters for the evaluation of innovation.
ConceptDimensionDescriptionScale
Innovation capacityProduct
Process
Business
Trend of the company to adopt/create technology1 rejection
5 very likely
Interest in innovationInterest in innovationIndividual interest in developing new ideas1 rejection
5 very likely
Organizational commitment (sharing)Loyalty
Identification
Membership
Sense of belonging and complementation with the contracting company1 rejection
5 very likely
Innovation strategyProduct
Process
Business
Resources for R&D
Degree of integration of the innovation strategy of the enterprise1 very low
5 very high
Job satisfactionJob satisfactionSelf-describing1 rejection
5 satisfied
Business strategyLow Costs
Differentiation
Success in the negotiations1 low costs
5 differentiation
The company’s resultsSales
Growth in sales
Net profit
Referenced in the competitors1—less than 20% up to
5—Top 20%
The company’s managementManagement systems
Software
Use of management systems by costs, margins, or by indicators1 without indicators
5 ABC
Source: Adapted from Crespell and Hansen (2008). ABC: Activity Base Costing.
Table 2. Results of the linear and mixed linear effect models for production (t/month) of contractors during the study period.
Models1 (lm)2 (lmm)3 (lm)4 (lmm)
Predictordfχ2p-valuedfχ2p-valuedfχ2p-valuedfχ2p-value
(Intercept)13488.7020.00011911.3340.0001477.9940.0001369.7840.000
Capital10.3500.55410.2360.62710.2510.61610.0050.942
N° Employees129.6950.000124.5110.000127.0760.000116.6670.000
Age10.0270.86910.0050.94510.9100.34010.4480.503
Contracting116.0080.000111.2540.001114.2820.00019.8480.002
Mechanization128.1460.000123.5910.000128.8480.000122.5950.000
Moment14.5770.03216.2540.01212.1940.13913.7450.053
Innovation 17.5010.00615.8180.016
Business 10.1020.75010.1820.669
Moment × Innovation 15.8420.016110.7810.001
N106106106106
AIC257.126254.110271.810262.303
R2 *0.5770.4990.6180.525
Conditional R2 0.674 0.735
lm: linear models; lmm: linear mixed effect models; * represents marginal R2 for linear mixed models.
Table 3. Results of the linear and mixed linear effect models for growth in production (t/month) in the last five years.
Models1 (lm)2 (lmm)3 (lm)4 (lmm)
Predictordfχ2p-valuedfχ2p-valuedfχ2p-valuedfχ2p-value
(Intercept) 13.0190.08214.3030.03811.4700.22511.0900.297
Capital10.1430.70510.1940.65910.0000.99810.0300.863
Contracting12.3270.12711.8450.17410.3130.57610.6680.414
N° Employees12.6900.10113.2760.07012.7050.10013.8850.049
Innovation 13.8050.05115.4620.019
Business 10.0050.94410.0910.763
Contracting × Capital10.1520.69710.1850.66710.6400.42410.6830.409
Contracting × N° Employees15.1850.02316.3720.01212.4140.12013.4940.062
Contracting × Innovation 10.6620.41611.0950.295
Contracting × Business 10.1710.67910.2120.645
N42424242
AIC751.147689.931753.362692.810
R20.1740.1270.5410.440
Conditional R2 0.906 0.936
lm: linear models; lmm: linear mixed effect models; * represents marginal R2 for linear mixed models.
Table 4. Results of the linear and mixed linear effect models for growth in production (t/month) in the period five to ten years.
Models1 (lm)2 (lmm)3 (lm)4 (lmm)
Predictordfχ2p-valuedfχ2p-valuedfχ2p-valuedfχ2p-value
(Intercept)10.1870.66510.0960.75710.6250.42912.2490.134
Capital11.5700.21010.5620.45411.9190.16610.7910.374
Contracting10.2350.62710.0060.93610.0030.95410.4080.523
N° Employees14.8080.02819.6950.00214.4960.034111.5620.001
Innovation 11.0440.30711.6230.203
Business 10.1330.71510.0350.852
Contracting × Capital11.2650.26114.8070.02810.9150.33914.8970.027
Contracting × N° Employees11.5110.21914.3980.03611.5310.21615.5640.018
Contracting × Innovation 10.0460.83010.0060.940
Contracting × Business 10.1280.72010.3830.536
N42424242
AIC665.127664.598629.145629.082
R20.6530.6140.6860.616
Conditional R2 0.964 0.965
lm: linear models; lmm: linear mixed effect models; * represents marginal R2 for linear mixed models.
Table 5. Results of the linear and mixed linear effect models for growth in production (t/month) in the period the last ten years.
Models1 (lm)2 (lmm)3 (lm)4 (lmm)
Predictordfχ2p-valuedfχ2p-valuedfχ2p-valuedfχ2p-value
(Intercept) 113.0230.000115.3210.00010.4250.51510.5660.452
Capital11.0750.30011.2650.26110.9800.32211.3070.253
Contracting14.7770.02915.6200.01810.1710.67910.2280.633
N° Employees10.3390.56110.3980.52810.2060.65010.2750.600
Innovation 14.1420.04215.5220.019
Business 10.1310.71710.1750.676
Contracting × Capital12.5610.11013.0130.08310.3710.54210.4950.482
Contracting × N° Employees13.0670.08013.6080.05710.2480.61910.3300.565
Contracting × Innovation 10.0080.93010.0100.919
Contracting × Business 11.2800.25811.7070.191
N40404040
AIC642.514646.514593.138597.138
R20.6530.4310.6870.605
Conditional R2 0.975 0.999
lm: linear models; lmm: linear mixed effect models; * represents marginal R2 for linear mixed models.

