Article

A Nonlinear Mixed-Effects Height-to-Diameter Ratio Model for Several Tree Species Based on Czech National Forest Inventory Data

1
Faculty of Forestry and Wood Sciences, Czech University of Life Sciences Prague, Kamýcká 129, 16500 Prague 6, Czech Republic
2
Forest Management Institute, 25001 Brandýs nad Labem—Stará Boleslav, Czech Republic
*
Author to whom correspondence should be addressed.
Forests 2019, 10(1), 70; https://doi.org/10.3390/f10010070
Submission received: 8 December 2018 / Revised: 12 January 2019 / Accepted: 15 January 2019 / Published: 17 January 2019
(This article belongs to the Section Forest Ecology and Management)

Abstract

:
Height-to-diameter at breast height (DBH) ratio (HDR) is an important tree and stand stability measure. Several factors such as stand dynamics, natural and anthropogenic disturbances, and silvicultural tending significantly affect HDR, and, therefore, in-depth investigation of HDR is essential for better understanding of ecological processes in a forest. A nonlinear mixed-effects HDR model applicable to several tree species was developed using the Czech national forest inventory data comprising 13,875 sample plots and 348,980 trees. The predictive performance of this model was evaluated using the independent dataset which was originated from 25,146 trees on 220 research sample plots. Among various tree- and stand-level variables describing tree size, site quality, stand development stage, stand density, inter-tree spacing, and competition evaluated, dominant height (HDOM), dominant diameter (DDOM), relative spacing index (RS), and DBH-to-quadratic mean DBH ratio (dq) were identified as the most important predictors of HDR variations. A random component describing sample plot-specific HDR variations was included through mixed-effects modelling, and dummy variables describing species-specific HDR variations and canopy layer-specific HDR variations were also included into the HDR model through dummy variable modelling. The mixed-effects HDR model explained 79% of HDR variations without any significant trends in the residuals. Simulation results showed that HDR for each canopy layer increased with increasing site quality and stand development stage (increased HDOM) and increasing competition (increased RS, decreased DDOM and dq). Testing the HDR model on the independent data revealed that more than 85% of HDR variations were described for each individual species (Norway spruce, Scots pine, European larch, and European beech) and group of species (fir species, oak species, birch and alder species) without significant trends in the prediction errors. The HDR can be predicted with a higher accuracy using the calibrated mixed-effects HDR model from measurements of its predictors that can be obtained from routine forest inventories. To improve the prediction accuracy, a model needs to be calibrated with the random effects estimated using one to four randomly selected trees of a particular species or group of species depending on the availability of their numbers per sample plot. The HDR model can be applied for stand stability assessment and stand density regulation. The HDR information is also useful for designing a stand density management diagram. Brief implications of the HDR model for designing silviculture strategies and forest management planning are presented in the article.

1. Introduction

Height-to-diameter ratio (HDR) is total height divided either by diameter at breast height or by diameter at the root collar of a tree. The HDR is a tree-level index of slenderness and is used for the evaluation of tree and stand stability. Large values of HDR indicate that either trees have grown in a crowded stand with mutual support from neighboring trees or they have grown in an extremely open stand where no significant competition exists [1,2,3,4]. Smaller values of HDR indicate longer crown length, higher crown projection area, better developed root system, lower position of the center of gravity, and higher stability of the trees. Many studies involving stand stability assessments have used HDR for characterizing tree and stand stability and their vulnerability to natural disasters [3,5,6,7,8,9]. Trees with larger HDR are always associated with increased risk of vulnerability to uprooting by windstorm and breakage by windstorm and icing [3,4,10,11,12,13]. Trees with large HDR may be more vulnerable because their stems may not be adapted to a condition of higher mechanical perturbation [3,4,14,15]. The mechanical properties of stem wood may be evaluated using HDR, for example, trees with small HDR may have higher bending movement than trees with larger HDR of similar heights [15,16,17,18].
Various HDR applications are possible for the effective silvicultural tending and forest management. By understanding the degree to which trees and stands are more susceptible to snow, icing, and wind damages, forest managers may better design silviculture prescriptions based on the range of HDR [1,3,5,9]. The HDR may be used for the evaluation of effectiveness and efficiency of thinning, as thinning substantially influences HDR, both mean stems, and even the upper layer of the trees in a stand [19,20]. Furthermore, HDR can be used as a prominent predictor to describe competition effects in various forest models [19,21,22,23,24,25,26]. The HDR is used for assessing tree vigor and health [19,27], for example, a tree with a higher HDR may have a lower vigor in general. The HDR derived from any empirical HDR model may be considered as a benchmark value that may be compared against HDR derived from tree height and diameter increment models, and models of height-diameter relationships. Since HDR is significantly correlated to crown ratio of the trees, trees with unfavorable properties in both HDR and crown ratio can be removed [1,20,28].
Tree and stand characteristics change over time, and thus, various empirical forest models including HDR models are necessary to update the information of these characteristics. Updating is done either from fresh measurements of HDR for all trees on each sample plot or empirical HDR models are used to predict HDR. In general, diameter and height increment models or height–diameter models are used to update the HDR instead of using HDR prediction models. However, the former models are often based on different datasets and the parameters of these models might not have been estimated using the simultaneous regression; therefore, HDR derived from these models is significantly biased [29]. Small bias associated with these models may lead to a large bias in the derived HDR. If a diameter increment model over-predicts and a height increment model under-predicts or vice versa, bias associated with HDR derived from these models could be substantial. Therefore, a species-specific HDR model is necessary for more precise prediction of HDR at tree-level. This can be possible with the HDR model developed using the comprehensive data that cover a wide variability in terms of tree- and stand-level characteristics (tree size and vigor, site quality, stand development stage, stand age, stand density, stand structure, silvicultural tending, and management regime). The methods employed to estimate model parameters also determine the degree of accuracy of the developed model.
The HDR information is essential for better understanding forest ecological processes in any forest as HDR is substantially influenced by tree species, stand age, stand structure, stand density, site quality (soil type, soil moisture, litter depth, slope, elevation, and exposition), stand development stage, climatic and natural disturbance (light, wind, snow, and icing), silvicultural tending, and species provenance [14,20,30,31,32,33,34,35,36,37,38,39]. Stand location, such as a stand on the forest edge, a stand in large gap or an unstable stand fragment also influence HDR [40,41,42]. The HDR varies with inter-tree spacing, even for a single species within the same stand, and extreme HDR may reach the extremely spare stands and the crowded stands [2,9]. The HDR also significantly varies on the trees with top or lower canopy layers within a stand [43]. The HDR also varies with tree root system, crown width and crown length [9]. Among the above-mentioned factors, inter-tree spacing, competition and stand density have the biggest influences on HDR [2,14,40,42,44,45,46,47]. Thus, the inclusion of variables describing the effects inter-tree spacing and competition, stand density, site quality and stand development stage into the HDR model is necessary to increase its prediction accuracy. A composite model developed using a large dataset that includes the interactive effects of the above-mentioned factors affecting HDR could provide a significantly high prediction accuracy.
The prediction accuracy of a composite HDR model can be further increased through integration of an unstructured random component by applying the mixed-effects modelling, which describes HDR variabilities caused by various stochastic factors. The hierarchically-structured dataset often leads to dependency among the measurements, as observations from the same sampling unit are most likely to be correlated. The assumptions of independent errors are largely violated while ordinary least square regression is used for estimating models [48]. Consequently, estimated parameters and variances would be significantly biased, resulting in the invalidation of the hypothesis tests [49,50]. The mixed-effects modelling allows for inclusion of all types of variabilities into the model and significantly increases the prediction accuracy [48,51,52,53,54,55].
To develop the robust mixed-effects HDR model (model with stable parameter and variance estimates), a large dataset is required, which can be supplied by a national forest inventory (NFI) program. This dataset covers a wide variability of growth conditions and silviculture tending on the forest stands across the country. In recent decades, several studies have used NFI data to develop forest models in many European countries [25,56,57,58,59,60,61,62,63]. Developing models using NFI data and testing against research sample plot data has been frequently practiced [25,58,63]. Testing the models against research sample plot data would increase the credibility of the models. A large dataset allows the interactive effects of various factors that affect HDR to be integrated into the model using complex statistical analyses.
Several studies have been carried out to show the relationships between HDR and the vulnerability of trees and stands; however, only a few have developed the statistical HDR models [2,14,43]. All existing HDR studies were based on smaller datasets acquired from few species compared to the datasets used in the current study, and HDR models were developed with a conventional modelling approach, i.e., least square regression approach. HDR modelling may be based on the data acquired from several tree species in the monospecific and mixed stands. Developing separate species-specific models for several species and their separate applications would be tedious and effort demanding. To increase the application efficiency of the model, this study applied the dummy variable modelling approach, which allows making a single HDR model applicable to several tree species. Therefore, this study aims to (1) develop a nonlinear mixed-effects HDR model (composite model) using a large NFI dataset through integration of the predictor variables describing the effects of inter-tree spacing and competition, site quality and stand development stage, canopy height differentiation and social position of individual trees, and unstructured component describing sample plot-level HDR random variations; and (2) evaluate the HDR model’s prediction performance using a large independent dataset acquired from research sample plots distributed in various parts of the Czech Republic. The parameters of a nonlinear mixed-effects HDR model are estimated using maximum likelihood procedure. The presented HDR model, which requires only a few predictors that can be derived from a routine forest inventory database, may serve as a useful tool in assessing tree and stand stability. This model will be used for various forest management implications that are briefly discussed in the article. Since conifer tree species are much more susceptible to ice- and wind-related damages than broadleaved species, the presented HDR model may be more useful for conifer species.

2. Materials and Methods
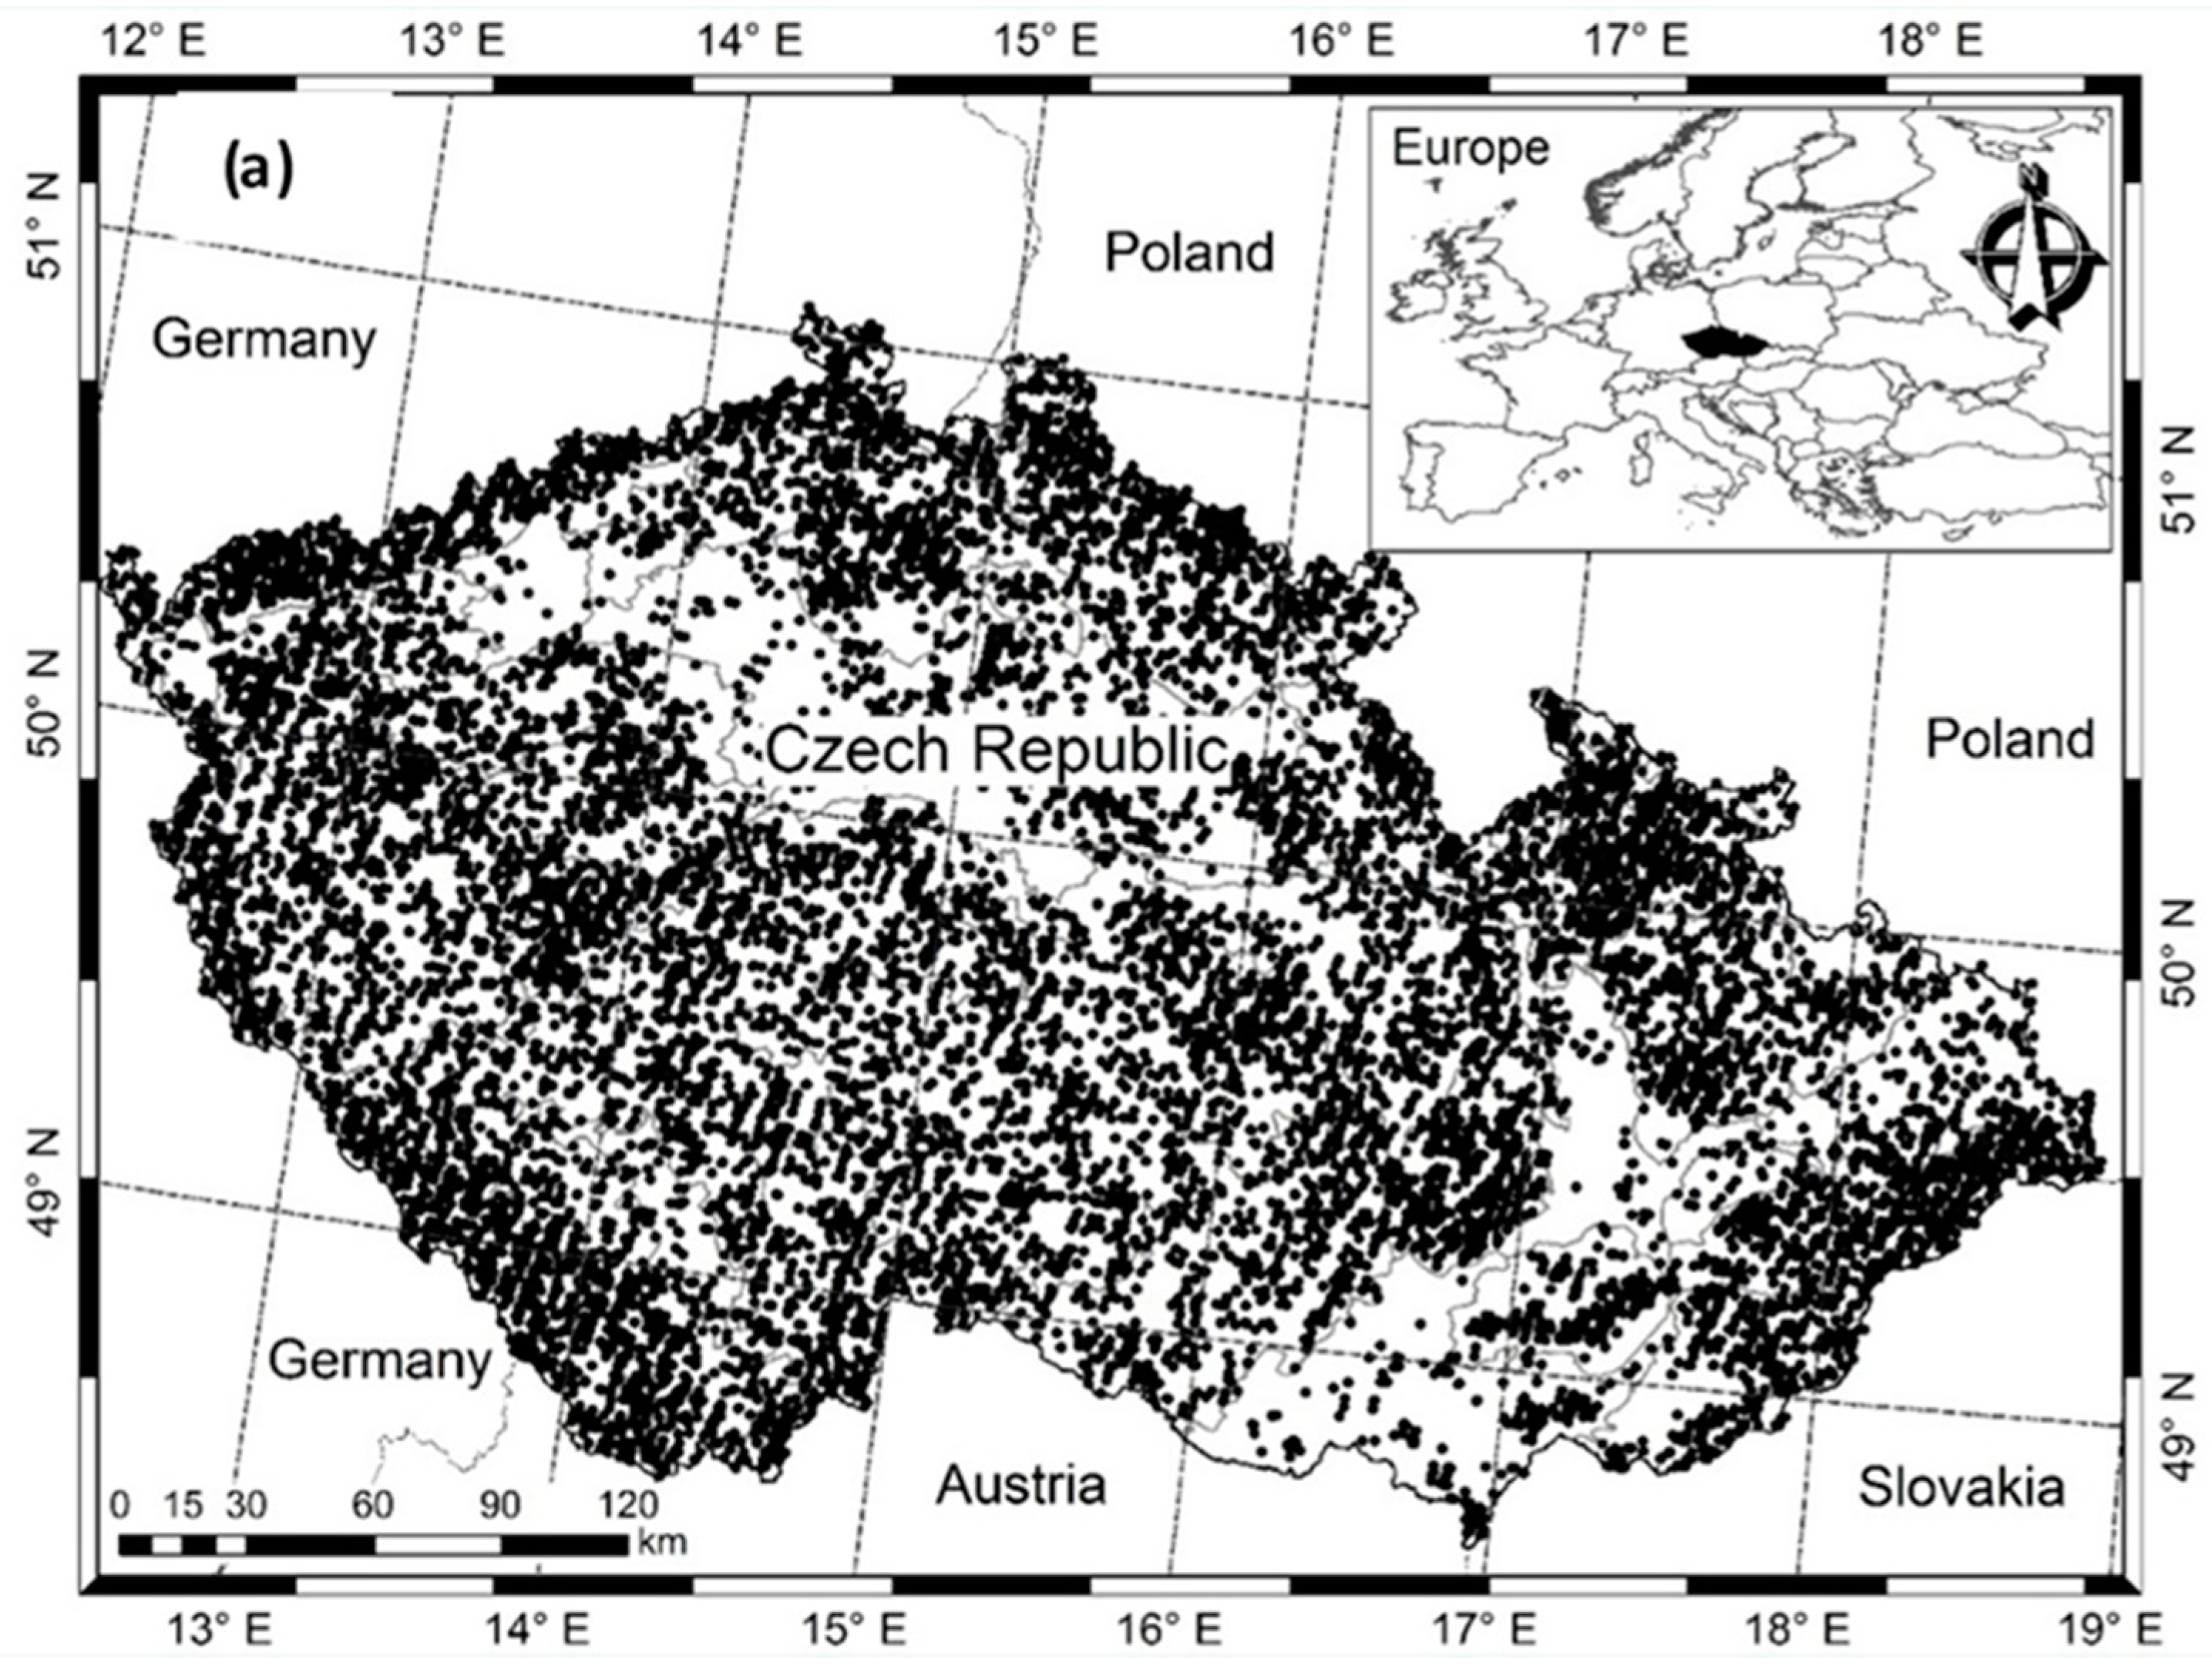
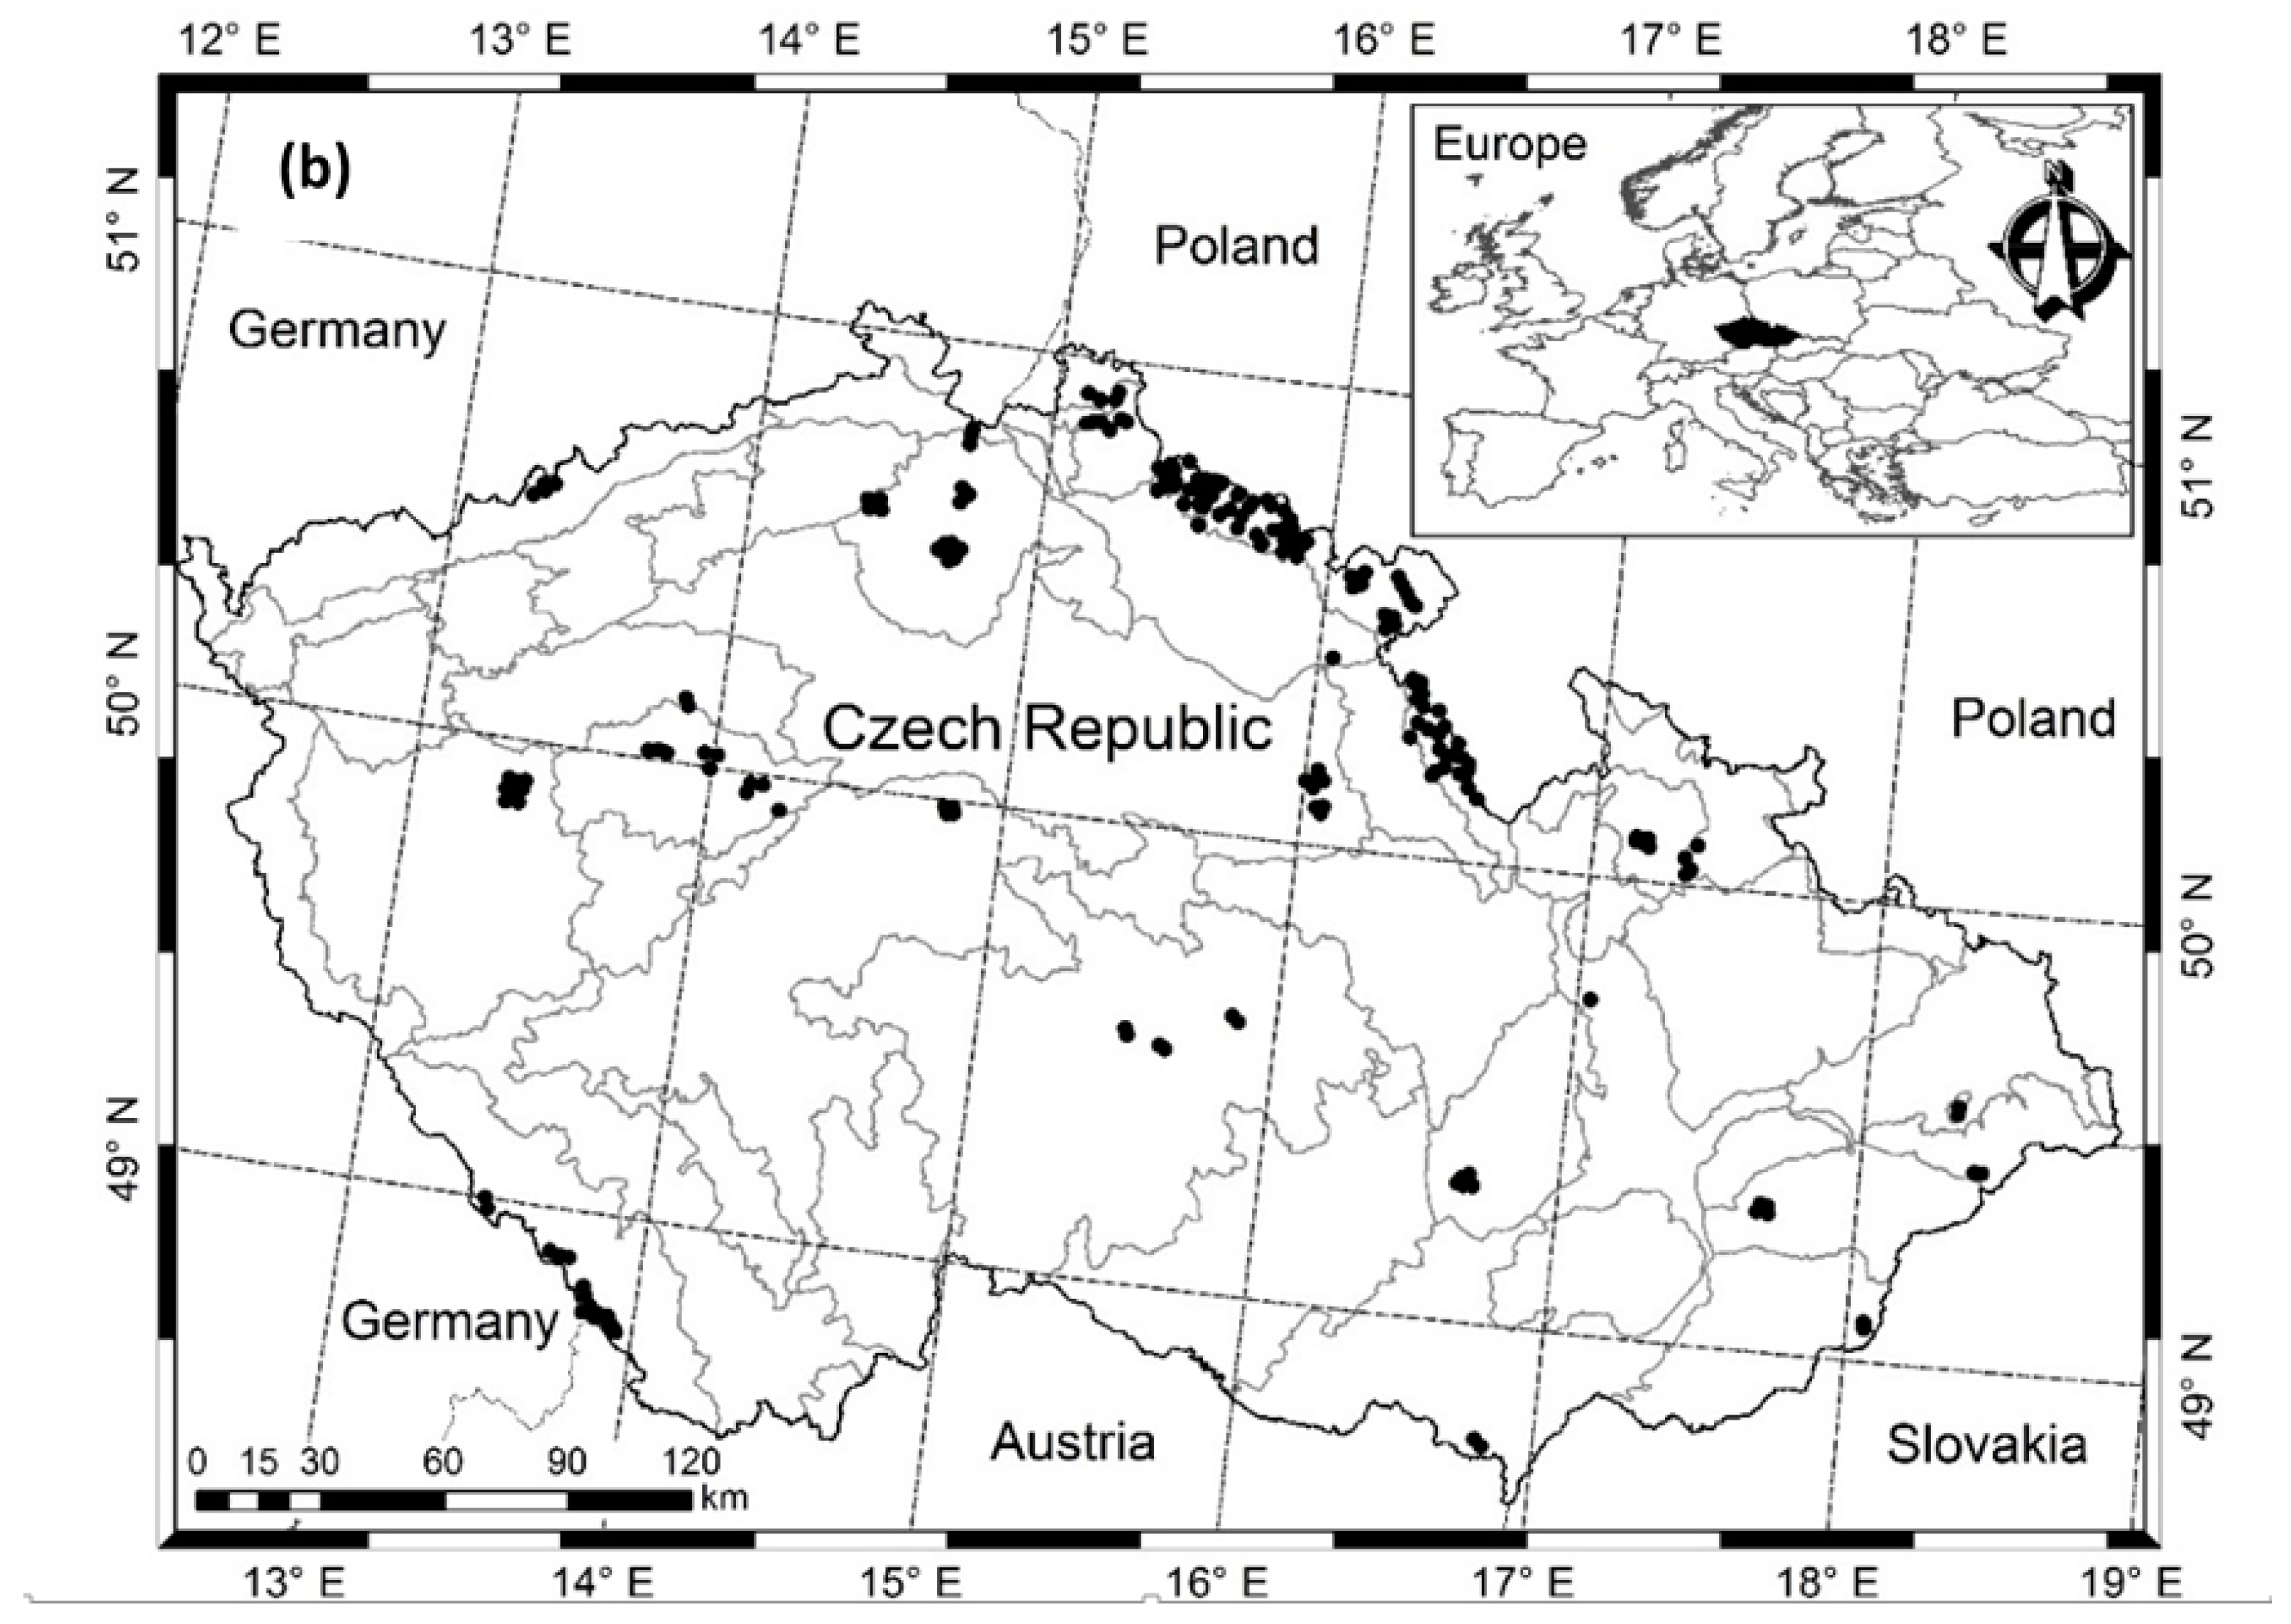
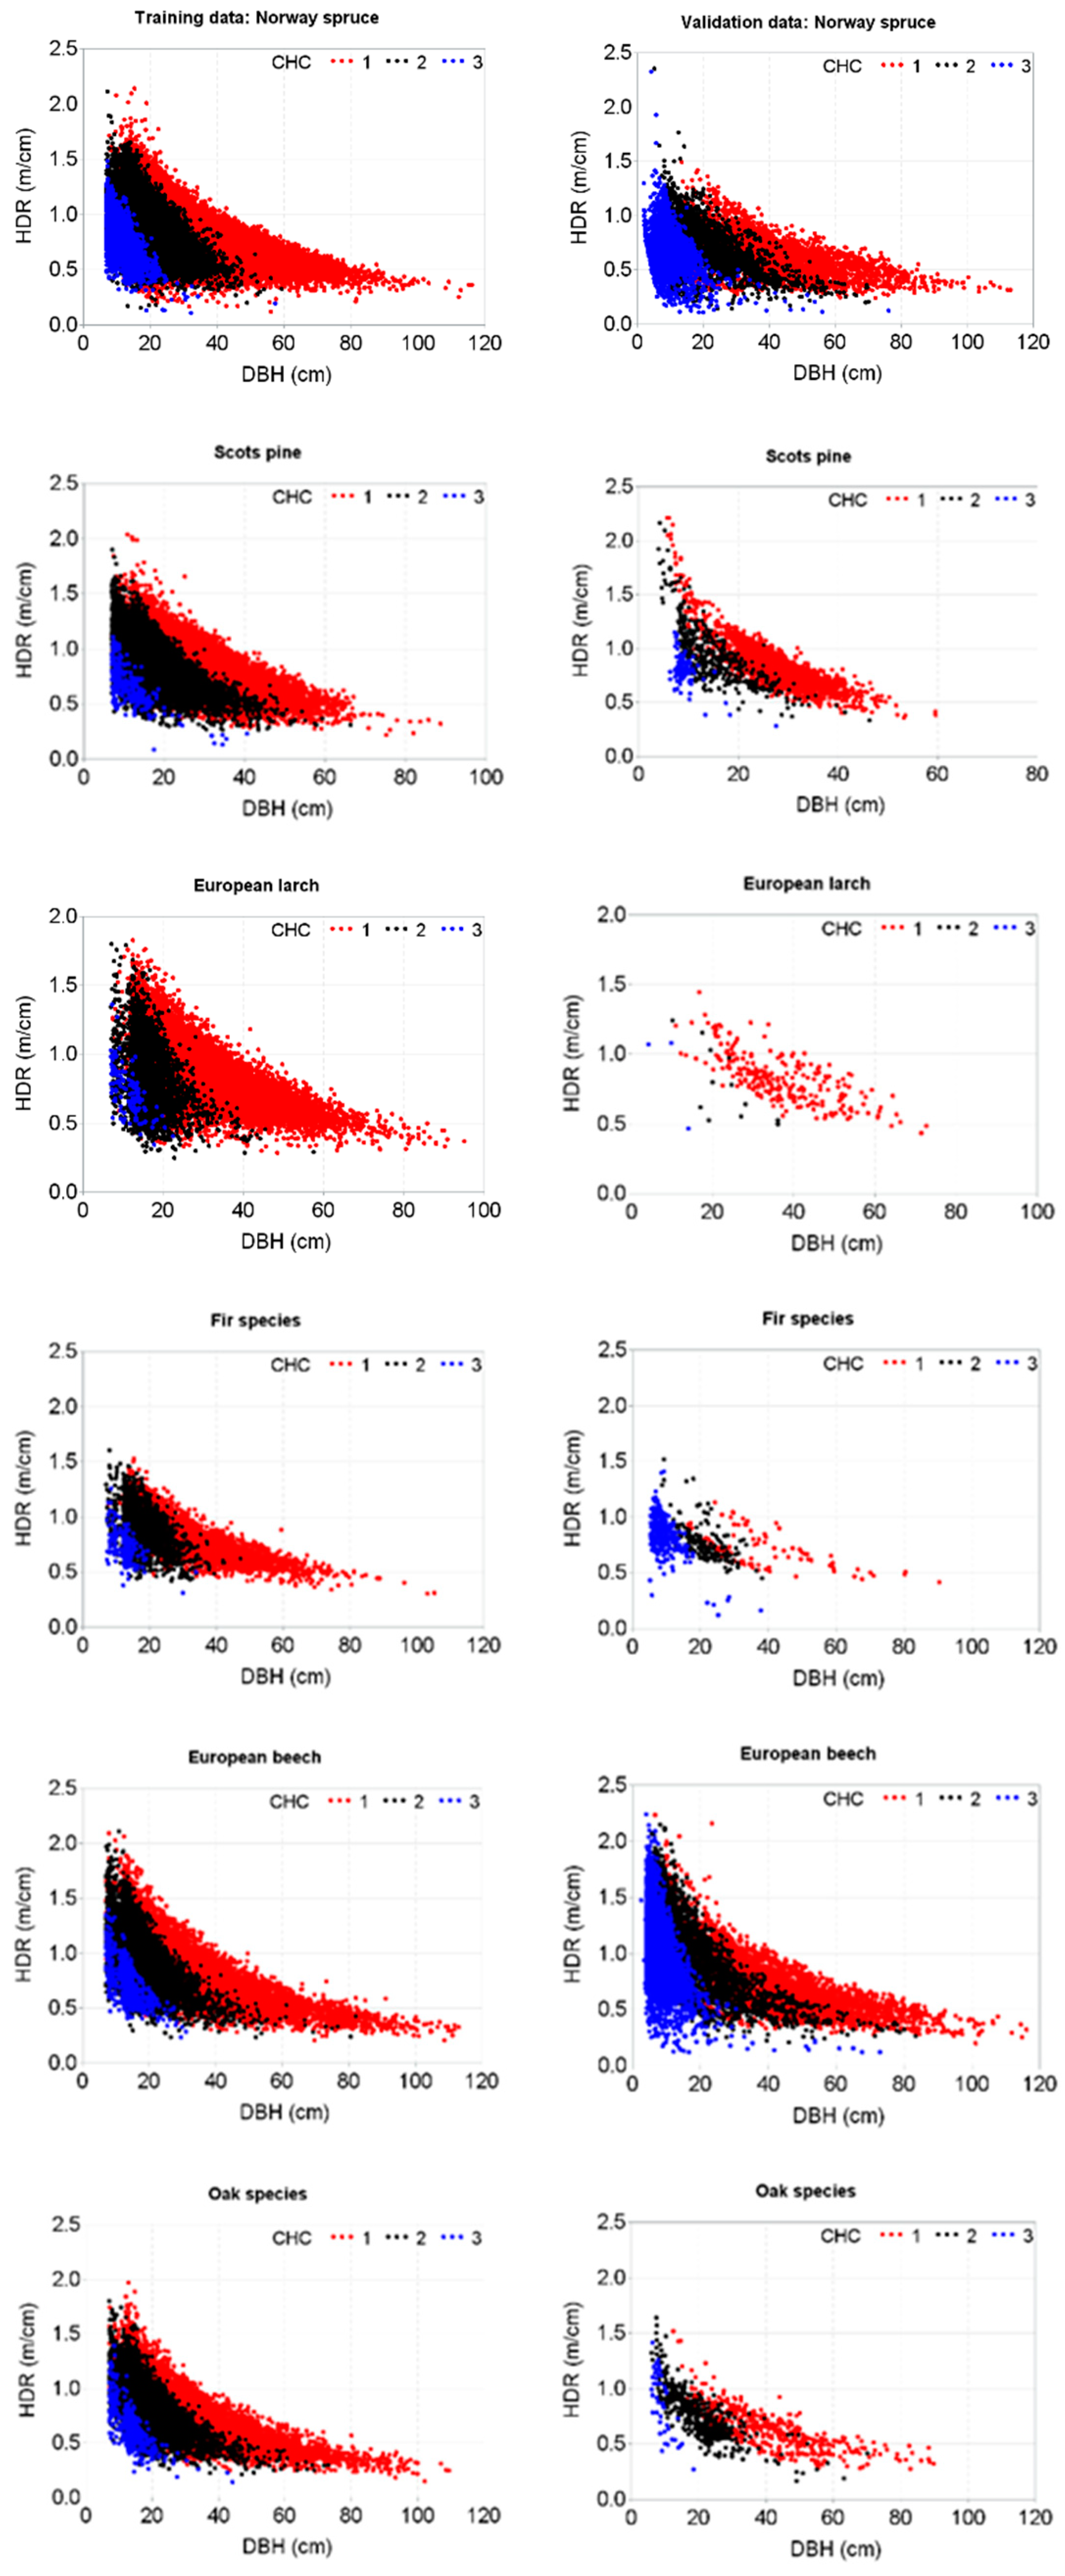
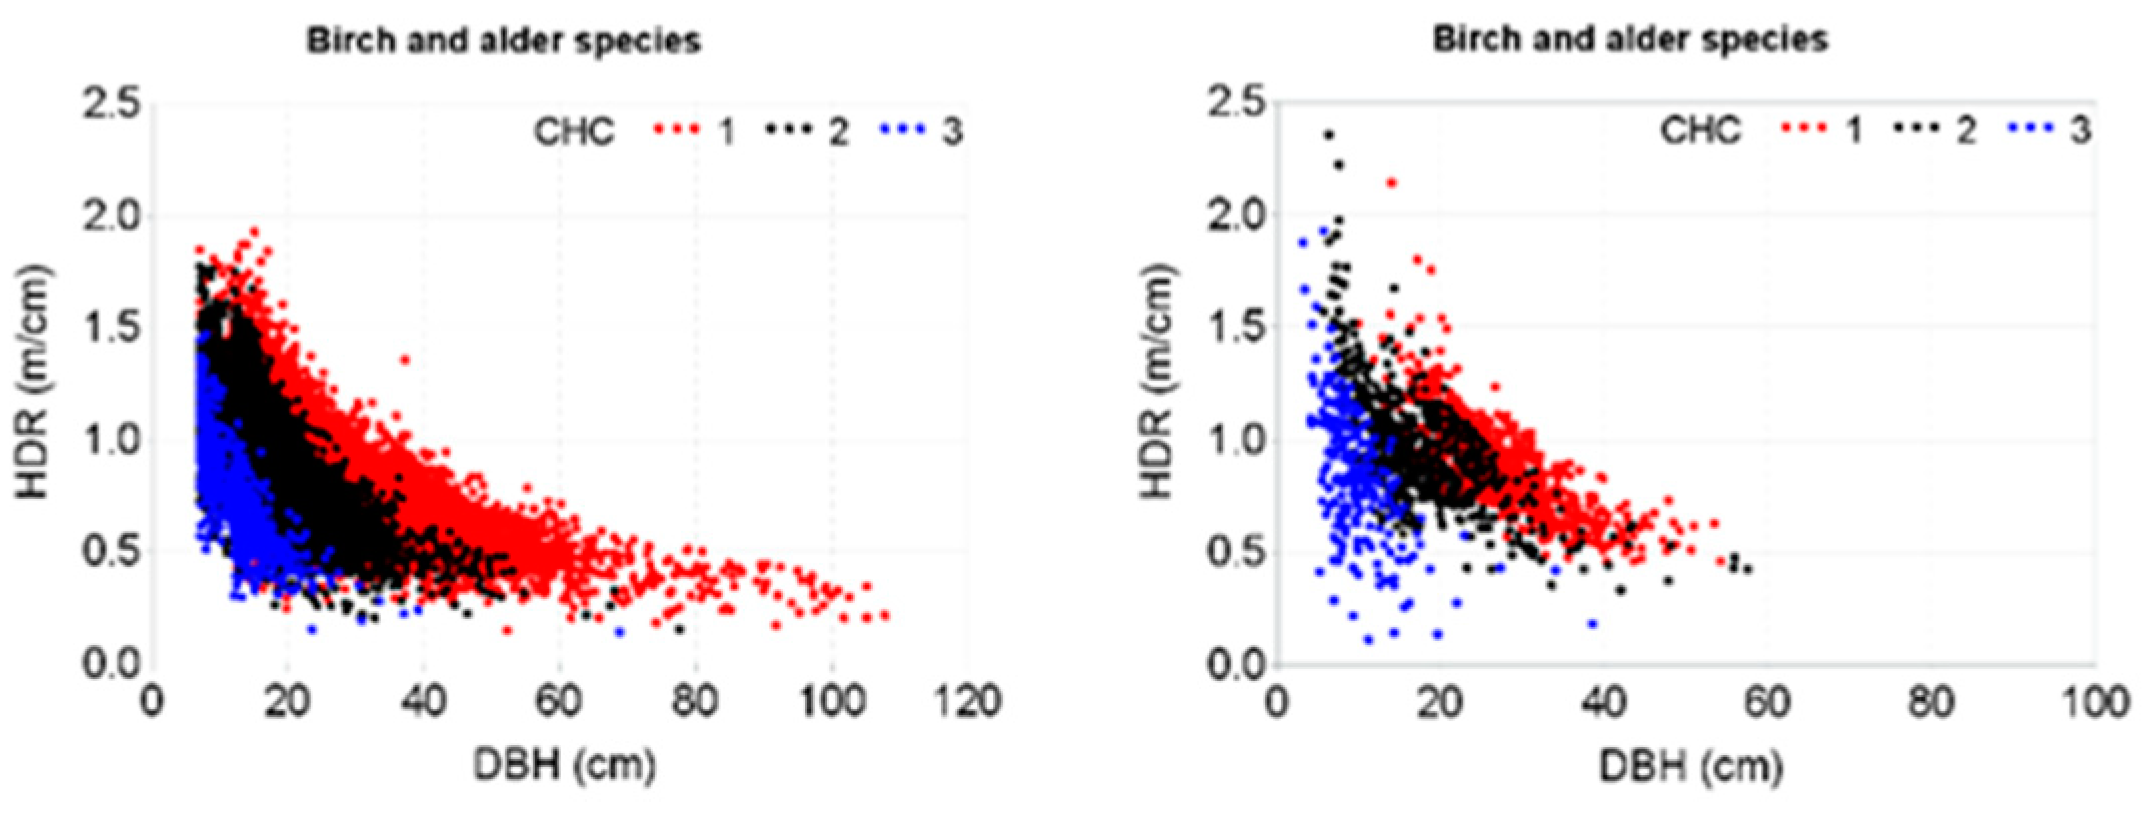
2.1. Data Materials

Our study is based on two large datasets: One originated from the Czech NFI program (model fitting dataset, hereafter termed as a training dataset) and another originated from permanent research sample plots (validation dataset). These datasets were largely different from each other in terms of sampling design and measurement method used, measurement accuracy, sample plot coverage in the tree population, and statistical characteristics. A brief description of each dataset is presented below.

2.2. Training Dataset

The Czech NFI program provided the training data, which were used to fit the model and were collected from sample plots distributed across the forested parts of the country (Figure 1a). The NFI sample plots were laid out following the protocols devised by Field-Map technology of the Institute of Forest Ecosystem Research (IFER) Monitoring and Mapping Solutions Ltd. [64]. Measurements were carried out for all trees with diameter at breast height (DBH, 1.3 m above-ground) ≥7 cm on each sample plot. We used measurements from two inventory cycles, i.e., the first measurement was done between 2001 and 2004 and the second measurement between 2011 and 2015. All measurements in both inventory cycles comprise of 13,875 sample plots and 348,980 trees, representing a large variability in site quality, stand development stage, stand density, species mixture, stand structure, silvicultural tending and other management interventions, and natural disturbances. Tree- and stand-level variables were measured by considering the inventory protocols of the Forest Management Institute [65]. Details of sampling design, NFI sample plot establishment and measurement methods are found in the literature [59,66,67,68]. The training dataset comprised of 30% monospecific sample plots and 70% mixed species plots. The definition of the monospecific sample plots considered the inclusion of all individuals other than a species of interest if they had over-bark DBH <4 cm [43]. In terms of species composition, coniferous tree species predominate with a share of 58.9% (Norway spruce 44.1%) and broadleaved tree species occupy a share of 41.1% (European beech 10.3%) [59]. The number of trees by species in this dataset is given in Table S1.

2.3. Validation Dataset

This dataset was obtained from the measurements of 220 research sample plots. These plots, hereafter, are termed as sample plots. Sample plots are square or rectangle, and size varies from 2500 m2 to 4900 m2. Sample plots are laid out in different parts of the Czech Republic (Figure 1b). Several stand characteristics (stand structure, natural regeneration, dead wood stock, and stand development stage and site quality) were considered as main criteria while laying out sample plots. Sample plot locations vary from 240 m to 1,370 m a.s.l., where mean climate characteristics (i.e., annual temperature (4–9.5° C), mean annual precipitation (500–1450 mm), and growing season length (45–180 days) also largely vary. In-depth descriptions of this dataset are also available in the literature [43,54,59,69,70,71,72,73,74]. This dataset comprises 24% monospecific sample plots and 76% mixed species sample plots. The definition of the monospecific sample plots considered the inclusion of all individuals other than a species of interest if they had over-bark DBH <4 cm [43]. Measurements were carried out between April 2007 and March 2016. However, no repeated measurement was involved, meaning that there was no temporal variation in this dataset. Total height and DBH were measured with precisions of 0.1 m and 1 mm, respectively. The number of trees by species in the validation data is given in Table S2. Graphs of HDR plotted against DBH in both training and validation datasets are presented in Figure 2.

2.4. Data Analysis

2.4.1. Deriving Stand-Level Variables

We derived several stand-level variables, which describe site quality and stand development stage, stand density and competition, and inter-tree spacing, and they were assessed for their contributions to the HDR variations. We then selected easily accessible variables that contributed significantly to the HDR model. Even though site quality is precisely described by site index, we could not use this as our data lacked this information. Instead, we included dominant height (HDOM) into the HDR model. We identified dominant trees and computed dominant height for each sample plot by applying the same methods as in Sharma et al. [63]. The HDOM has been frequently used to describe the combined effect of site quality and stand development stage in modelling various tree characteristics [43,51,52,54,55,58,70,71,75]. For mixed species sample plots, where the number of dominant trees of a particular species or group of species was inadequate according to the definition of dominant height (i.e., average of height of 250 largest trees per hectare), measured heights of the largest trees per sample plot regardless of tree species were used to calculate HDOM [59]. We also calculated the dominant diameter (DDOM) for each sample plot.
We evaluated the potential contributions of other stand-level measures to the HDR model such as stem per hectare (N, ha−1), stand basal area (BA, m2 ha−1), arithmetic mean DBH (AMD, cm), and quadratic mean DBH (QMD, cm) per sample plot. We also evaluated two tree-centered competition measures: DBH-to-QMD ratio (dq) and basal area of the trees larger in diameters than a subject tree (BAL, m2 ha−1) for their potential contributions to the HDR model. We evaluated the relative spacing index (RS), which is defined by RS = 10000 / N / HDOM [55,76,77] for its potential contribution to the HDR model. The RS is assumed as a more effective density measure than others, because it incorporates number of stems per hectare, site quality and stand development through HDOM. All measures were calculated using the dendrometric measurements of all trees regardless of species per sample plot. Summary statistics of important variables in both training and validation datasets are presented in Table 1. The number of HDR sample trees per sample plot in the validation dataset is higher compared to that in the training dataset, because of larger sample plot size (2500–4900 m2) in the former dataset compared to the latter plot size (500 m2). However, the number of stems per hectare in the training dataset is higher compared to that in the validation dataset. It is because that training dataset includes all age and DBH classes of the forest stands, whereas the majority of the validation data came from middle-aged and mature forest stands.

2.4.2. Model Construction

Considering the nonlinear pattern on the HDR plotted against DBH for each species or group of species (Figure 2), which is an exponential decrease of HDR with increasing DBH, we used a simple exponential decay function, hereafter termed as a base function (Equation (1)), to fit data. This base function was then expanded through the introduction of additional predictors that describe the effects of stand density, inter-tree spacing, competition, site quality and stand development stage, and sample plot-specific random variability.
HDR i j =   b 1 e x p ( b 2 DBH i j b 3   ) + ε i j
where HDRij and DBHij are the height-to-diameter ratio (m cm−1) and diameter at breast height of the jth tree (cm) on the ith sample plot, respectively; b3 = 0.5; b1 and b2 are the parameters to be estimated; and ε i j is an error term.
All stand-level measures and tree-centered competition measures (Table 1) were evaluated for their contributions to the HDR variations. The two-stage variable selection approach [78,79] was used to identify significantly contributing variables to the HDR model. This involved two steps: Firstly, the base function was fitted to the pooled sample-plot data from a particular species or group of species by sample plot for all sample plots. Secondly, the matrix-scattered graphs of the sample plot-specific parameter estimates (i.e., estimates of b1, b2) plotted against each variable and its transformation and interactions with other predictors were also examined, and those showing stronger correlations with b1 or b2 were identified. Because of its biological logic and interpretation, the two-stage approach has frequently been used for modelling tree characteristics [53,70,80,81]. Among various predictors evaluated using the two-stage approach, HDOM, DDOM, RS, and dq showed stronger relationships only with b1 of Equation (1). Following the principles of modelling categorical variables [62,82], we formed two dummy variables (CC1, CC2) to account for HDR variations caused by three canopy layers denoted by CHC, as below:
Canopy Height ClassCC1CC2
CHC100
CHC210
CHC301
The inventory crew did not record CHC information (i.e., suppressed, intermediate and dominant) in the inventory. However, we formed CHC on each sample plot in our data by assuming CHC1: height >66% height of the tallest tree (dominant canopy layer); CHC2: 33% height of the tallest tree < height < 66% height of the tallest tree (intermediate canopy layer); and CHC3: height <33% height of the tallest tree (suppressed canopy layer). This classification was possible due to measurements of total height of all trees regardless of species on each sample plot. This classification was also used in other studies [43,71].
For simplicity (i.e., easy fitting and efficient application of HDR model), only four individual species and three species group were considered (Table S1). We formed six dummy variables (TS1, TS2, TS3, TS4, TS5, TS6) for seven species to describe species-specific or group-specic HDR variaitons, as below:
Tree SpeciesTS1TS2TS3TS4TS5TS6
Norway spruce000000
Scots pine100000
European larch010000
Fir species001000
European beech000100
Oak species000010
Birch and alder speices000001
Four measurable variables (HDOM, DDOM, RS, dq) and eight dummy variables (CC1, CC2, TS1, TS2, TS3, TS4, TS5, TS6) were included into the base function (Equation (1)) through expression of b1 as a function of all these variables as in Equation (2). This expression was chosen as this provided the convergence with the smallest residual variations (smallest sum of squared errors) in fitting the model.
b 1 = f ( HDOM ,   DDOM ,   RS ,   dq ,   C C 1 ,   C C 2 ,   T S 1 ,   T S 2 ,   T S 3 ,   T S 4 ,   T S 5 ,   T S 6 )
where HDOM = dominant height (m); DDOM = dominant diameter (cm); RS = relative spacing index; dq = DBH-to-quadratic mean DBH ratio; and dummy variables are the same as defined above.
Our database contained hierarchical sampling units and, therefore, it was necessary to include variabilities among the sampling units. The mixed-effects HDR model was formulated using Equation (1) (with Equation (2) included) through introduction of a random component to describe the stochastic variabilities of HDR at the sample plot-level [48]. Among the three mixed-effects model alternatives formulated, convergence with a global minimum was achieved only with the random effect parameter (ui) added to b1. Details of the mixed-effects model formulation are found in the statistical textbooks [48,83]. We present only a final form of a nonlinear mixed-effects model (Equation (3)) that describes HDR variations with the smallest residual variations in our data.
HDR i j =   ( b 1 + u i ) e x p ( b 2 DBH i j b 3 ) + ε i j
with b 1 = α 1 C C 1 + α 2 C C 2 + α 3 HDOM i α 4 + α 5 DDOM i + α 6 RS i + α 7 dq i j + α 8 T S 1 + α 9 T S 2 + α 10 T S 3 +   α 11 T S 4 + α 12 T S 5 +   α 13 T S 6   , where CCk is a dummy variable (k = 1,2); TSk is dummy variable (k = 1, 2, …, 6); b3 = 0.5; b2 and αk (k = 1,2, …, 13) are parameters to be estimated; and ε i j is an error term; the other symbols and abbreviations are the same as in Equations (1) and (2). When CC belongs to k, then CCk = 1, and otherwise is 0; similarly, when TS belongs to k, then TSk = 1 and otherwise is 0 (see above two tables of dummy variable formation). When b3 in Equations (1) and (3) was tried to be estimated along with other parameters by optimization, the convergence with a global minimum was not achieved. We then compared the sum of squared errors (SSE) produced from the fitting with several alternative values of b3 (0.1 to 2 by 0.1 increment) iteratively, and b3 = 0.5 resulted in the smallest SSE. This is the reason that b3 = 0.5 was chosen in both Equations (1) and (3).
In Equation (3), the vectors of errors ( ε i j ) and sample plot-level random effects (ui) are defined by   ε i ~ N ( 0 ,   R ) and   u i ~ N ( 0 ,   D ) respectively. It was assumed that error vector   ε i would have a normal distribution with zero mean and within-plot variance–covariance matrix R i defined by:
R i = σ 2 G i 0.5 Γ i G i 0.5
where σ2 is a scaling factor and is equivalent to a residual variance of the estimated HDR model and common to all plots [50]. A matrix Γ i accounts for within-plot residual autocorrelations. However, we assumed this matrix as an identity matrix, as our data lacked significant autocorrelations. The matrix Gi is a diagonal matrix that accounted for a within-sample plot heteroscedasticity. The random effect vector ui was assumed to have a normal distribution with zero mean and plot variance–covariance matrix D defined by:
D = σ u i 2

2.4.3. Estimating Model Parameters and Evaluation

Parameters of the mixed-effects HDR model (Equation (3)) were estimated using the SAS macro NLINMIX version 9.4 [84] with the expansion-around-zero method [85] and restricted maximum likelihood method. This is a linearization method of Sheiner and Beal [86], which expands the likelihood function with a first-order Taylor series approximation. The fitting performance of the model was evaluated using root mean square error (RMSE), adjusted coefficient of determination (R2adj), and Akaike information criterion (AIC). The AIC is based on minimizing the Kull-back-Lieber distance and it imposes a penalty for the number of parameters in the model [87,88]. Formulae of all these statistical measures are found in the statistical textbooks [89]. The graphs of residuals, prediction errors and simulated HDR curves produced with fitted HDR model were also examined. Unless otherwise specified, we used 1% level of significance in our analyses. Realizing the fact that validation with an external independent dataset increases the credibility of the model, we tested our HDR model using validation data. Sample plot-specific HDR curves generated using the calibrated mixed-effects HDR model after adjustment of the random effects predicted with the empirical best linear unbiased prediction (EBLUP) theory [48] were examined for all sample plots in the validation data.

2.4.4. Calibrating Mixed-Effects Model and Predicting Sample Plot-Specific HDR

Predicting the response variable (HDR in our case) with the random effects estimated from its prior information is termed as calibration (localization) of the mixed-effects model [48,90]. Prediction of the random effect and its adjustment to the fixed part of the mixed-effects HDR model might be possible using prior information of HDR of any number of trees per sample plot. We calibrated the mixed-effects HDR model using the random effects predicted from one to four randomly selected trees depending on the available number of trees of a particular species or group of species per sample plot. This selection strategy was employed because many sample plots had less than four trees of a particular species or group of species in the validation data [59]. The EBLUP theory (Equation (6)) was applied to predict the random effect for each sample plot using the procedure of calculating matrices in the PROC IML in SAS version 9.4 [84].
u i = D Z i T ( Z i D Z i T + R i ) 1 ε i
where ui is a random effect vector that describes plot-level HDR variations for the ith plot. Equations (4) and (5) provide the elements of matrices R i and D respectively. Vector ε i of the prediction errors was derived from the mean model (only fixed part of the mixed-effects HDR model). The element (zij) of the designed matrix Zi for each tree and sample plot was determined from partial derivatives of a nonlinear mixed-effects model (Equation (3)) with respect to its fixed-effect parameter (b1) to which random effect (ui) has been added [48,53,58,91]. The following equation was obtained for this purpose.
z i j   ( b 1 ) = e x p ( b 2 DBH i j b 3 )
where abbreviations and parameters are the same as in Equation (1).

3. Results

The fixed-effect parameter estimates of all predictors including dummy variables are highly significant (Table 2). The estimated values and signs of all parameters are biologically plausible and interpretable. The model described most parts of the HDR variations (R2adj = 0.7863) in the training data without significant trends in the residuals.
A box plot of the residuals plotted against each of the potential predictors (Table 2) was examined for each canopy height class; however, for the brevity of space, only residuals plotted against DBH, height and estimated HDR are presented here (Figure 3). In each tree species or group of species, there was no significant trend in the residuals across the observed ranges of the predictors and fitted values of HDR. Only a few larger deviations could be seen for some extremely large or small trees. The variance heteroskedasticity was not observed in the residuals either. The Gaussian distribution patterns (bell-shaped patterns) of the residuals indicated the absence of skewness for each individual species or group of species.
The effects of measurable predictors on HDR were simulated using only fixed parts of the mixed-effects HDR model (i.e., ui = 0) (Figure 4, Figure 5, Figure 6 and Figure 7). The same scale in the y-axis for all these figures was used for better comparison of the effects of predictors on the HDR. A wide range of the observed data of two predictors HDOM and DDOM in each of the canopy height classes in the training data resulted in several HDR curves for each species or group of species (Figure 4 and Figure 5). However, a relatively narrower range of the observed data of two predictors RS and dq in the suppressed canopy heights (CHC = 3) produced fewer curves for some individual species or groups of species (Figure 6 and Figure 7). The combined effects of site quality and stand development stage described by HDOM emerged as the biggest effect, followed by the effect of tree crowding or competition described by DDOM and dq. For a given condition of stand density and inter-tree spacing, HDR increased with increasing site quality and stand development stage (increased HDOM), and increasing competition (decreased DDOM and dq) and increased RS). The magnitudes of the effects by each predictor on HDR for each canopy height class significantly differed.
Our mixed-effects HDR model was tested using the validation data acquired from research sample plots (Figure 1b). Overall, our calibrated mixed-effects HDR model described 94.4% of HDR variations (R2 = 0.9443; RMSE = 0.06745) and more than 85% of HDR variations for individual species or groups of species in this dataset, with a description of the largest part for European beech and the smallest part for fir species (Table 3). The mixed-effects HDR model was calibrated with the random effect predicted from measured HDR of one to four randomly selected trees of a particular species or group of species depending on the availability of their numbers on each sample plot. The model test confirmed that a single HDR model developed with the pooled dataset from several species in the NFI sample plots was precise enough for predicting the HDR of the corresponding tree species in the research sample plot data. Graphs of the prediction errors of the calibrated mixed-effects HDR model for each species or group of species showed a promising appearance, i.e., absence of significant trends in the prediction errors for each species and group of species (Figure 8). The prediction errors were found falling within the ±0.25 range for almost all sample plots, indicating that the calibrated mixed-effects HDR model was precise for the validation data.
The simulated curves of the calibrated mixed-effects HDR model for all sample plots in the validation data were examined (Figure 9). Except for some sample plots where outlier measurements existed, curves generated with the calibrated mixed-effects HDR model showed complete covering of the measured data for each species or group of species. For mixed species sample plots, curves were clearly differentiated and each curve was found to be passing through the middle of the data points.

4. Discussion

With four covariate predictors (HDOM, DDOM, RS, and dq) and one sample plot-specific random effect parameter included into the HDR model, the fitting improvement achieved was the highest relative to that of the HDR model fitted with DBH as a single predictor. The model describes most of the HDR variations without systematic residual trends (Table 2, Figure 3). The absence of residual trends across the observed range of the predictors for each species or group of species suggests that the chosen base function and covariate predictors and the assumed canopy height classes were all adequate. Fitting improvement could be marginally increased through the inclusion of additional predictors. However, the inclusion of several predictors not only impedes convergence, but also results in biased estimation due to over-parameterization [89]. Introducing several predictors into the model increases inventory cost and reduces the model use efficiency [92,93].
Site quality and stand development stage are important characteristics of a stand and, therefore, forest managers need to assess the stand characteristics (e.g., HDOM) that describe them in relationship with HDR. Thus, including HDOM into the HDR model that describes the combined effect of site quality and development stage would be an appealing approach. For a given stand density, the effects of site quality and stand development stage on the HDR model for each species and group of species emerged the highest, but substantially varied with canopy layers (Figure 4). The stand dynamics and individual tree characteristics are tightly linked to HDOM and yield-capacity of the stands [94]. This is the reason that HDOM is commonly used as a predictor in different forest models such as height-diameter models [58,91,95,96,97], crown models [52,55,70,75,98,99], HDR models [43], height to crown base models [51,54], crown-to-bole diameter ratio models [71], and crown height increment model [94]. Unlike the site index, HDOM cannot be considered as an effective measure of site quality, because the same HDOM may be resulted in by younger stands on better sites and older stands on poorer sites. However, in the absence of site index information, HDOM may be used to explain the combined effects of site quality and stand development stage in various forest models.
The other three covariate predictors related to stand density and competition (DDOM, RS and dq) significantly contributed to the fitting improvement of the HDR model; however, each of their contributions is less than that of HDOM (Figure 4, Figure 5, Figure 6 and Figure 7). For a given site quality, HDR increases with increasing competition as depicted by decreased DDOM and dq (Figure 5 and Figure 7) and increased RS (Figure 6). The negative signs of the parameter estimate of DDOM and dq suggest that HDR increases with decreasing DDOM and dq. This is due to the influence of tree crowding that results in taller height, smaller crown and thinner bole. A tree growing in a very dense stand under the effect of mutual support of its neighbors would have extremely large HDR [2,3,4]. Denser stands not only make the trees become taller, but also become thinner. Diameter growth is more sensitive to the effect of competition than that of the height growth. The studies carried out in different stand densities show that height growth is almost stable within a broad range of tree crowding, whereas growth of the bole diameter and crown size of a subject tree are sensitive to the competitive impact of their neighbors [100].
The RS is also related to stand density and depicts a significant contribution to the HDR variations, but less than that of other predictors. The positive sign of the parameter estimates of RS (Table 2) indicate that HDR increases with increasing RS (Figure 6), which is biologically logical and interpretable. For a given site quality and development stage of a stand, RS increases with decreasing stem number per hectare and consequently HDR increases, because trees attain a higher rate of height growth than that of DBH under the normal stand density level. However, this trend might not exist in very sparse stands or trees grown in extremely open stands, because trees have attained a higher diameter growth rate relative to that of the height growth to increase their strength against windstorm and ice load. Compared to the suppressed trees, trees with dominant canopy positions can allocate more resources to diameter growth relative to height growth, which may result in smaller HDR and are more stable against the external forces. The inter-tree spacing determines crown shape, crown size, height-to-crown base, and increments of height and diameter attained by trees [55,60,77,101]. The RS incorporates the number of stems per hectare, site quality and stand development stage through HDOM, and, therefore, this can be a very effective measure of stand density [55,77,102].
The prediction is done without calibration of the mixed-effects model; however, prediction accuracy can be very low [51,53,58,91,103]. Therefore, the calibrated mixed-effects model is always recommended for more accurate prediction of a response variable (HDR in our case). However, prediction accuracy of the calibrated mixed-effects HDR model may not always be high, as this depends on the application conditions of the stands, such as vertical structure, number of sample trees selected, and the range of HDR values used to calibrate the mixed-effects HDR model. For stands with homogenous canopies, the measured HDR of a single tree per sample plot may provide a precise result [104], but more trees are needed for the stands with heterogeneous canopies [53,54,58,105,106]. A localization with the smallest sample size, i.e., one tree can be most efficient for application of the mixed-effects model [96]. The mixed-effects HDR model calibrated using HDR measurements of one to four randomly selected trees of a particular species or group of species depending on the availability of their numbers per sample plot resulted in a promising prediction accuracy (Table 3, Figure 8). However, some large prediction error can be seen in this figure, which might be caused by extreme HDR observations in the stands that have heterogeneous vertical structures. The prediction accuracy for such sample plots might be increased with increasing number of trees per sample plot for calibration. However, using many sample trees in calibrating the mixed-effects model leads to a higher inventory cost with a little gain of accuracy. Using one to four trees per sample plot may compromise between sampling cost, model use efficiency, and prediction accuracy [59]. Sample plot-specific HDR curves generated with the calibrated mixed-effects HDR model for each species or group of species show complete coverages of the measured HDR values in the validation data (Figure 9), indicating that our model is precise enough for the tree species recorded in the research sample plot inventory. The reason HDR is not covered by the model curves for some sample plots is due to the presence of extremely small or large heights, which is obvious in the stands that have heterogeneous vertical structures.
As mentioned in the introduction section, HDR has various forest management implications. The HDR can be used for designing density management diagrams. The vulnerability condition of trees and stands to the external forces (wind, snow and icing) may be assessed using HDR. The HDR is significantly correlated to the crown ratio (CR) (Figure 10), and this relationship might be used for their removal if any unfavorable properties are detected in the relationship [1,20,28]. For example, trees with small CR and large HDR may be removed, as these trees may be less productive. Similarly, trees with large CR and large HDR need to be removed, as these trees may be more prone to snow-, icing-, and wind-related damages. This may be true that trees with a combination of both small CR and large HDR or large CR and large HDR might be susceptible to icing and windstorm. However, it would be difficult to predict this combination without a joint modelling of HDR and CR. Due to a lack of CR information in the training data, we were unable to include CR into the HDR model.
Based on the results presented in the article, forest managers may develop the guidelines for minimizing the devastating effects of ice- and wind-related damages of forest stands, especially conifer stands. With better understanding of the susceptibility to the potential damages, forest managers may design silvicultural treatments based on a certain range of HDR [43,107]. A stand stability strategy can be developed through manipulation of factors affecting HDR. Keeping the HDR of all trees in any forest stand under a certain threshold, for example, below 1.0 (young spruce stands), may reduce the overall vulnerability to the devastating ice- and wind-related damages, as trees with a smaller HDR than this threshold could have higher stability. The HDR information (HDR model) may allow forest managers to identify practical stand structural targets and design thinning strategies accordingly. The HDR model may be used to assess the quality and efficiency of thinning as HDR is significantly affected by thinning and other selection felling. The HDR is used as an effective predictor into various forest models to describe competition effects [24,25,26,108]. The HDR differs from other competition indices in that HDR is a direct measure of competition whereas others are indirect measures [20]. The HDR is significantly affected by several factors such as stand dynamics, natural disturbances and silvicultural tending, and, therefore, knowledge of HDR is essential for better understanding of forest ecological processes. The frequency of icing and wind disturbances in the European countries has recently increased, intensifying the need to advisee forest practitioners on how to manage their forests, especially conifer forests, to minimize such consequences. The HDR is one, but not only one, of the possible indicators that can be used to assess the potential risk of a forest stand to snow-, ice- and wind-related damages. In this context, in-depth analyses of HDR using large datasets that include the interactive effects of the several factors affecting HDR could be timely and appealing. The HDR model can be included as a sub-model into the individual tree or stand simulators, which are very useful tools for decision making in forestry. The forest risk model, which includes all kinds of potential risks caused by factors of climate, anthropogenic and natural disturbances, and tree and stand dynamics, can be applied to evaluate the overall risk on the stability of forest stands. Thus, predicting HDR with our model may be one of the intermediate steps for developing stand stability strategies and increasing the productivity of forest stands. Our HDR model not only predicts HDR, but factors that modify HDR are of paramount interest in the overall assessment of site productivity, preparing thinning strategies, and density management diagrams. The HDR model may be used as a benchmark model for comparing HDR derived from diameter and height increment models and height–diameter models.
Manipulation of the factors affecting HDR may be possible to reduce the vulnerability of stands to the devastating ice- and wind-related damages. With the help of results presented in this article (Table 2, Figure 4, Figure 5, Figure 6, Figure 7 and Figure 9), one can modify the HDR of a stand. For example, as magnitudes of the parameter estimates of HDOM and dq seem to be much more influential on HDR, forest managers need to focus more on the modification of HDOM and dq. For a given stand density condition, maintaining very high and low HDOM on the younger stands may result in a large HDR, which may not be favorable for these stands to be more stable. On the stands with very high site quality (e.g., high HDOM), forest managers may reduce the stand density (by increasing dq and DDOM) so that the HDR of individual trees can decrease through thickening of their boles relative to height growth. When a strong wind approaches the stands with very high HDOM, it may destroy the top canopy trees while most of the suppressed trees usually manage to survive, and this is the season that the selection-type forest management is considered to be more ecologically stable. Understanding the links between risk assessment and forest management can be important in the context of climate change, whereby snow-, ice- and wind-related damages are common in the European forests. Only HDR prediction may be less important for forest managers, but what is really important for them is how they can manage their forests through modification of factors affecting HDR. Thus, in-depth exploration of the factors affecting HDR, which our study has done, would certainly be appealing. However, the information of many more factors rather than those analyzed in our study is also necessary for making the effective stand stability plans, as HDR is not the only indicator that perfectly gauges the vulnerability of a stand to icing and windstorm damages. The HDR model presented in this article is static one, which was evolved from a static relationship associating HDR with other variables. The dynamic HDR models (i.e., ΔHDR/Δt) can be more important than the static ones as HDR changes over time are included in the dynamic models. However, developing a dynamic HDR model needs longer-time series data. When these data are available, we will develop dynamic HDR models in the future.

5. Conclusions

This article presents a nonlinear mixed-effects HDR model applicable for several tree species that was developed using a large Czech NFI dataset through integration of covariate predictors describing the effects of inter-tree spacing and competition, site quality and stand development stage, canopy height differentiation and social position of individual trees, and an unstructured random component describing sample plot-level random variations. The model was tested using a large independent dataset acquired from research sample plots. The model described most of the HDR variations in the training data without significant residual trends. The model test also confirmed its high precision. The HDR can be predicted with reasonable accuracy by a properly calibrated mixed-effects model using measurements of DBH and other predictors that can be easily derived from the routine forest inventories. For higher prediction precision, the mixed-effects HDR model should be calibrated using HDR measurements of one to four randomly selected trees of a particular species or group of species depending on the availability of their numbers per sample plot.
The main uses of the HDR model can be for tree and stand stability assessments and regulation of stand density. The model presented in this article can be used for the formulation and implementation of silvicultural strategies for the species of interest. Silviculture strategies leading to increased stability have become increasingly important in terms of advancing global changes. Silviculture can play an important role in mitigating the climate change effects on the growth and stability of the forest stands, adapting the strategies that would increase the structural diversity of forests. Many other implications of HDR are also presented in the introduction and discussion sections of this article.

Supplementary Materials

The following are available online at https://www.mdpi.com/1999-4907/10/1/70/s1, Table S1: Species and numbers of trees on the Czech NFI sample plots used in this study (training data), Table S2: Species and numbers of trees on the permanent research sample plots used in this study (validation data).

Author Contributions

R.P.S. conceptualized and designed the study, performed data analysis and modelling, wrote the manuscript and revised it; Z.V. contributed to data description and manuscript improvement, produced study area map, and contributed to revision of the manuscript. S.V. provided validation data and contributed to the manuscript improvement. M.K. provided training data and contributed to the manuscript improvement.

Funding

This research was funded by EXTEMIT-k project (No. CZ.02.1.01/0.0/0.0/15_003/0000433), IGA project (B03/18), and EVA4.0 project (No. CZ.02.1.01/0.0/0.0/16_019/0000803), which operate in the Faculty of Forestry and Wood Sciences of Czech University of Life Sciences in Prague.

Acknowledgments

We are grateful to an academic editor and two anonymous reviewers for their insightful comments and suggestions that greatly helped improve our article. We are also thankful to the Forest Management Institute of the Czech Republic for allowing us to utilize a national forest inventory database.

Conflicts of Interest

The authors declare no conflict of interest. The funders had no role in the design of the study; in the data collection, analyses, or interpretation of data; in the writing of the manuscript, and in the decision to publish the results.

References

  1. Wonn, H.T.; O’Hara, K.L. Height: Diameter ratios and stability relationships for four northern rocky mountain tree species. West. J. Appl. For. 2001, 16, 87–94. [Google Scholar]
  2. Vospernik, S.; Monserud, R.A.; Sterba, H. Do individual-tree growth models correctly represent height:diameter ratios of Norway spruce and Scots pine? For. Ecol. Manag. 2010, 260, 1735–1753. [Google Scholar] [CrossRef] [Green Version]
  3. Valinger, E.; Fridman, J. Modelling probability of snow and wind damage in Scots pine stands using tree characteristics. For. Ecol. Manag. 1997, 97, 215–222. [Google Scholar] [CrossRef]
  4. Valinger, E.; Fridman, J. Factors affecting the probability of windthrow at stand level as a result of Gudrun winter storm in southern Sweden. For. Ecol. Manag. 2011, 262, 398–403. [Google Scholar] [CrossRef]
  5. Cremer, K.W.; Borough, C.J.; McKinnell, F.H.; Carter, P.R. Effects of stocking and thinning on wind damage in plantation. N. Z. J. For. Sci. 1982, 12, 244–268. [Google Scholar]
  6. Castedo-Dorado, F.; Crecente-Campo, F.; Álvarez-Álvarez, P.; Barrio-Anta, M. Development of a stand density management diagram for radiata pine stands including assessment of stand stability. Forestry 2009, 82, 1–16. [Google Scholar] [CrossRef] [Green Version]
  7. Wallentin, C.; Nilsson, U. Storm and snow damage in a Norway spruce thinning experiment in southern Sweden. Forestry 2014, 87, 229–238. [Google Scholar] [CrossRef]
  8. Jiao-jun, Z.; Feng-qin, L.; Yutaka, G.; Matsuzaki, T.; Yamamoto, M. Effects of thinning on wind damage in Pinus thunbergii plantation. J. For. Res. 2003, 14, 1–8. [Google Scholar] [CrossRef]
  9. Nykänen, M.L.; Peltola, H.; Quine, C.; Kellomäki, S.; Broadgate, M. Factors affecting snow damage of trees with reference to European conditions. Silva Fenn. 1997, 31, 193–213. [Google Scholar] [CrossRef]
  10. Schütz, J.-P.; Götz, M.; Schmid, W.; Mandallaz, D. Vulnerability of spruce (Picea abies) and beech (Fagus sylvatica) forest stands to storms and consequences for silviculture. Eur. J. For. Res. 2006, 125, 291–302. [Google Scholar] [CrossRef]
  11. Urata, T.; Shibuya, M.; Koizumi, A.; Torita, H.; Cha, J. Both stem and crown mass affect tree resistance to uprooting. J. For. Res. 2011, 17, 65–71. [Google Scholar] [CrossRef]
  12. Schmidt, M.; Hanewinkel, M.; Kändler, G.; Kublin, E.; Kohnle, U. An inventory-based approach for modeling single-tree storm damage—An experience with the winter storm of 1999 in southwestern Germany. Can. J. For. Res. 2010, 40, 1636–1652. [Google Scholar] [CrossRef]
  13. Albrecht, A.; Hanewinkel, M.; Bauhus, J.; Kohnle, U. How does silviculture affect storm damage in forests of south-western Germany? Results from empirical modeling based on long-term observations. Eur. J. For. Res. 2012, 131, 229–247. [Google Scholar] [CrossRef]
  14. Bošeľa, M.; Konôpka, B.; Šebeň, V.; Vladovič, J.; Tobin, B. Modelling height to diameter ratio—An opportunity to increase Norway spruce stand stability in the Western Carpathians. Lesnicky Casopis For. J. 2014, 60, 71–80. [Google Scholar] [CrossRef]
  15. Moore, J.R. Differences in maximum resistive bending moments of Pinus radiata trees grown on a range of soil types. For. Ecol. Manag. 2000, 135, 63–71. [Google Scholar] [CrossRef]
  16. Peltola, H.; Kellomäki, S.; Hassinen, A.; Granander, M. Mechanical stability of Scots pine, Norway spruce and birch: An analysis of tree-pulling experiments in Finland. For. Ecol. Manag. 2000, 135, 143–153. [Google Scholar] [CrossRef]
  17. Peltola, H.; Kellomäki, S.; Väisänen, H.; Ikonen, V.P. A mechanistic model for assessing the risk of wind and snow damage to single trees and stands of Scots pine, Norway spruce, and birch. Can. J. For. Res. 1999, 29, 647–661. [Google Scholar] [CrossRef]
  18. Peltola, H.M. Mechanical stability of trees under static loads. Am. J. Bot. 2006, 93, 1501–1511. [Google Scholar] [CrossRef] [Green Version]
  19. Opio, C.; Jacob, N.; Coopersmith, D. Height to diameter ratio as a competition index for young conifer plantations in northern British Columbia, Canada. For. Ecol. Manag. 2000, 137, 245–252. [Google Scholar] [CrossRef]
  20. Opio, C.; van Diest, K.; Jacob, N. Intra-seasonal changes in height to diameter ratios for lodgepole pine in the central interior of British Columbia. West. J. Appl. For. 2003, 18, 52–59. [Google Scholar]
  21. Yang, Y.; Huang, S. Effects of competition and climate variables on modelling height to live crown for three boreal tree species in Alberta, Canada. Eur. J. For. Res. 2018, 137, 153–167. [Google Scholar] [CrossRef]
  22. MacDonald, B.; Morris, D.M.; Marshall, P.L. Assessing components of competition indices for young boreal plantations. Can. J. For. Res. 1990, 20, 1060–1068. [Google Scholar] [CrossRef]
  23. Morris, D.M.; MacDonald, G.B. Development of a competition index for young conifer plantations established on boreal mixed wood sites. For. Chron. 1991, 67, 403–410. [Google Scholar] [CrossRef]
  24. Temesgen, H.; LeMay, V.; Mitchell, S.J. Tree crown ratio models for multi-species and multi-layered stands of southeastern British Columbia. For. Chron. 2005, 81, 133–141. [Google Scholar] [CrossRef] [Green Version]
  25. Hasenauer, H.; Monserud, R.A. A crown ratio model for Austrian forests. For. Ecol. Manag. 1996, 84, 49–60. [Google Scholar] [CrossRef]
  26. Wykoff, W.R.; Crookston, N.L.; Stage, A.R. User’s Guide to the Stand Prognosis Model; Gen. Tech. Rep. INT-133; USDA, Forest Service, Intermountain Forest and Range Experiment Station: Ogden, UT, USA, 1982; p. 112.
  27. Mustard, J.; Harper, G. A Summary of the Available Information on Height to Diameter Ratio; BC Ministry of Forests: Victoria, BC, Canada, 1998; p. 120.
  28. Nilsson, U. Competition in Young Stands of Norway Spruce and Scots Pine. Ph.D. Thesis, Swedish University of Agricultural Sciences, Uppsala, Sweden, 1993; p. 173. [Google Scholar]
  29. Hasenauer, H.; Monserud, R.A.; Gregoire, T.G. Using simultaneous regression techniques with individual-tree growth models. For. Sci. 1998, 44, 87–95. [Google Scholar]
  30. Zimmerman, M.H.; Brown, C.L. Trees: Structure and Function; Springer: New York, NY, USA, 1971; p. 336. [Google Scholar]
  31. Burton, P.J. Some limitations inherent to static indices of plant competition. Can. J. For. Res. 1993, 23, 2141–2152. [Google Scholar] [CrossRef]
  32. Kamimura, K.; Shiraishi, N. A review of strategies for wind damage assessment in Japanese forests. J. For. Res. 2007, 12, 162–176. [Google Scholar] [CrossRef]
  33. Maclsaac, D.A.; Navratil, S. Competition dynamics in juvenile boreal hardwood-conifer mixes. In Silviculture of Temperate and Broadleaf Conifer Mixers; Comeau, P., Thomas, K.D., Eds.; BC Ministry of Forests: Victoria, BC, Canada, 1996; pp. 23–34. [Google Scholar]
  34. Henry, H.A.L.; Aarssen, L.W. The interpretation of stem diameter-height allometry in trees: Biomechanical constraints, neighbour effects, or biased regressions? Ecol. Lett. 1999, 2, 89–97. [Google Scholar] [CrossRef]
  35. Ruel, J.-C.; Messier, C.; Claveau, Y.; Doucet, R.; Comeau, P. Morphological indicators of growth response of coniferous advance regeneration to overstorey removal in the boreal forest. For. Chron. 2000, 76, 633–642. [Google Scholar] [CrossRef] [Green Version]
  36. Tilman, D. Plant Strategies and the Dynamics and the Structure of Plant Communities; Princeton University Press: Princeton, NJ, USA, 1988; p. 360. [Google Scholar]
  37. Wiklund, K.; Konôpka, B.; Nilsson, L.-O. Stem form and growth in Picea abies (L.) karst, in response to water and mineral nutrient availability. Scand. J. For. Res. 1995, 10, 326–332. [Google Scholar] [CrossRef]
  38. Homeier, J.; Breckle, S.-W.; Günter, S.; Rollenbeck, R.T.; Leuschner, C. Tree diversity, forest structure and productivity along altitudinal and topographical gradients in a species-rich ecuadorian montane rain forest. Biotropica 2010, 42, 140–148. [Google Scholar] [CrossRef]
  39. Martín-Alcón, S.; González-Olabarría, J.R.; Coll, L. Wind and snow damage in the Pyrenees pine forests: Effect of stand attributes and location. Silva Fenn. 2010, 44, 399–410. [Google Scholar] [CrossRef]
  40. Lohmander, P.; Helles, F. Windthrow probability as a function of stand characteristics and shelter. Scand. J. For. Res. 1987, 2, 227–238. [Google Scholar] [CrossRef]
  41. Schelhaas, M.J.; Kramer, K.; Peltola, H.; van der Werf, D.C.; Wijdeven, S.M.J. Introducing tree interactions in wind damage simulation. Ecol. Model. 2007, 207, 197–209. [Google Scholar] [CrossRef]
  42. Mitchell, S.J. Wind as a natural disturbance agent in forests: A synthesis. Forestry 2013, 86, 147–157. [Google Scholar] [CrossRef]
  43. Sharma, R.P.; Vacek, Z.; Vacek, S. Modeling individual tree height to diameter ratio for Norway spruce and European beech in Czech Republic. Trees 2016, 30, 1969–1982. [Google Scholar] [CrossRef]
  44. Slodicak, M.; Novak, J. Silvicultural measures to increase the mechanical stability of pure secondary Norway spruce stands before conversion. For. Ecol. Manag. 2006, 224, 252–257. [Google Scholar] [CrossRef]
  45. Slodičák, M. Thinning regime in stands of Norway spruce subjected to snow and wind damage. In Wind and Trees; Coutts, M.P., Grace, J., Eds.; Cambridge University Press: Cambridge, UK, 1995; pp. 436–447. [Google Scholar]
  46. Mäkinen, H.; Nöjd, P.; Isomäki, A. Radial, height and volume increment variation in Picea abies (L.) Karst. Stands with varying thinning intensities. Scand. J. For. Res. 2002, 17, 304–316. [Google Scholar] [CrossRef]
  47. Harrington, T.B.; Harrington, C.A.; DeBell, D.S. Effects of planting spacing and site quality on 25-year growth and mortality relationships of Douglas-fir (Pseudotsuga menziesii var. menziesii). For. Ecol. Manag. 2009, 258, 18–25. [Google Scholar] [CrossRef]
  48. Pinheiro, J.C.; Bates, D.M. Mixed-Effects Models in S and S-PLUS; Springer: New York, NY, USA, 2000. [Google Scholar]
  49. West, P.W.; Ratkowsky, D.A.; Davis, A.W. Problems of hypothesis testing of regressions with multiple measurements from individual sampling units. For. Ecol. Manag. 1984, 7, 207–224. [Google Scholar] [CrossRef]
  50. Gregoire, T.G.; Schabenberger, O.; Barrett, J.P. Linear modelling of irregularly spaced, unbalanced, longitudinal data from permanent-plot measurements. Can. J. For. Res. 1995, 25, 137–156. [Google Scholar] [CrossRef]
  51. Fu, L.; Zhang, H.; Sharma, R.P.; Pang, L.; Wang, G. A generalized nonlinear mixed-effects height to crown base model for Mongolian oak in northeast China. For. Ecol. Manag. 2017, 384, 34–43. [Google Scholar] [CrossRef]
  52. Fu, L.; Sun, H.; Sharma, R.P.; Lei, Y.; Zhang, H.; Tang, S. Nonlinear mixed-effects crown width models for individual trees of Chinese fir (Cunninghamia lanceolata) in south-central China. For. Ecol. Manag. 2013, 302, 210–220. [Google Scholar] [CrossRef]
  53. Sharma, R.P.; Breidenbach, J. Modeling height-diameter relationships for Norway spruce, Scots pine, and downy birch using Norwegian national forest inventory data. For. Sci. Technol. 2015, 11, 44–53. [Google Scholar] [CrossRef]
  54. Sharma, R.P.; Vacek, Z.; Vacek, S.; Podrázský, V.; Jansa, V. Modelling individual tree height to crown base of Norway spruce (Picea abies (L.) Karst.) and European beech (Fagus sylvatica L.). PLoS ONE 2017, 12, e0186394. [Google Scholar] [CrossRef] [PubMed]
  55. Sharma, R.P.; Bílek, L.; Vacek, Z.; Vacek, S. Modelling crown width-diameter relationship for Scots pine in the central Europe. Trees 2017, 31, 1875–1889. [Google Scholar] [CrossRef]
  56. Adame, P.; Hynynen, J.; Cañellas, I.; del Río, M. Individual-tree diameter growth model for rebollo oak (Quercus pyrenaica Willd.) coppices. For. Ecol. Manag. 2008, 255, 1011–1022. [Google Scholar] [CrossRef]
  57. Bollandsås, O.M.; Næsset, E. Weibull models for single-tree increment of Norway spruce, Scots pine, birch and other broadleaves in Norway. Scand. J. For. Res. 2009, 24, 54–66. [Google Scholar] [CrossRef]
  58. Crecente-Campo, F.; Tomé, M.; Soares, P.; Dieguez-Aranda, U. A generalized nonlinear mixed-effects height-diameter model for Eucalyptus globulus L. in northwestern Spain. For. Ecol. Manag. 2010, 259, 943–952. [Google Scholar] [CrossRef]
  59. Sharma, R.P.; Vacek, Z.; Vacek, S.; Kučera, M. Modelling individual tree height-diameter relationships for multi-layered and multi-species forests in central Europe. Trees 2018. [Google Scholar] [CrossRef]
  60. Monserud, R.A.; Sterba, H. A basal area increment model for individual trees growing in even- and uneven-aged forest stands in Austria. For. Ecol. Manag. 1996, 80, 57–80. [Google Scholar] [CrossRef]
  61. Sharma, R.P.; Brunner, A. Modeling individual tree height growth of Norway spruce and Scots pine from national forest inventory data in Norway. Scand. J. For. Res. 2017, 32, 501–514. [Google Scholar] [CrossRef]
  62. Sharma, R.P.; Brunner, A.; Eid, T. Site index prediction from site and climate variables for Norway spruce and Scots pine in Norway. Scand. J. For. Res. 2012, 27, 619–636. [Google Scholar] [CrossRef]
  63. Sharma, R.P.; Brunner, A.; Eid, T.; Øyen, B.-H. Modelling dominant height growth from national forest inventory individual tree data with short time series and large age errors. For. Ecol. Manag. 2011, 262, 2162–2175. [Google Scholar] [CrossRef]
  64. Šmelko, Š.S.; Merganič, J. Some methodological aspects of the national forest inventory and monitoring in Slovakia. J. For. Sci. 2008, 54, 476–483. [Google Scholar] [CrossRef]
  65. FMI. Inventarizace Lesů, Metodika Venkovního Sběru Dat [Forest Inventory, Field Data Collection Methodology]; FMI: Brandýs nad Labem, Czech Republic, 2003; p. 136.
  66. Kučera, M. Výstupy NIL2-Zastoupení dřevin a věková struktura Lesa [Outputs of NIL2-Representation of tree species and the age structure of forest]. In XIX. Sněm Lesníků; Vašíček, J., Skála, V., Eds.; Ministry of Environment: Hradec Králové, Czech Republic, 2016; pp. 37–53. [Google Scholar]
  67. FMI. National Forest Inventory in the Czech Republic 2001–2004: Introduction, Methods, Results; FMI: Brandýs nad Labem, Czech Republic, 2007; p. 224.
  68. Sharma, R.P.; Vacek, Z.; Vacek, S.; Jansa, V. Modelling individual tree diameter growth for Norway spruce in Czech Republic using generalized algebraic difference approach. J. For. Sci. 2017, 63, 227–238. [Google Scholar]
  69. Vacek, S.; Vacek, Z.; Bílek, L.; Simon, J.; Remeš, J.; Hůnová, I.; Král, J.; Putalova, T.; Mikeska, M. Structure, regeneration and growth of Scots pine (Pinus sylvestris L.) stands with respect to changing climate and environmental pollution. Silva Fenn. 2016, 50, 1564. [Google Scholar] [CrossRef]
  70. Sharma, R.P.; Vacek, Z.; Vacek, S. Individual tree crown width models for Norway spruce and European beech in Czech Republic. For. Ecol. Manag. 2016, 366, 208–220. [Google Scholar] [CrossRef]
  71. Sharma, R.P.; Vacek, Z.; Vacek, S. Modelling tree crown-to-bole diameter ratio for Norway spruce and European beech. Silva Fenn. 2017, 51, 1740. [Google Scholar] [CrossRef]
  72. Vacek, Z.; Vacek, S.; Bílek, L.; Král, J.; Remeš, J.; Bulušek, D.; Králíček, I. Ungulate impact on natural regeneration in spruce-beech-fir stands in Černý důl Nature Reserve in the Orlické Hory mountains, case study from central Sudetes. Forests 2014, 5, 2929–2946. [Google Scholar] [CrossRef]
  73. Vacek, Z.; Vacek, S.; Bílek, L.; Remeš, J.; Štefančík, I. Changes in horizontal structure of natural beech forests on an altitudinal gradient in the Sudetes. Dendrobiology 2015, 73, 33–45. [Google Scholar] [CrossRef] [Green Version]
  74. Vacek, S.; Vacek, Z.; Kalousková, I.; Cukor, J.; Bílek, L.; Moser, W.K.; Bulušek, D.; Podrázský, V.; Řeháček, D. Sycamore maple (Acer pseudoplatanus L.) stands on former agricultural land in the Sudetes—Evaluation of ecological value and production potential. Dendrobiology 2018, 79, 61–76. [Google Scholar] [CrossRef]
  75. Fu, L.; Sharma, R.P.; Hao, K.; Tang, S. A generalized interregional nonlinear mixed-effects crown width model for Prince Rupprecht larch in northern China. For. Ecol. Manag. 2017, 389, 364–373. [Google Scholar] [CrossRef]
  76. Schroder, J.; von Gadow, K. Testing a new competition index for Maritime pine in northwestern Spain. Can. J. For. Res. 1999, 29, 280–283. [Google Scholar] [CrossRef]
  77. Zhao, D.; Kane, M.; Borders, B.E. Crown ratio and relative spacing relationships for loblolly pine plantations. Open J. For. 2012, 2, 101–115. [Google Scholar] [CrossRef]
  78. Ferguson, I.S.; Leech, J.W. Generalized least squares estimation of yield functions. For. Sci. 1978, 24, 27–42. [Google Scholar]
  79. Staudhammer, C.; LeMay, V. Height prediction equations using diameter and stand density measures. For. Chron. 2000, 76, 303–309. [Google Scholar] [CrossRef] [Green Version]
  80. Mehtatalo, L. Height-diameter models for Scots pine and birch in Finland. Silva Fenn. 2005, 39, 55–66. [Google Scholar] [CrossRef]
  81. Adame, P.; del Rio, M.; Canellas, I. A mixed nonlinear height-diameter model for pyrenean oak (Quercus pyrenaica Willd.). For. Ecol. Manag. 2008, 256, 88–98. [Google Scholar] [CrossRef]
  82. Bates, D.M.; Watts, D.G. Nonlinear Regression Analysis and Its Applications; John Wiley and Sons: New York, NY, USA, 1988. [Google Scholar]
  83. Vonesh, E.F.; Chinchilli, V.M. Linear and Nonlinear Models for the Analysis of Repeated Measurements; Marcel Dekker: New York, NY, USA, 1997; p. XII. [Google Scholar]
  84. SAS Institute Inc. SAS/ETS1 9.4 User’s Guide; SAS Institute Inc.: Cary, NC, USA, 2013. [Google Scholar]
  85. Littell, R.C.; Milliken, G.A.; Stroup, W.W.; Wolfinger, R.D.; Schabenberger, O. SAS for Mixed Models, 2nd ed.; SAS Institute Inc.: Cary, NC, USA, 2006; 814p. [Google Scholar]
  86. Sheiner, L.B.; Beal, S.L. Evaluation of methods for estimating population pharmacokinetic parameters. I. Michaelis-menten model: Routine clinical pharmacokinetic data. J. Pharmacokinet. Biopharm. 1980, 8, 553–571. [Google Scholar] [CrossRef]
  87. Akaike, H. A new look at statistical model identification. IEEE Trans. Autom. Control 1972, 19, 716–723. [Google Scholar] [CrossRef]
  88. Burnham, K.P.; Anderson, D.R. Model Selection and Inference: A Practical Information-Theoretic Approach; Springer: New York, NY, USA, 2002. [Google Scholar]
  89. Montgomery, D.C.; Peck, E.A.; Vining, G.G. Introduction to Linear Regression Analysis, 3rd ed.; Wiley: New York, NY, USA, 2001; p. 641. [Google Scholar]
  90. Hall, D.B.; Bailey, R.L. Modeling and prediction of forest growth variables based on multilevel nonlinear mixed models. For. Sci. 2001, 47, 311–321. [Google Scholar]
  91. Calama, R.; Montero, G. Interregional nonlinear height-diameter model with random coefficients for stone pine in Spain. Can. J. For. Res. 2004, 34, 150–163. [Google Scholar] [CrossRef]
  92. Vanclay, J.K. Modelling Forest Growth and Yield: Applications to Mixed Tropical Forests; CAB International: Oxon, UK, 1994; p. 312. [Google Scholar]
  93. Hasenauer, H. Concepts within tree growth modeling. In Sustainable Forest Management: Growth Models for Europe; Hasenauer, H., Ed.; Springer: Berlin/Heidelberg, Germany, 2006; p. 398. [Google Scholar]
  94. Short III, E.A.; Burkhart, H. Prediction crown-height increment for thinned and unthinned loblolly pine plantations. For. Sci. 1992, 38, 594–610. [Google Scholar]
  95. Eerikainen, K. Predicting the height-diameter pattern of planted Pinus kesiya stands in Zambia and Zimbabwe. For. Ecol. Manag. 2003, 175, 355–366. [Google Scholar] [CrossRef]
  96. Sharma, M.; Parton, J. Height-diameter equations for boreal tree species in Ontario using a mixed-effects modeling approach. For. Ecol. Manag. 2007, 249, 187–198. [Google Scholar] [CrossRef]
  97. Vargas-Larreta, B.; Castedo-Dorado, F.; Alvarez-Gonzalez, J.G.; Barrio-Anta, M.; Cruz-Cobos, F. A generalized height-diameter model with random coefficients for uneven-aged stands in El Salto, Durango (Mexico). Forestry 2009, 82, 445–462. [Google Scholar] [CrossRef] [Green Version]
  98. Fu, L.; Sharma, R.P.; Wang, G.; Tang, S. Modelling a system of nonlinear additive crown width models applying seemingly unrelated regression for Prince Rupprecht larch in northern China. For. Ecol. Manag. 2017, 386, 71–80. [Google Scholar] [CrossRef]
  99. Soares, P.; Tomé, M. A tree crown ratio prediction equation for eucalypt plantations. Ann. For. Sci. 2001, 58, 193–202. [Google Scholar] [CrossRef] [Green Version]
  100. Pretzsch, H.; Biber, P.; Uhl, E.; Dahlhausen, J.; Rötzer, T.; Caldentey, J.; Koike, T.; van Con, T.; Chavanne, A.; Seifert, T.; et al. Crown size and growing space requirement of common tree species in urban centres, parks, and forests. Urban For. Urban Green. 2015, 14, 466–479. [Google Scholar] [CrossRef] [Green Version]
  101. Corral-Rivas, J.J.; Gonzalez, J.G.A.; Aguirre, O.; Hernandez, F. The effect of competition on individual tree basal area growth in mature stands of Pinus cooperi Blanco in Durango (Mexico). Eur. J. For. Res. 2005, 124, 133–142. [Google Scholar] [CrossRef]
  102. Fonseca, T.F.; Duarte, J.C. A silvicultural stand density model to control understory in maritime pine stands. iForest-Biogeosci. For. 2017, 10, 829–836. [Google Scholar] [CrossRef] [Green Version]
  103. Robinson, A.P.; Wykoff, W.R. Imputing missing height measures using a mixed-effects modeling strategy. Can. J. For. Res. 2004, 34, 2492–2500. [Google Scholar] [CrossRef]
  104. Trincado, G.; VanderSchaaf, C.L.; Burkhart, H.E. Regional mixed-effects height-diameter models for loblolly pine (Pinus taeda L.) plantations. Eur. J. For. Res. 2007, 126, 253–262. [Google Scholar] [CrossRef]
  105. Sharma, R.P.; Vacek, Z.; Vacek, S. Nonlinear mixed effect height-diameter model for mixed species forests in the central part of the Czech Republic. J. For. Sci. 2016, 62, 470–484. [Google Scholar] [Green Version]
  106. Özçelik, R.; Cao, Q.V.; Trincado, G.; Göçer, N. Predicting tree height from tree diameter and dominant height using mixed-effects and quantile regression models for two species in Turkey. For. Ecol. Manag. 2018, 419, 240–248. [Google Scholar] [CrossRef]
  107. Ruel, J.-C. Understanding windthrow: Silvicultural implications. For. Chron. 1995, 71, 434–445. [Google Scholar] [CrossRef] [Green Version]
  108. Rijal, B.; Weiskittel, A.R.; Kershaw, J.A. Development of height to crown base models for thirteen tree species of the North American Acadian Region. For. Chron. 2012, 88, 60–73. [Google Scholar] [CrossRef] [Green Version]
Figure 1. Location of sample plots [59]: National forest inventory sample plots in the training data (a) and research sample plots in the validation data (b).
Forests 10 00070 g001aForests 10 00070 g001b
Figure 2. Height-to-diameter ratio (HDR) plotted against diameter at breast height (DBH) for each canopy height class (CHC); classification was adapted from Sharma et al. [43]; CHC1: height >66% height of the tallest tree, CHC2: 33% height of the tallest tree < height < 66% height of the tallest tree, and CHC3: height <33% height of the tallest tree per sample plot.
Forests 10 00070 g002aForests 10 00070 g002b
Figure 3. Box plots of the standardized residuals of the height-to-diameter ratio (HDR) model. The larger box length represents interquartile range (IQR), whisker length represents class minimum and maximum values in the IQR, smaller boxes represent the observations 1.5 times beyond the IQR (outlier observations lying far away from the median), and horizontal lines and plus signs in a larger box represent class median and mean values, respectively.
Forests 10 00070 g003aForests 10 00070 g003b
Figure 4. Effects of dominant height (HDOM) on height-to-diameter ratio (HDR). Curves were generated with the fixed-part of the mixed-effects HDR model using the mean of each of the three measurable covariate predictors and allowing HDOM and diameter at breast height (DBH) to vary from approximately minimum to maximum for each canopy height class (CHC) in the training data. Dummy codes were applied in the same way as in Equation (3) for generating curves.
Forests 10 00070 g004aForests 10 00070 g004b
Figure 5. Effects of dominant diameter (DDOM) on height-to-diameter ratio (HDR). Curves were generated with the fixed-part of the mixed-effects HDR model using the mean of each of the three measurable covariate predictors and allowing DDOM and diameter at breast height (DBH) to vary from approximately minimum to maximum for each canopy height class (CHC) in the training data. Dummy codes were applied in the same way as in Equation (3) for generating curves.
Forests 10 00070 g005aForests 10 00070 g005b
Figure 6. Effects of the relative spacing index (RS) on height-to-diameter ratio (HDR). Curves were generated with the fixed-part of the mixed-effects HDR model using the mean of each of the three measurable covariate predictors and allowing RS and diameter at breast height (DBH) to vary from approximately minimum to maximum for each canopy height class (CHC) in the training data. Dummy codes were applied in the same way as in Equation (3) for generating curves.
Forests 10 00070 g006aForests 10 00070 g006b
Figure 7. Effects of the ratio of DBH to quadratic mean DBH (dq) on height-to-diameter ratio (HDR). Curves were generated with the fixed-part of the mixed-effects HDR model using the mean of each of the three measurable covariate predictors and allowing dq and diameter at breast height (DBH) to vary from approximately minimum to maximum for each canopy height class (CHC) in the training data. Dummy codes were applied in the same way as in Equation (3) for generating curves.
Forests 10 00070 g007aForests 10 00070 g007b
Figure 8. Standardized prediction errors in the validation data. The mixed-effects HDR model was calibrated with the random effects predicted using HDR measurements from one to four randomly selected trees of a particular species or group of species depending on the availability of their numbers per sample plot; DBH: diameter at breast height; CHC: canopy height class, which is the same as defined in Figure 2.
Forests 10 00070 g008aForests 10 00070 g008b
Figure 9. Sample plot-specific height-to-diameter ratio (HDR) curves overlaid on the validation data. Curves were produced with the calibrated mixed-effects HDR model using the sample plot-level mean of each of the three measurable covariate variables and allowing individual tree diameter at breast height (DBH)-to-quadratic mean DBH (dq) to vary from approximately minimum to maximum by one for each sample plot. The mixed-effects HDR model was calibrated with the random effect predicted using HDR measurements from one to four randomly selected trees of a particular species or group of species depending on the availability of their numbers per sample plot in the validation data. Dummy codes were applied in the same way as in Equation (3) for generating curves.
Forests 10 00070 g009aForests 10 00070 g009b
Figure 10. Relationship between crown ratio (ratio of crown depth to total height) and height-to diameter ratio (HDR) for a particular species and group of species in the validation dataset; mean crown ratio for each canopy height class (CHC) was calculated by HDR class of 0.25 interval. Spec 1: Norway spruce; spec 2: Scots pine; spec 3: European larch; spec 4: Fir species; spec 5: European beech; spec 6: Oak species; spec 7: Birch and alder species.
Forests 10 00070 g010aForests 10 00070 g010b
Table 1. Summary statistics of data.
VariablesStatistics (Mean ± Standard Deviation (Range))
Training DataValidation Data
Number of sample plots13,875220
Number of HDR sample trees348,98025,146
Number of HDR sample trees per sample plot36.5 ± 15.9 (4–90)232.3 ± 167.8 (8–664)
Number of stems (N ha−1)1514 ± 671 (40–5460)940 ± 711 (32–4700)
Stand basal area (BA, m2 ha−1)38.3 ± 13.5 (0.07–85.4)41.3 ± 14.4 (0.1–81.1)
BA of trees lager than a subject tree (BAL, m2 ha−1)28.5 ± 14.4 (0–83.3)32.2 ± 17.6 (0–79.5)
Quadratic mean DBH per sample plot (QMD, cm)27.3 ± 6.9 (8.7–84.2)28.6 ± 10.3 (9.6–87.3)
DBH-to-QMD ratio (dq)0.95 ± 0.31 (0.13–4.5)0.86 ± 0.52 (0.04–7)
Arithmetic mean DBH per sample plot (AMD, cm)25.8 ± 6.6 (8.5–78.4)24.9 ± 10.6 (9.1–84.4)
Dominant height per sample plot (HDOM, m)23.2 ± 6.2 (4.4–42.4)27.5 ± 6.9 (8–42.8)
Dominant diameter (DDOM, cm)31.5 ± 8.1 (8.6–78.4)49.7 ± 14.2 (13.3–84.4)
Total height (H, m)21.1 ± 7.1 (1.5–54.3)17.2 ± 9.3 (1.4–50.6)
Diameter at breast height (DBH, cm)26.4 ± 11.6 (7–117.3)25.2 ± 17.4 (2–118.1)
Height-to-DBH ratio (HDR, m cm−1)0.85 ± 0.19 (0.08–2.15)0.81 ± 0.28 (0.11–2.3)
Table 2. Parameter estimates, variance components and fit statistics of the mixed-effects HDR model (Equation (3)).
EstimateStandard Errort-ValuePr > |t|
Fixed
α1−0.40050.001765−226.98<0.0001
α2−1.05260.004407−238.81<0.0001
α30.79980.004939161.95<0.0001
α40.45680.002249203.06<0.0001
α5−0.021880.000223−97.98<0.0001
α60.12360.015657.90<0.0001
α7−0.45990.002771−165.97<0.0001
α80.010490.0014577.20<0.0001
α90.077620.00204737.91<0.0001
α10−0.042910.003544−12.11<0.0001
α110.012520.0020876.00<0.0001
α12−0.048450.002019−23.99<0.0001
α130.048060.00180426.65<0.0001
b20.18230.000747244.09<0.0001
Variance
σ2ui0.01109
σ20.006923
Fit statistics
RMSE0.0923
R2adj0.7863
AIC−729778
R2adj: adjusted coefficient of determination; RMSE: root mean squared errors; AIC: Akaike’s information criterion; α1, …, α13, b2: fixed-effect parameters; ui = random effect for ith sample plot; σ2: residual variance; other symbols are the same as in Equations (1)–(3).
Table 3. Prediction statistics in the validation data.
SpeciesRMSER2
Norway spruce0.06730.8922
Scots pine0.06570.9039
European larch0.06670.8821
Fir species0.06540.8574
European beech0.06760.9605
Oak species0.06810.9176
Birch and alder species0.06680.9328
RMSE: root mean squared errors; R2: coefficient of determination.

