Article

Noise Reduction of Steel Cord Conveyor Belt Defect Electromagnetic Signal by Combined Use of Improved Wavelet and EMD †

School of Mechanical Engineering, Xi’an University of Science and Technology, Xi’an 710054, China
*
Authors to whom correspondence should be addressed.
This paper is an extended version of our paper published in the International Symposium on Computer, Consumer and Control, Xi’an, China, 4–6 July 2016.
Algorithms 2016, 9(4), 62; https://doi.org/10.3390/a9040062
Submission received: 17 July 2016 / Revised: 3 September 2016 / Accepted: 13 September 2016 / Published: 26 September 2016

Abstract

:
In order to reduce the noise of a defect electromagnetic signal of the steel cord conveyor belt used in coal mines, a new signal noise reduction method by combined use of the improved threshold wavelet and Empirical Mode Decomposition (EMD) is proposed. Firstly, the denoising method based on the improved threshold wavelet is applied to reduce the noise of a defect electromagnetic signal obtained by an electromagnetic testing system. Then, the EMD is used to decompose the denoised signal and then the effective Intrinsic Mode Function (IMF) is extracted by the dominant eigenvalue strategy. Finally, the signal reconstruction is carried out by utilizing the obtained IMF. In order to verify the proposed noise reduction method, the experiments are carried out in two cases including the defective joint and steel wire rope break. The experimental results show that the proposed method in this paper obtains the higher Signal to Noise Ratio (SNR) for the defect electromagnetic signal noise reduction of steel cord conveyor belts.

1. Introduction

In the modern coal mine, the belt conveyor [1] is one of the important transport machines. Due to the high strength of steel wire rope, the steel cord conveyor belt is widely used in the coal transportation. However, the coal mine steel cord conveyor belt is usually subject to the alternating heavy load and complicated conditions, so the safety of the steel cord conveyor belt is very important. If the steel cord belt breaks, there will be undesired production interruption and large economic loss [2]. A typical steel cord conveyor belt break is shown in Figure 1.
Electromagnetic testing is a common kind of steel cord conveyor belt defect detection method. However, under the complicated coal mine working conditions, the defect electromagnetic signal collected from steel cord conveyor belt usually contains a large amount of non-stationary noise which makes the signal feature extraction difficult. Thus, for the steel cord conveyor belt the research of a reliable signal noise reduction method is necessary. It is well known that the wavelet transform is a common signal noise reduction method [3,4] and it has been used for the denoising of electromagnetic signals [5,6,7]. For the steel cord conveyor belt, the wavelet transform was used to denoise the electromagnetic signal with the steel wire rope break defect [8] and the corrected linear B-wavelet method was proposed to improve the Signal to Noise Ratio (SNR) [9]. However, the wavelet transform result can be affected by the selection of wavelet basis, decomposition level and threshold value [10]. This paper will propose an improved threshold wavelet method to reduce the signal distortion and unsmoothed phenomenon after denoising [11,12]. Furthermore, the defect electromagnetic signal of coal mine steel cord conveyor belt is a kind of complicated non-stationary signal, so the optimal filtering cannot be obtained only by the wavelet method. The Empirical Mode Decomposition (EMD) method need not select the basis function and can adaptively decompose the signal into many Intrinsic Mode Functions (IMFs), so it is very suitable for the noise reduction of non-stationary signal [13,14]. However, the EMD is usually realized by directly removing the high-frequency functions, which can cause these problems such as non-maximal noise removal rate and loss of useful signal. In recent years, some effective IMF selecting methods were proposed, including the close eigenvalue [15], great kurtosis contribution [16] and large correlation coefficient [17]. However, these IMF selection methods are qualitative, in the actual operation the IMF selection rationality will affect the noise reduction effect. This paper will propose a new kind of adaptive IMF selection strategy according to the dominant eigenvalues.
Based on the above analysis, the new electromagnetic signal noise reduction method based on the improved threshold wavelet and EMD with the dominant eigenvalue is proposed in this paper and used for the coal mine steel cord conveyor belt testing. In Section 2, the basic theory of the proposed electromagnetic signal noise reduction method will be introduced. In Section 3, the test rig and experiment will be carried out to verify the effect of the newly proposed method for the steel cord conveyor belt defect detection.

2. Basic Theory of Signal Noise Reduction Method

2.1. Wavelet Noise Reduction Principle

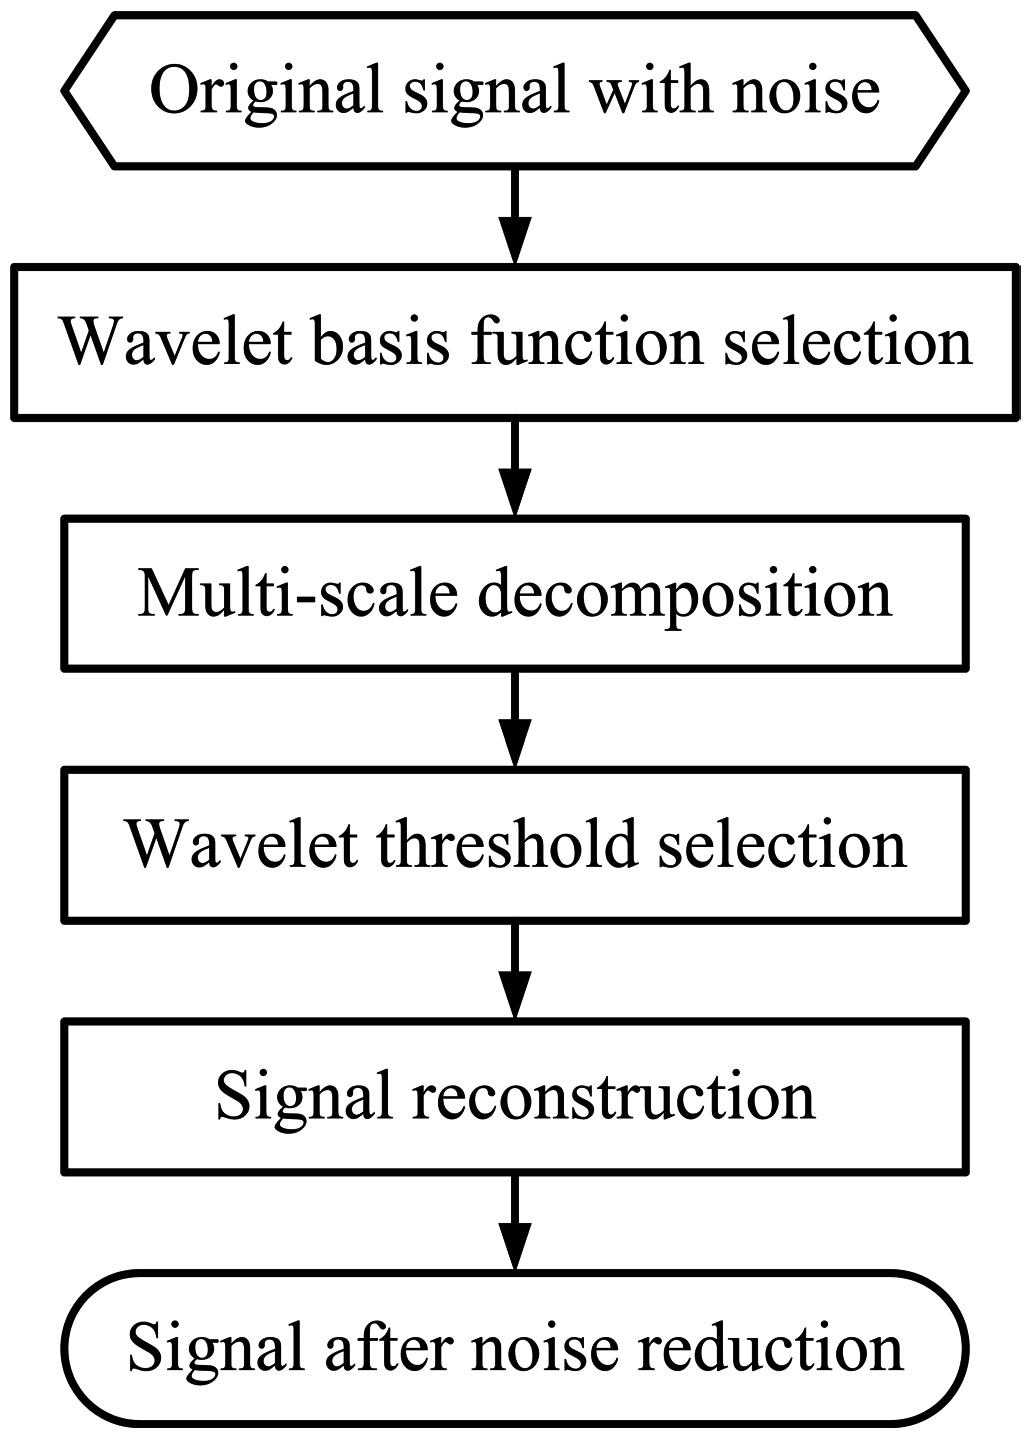
The wavelet threshold noise reduction method can be carried out according to the processing flow, as shown in Figure 2. The main processing steps include the wavelet basis function selection, multi-scale decomposition, wavelet threshold selection and signal reconstruction.

2.1.1. Wavelet Basis Function Selection

The wavelet basis function has a great influence on the signal noise reduction effect. In order to obtain a better denoised signal, the basis function having the similar waveform as the original signal should be selected. Because the joint electromagnetic signal waveform is close to the dB8 wavelet basis function, the dB8 wavelet basis is adopted in this paper.

2.1.2. Wavelet Multi-Scale Decomposition

The discrete wavelet basis function [18] is shown as Equation (1)
ψ j , k ( t ) = a 0 j 2 ψ ( a 0 j t k b 0 )
where a 0 represents the extension scale and b 0 represents the time translation, usually a 0 = 2 , b 0 = 1 .
Through the discrete wavelet transform, the original signal x ( t ) including noise is shown as Equation (2)
d j , k ( t ) = x ( t ) 2 j 2 ψ ( 2 j t k ) d t
The Mallat forward transform is shown as Equation (3) [19]
{ c j , k = n h k 2 n c j 1 , n d j , k = n g k 2 n d j 1 , n j = 1 , 2 , · · · , J
where c j , k is the smoothing signal of original signal, d j , k is the detail signal of original signal, g n is the impulse response of band-pass filter concerned with wavelet function, h n is the impulse response of low-pass filter concerned with scaling function.

2.1.3. Wavelet Threshold Selection

The wavelet threshold determination method includes the default, penalty, Birge-Massart, rigrsure rule, sqtwolog rule, heursure rule and minimaxi rule, and the threshold value can be defined by the soft or hard strategy [20]. Based on the experimental investigation, the Birge-Massart is applied in this paper.

2.1.4. Signal Reconstruction

The reconstruction of smoothing signal after filtering is shown as Equation (4)
c j 1 , k = n [ h k 2 n c j , n + g k 2 n d j , n ]
Firstly, the signal is decomposed into time-frequency domain using Equation (3). Then the reconstruction of denoised signal is realized by Equation (4).

2.2. New Improved Threshold Wavelet Method

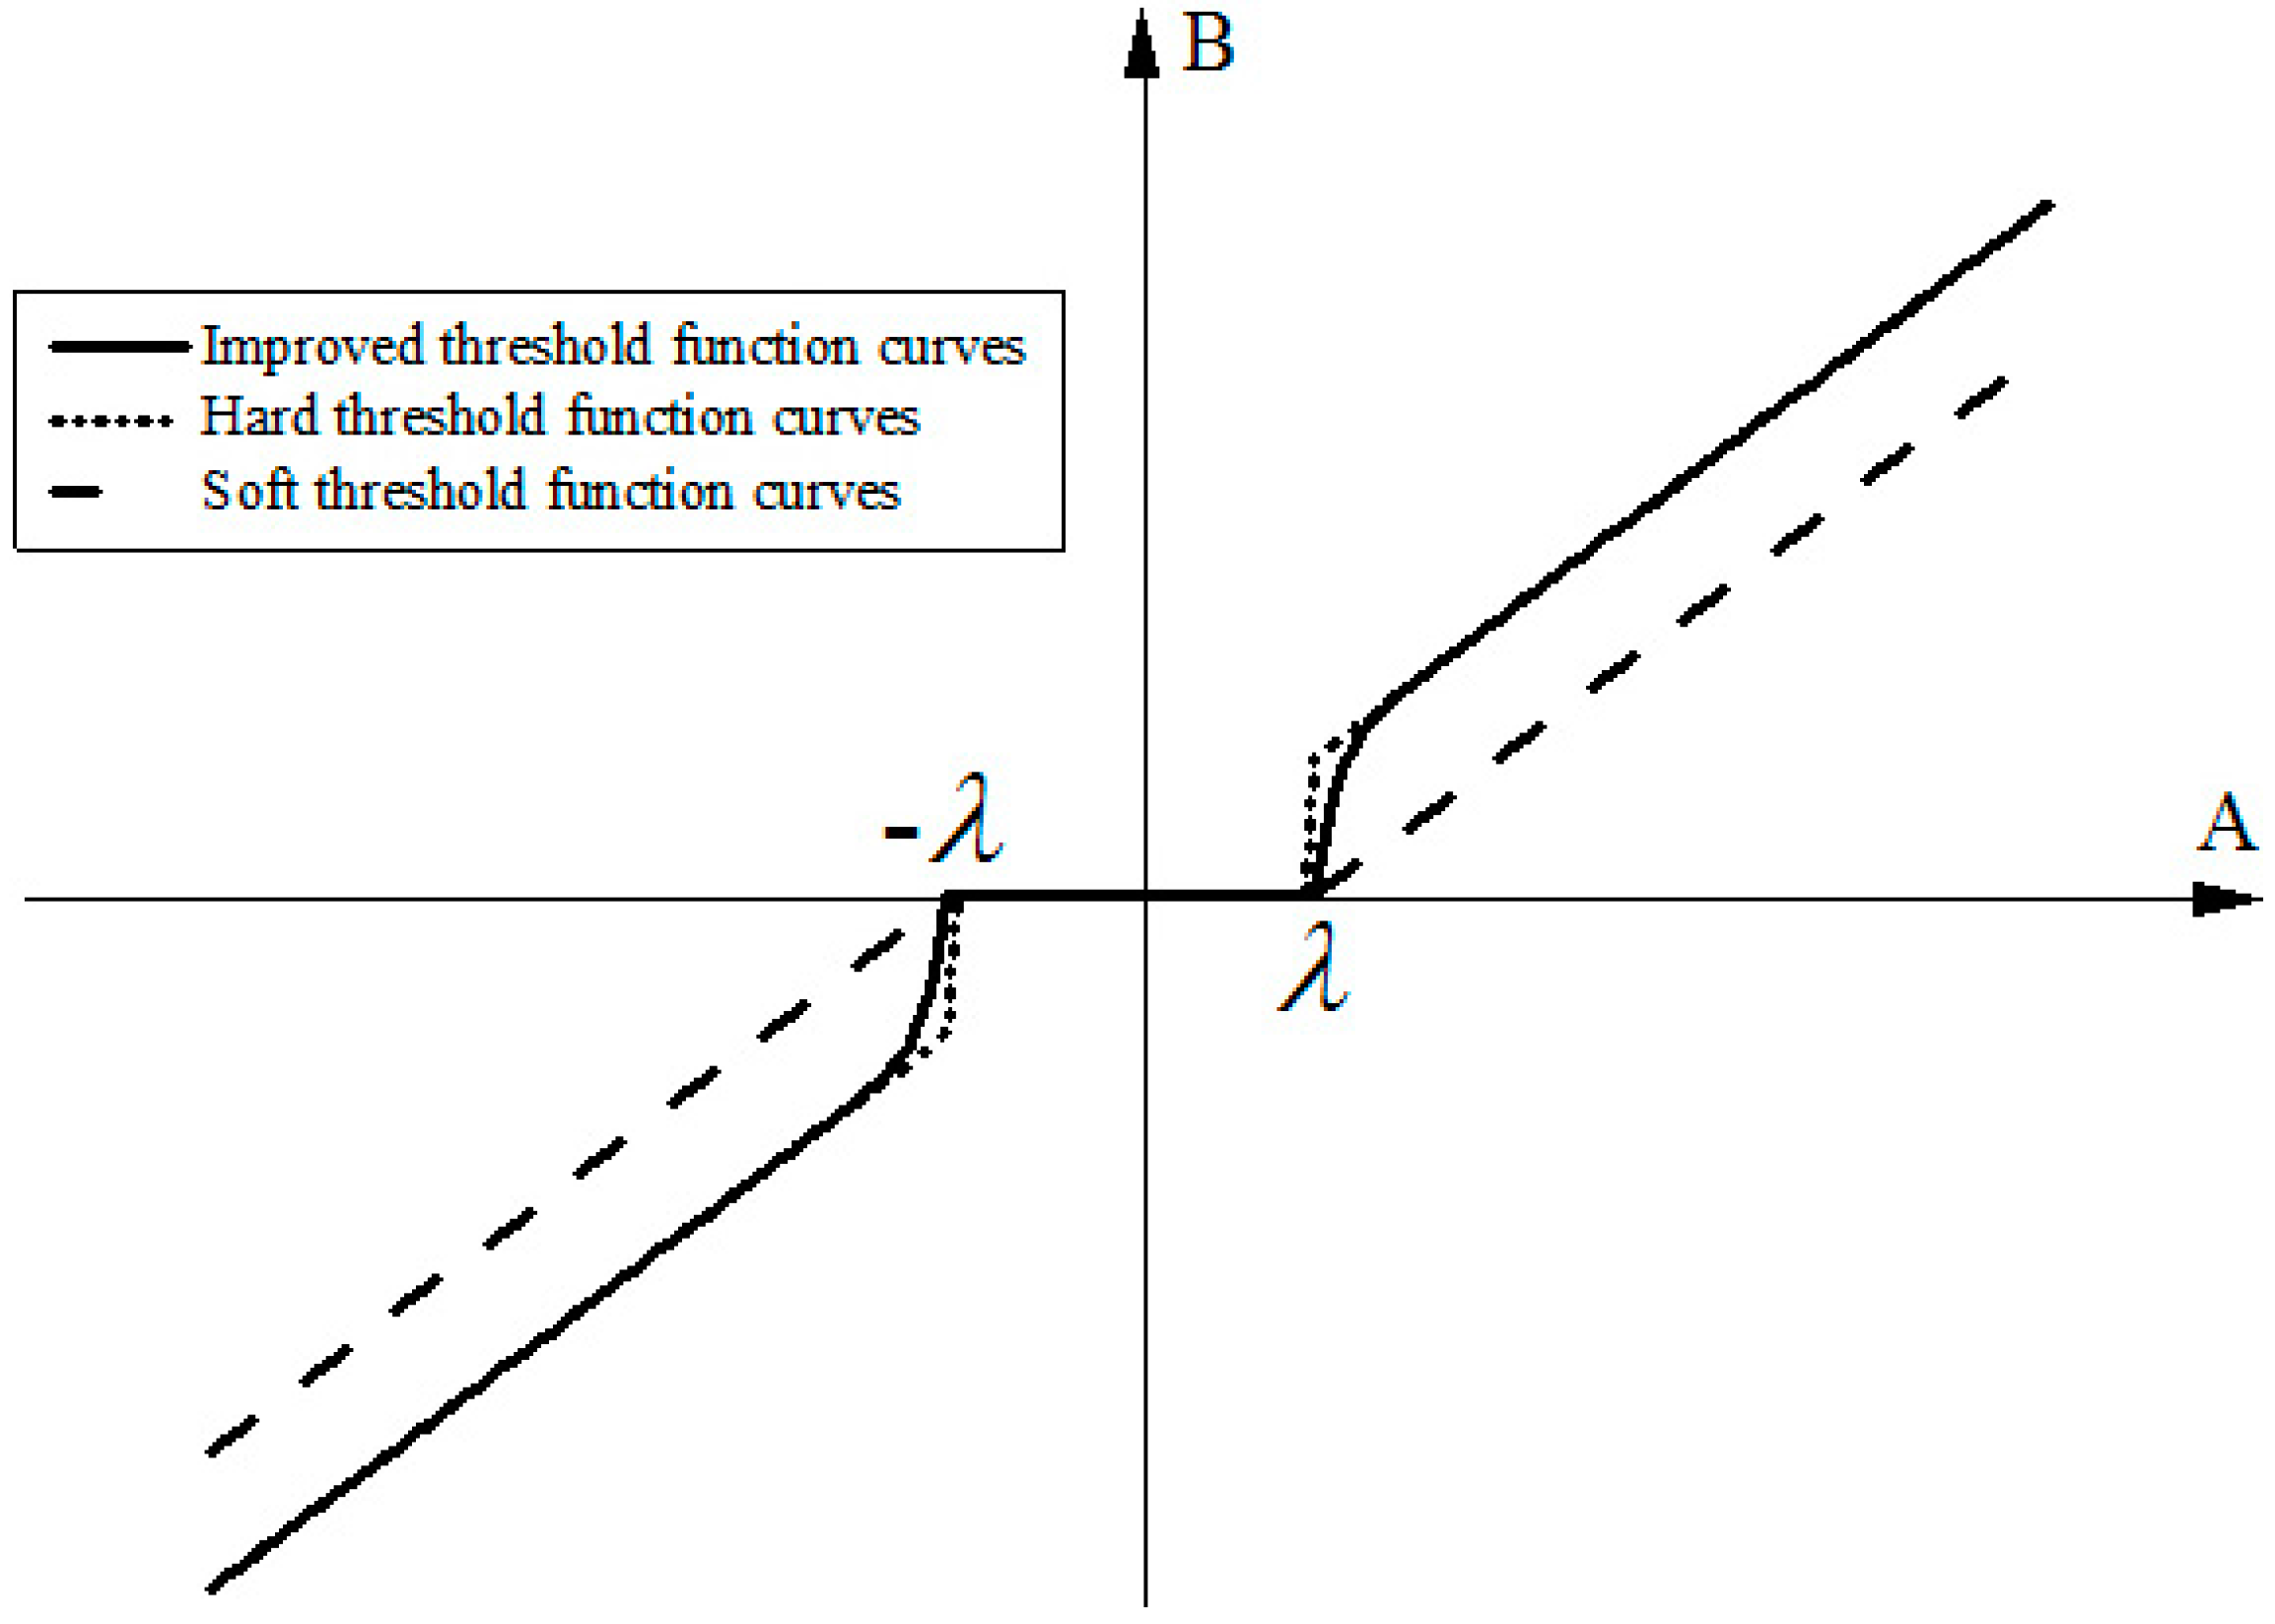
In order to improve the noise reduction effect and reduce the signal distortion, an improved threshold wavelet method is proposed. The improved threshold function is shown as Equation (5)
B = { sign ( A ) [ ( | A | λ 2 | A | exp ( | A | 2 λ 2 ) ) ] , | A | λ 0 , | A | < λ
where B is the wavelet coefficient after threshold processing, A is the wavelet coefficient after decomposition, λ is the threshold value.
The hard, soft and newly improved threshold function curves are shown in Figure 3. The B value for the improved method is situated between soft and hard cases so that the estimated wavelet coefficient is close to A. This improved kind of threshold processing method overcomes the discontinuity at λ compared to the hard method and the unavoidable signal deviation compared to the soft method.

2.3. EMD Noise Reduction Method by Dominant Eigenvalues

2.3.1. Noise Reduction Principle by EMD

The EMD is to decompose the signal into the sum of a series of IMFs and one residual term. With the increase of decomposition order the frequency of IMF will decrease, so the signal filtering can be realized.
Assuming the input signal is x ( t ) , the EMD by Equation (6) can be carried out to obtain all IMF components including s i ( t ) and r n ( t ) . The signal after noise reduction can be obtained by the reconstruction of different IMF components.
x ( t ) = i = 1 n s i ( t ) + r n ( t )
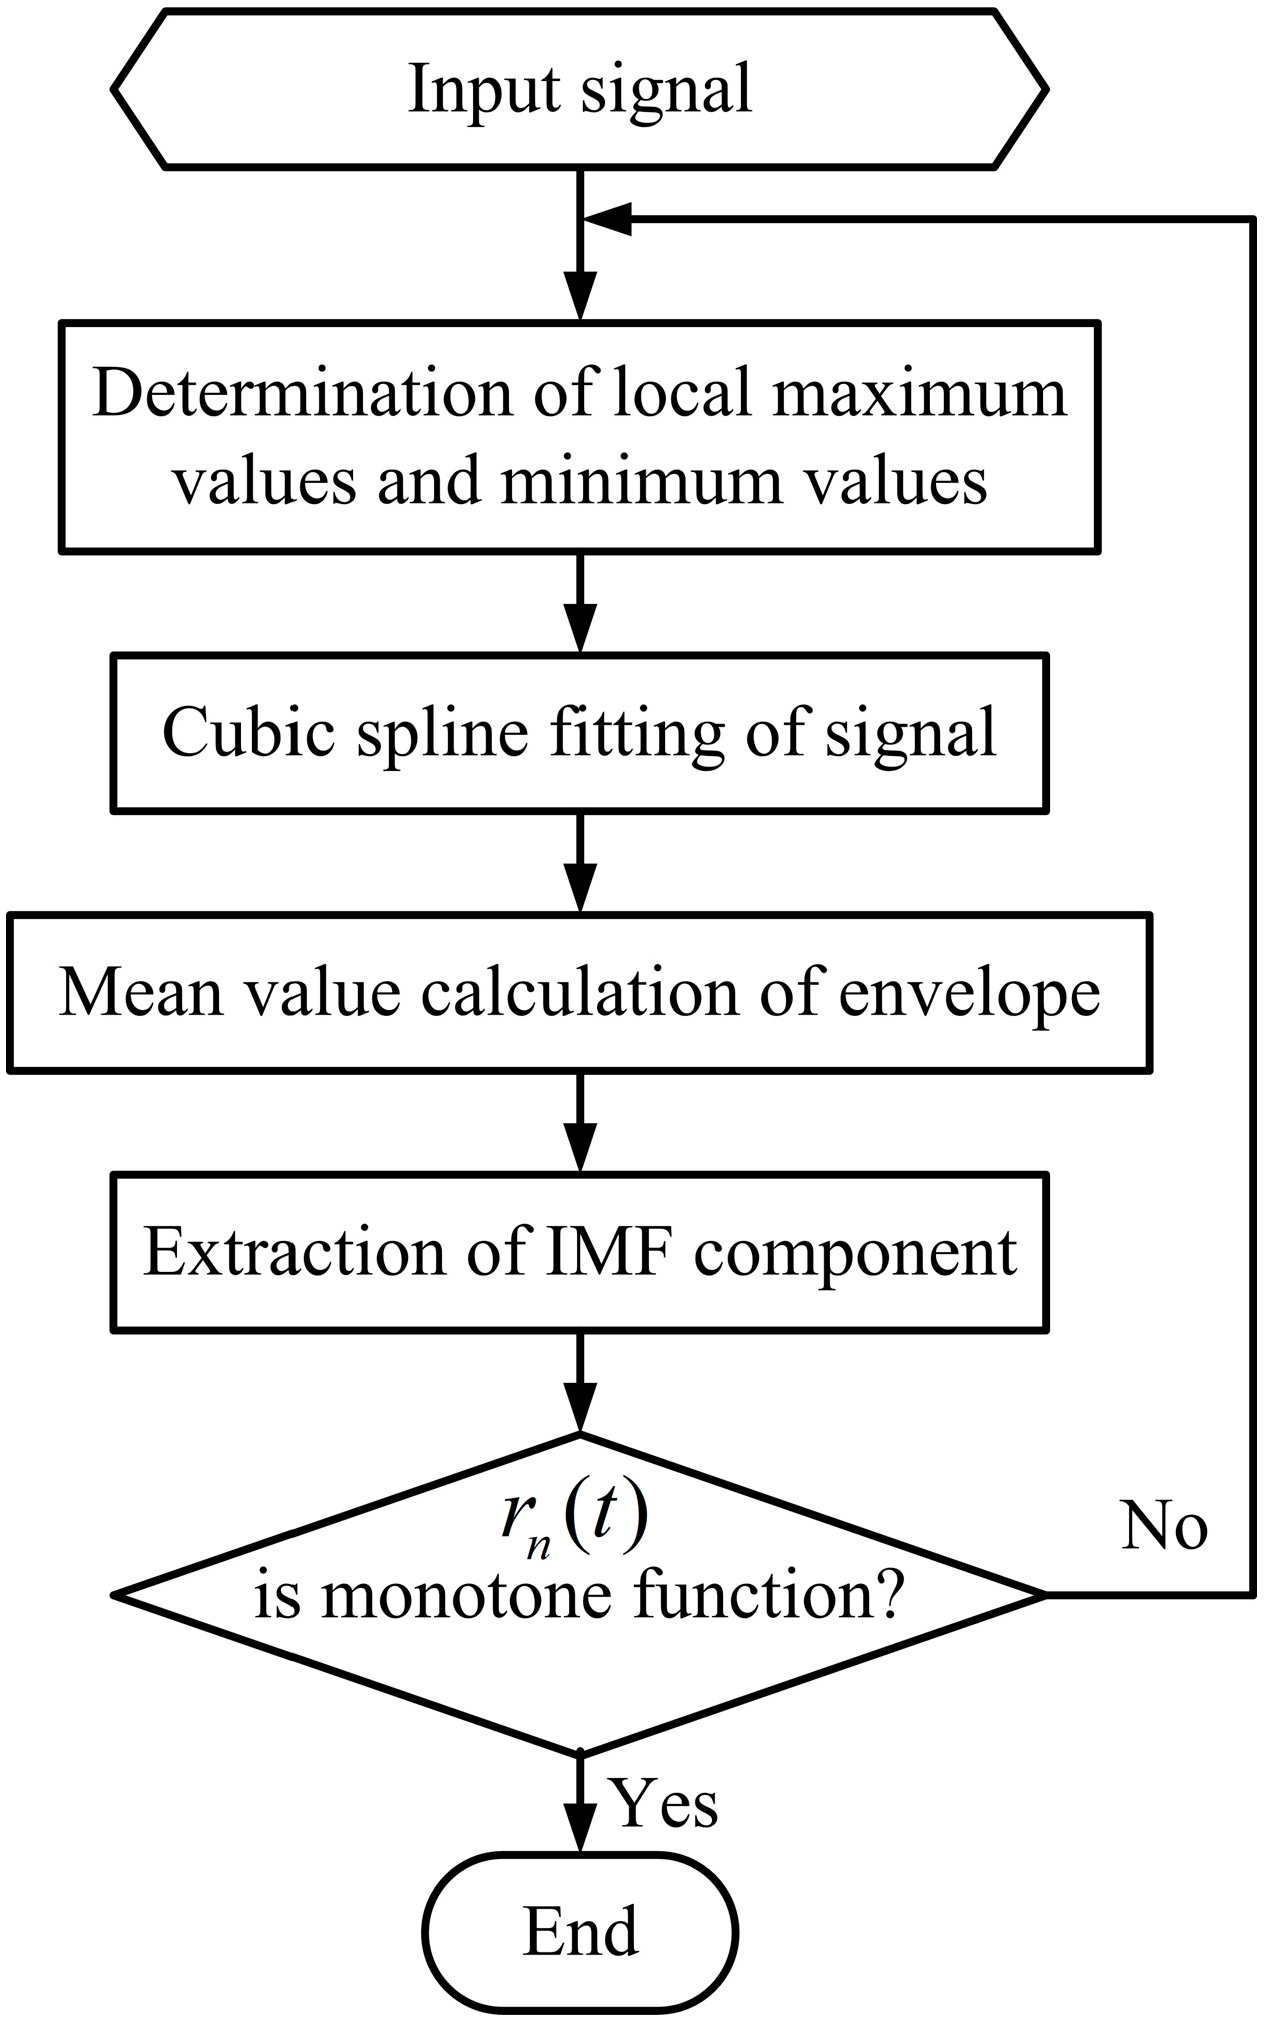
The EMD flow is shown in Figure 4. The main processing steps include the determination of local maximum values and minimum values, cubic spline fitting of signal, mean value calculation of envelope and extraction of IMF component.

2.3.2. New IMF Component Extraction Method by Dominant Eigenvalue

Because the actual noise is variable, the effective IMF component should be obtained by the adaptive strategy. Therefore, the IMF component extraction method according to the dominant eigenvalue is proposed and carried out by the following two steps:
  • Calculate the eigenvalues λ 1 , λ 2 , · · · , λ n of each order IMF component s i ( t ) and the residual component r n ( t ) by the Singular Value Decomposition (SVD) [21].
  • Extract the effective IMF component by the Dominant Eigenvalue Method (DEM) [22].
The variation tendency demarcation point of the ratio Ki of adjacent singular eigenvalues is used in this paper to determine the boundary between the dominant and non-dominant eigenvalues to then extract the effective IMF components. The expression of Ki is defined as Equation (7)
K i = λ i λ i + 1 , i = 1 , 2 , · · · , n 1
The variation tendency demarcation point of Ki is expressed as Equation (8)
i = K i K i + 1 , i = 1 , 2 , · · · , n 1
For the Equation (8), the first point of i less than 1.0 is the variation tendency demarcation point of Ki.
From Equation (8), it can be seen that if ∆m is smaller than 1.0, the corresponding eigenvalues λ1, λ2, …, λm+1 are dominant. In other words, the components from IMF1 to IMFm+1 are effective.

2.3.3. New Noise Reduction Method Based on the Improved Threshold Wavelet and EMD by Dominant Eigenvalue

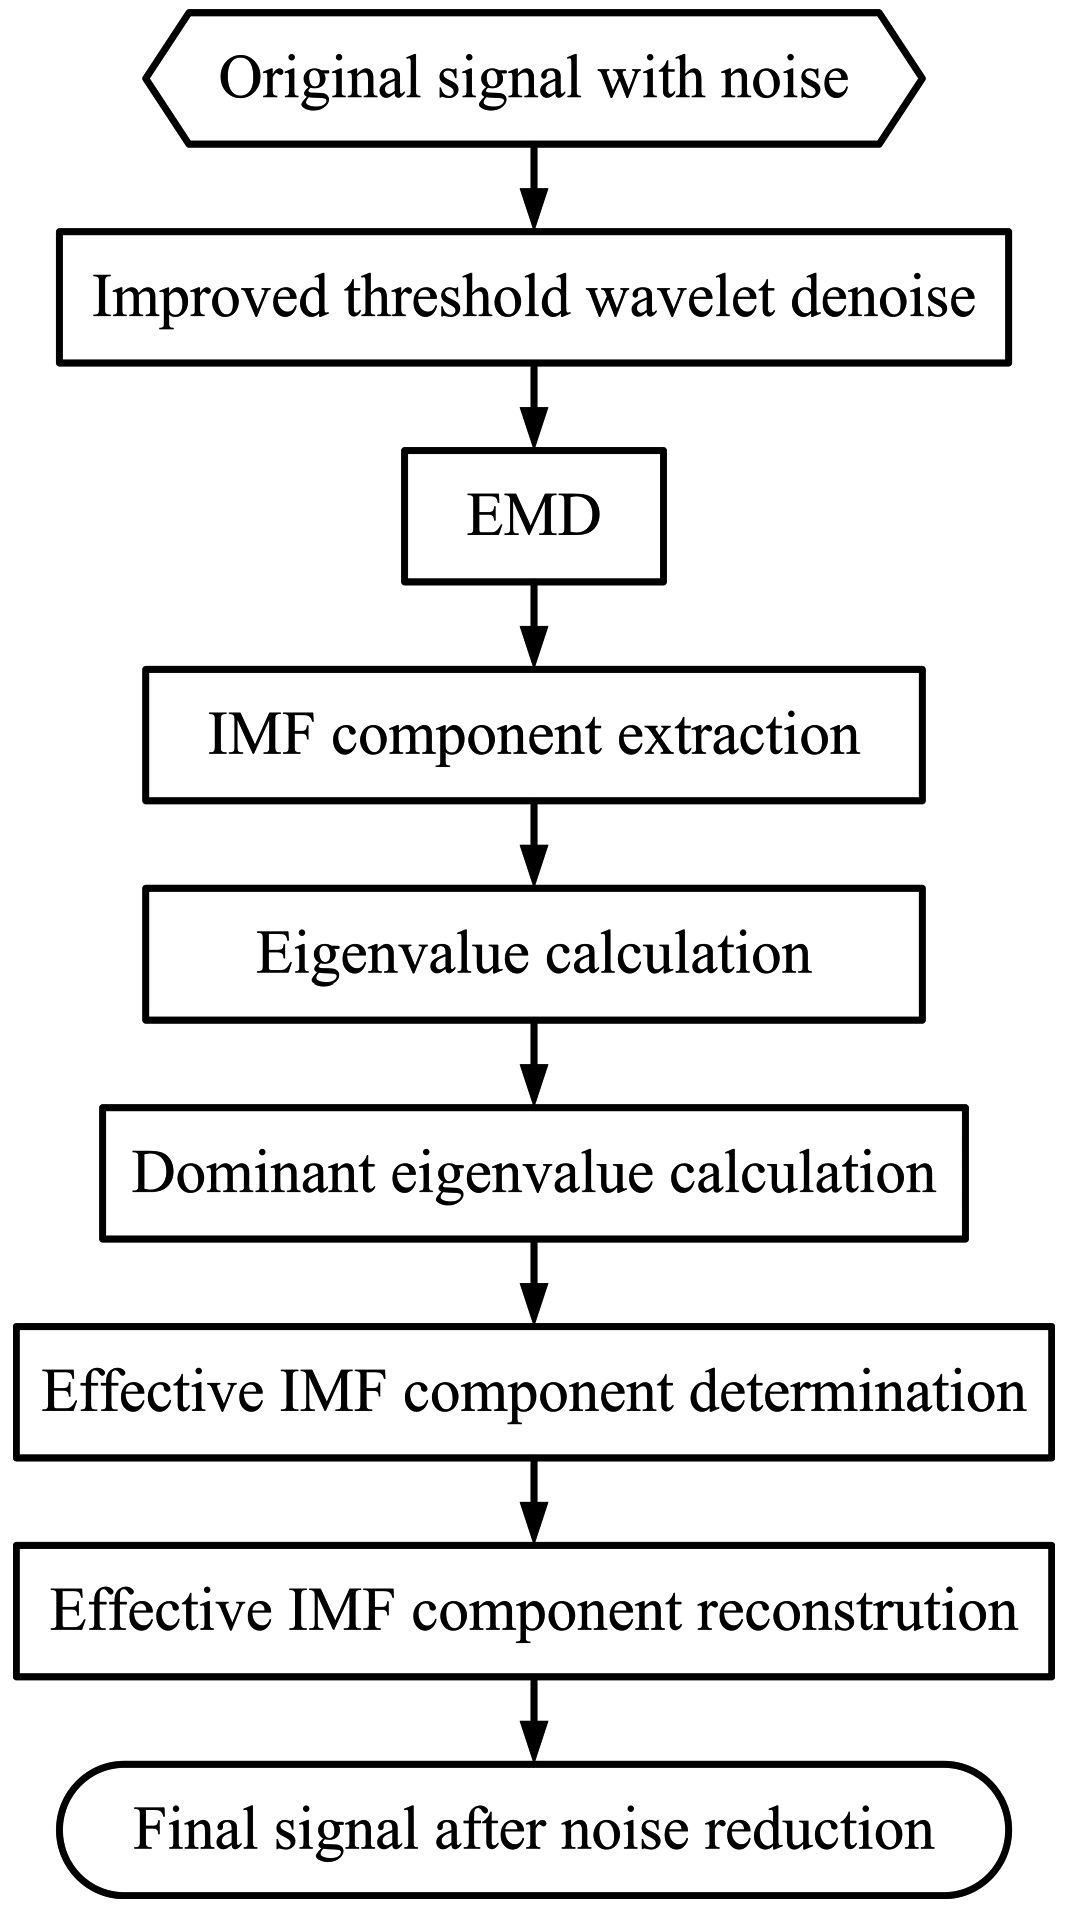
The newly proposed method by combined use of the improved threshold wavelet and EMD with the dominant eigenvalue can be carried out according to the process shown in Figure 5. Firstly, the improved threshold wavelet denoise and EMD are carried out in sequence, then the IMF component is extracted. Secondly, the eigenvalue is calculated and then the dominant eigenvalue is obtained. Finally, the effective IMF component is determined and then the signal is reconstructed.

3. Verification of Noise Reduction Method by Combined Use of Improved Wavelet and EMD

3.1. Test Rig Setup

The defect electromagnetic test rig used for the steel cord conveyor belt was built in our laboratory, as shown in Figure 6a. The belt length is 11.0 m and width is 0.8 m. The electromagnetic testing device was installed close to the lower surface of the downward belt, as shown in Figure 6b. The sensitivity of the electromagnetic transducer is 0.5 V/Gs. The location detection resolution is 0.1 mm, and the detecting speed is 0 to 8 m/s. The data transmission rate is 10 M/100 Mbps, the working temperature is −20 °C to +55 °C, and humidity is 95% RH. The detection distance is 50 mm to 110 mm. The whole electromagnetic testing system is shown in Figure 6c. The magnetic loading module was installed to magnetize the steel wire rope. The operating velocity of belt was set to 0.5 m/s by a variable frequency inverter. The data were collected by the electromagnetic testing device and transmitted to a computer by TCP/IP protocol.

3.2. Noise Reduction Evaluation Index

The main evaluation indexes of signal noise reduction effect mainly have the Signal-to-Noise Ratio (SNR) and Root Mean Square Error (RMSE). The SNR is higher or RMSE is smaller, the noise reduction effect is better.
Assuming the original signal is x ( n ) , the signal after denoising is x ( n ) , so the SNR Equation is
SNR = 10 log [ n x 2 ( n ) n [ x ( n ) x ( n ) ] 2 ]
The RMSE Equation is
RMSE = 1 n n [ x ( n ) x ( n ) ] 2

3.3. Electromagnetic Signal Collection

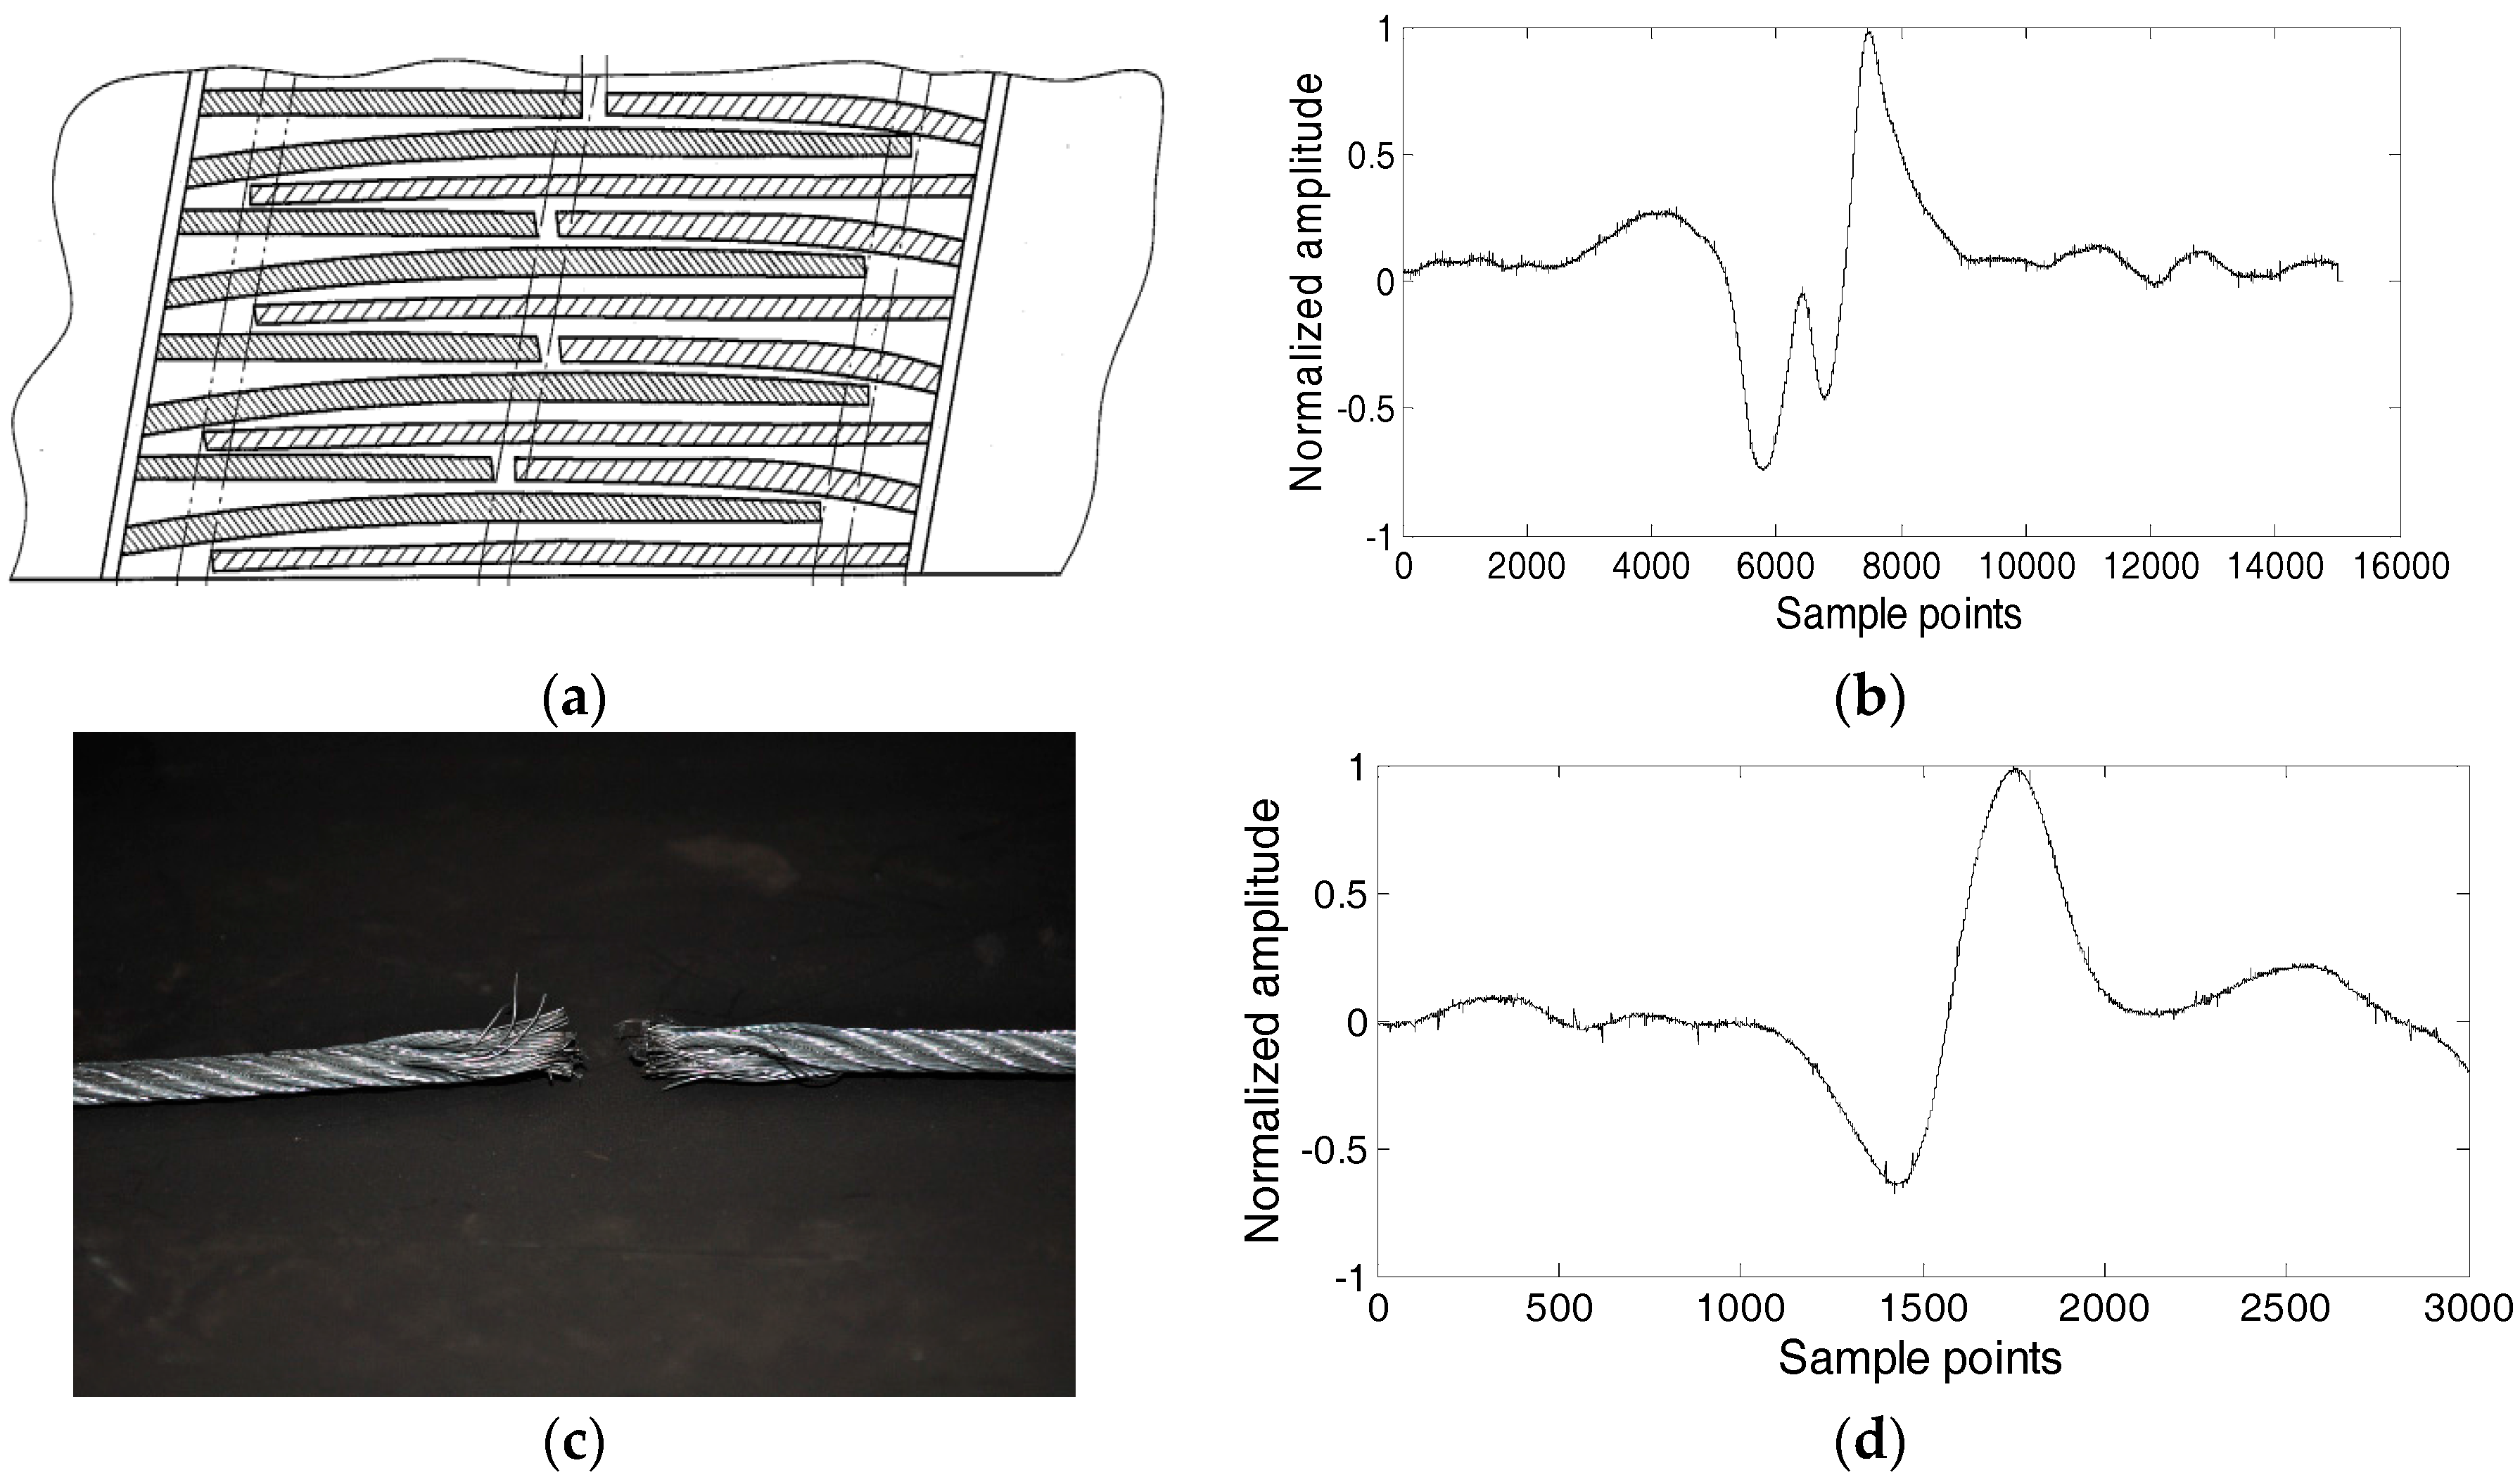
The steel cord conveyor belt joint structure, steel wire rope break photo and their respective corresponding electromagnetic signals are shown in Figure 7.

3.4. Denoising Analysis of Defect Signal

3.4.1. Noise Reduction of Joint Electromagnetic Signal

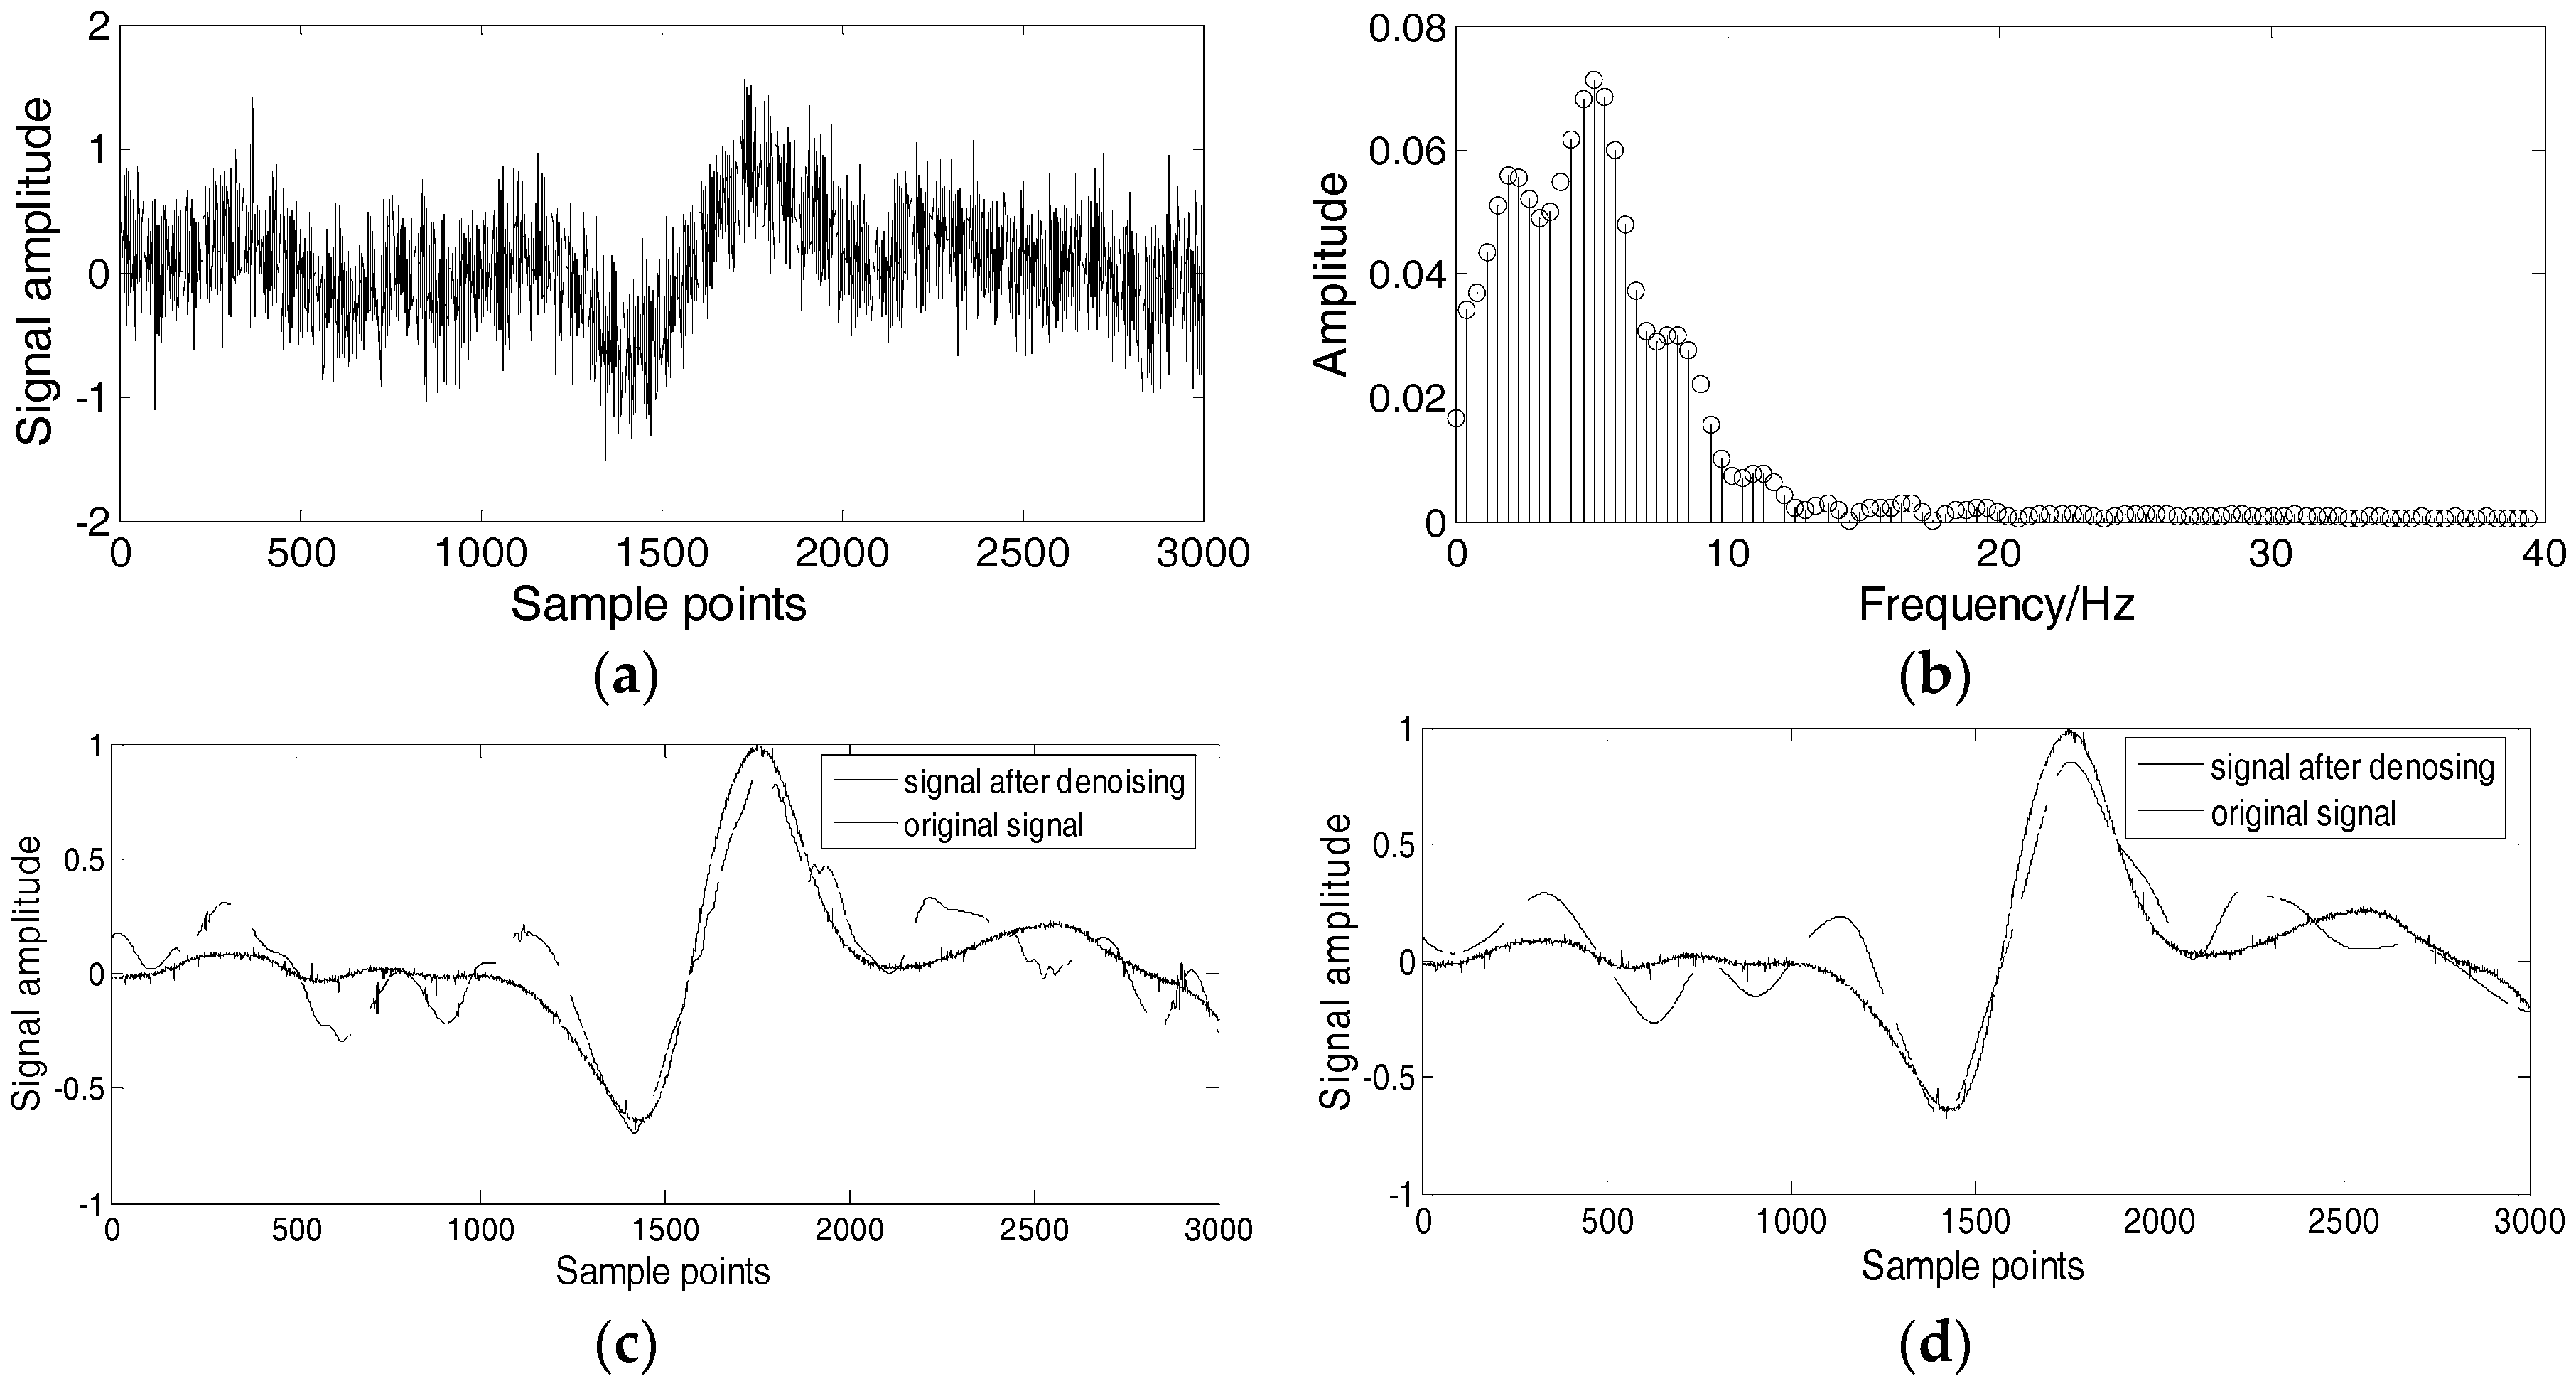
The conveyor belt joint electromagnetic signal containing the noise is shown in Figure 8a, the noise includes 10 dB Gaussian white noise and non-stationary noise with frequency and amplitude modulations, the noise function is shown in Equation (11). Figure 8b is the normalized spectrum diagram of joint electromagnetic signal with noise, it can be seen that the noise function has the same frequency band with the signal before denoising. The denoised result by the improved threshold wavelet is shown in Figure 8c, while the denoised result by combined use of improved wavelet and EMD is shown in Figure 8d.
f n o i s e = ( 0.2 + 0.2 · sin ( 2 · p i · 3 · t ) ) · cos ( 2 · p i · 5 · t + 0.2 · sin ( 2 · p i · 6 · t ) ) + 0.2 · sin ( 2 · p i · 2 · t )
Based on the experimental investigation, the wavelet basis function is selected as dB8, the threshold determination strategy is Birge-Massart, and the wavelet decomposition level is six. The eigenvalues of 11 IMF components are λ i , the ratio K i and i is shown in Table 1.
According to Table 1, ∆6 is smaller than 1.0. Thus, the selected IMF components are IMF1 to IMF7. The reconstruction result of seven IMF components is shown in Figure 8d, and two denoising methods are compared, as shown in Table 2. According to Table 2 and Figure 8c,d, the proposed method obtained by combined use of the improved wavelet and EMD has the better noise reduction effect for the non-stationary strong-noise joint electromagnetic signal and the SNR is bigger.

3.4.2. Noise Reduction of Electromagnetic Signal with Wire Rope Break

The conveyor belt steel wire rope break electromagnetic signal containing the noise is shown in Figure 9a, the noise includes 10 dB gaussian white noise and non-stationary noise with frequency and amplitude modulations, the noise function is shown in Equation (11). Figure 9b is the normalized spectrum diagram of wire rope break electromagnetic signal with noise, it can be seen that the noise function has the same frequency band as the signal before denoising. The denoised result by the improved threshold wavelet is shown in Figure 9c, while the denoised result by combined use of improved wavelet and EMD is shown in Figure 9d.
The eigenvalues of 11 IMF components are λ i , the ratio of K i and i is shown in Table 3.
According to Table 3, ∆6 is smaller than 1.0. Thus, the selected IMF components are IMF1 to IMF7. The reconstruction result of seven IMF components is shown in Figure 9d, two denoising methods are compared, as shown in Table 4. According to Table 4 and Figure 9c,d, the proposed method obtained by combined use of the improved wavelet and EMD has the better noise reduction effect for the non-stationary strong-noise wire rope break electromagnetic signal and the SNR is bigger.

4. Conclusions

Aiming at the denoising problem of the non-stationary strong-noise defect electromagnetic signal for coal mine steel cord conveyor belt, a new kind of combined use of the improved threshold wavelet and EMD with the dominant eigenvalue is proposed. The new kind of belt defect electromagnetic signal denoising method is introduced and verified by two groups of experimental test including joint defect and wire rope break. The experimental results show that the proposed method with the dominant eigenvalue can obtain the effective IMF components according to the original signal feature, and has a better noise reduction effect than the improved threshold wavelet only. Therefore, the newly proposed method in this paper can be used for the noise filtering of steel cord conveyor belt defect electromagnetic signal in order to provide a good base for further signal feature extraction in the future.

Acknowledgments

The work was financially supported by the China National Natural Science Fund (No. U1361121), the Specialized Research Fund for the Doctoral Program of Higher Education of China (No. 20136121120010) and the Scientific Research Program Funded by Shaanxi Provincial Education Department (No. 16JK1508).

Author Contributions

Hong-Wei Ma proposed the research topic and organized the research work, Hong-Wei Fan and Qing-Hua Mao wrote the manuscript, Qing-Hua Mao, Xu-Hui Zhang and Wang Xing performed the experiment and data processing.

Conflicts of Interest

The authors declare no conflict of interest.

References

  1. Sawicki, M.; Zimroz, R.; Wylomanski, A.; Stefaniak, P.; Zak, G. An automatic procedure for multidimensional temperature signal analysis of a SCADA system with application to belt conveyor components. Procedia Earth Planet. Sci. 2015, 15, 781–790. [Google Scholar] [CrossRef]
  2. Huang, M.; Pan, H.S.; Hu, C.; Wei, R.Z. A system for real-time monitoring and protecting of steel-cord belt conveyors. J. China Univ. Min. Technol. 2006, 5, 673–679. (In Chinese) [Google Scholar]
  3. Schillaci, T.; Barraco, R.; Brai, M.; Raso, G.; Bortolotti, V.; Gombia, M.; Fantazzini, P. Noise reduction in magnetic resonance images by wavelet transforms: An application to the study of capillary water absorption in sedimentary rocks. Magn. Reson. Imaging 2007, 25, 581–582. [Google Scholar] [CrossRef]
  4. Zhou, Z.J.; Wen, Z.J.; Bu, Y.Y. Application study of wavelet analysis of ultrasonic echo wave noise reduction. Chin. J. Sci. Instrum. 2009, 2, 237–241. [Google Scholar]
  5. Jin, T.; Que, P.W. Applying wavelet theory to eliminate noise of magnetic flux leakage inspecting. J. Transduct. Technol. 2003, 1, 260–262. (In Chinese) [Google Scholar]
  6. Han, W.H. A new denoising algorithm for MFL data obtained from seamless pipeline inspection. Russ. J. Nondestruct. Test. 2006, 3, 184–195. [Google Scholar] [CrossRef]
  7. Mao, Q.H.; Ma, H.W.; Zhang, X.H. Steel cord conveyor belt defect signal noise reduction method based on a combination of wavelet packet and RLS adaptive filtering. In Proceeding of the IEEE International Symposium on Computer, Consumer and Control, Xi’an, China, 4–6 July 2016.
  8. Song, D.L.; Xu, D.G.; Wang, W.; Wang, Y. The application of wavelet analysis in nondestructive testing of wire ropes. Chin. J. Sci. Instrum. 1997, 2, 150–154. [Google Scholar]
  9. Zhang, D.L.; Xu, D.G. Data compression and feature extraction of broken wires signal based on B-wavelet. Chin. J. Sci. Instrum. 1998, 3, 249–254. [Google Scholar]
  10. Zhang, Q.; Zhou, X.F.; Wang, J.; Guo, Q.G. Ultrasonic signal denoising based on improved EMD. J. Nanjing Univ. Posts Telecommun. 2016, 2, 49–55. (In Chinese) [Google Scholar]
  11. Poornachandra, S. Wavelet-based denoising using subband dependent threshold for ECG signals. Digit. Signal Process. 2008, 1, 49–55. [Google Scholar] [CrossRef]
  12. Cui, H.M.; Zhao, R.M.; Hou, Y.L. Improved threshold denoising method based on wavelet transform. Phys. Procedia 2012, 33, 1354–1359. [Google Scholar]
  13. Guo, C.C.; Wen, Y.M.; Li, P.; Wen, J. Adaptive noise cancellation based on EMD in water-supply pipeline leak detection. Measurement 2016, 79, 188–197. [Google Scholar] [CrossRef]
  14. Li, L.M.; Chai, X.D.; Zheng, S.B.; Zhu, W.F. A denoising method for track state detection signal based on EMD. J. Signal Inf. Process. 2014, 4, 104–111. [Google Scholar]
  15. Cui, F.X.; Xu, L.L.; Zheng, X.T. A new method for noise reduction based on EMD and SVD subspaces reconstruction. J. Shaoyang Univ. 2014, 4, 12–17. (In Chinese) [Google Scholar]
  16. Huang, M.; Wang, C.F.; Li, H.M.; Yao, C.W. Application of EMD noise reduction and wavelet transform in bearing fault diagnosis. J. Acad. Armored Force Eng. 2013, 3, 39–43. [Google Scholar]
  17. Zhang, X.Y.; Xie, F.; Qiao, T.Z.; Yang, Y. Denoising algorithm for metal magnetic memory signals based on EEMD and improved semi-soft wavelet threshold. J. Taiyuan Univ. Technol. 2015, 5, 592–597. (In Chinese) [Google Scholar]
  18. Ghods, A.; Lee, H.H. Probabilistic frequency-domain discrete wavelet transform for better detection of bearing faults in induction motors. Neurocomputing 2016, 188, 206–216. [Google Scholar] [CrossRef]
  19. Shi, H.S.; Wang, Q.M. Design and experimental Mallet method based on the SURF thresholding denoisings. Compu. Digit. Eng. 2014, 4, 739–742. (In Chinese) [Google Scholar]
  20. Wang, G.X.; Chen, L.; Guo, S.; Peng, Y.; Guo, K. Application of a new wavelet threshold method in unconventional oil and gas reservoir seismic data denoising. Math. Probl. Eng. 2015, 2015, 969702. [Google Scholar] [CrossRef]
  21. Zhao, X.Z.; Ye, B.Y. Singular value decomposition packet and its application to extraction of weak fault feature. Mech. Syst. Signal Process. 2016, 70–71, 73–86. [Google Scholar] [CrossRef]
  22. Liu, J.C.; Wang, H.H.; Zhang, Y. New result on PID controller design of LTI systems via dominant eigenvalue assignment. Automatica 2015, 62, 93–97. [Google Scholar] [CrossRef]
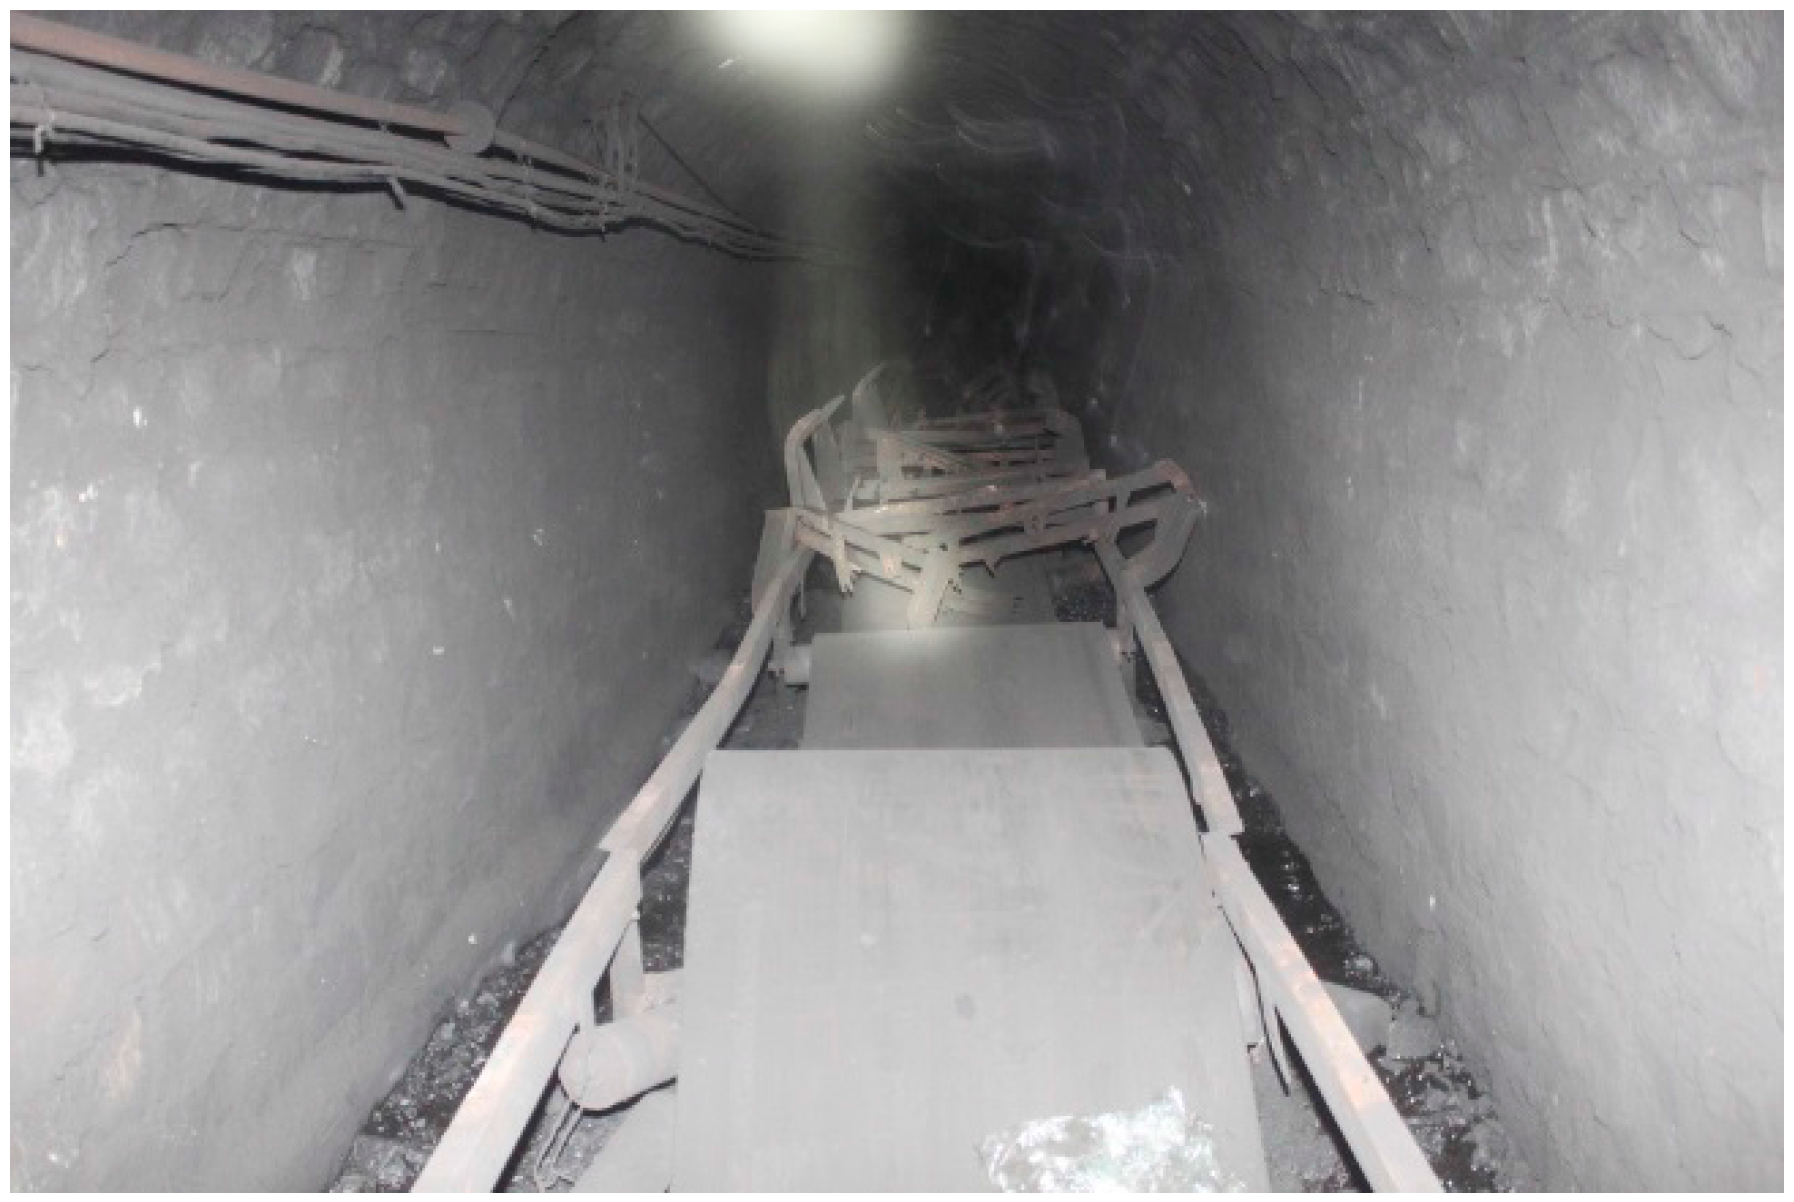
Figure 1. Steel cord conveyor belt break scene.
Algorithms 09 00062 g001
Figure 2. Wavelet threshold noise reduction flow chart.
Algorithms 09 00062 g002
Figure 3. Three kinds of threshold function curve.
Algorithms 09 00062 g003
Figure 4. EMD flow chart.
Algorithms 09 00062 g004
Figure 5. Noise reduction flow chart of combined method of improved wavelet and EMD.
Algorithms 09 00062 g005
Figure 6. Electromagnetic testing rig of steel cord conveyor belt: (a) Tested belt conveyor prototype; (b) Installed electromagnetic testing device; (c) Electromagnetic testing system setup.
Algorithms 09 00062 g006aAlgorithms 09 00062 g006b
Figure 7. Joint and break of steel cord conveyor belt and responding electromagnetic signal: (a) Internal structure of conveyor belt joint; (b) Electromagnetic signal at joint; (c) Steel wire rope break of belt; (d) Electromagnetic signal of wire rope break defect.
Algorithms 09 00062 g007
Figure 8. Comparison of two noise reduction methods for joint electromagnetic signal: (a) Joint electromagnetic signal with noise; (b) Normalized spectrum diagram of joint signal; (c) Denoised result by improved threshold wavelet; (d) Denoised result by combined use of improved threshold wavelet and EMD.
Algorithms 09 00062 g008
Figure 9. Comparison of two noise reduction methods for wire rope break electromagnetic signal: (a) Electromagnetic signal with noise of wire rope break; (b) Normalized spectrum diagram of wire rope break; (c) Denoised result by the improved threshold wavelet; (d) Denoised result by combined use of improved wavelet and EMD.
Algorithms 09 00062 g009
Table 1. IMF component, eigenvalue and ratio of joint signal.
IMF ComponentEigenvalue λ i K i = λ i λ i + 1 i = K i K i + 1
IMF129.621.681.37
IMF217.611.231.04
IMF314.341.181.008
IMF412.191.171.04
IMF510.451.121.06
IMF69.361.050.30
IMF78.913.500.82
IMF82.554.210.38
IMF90.6011.210.15
IMF100.05473.43
IMF110.00073
Table 2. Comparison of two denoising methods for joint signal.
MethodSNR (dB)RSME
Before denoising−2.720.36
Improved threshold wavelet5.0270.17
Combined use of improved threshold wavelet and EMD11.630.069
Table 3. IMF component, eigenvalue and ratio of wire rope break signal.
IMF ComponentEigenvalue λ i K i = λ i λ i + 1 i = K i K i + 1
IMF125.281.251.045
IMF220.201.201.034
IMF316.871.161.035
IMF414.571.121.034
IMF512.991.0831.025
IMF611.991.0560.21
IMF711.364.980.28
IMF82.2817.540.32
IMF90.1354.247.27 × 10−11
IMF100.00257.46 × 1011
IMF113.35 × 10−15
Table 4. Comparison of two denoising methods for wire rope break signal.
MethodSNR(dB)RSME
Before denoising−0.760.34
Improved threshold wavelet6.420.14
Combined use of improved threshold wavelet and EMD7.080.13