Abstract
Economic dispatch is an important non-linear optimization task in power systems. In this process, the total power demand is distributed amongst the generating units such that each unit satisfies its generation limit constraints and the cost of power production is minimized. This paper presents an over view of three optimization algorithms namely real coded genetic algorithm, particle swarm optimization and a relatively new optimization technique called bat algorithm. This study will further propose modifications to the original bat. Simulations are carried out for two test cases. First is a six-generator power system with a simplified convex objective function. The second test case is a five-generator system with a non-convex objective function. Finally the results of the modified algorithm are compared with the results of genetic algorithm, particle swarm and the original bat algorithm. The results demonstrate the improvement in the Bat Algorithm.
1. Introduction
Economic load dispatch (ELD) is an optimization problem for scheduling generator outputs to satisfy the total load demand at the least possible operating cost. ELD problem is often formulated as a quadratic equation [1]. The ELD problem is in reality a nonconvex optimization problem [2]. These arise from ramp rate limits due to the physical limitations of the generating unit, effect of steam valve operation and prohibited operating zones of the generators due to vibration if the shaft bearing.
The conventional method of solving the ELD problem is by applying nonlinear programming techniques. These techniques minimize a convex objective function over a convex set thus insuring a single minimum. The problems can then be minimized using gradient or Newton based search techniques. However as nonconvex problems generally have multiple minima these techniques may be trapped at local minima. Dynamic programming is one way solving this problem, but it also has limitations due to the “curse of dimensionality” [3].
Metaheuristic optimization is another way of solving nonconvex optimization problems [4]. These algorithms are usually based on processes witnessed in physics or biology. Metaheuristic techniques are ideal for nonconvex ELD problem as they do not suffer from restriction of continuity, differentiability and convexity. Many metaheuristic techniques such as simulated annealing (SA), tabu search (TS), genetic algorithm (GA), particle swarm optimization (PSO) and bat algorithm (BA) have been successfully implemented to solve ELD problem [5,6].
Many variants of GA have previously been used with good results to solve nonconvex ELD problems [7,8,9]. The main advantage GA has over other algorithms is that it can use a chromosome coding technique tailored to the specific problem. The two main disadvantages of GA over other techniques are firstly, there is no guarantee of convergence to the global optimum solution and secondly, the execution time is very long.
PSO and many of its variants have also been extensively used for solving nonconvex ELD problems [10,11,12,13]. PSO has numerous advantages over other algorithms. It is very easy to preform and has only a few adjustable parameters. It is also very efficient in global search (exploration). The main disadvantages of PSO are it is slow convergence at refined search stage (exploitation) and its weak local search ability.
BA like PSO and GA is a relatively new population based metaheuristic approach [14,15]. This algorithm mimics the echolocation ability of micro bat which they use it for navigating and hunting. The position of the bat provides the possible solution of the problem. Fitness of the solution is specified by the best position of a bat to its prey. A big advantage BA has over other algorithms is that it has a number of tunable parameters giving a greater control over the optimization process. BA and its variants have also been used to solve the ELD problem [16,17,18]. It has proven efficient in for lower dimensional optimization problem but ineffective for high dimensional problems because of fast initial convergence [19].
This paper proposes two modifications to the original BA. The first modification is inspired from anti predatory PSO in which the particles moves not only towards the best solution but also away worst position experienced by itself and the global worst solution. The intention behind this modification is increasing the exploration capacity of the algorithm. The second modification is the introduction of a nonlinear weight for the velocity called inertia weight factor (IWF). The purpose of IWF is to provide balance between global and local exploration and better convergence rate.
For the purpose of comparison GA and PSO are also implemented and the results are compared with the modified bat algorithm (MBA). Verification of the modified algorithm has been carried out by simulating two test cases. For the verification of the results, Lambda Iteration method has been used for the convex optimization problem.
2. Problem Formulation
2.1. Problem Objectives
The objective of the economic dispatch problem is minimization of operating cost. The generator cost curves are represented by a quadratic function with a sine component. The sine component denotes the effect of steam valve operation. The fuel cost ($/h) can be expressed as [10].
where is the number of generating units. , , , and are the cost coefficients of the th generating unit. is the real power output of the th generator.
2.2. Problem Constraints
Power balance constraint. Generation should cover the total demand and the active power losses that occur in the transmission system.
Power generation limits. Each unit should generate power within its minimum and maximum limits.
The objective and constraints can be mathematically formulated as follows.
3. Bat Algorithm
Bat algorithm is a population based metaheuristic optimization technique like PSO and GA. It was developed by Xin-She Yang in 2010 [14,15]. The algorithm mimics the echolocation behavior most prominent in bats. Bats send out streams of high-pitched sounds usually short and loud. These signals then bounce off nearby objects and send back echoes. The time delay between the emission and echo helps a bat navigate and hunt. This delay is used to interpret how far away an object is. Bats use frequencies ranging from 200 to 500 kHz. In the algorithm pulse rate ranges from 0 to 1 where 0 means no emissions and 1 means maximum emissions.
At the start the populations is initialized randomly. The positions of the bats are updated using the following equations.
4. Modifications
This paper proposes two modifications to the original bat algorithm.
4.1. Add Bad Experience Component
A new variant to the classical PSO was introduced by Selvakumar and Thanushkodi by splitting the correction component into two components [10]. These components were called the good and bad experience components. A particle tries to achieve a better position while trying to avoid the bad positions it has encountered. This paper proposes to add bad experience component to the velocity update equation. This modification is intended for enhancing the exploration capability of the algorithm. The modified equation is can be mathematically written as:
where and are the global best and worst positions. and are the personal best and worst positions. and are parameters that accelerate the particle towards the global best and personal best positions respectively. and are constants that accelerate the particle away the swarm worst and personal worst positions respectively.
4.2. Nonlinear Inertia Weight
A variant of the bat algorithm called improved bat algorithm (IBA) has recently been presented by Jamil [20]. He proposed adding an inertia weight coefficient to the velocity component in the velocity update equation. The paper proposes the weight component decrease linearly from its maximum value to its minimum value. The purpose of the weight is to provide balance between global and local exploration and better convergence rate. This paper proposes using a nonlinear weight. The reason for using nonlinear weight is to have to ability to control the transition between the global and local exploitation so that it can be tailored for a specific problem. In this paper the following three equations have been derived to get a better control over the transition between global and local exploitation.
The constants and are tunable parameters that can be adjusted for a particular problem. The constant controls the transition from global to local search. Constsnt G controls the speed of the transition. The equations derived in (20) and (21) make it easier to tune the parameters A and B for the optimization problem. The value of is set between 0 and and the value of G is set between 1 and 30. Figure 1 shows the effect of tuning variable G while H is kept constant at 250. Figure 2 shows the effect of tuning H while keeping G constant at 10. In both graphs the upper and lower bounds for inertia weight are 1 and 0 respectively.
The final form of the modified velocity update equation is given below.
The following flowcharts detail the bat algorithm and the modified bat algorithm.
5. Experiments and Results
5.1. Test Case 1—Six-Generator Test System with System Losses
The modified bat algorithm was applied to a six-generator test system. For the first test case, the values of parameters and have been set to zero to simplify the problem into a convex optimization problem. Two simulations were carried out for a total demand of 700 MW and 800 MW. For all the experiments the maximum allowable error tolerance was set to 0.01 MW. The data for the test system is given in Table 1, Table 2 and Table 3.

Table 1.
Generator active power limits.
| Generator | 1 | 2 | 3 | 4 | 5 | 6 |
|---|---|---|---|---|---|---|
| Pmin (MW) | 10 | 10 | 35 | 35 | 130 | 125 |
| Pmax (MW) | 125 | 150 | 225 | 210 | 325 | 315 |
Table 2.
Fuel cost coefficients.
| No. | a | b | c |
|---|---|---|---|
| 1 | 0.15240 | 38.53973 | 756.79886 |
| 2 | 0.10587 | 46.15916 | 451.32513 |
| 3 | 0.02803 | 40.39655 | 1049.9977 |
| 4 | 0.03546 | 38.30553 | 1243.5311 |
| 5 | 0.02111 | 36.32782 | 1658.5596 |
| 6 | 0.01799 | 38.27041 | 1356.6592 |
Table 3.
Optimization parameters.
| Parameter | Value |
|---|---|
| 0.9 | |
| 0.1 | |
| [0.97 0.95] | |
| [0.4 0.9] | |
| 2000 | |
| [10 200] |
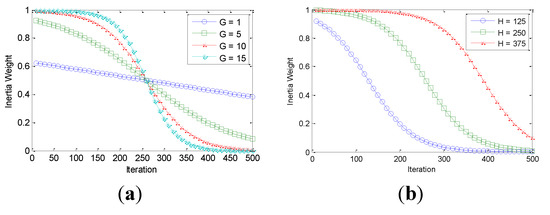
Figure 1.
(a) Effect of tuning parameter G; (b) Effect of tuning parameter H.
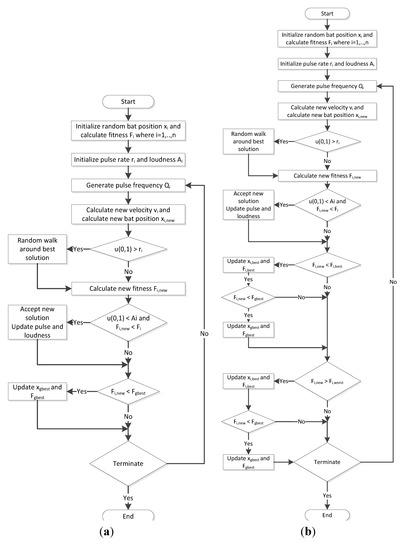
Figure 2.
(a) Bat Algorithm (b); Modified Bat Algorithm.
For the purpose of comparison real coded GA was used with roulette wheel selection, arithmetic crossover and uniform mutation. The crossover and mutation probabilities were 0.9 and 0.02 respectively. Also for the purpose of comparison, PSO was implemented with inertia weight decreasing linearly form 0.9 to 0.4. Velocity constant was set to 2 for all the experiments. Values used for the tuning parameters while simulating test case 1 are in Table 3. The results are presented in Table 4.
In the first experiment MBA attained better results than the original BA. The mean and standard deviation reduced by $0.41 and 16% respectively. However, PSO performed better that the both of them by achieving the lowest mean. The worst value achieved by PSO was $36927.72 which was far greater than $36916.93 (BA) and $36916.12 (MBA). This resulted in a higher standard deviation for PSO.
Table 4.
Economic dispatch comparison.
| P1 (MW) | P2 (MW) | P3 (MW) | P4 (MW) | P5 (MW) | P6 (MW) | Loss (MW) | Cost ($/h) | ||
|---|---|---|---|---|---|---|---|---|---|
| λ Iteration | 28.304 | 10 | 118.897 | 118.733 | 230.733 | 212.831 | 19.433 | 36912.14 | |
| GA | Best | 26.79976 | 15.89313 | 107.3073 | 123.932 | 228.3426 | 217.1609 | 19.44 | 36924.15 |
| Avg. | 45.57365 | 48.619 | 105.8057 | 106.478 | 211.4508 | 200.6767 | 18.61 | 37505.72 | |
| Std | 19.7706 | 28.6733 | 43.3288 | 36.2062 | 45.62 | 45.0436 | 1.325 | 382.88 | |
| PSO | Best | 28.30223 | 9.999884 | 118.9522 | 118.6706 | 230.7563 | 212.7375 | 19.431 | 36911.54 |
| Avg. | 28.39792 | 10.02338 | 119.0863 | 118.5947 | 230.588 | 212.7238 | 19.4262 | 36911.75 | |
| Std | 0.85864 | 0.13943 | 0.83555 | 0.62292 | 1.1889 | 0.4948 | 0.027862 | 1.4869 | |
| BA | Best | 28.07394 | 10.05693 | 119.9855 | 117.7729 | 231.1333 | 212.3918 | 19.4238 | 36911.79 |
| Avg. | 28.39414 | 10.26771 | 119.159 | 119.0363 | 230.2951 | 212.2449 | 19.4092 | 36912.54 | |
| Std | 0.69285 | 0.26761 | 2.2262 | 1.7091 | 2.9539 | 3.8 | 0.059993 | 1.0006 | |
| MBA | Best | 28.14831 | 10.03893 | 119.7243 | 118.052 | 231.0219 | 212.4194 | 19.4239 | 36911.27 |
| Avg. | 28.28837 | 10.21736 | 119.3942 | 118.6366 | 230.4744 | 212.3904 | 19.4146 | 36912.13 | |
| Std | 0.73114 | 0.19558 | 2.485 | 1.8194 | 3.38 | 3.6097 | 0.065668 | 0.84625 | |
Total System Demand = 700 MW, Population Size = 40, Maximum Iterations = 500, Sample Size = 200.
In the next experiment the total system demand was increased from 700 MW to 800 MW. The system parameters remained the same. The results of the experiment are detailed in Table 5.
Table 5.
Economic dispatch comparison.
| P1 (MW) | P2 (MW) | P3 (MW) | P4 (MW) | P5 (MW) | P6 (MW) | Loss (MW) | Cost ($/h) | ||
|---|---|---|---|---|---|---|---|---|---|
| λ Iteration | 32.599 | 14.483 | 141.544 | 136.041 | 257.6588 | 243.003 | 25.330 | 41896.63 | |
| GA | Best | 39.63015 | 13.23341 | 170.317 | 155.1286 | 232.4949 | 213.4204 | 24.2359 | 41976.08 |
| Avg. | 55.35765 | 54.95395 | 130.4268 | 134.2949 | 230.3903 | 218.5409 | 23.9787 | 42614.68 | |
| Std | 25.9155 | 30.1187 | 45.3717 | 39.9879 | 49.7911 | 45.6905 | 1.3105 | 436.61 | |
| PSO | Best | 32.59937 | 14.48227 | 141.5412 | 136.0392 | 257.6555 | 242.9997 | 25.3299 | 41895.98 |
| Avg. | 32.5959 | 14.51256 | 141.4859 | 135.9388 | 257.6442 | 243.1419 | 25.3322 | 41896.02 | |
| Std | 0.19817 | 0.2575 | 0.31681 | 0.66662 | 0.33471 | 0.86126 | 0.020216 | 0.23259 | |
| BA | Best | 32.46774 | 14.34427 | 141.9097 | 135.7294 | 257.7276 | 243.1421 | 25.3359 | 41895.88 |
| Avg. | 32.58662 | 14.49149 | 141.7122 | 136.2057 | 257.3597 | 242.9548 | 25.3232 | 41896.17 | |
| Std | 0.38275 | 0.49502 | 0.97076 | 0.88628 | 1.2144 | 1.3829 | 0.037035 | 0.25826 | |
| MBA | Best | 32.49975 | 14.43056 | 141.6805 | 135.9817 | 257.502 | 243.2203 | 25.3329 | 41895.71 |
| Avg. | 32.6766 | 14.35507 | 142.1353 | 135.802 | 257.5361 | 242.803 | 25.3222 | 41896.09 | |
| Std | 0.12392 | 0.37326 | 0.61012 | 0.59674 | 0.31035 | 1.0403 | 0.03666 | 0.21975 | |
Total System Demand = 800 MW, Population Size = 40, Maximum Iterations = 500, Sample Size = 200.
In the second experiment the MBA again out performed BA. The mean and standard deviation reduced by $0.08 and 15% respectively. In this experiment also PSO achieved the lowest mean. It is important to note that in both the experiments MBA attained the lowest standard deviation.
5.2. Test Case 2–Five-Generator Test System with System Losses
The second test case was a five-generator system. Simulation was carried out for a total demand of 730 MW. This test case included the added effect of steam valve operation and thereby resulting in non-convex optimization problem. Transmission line losses were neglected for this experiment. The data for the test system is given in Table 6 and Table 7, the results are presented in Table 8.
Table 6.
Generator active power limits.
| Generator | 1 | 2 | 3 | 4 | 5 |
|---|---|---|---|---|---|
| Pmin (MW) | 50 | 20 | 30 | 10 | 40 |
| Pmax (MW) | 300 | 125 | 175 | 75 | 250 |
Table 7.
Fuel cost coefficients.
| No. | |||||
|---|---|---|---|---|---|
| 1 | 0.0015 | 1.8 | 40 | 200 | 0.035 |
| 2 | 0.0030 | 1.8 | 60 | 140 | 0.040 |
| 3 | 0.0012 | 2.1 | 100 | 160 | 0.038 |
| 4 | 0.0080 | 2.0 | 25 | 100 | 0.042 |
| 5 | 0.0010 | 2.0 | 120 | 180 | 0.037 |
Table 8.
Economic dispatch comparison.
| P1 (MW) | P2 (MW) | P3 (MW) | P4 (MW) | P5 (MW) | Cost ($/h) | ||
|---|---|---|---|---|---|---|---|
| GA | Best | 234.82 | 100.92 | 112.80 | 71.46 | 209.99 | 2068.06 |
| Avg. | 253.89 | 91.39 | 127.71 | 49.37 | 207.62 | 2357.02 | |
| Std | 29.12 | 19.19 | 27.23 | 15.85 | 23.30 | 111.80 | |
| PSO | Best | 229.51 | 102.98 | 112.67 | 75.00 | 209.81 | 2029.63 |
| Avg. | 248.71 | 94.28 | 126.39 | 55.04 | 205.56 | 2165.08 | |
| Std | 30.85 | 19.33 | 27.77 | 23.06 | 26.58 | 104.24 | |
| BA | Best | 229.14 | 101.30 | 114.05 | 74.26 | 211.23 | 2042.88 |
| Avg. | 250.69 | 90.03 | 133.26 | 53.18 | 202.84 | 2176.06 | |
| Std | 38.69 | 26.89 | 32.47 | 27.81 | 28.00 | 106.92 | |
| MBA | Best | 231.06 | 99.59 | 113.48 | 74.42 | 211.44 | 2032.23 |
| Avg. | 256.94 | 96.53 | 131.55 | 47.81 | 197.14 | 2141.50 | |
| Std | 35.60 | 17.06 | 29.09 | 29.65 | 30.24 | 95.39 |
Total System Demand = 730 MW, Population Size = 40, Maximum Iterations = 500, Sample Size = 100
For this experiment and were reduced to was set at 6 and was set at 350. In this test case MBA produced the best results in comparison to GA, PSO and BA. The mean attained by MBA is $23.58 and $34.56 lower than PSO and BA respectively. It also achieved the lowest standard deviation which is 8.5% and 10.8% lower that PSO and BA.
6. Conclusions
This paper proposes two modifications to the original bat algorithm. The modified algorithm is then tested for solving the economic load dispatch problem and was compared with various metaheuristic optimization techniques. The proposed modifications improved the results. One important observation from the results of all three experiments is that MBA achieved the lowest standard deviation. It can hence be deduced that MBA is the most robust algorithm for the experiments performed. This work can be extended to test the algorithm’s robustness for high dimensional problems or for multi objective optimization problems.
Author Contributions
All the authors contributed equally to the content of this paper. Aadil Latif conducted the simulations, collected the results and prepared the initial draft. Peter was responsible for the major reviews. Both authors discussed the results before the publishing them.
Conflicts of Interest
The authors declare no conflict of interest.
References
- Saadat, H. Power System Analysis. Available online: http://www.psapublishing.com/ (accessed on 1 July 2014).
- Kothari, D.P. Power system optimization, 2nd ed.Ghosh, A.K., Ed.; PHI Learning Private Limited: New Dehli, India, 2012. [Google Scholar]
- Li, L.; Sun, Z. Dynamic Energy Control for Energy Efficiency Improvement of Sustainable Manufacturing Systems Using Markov Decision Process. Syst. Man Cybern. Syst. IEEE Trans. 2013, 43, 1195–1205. [Google Scholar] [CrossRef]
- Fletcher, R. Practical Methods of Optimization; John Wiley & Sons: Chichester, SXW, UK, 2013. [Google Scholar]
- Frank, S.; Steponavice, I.; Rebennack, S. Optimal power flow: A bibliographic survey I. Energy Syst. 2012, 3, 221–258. [Google Scholar] [CrossRef]
- Frank, S.; Steponavice, I.; Rebennack, S. Optimal power flow: A bibliographic survey II. Energy Syst. 2012, 3, 259–289. [Google Scholar] [CrossRef]
- Abido, M.A. A niched Pareto genetic algorithm for multiobjective environmental/economic dispatch. Int. J. Electr. Power Energy Syst. 2003, 25, 97–105. [Google Scholar] [CrossRef]
- Subbaraj, P.; Rengaraj, R.; Salivahanan, S. Enhancement of self-adaptive real-coded genetic algorithm using Taguchi method for economic dispatch problem. Appl. Soft Comput. 2011, 11, 83–92. [Google Scholar] [CrossRef]
- Amjady, N.; Nasiri-Rad, H. Solution of nonconvex and nonsmooth economic dispatch by a new adaptive real coded genetic algorithm. Expert Syst. Appl. 2010, 37, 5239–5245. [Google Scholar] [CrossRef]
- Selvakumar, A.I.; Thanushkodi, K. A new particle swarm optimization solution to nonconvex economic dispatch problems. Power Syst. IEEE Trans. 2007, 22, 42–51. [Google Scholar] [CrossRef]
- Selvakumar, A.I.; Thanushkodi, K. Anti-predatory particle swarm optimization: Solution to nonconvex economic dispatch problems. Electr. Power Syst. Res. 2008, 78, 2–10. [Google Scholar] [CrossRef]
- Gaing, Z.-L. Particle swarm optimization to solving the economic dispatch considering the generator constraints. Power Syst. IEEE Trans. 2003, 18, 1187–1195. [Google Scholar] [CrossRef]
- Cai, J.; Ma, X.; Li, L.; Haipeng, P. Chaotic particle swarm optimization for economic dispatch considering the generator constraints. Energy Convers. Manag. 2007, 48, 645–653. [Google Scholar] [CrossRef]
- Yang, X.S. A new metaheuristic bat-inspired algorithm. In Nature Inspired Cooperative Strategies for Optimization (NICSO 2010); Springer: Berlin, Heidelberg, Germany, 2010; pp. 65–74. [Google Scholar]
- Yang, X.S.; He, X. Bat algorithm: Literature review and applications. Int. J. Bioinspired Comput. 2013, 5, 141–149. [Google Scholar] [CrossRef]
- Sidi-Bel-Abbes, A. Economic dispatch problem using bat algorithm. Leonardo J. Sci. 2014, 24, 75–84. [Google Scholar]
- Niknam, T.; Azizipanah-Abarghooee, R.; Zare, M.; Bahmani-Firouzi, B. Reserve constrained dynamic environmental/economic dispatch: A new multiobjective self-adaptive learning bat algorithm. Syst. J. IEEE 2012, 7, 763–776. [Google Scholar] [CrossRef]
- Ramesh, B.; Chandra Jagan Mohan, V.; Veera Reddy, V.C. Application of bat algorithm for combined economic load and emission dispatch. Int. J. Electr. Eng. Telecommun. 2013, 2, 1–9. [Google Scholar]
- Fister, I., Jr.; Fister, D.; Yang, X.-S. A hybrid bat algorithm. Elektroteh. Vestn. 2013, 80, 1–7. [Google Scholar]
- Jamil, M.; Zepernic, H.-J.; Yang, X.S. Improved bat algorithm for global optimization. Appl. Soft Comput. 2013. submitted for publication. [Google Scholar]
© 2014 by the authors; licensee MDPI, Basel, Switzerland. This article is an open access article distributed under the terms and conditions of the Creative Commons Attribution license (http://creativecommons.org/licenses/by/3.0/).