Article

Extraction and Segmentation of Sputum Cells for Lung Cancer Early Diagnosis

1
Department of Electrical and Computer Engineering, Khalifa University, Sharjah, UAE
2
Department of Computer Engineering, University of Osnabrueck, Osnabrueck, Germany
*
Author to whom correspondence should be addressed.
Algorithms 2013, 6(3), 512-531; https://doi.org/10.3390/a6030512
Submission received: 12 November 2012 / Revised: 14 August 2013 / Accepted: 15 August 2013 / Published: 21 August 2013
(This article belongs to the Special Issue Machine Learning for Medical Imaging 2012)

Abstract

:
Lung cancer has been the largest cause of cancer deaths worldwide with an overall 5-year survival rate of only 15%. Its symptoms can be found exclusively in advanced stages where the chances for patients to survive are very low, thus making the mortality rate the highest among all other types of cancer. The present work deals with the attempt to design computer-aided detection or diagnosis (CAD) systems for early detection of lung cancer based on the analysis of sputum color images. The aim is to reduce the false negative rate and to increase the true positive rate as much as possible. The early detection of lung cancer from sputum images is a challenging problem, due to both the structure of the cancer cells and the stained method which are employed in the formulation of the sputum cells. We present here a framework for the extraction and segmentation of sputum cells in sputum images using, respectively, a threshold classifier, a Bayesian classification and mean shift segmentation. Our methods are validated and compared with other competitive techniques via a series of experimentation conducted with a data set of 100 images. The extraction and segmentation results will be used as a base for a CAD system for early detection of lung cancer which will improve the chances of survival for the patient.

1. Introduction

Lung cancer is considered the leading cause of cancer death throughout the world. More people die because of lung cancer than any other type of cancer such as breast, colon, and prostate cancers. Optimistically, there is significant evidence indicating that the early detection of lung cancer will decrease the mortality rate, by using asymptomatic screening methods, followed by effective treatment.
Lung cancer symptoms consist of shortness of breath, wheezing, chest pain that does not get better, coughing accompanied with blood, difficulty in swallowing, and loss of weight and appetite [1]. The most recent estimate statistics according to the American Cancer Society indicate that 226,160 new cases will be diagnosed (116,470 in men and 109,690 in women) in US, and there will be estimated 160,340 mortalities from lung cancer (87,750 in men and 72,590 among women) [2]. Furthermore, based on statistics from the World Health Organization (WHO), deaths caused by cancer will reach about 12 million people in 2030.
Lung cancer is projected to continue killing more people than any other type, unless the efforts to control the main cause of cancer death are largely intensified. There are many techniques to diagnose lung cancer, such as Chest Radiograph (x-ray), Computed Tomography (CT) [3], Magnetic Resonance Imaging (MRI scans) and Sputum Cytology [4]. However, most of these techniques are expensive and time consuming. In most cases, these techniques detect lung cancer in its advanced stages, where the patient’s chance of survival is very low. Thus, there is a substantial demand for a new technology to diagnose lung cancer in its early stages. Image processing techniques provide a superior quality tool for improving the manual analysis. Among all the previous techniques, only the manual sputum cytological examination has been utilized for the diagnosis of early lung cancer detection since 1930s [5].
The goal of this research is to design a Computer Aided Diagnosis (CAD) system for early detection of malignant lung cancer cells using digital images of stained sputum smears. Such an automated system would allow objective and unbiased assessment, as compared to human evaluation which might be corrupted by errors originating from inter-and intra-observer variability that characterizes human observation. Eventually, this system will be useful for handling large sputum image databases and relieving the pathologist from tedious and routine task.
In this paper, we focus on the extraction and segmentation of sputum cells from background regions. The sputum images are stained according to the Papanicolaou standard staining method [6] provided by the Tokyo Center for lung cancer in Japan. These images are stained with two types. Type1, blue dye images resulting in the dark-blue nucleus of all the cells present in the image and clear-blue cytoplasm. Type 2, red dye images resulting in the dark-blue nucleus of the small debris cells with their corresponding small clear-blue cytoplasm regions, and red sputum cell with dark-red nucleus and clear-red cytoplasm. Some of the sputum nuclei cells overlap due to the dispersion of the cytoplasm in the staining process.
The automatic assessment of the sputum cell state, using the sputum image, is based on the analysis of both the chromatic and geometric attribute of its nucleus and cytoplasm, therefore this process involves the extraction of their related regions in the image. This problem is viewed as a segmentation problem whereby we want to partition the image into sputum cell regions including the nuclei and cytoplasm, plus the background that includes all the rest. Nevertheless, the sputum images are characterized by noisy and cluttered background patterns that cause the segmentation and automatic detection of the cancerous cells highly problematic.
There have already been attempts to solve this problem using heuristic rules [7]. In this paper, we propose two methods for addressing this problem the first employed a threshold-based technique. The second method uses a Bayesian classification framework.
The problem of extracting the nucleus and the cytoplasm is approached using a combination of robust mean shift segmentation and rule-based techniques.
The organization of this paper is as follows: related works are described in Section 2. The methods for the sputum cell extraction and the related results are described in Section 3. Section 4 is dedicated to the cell segmentation process whereby we compare the performance or our method with other approaches. Finally, the conclusion and future work are given in Section 5.

2. Related Works

Computer vision methods are employed to elicit information from medical images, such as the detection of cancerous cells. Many diagnostic ambiguities are removed when transforming these images from its continuous to its digital form. Today, very large amounts of data are produced from medical imaging techniques, such as Computer Tomography (CT) [8], Magnetic Resonance Imaging (MRI) and Breast Thermograph [9].
In Cell-based diagnosis, pathologists always make a decision based on their observation on the cellular distribution and their geometrical parameters. Most of the time the cells are exceedingly complex and there is an overlap between the cell boundaries and the background, or inside the cell itself between the nuclei and cytoplasm, due to the different stains that have been used in the preparation process. The techniques employed in their diagnosis involve intense human interference, which is hugely time consuming and subject to bias. These factors compromise the accuracy of the decision and highlight the need for computer technology application which can be used to assist pathologists in their diagnosis [10]. A number of medical researchers have applied the analysis of sputum cells for early detection of lung cancer [11], most recently research relay of quantitative information, such as the size, shape and the ratio of the affected cells [12].
In the literature, some authors have applied the analysis techniques and feature extraction from the image processing perspective, such as in [13], where the sputum color image is used to detect the tuberculosis bacilli. The detection is done through two phases; in the first phase they used analysis techniques and feature extraction for the enhancement of the images, such as edge detection, heuristic knowledge, region labeling and removing. In the second phase, they used object recognition techniques for the automatic identification of tubercle bacilli in the images, such as k-mean clustering algorithm, multi-threshold fuzzy segmentation, and simple color filtering technique for detecting tuberculosis bacilli based on the extracted features from the first phase. After that a neural network and Gaussian distribution was used to classify the bacilli into negative and positive classes based on the following features: roundness, perimeter, elongation, area, major and minor axis length and angles, minimum and maximum gray level and gray level density [14].
The detection of lung cancer by using sputum color images which are the subject of this research was introduced in [7] where the authors presented unsupervised classification technique based on Hopfield Neural Network (HNN) to segment the sputum cells into cancer and non cancer cells, to be used in the diagnosis process. They considered each image as a multidimensional data, and each pixel is represented by its three components in the RGB image plane. They used energy function with cost term to increase the accuracy in the segmented regions, a technique which resulted in correct segmentation of sputum color image cells into nuclei, cytoplasm and clear background classes. However, the method has limitations due to the problem of early local minimum of the HNN. The HNN can make a crisp classification of the cells after removing all debris cells. The disadvantage was in the overlapping cells which are counted as one cluster.
The authors in [15] completed the works which have been done in [7] where a simple geometric feature for detecting the nuclei was used by connecting component labeling technique to determine each region in the cell. The nuclei detection was done by using region growing techniques. After that, some features are extracted such as the area of nucleus region, area of the cytoplasm region, the maximum drawable circle and the mean intensity value of the nucleus region.
Following up the work of [15], the authors in [16] came up with an automatic computer aided diagnosis (CAD) system for early detection of lung cancer based on the analysis of pathological sputum color images. The RGB color space was used to represent the color images. Two segmentation processes have been used, the first one was Fuzzy C-Mean Clustering algorithm (FCM), and the second one was the improved version of the Hopfield Neural Network for the classification of the sputum images into background, nuclei and cytoplasm. These two latter regions were used as a main feature to diagnose each extracted cell. It was found that the HNN segmentation results are more accurate and reliable than FCM clustering of all cases. The HNN succeeded in extracting the nuclei and cytoplasm regions. However, FCM failed in detecting the full nuclei. Partial detection occurred in most of the trials. In addition to that, the FCM is not sensitive to intensity variations as the segmentation error at convergence is larger with FCM compared to HNN. The proposed CAD system was tested by comparing its 100 case diagnosis to the diagnosis of an experimented pathologist of the same data, and the results showed that the CAD system and the pathologist agreed on 92% of the cases and 8% disagree, with a sensitivity of 92.5%, specificity of 69% and accuracy of 85%. While this CAD system was successful in detecting lung cancer cells, it has a number of limitations. For instance, the CAD system was associated with the high number of false positive rates, which make the chance of the patient’s survival very low. Also, the constraint of fixing the numbers of clusters by the operators might compromise in some cases the quality of the segmentation.
In [17] the authors described a method of sputum color image classification for detecting normal and abnormal cells by using computational intelligent techniques such as Tetrakis Carboxy Pheyl Porphine (TCPP). In this method the cancer cells have been labeled based on the increased number of low density. This algorithm takes into consideration the spatial information by using a region adjacency graph processing algorithm. Furthermore, they used 3D clustering and relaxation labeling approaches, where the segmentation results depend on the preprocessing step which determines the quality of the images.
CT screening modalities have been also used for the detection and diagnosis of lung cancer. In [18] the authors presented a survey using computer analysis CT scan of the chest which can constantly detect the lung cancer in its early stages, however, it has a number of limitations with high false-positive rates, because it detects a lot of non-cancerous nodules and misses many small cancers nodules in addition to its low sensitivity for central lesions, plus it is invasiveness.
In the literature, all the previous techniques have been used on medical images to detect diseases varying from tuberculosis to cancers. Methods based on sputum image analysis still suffer from a high number of false negatives, resulting in exposing a patient to unnecessary radiation and surgeries. In addition to that, most methods fail to consider the outlier pixels, which may sometimes represent a class in themselves, is resulting in cancer cells.
Moreover, the preprocessing techniques need further enhancement to discard the debris cells in the background of the images and to remove all noise from the images, in addition to the overlapping between the sputum cells which are not considered by the previous techniques. Thus, segmentation results are not accurate enough to be used in the diagnosis part. In the HNN-based method, the cluster number has to be provided in advance. This affects the feature extraction part, especially in the presence of outliers. These problems have to be overcome, and more features have to be computed to develop a successful CAD system.

3. Cell Extraction

3.1. Sputum Cell Detection

The cell detection aims at the extraction of the cell region from the sputum image. This is done by determining whether or not a pixel in the sputum image belongs to the sputum cell using its color information. The staining method, applied in the sputum sample solution, allows, to some level, the sputum cell to have a distinctive chromatic appearance vis-à-vis the background. However, the nature of the sputum color images, which contains many debris cells and the relative contrast among the cytoplasm and nuclei cells, means that the extraction process for the nuclei and cytoplasm cells is not a straightforward procedure.
The chromatic disparity between the cell and the background has been exploited in driving segmentation techniques that divide the sputum image into these two regions. Sammouda et al. [7] proposed the following heuristic rule for discriminating cell pixels from background pixels.
For the image stained with blue dye:
If (B(x, y) < G(x, y)) then B(x, y) is sputum else B(x, y) is non sputum
For the images stained with red dye:
If (R(x, y) < G(x, y) +Θ) then R(x, y) is sputum else R(x, y) is non sputum
If ((G(x, y) + Θ) < (R(x, y) + B(x, y))) then G(x, y) is sputum else G(x, y) is non sputum
In our contributions, we approached the cell detection problem using two methods. The first is a threshold based technique, which can be seen as an improvement of the method in [7]. The second method is based on a Bayesian classification. These two methods will be described in the next two sections.

3.1.1. Threshold Technique

The threshold technique depends on the staining methods by which the image is organized and derived from the difference in the brightness level in RGB components of the sputum color images. For the image stained with blue dye, the following rule is used to extract sputum pixels:
If (B(x, y) < G(x, y) + Θ) then B(x, y) is a sputum else B(x, y) is non sputum
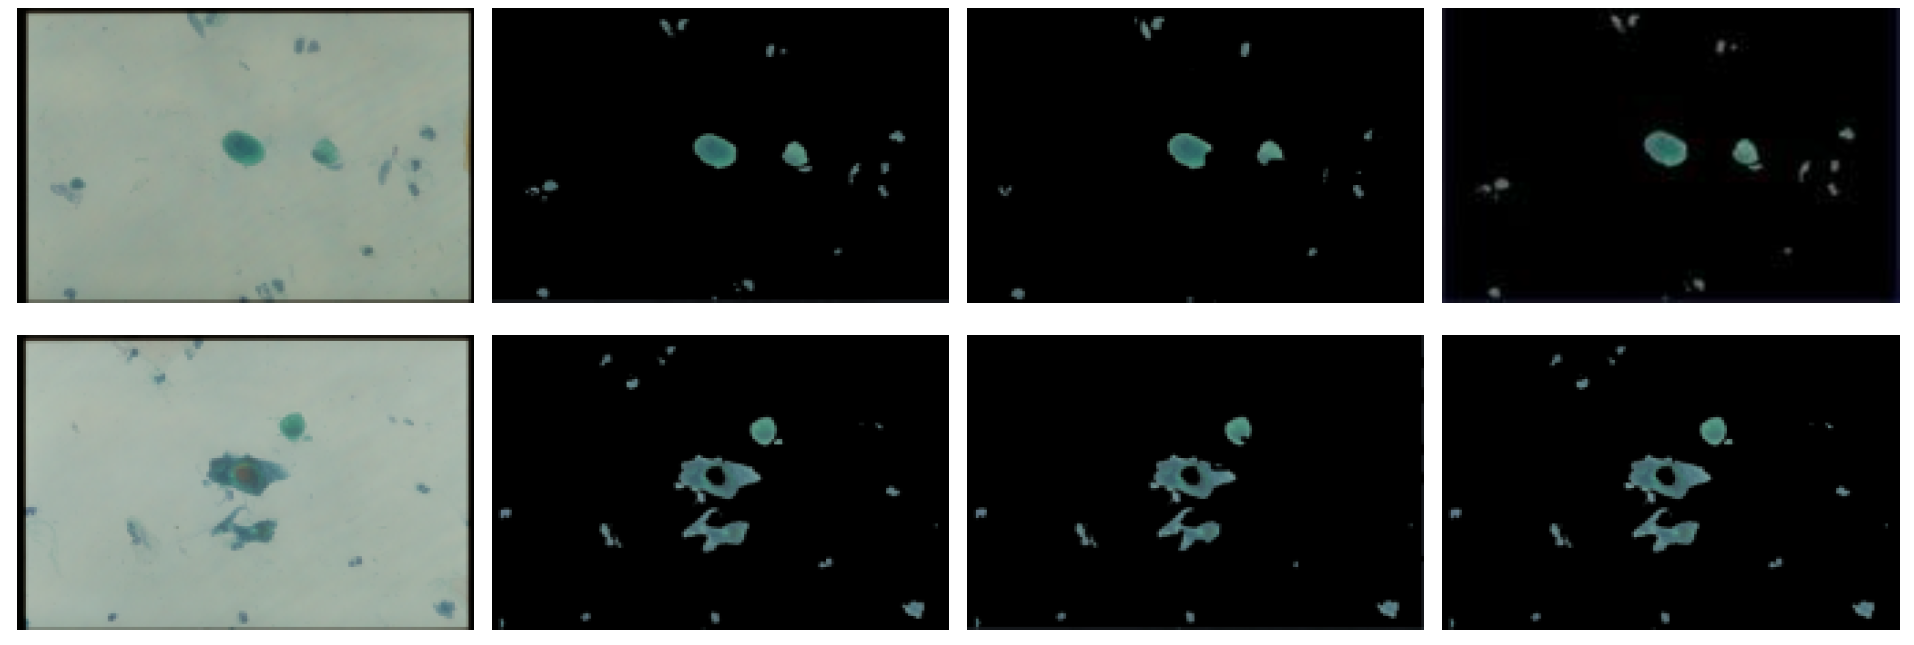
Figure 1, shows the results of applying Equation (4). The results obtained with two different threshold values. From left to right the figure depicts: the raw images, ground-truth detection which was manually segmented, results with the faulty threshold value, and results with a correct threshold.
Figure 1. Examples of threshold segmentation results for blue dye images, from left: raw images, ground-truth data, results obtained with the faulty threshold, results obtained with a correct threshold.
Algorithms 06 00512 g001
For the image stained with red dye, where the red color is the most dominant color between the sputum cells and the background, we use the following sequence of rules:
If (B(x, y) < G(x, y) or (B(x, y) > R(x, y)) then B(x, y) is sputum else B(x, y) is non sputum
This rule allows us to remove the debris pixels from the Red and Green intensity images.
Afterwards, we cascade the following two rules:
If (R(x, y) < (G(x, y) + Θ)) then R(x, y) is sputum else R(x, y) is non sputum
If ((2*G(x, y) +Θ) < (R(x, y) + B(x, y))), then G(x, y) is sputum else G(x, y) is non sputum
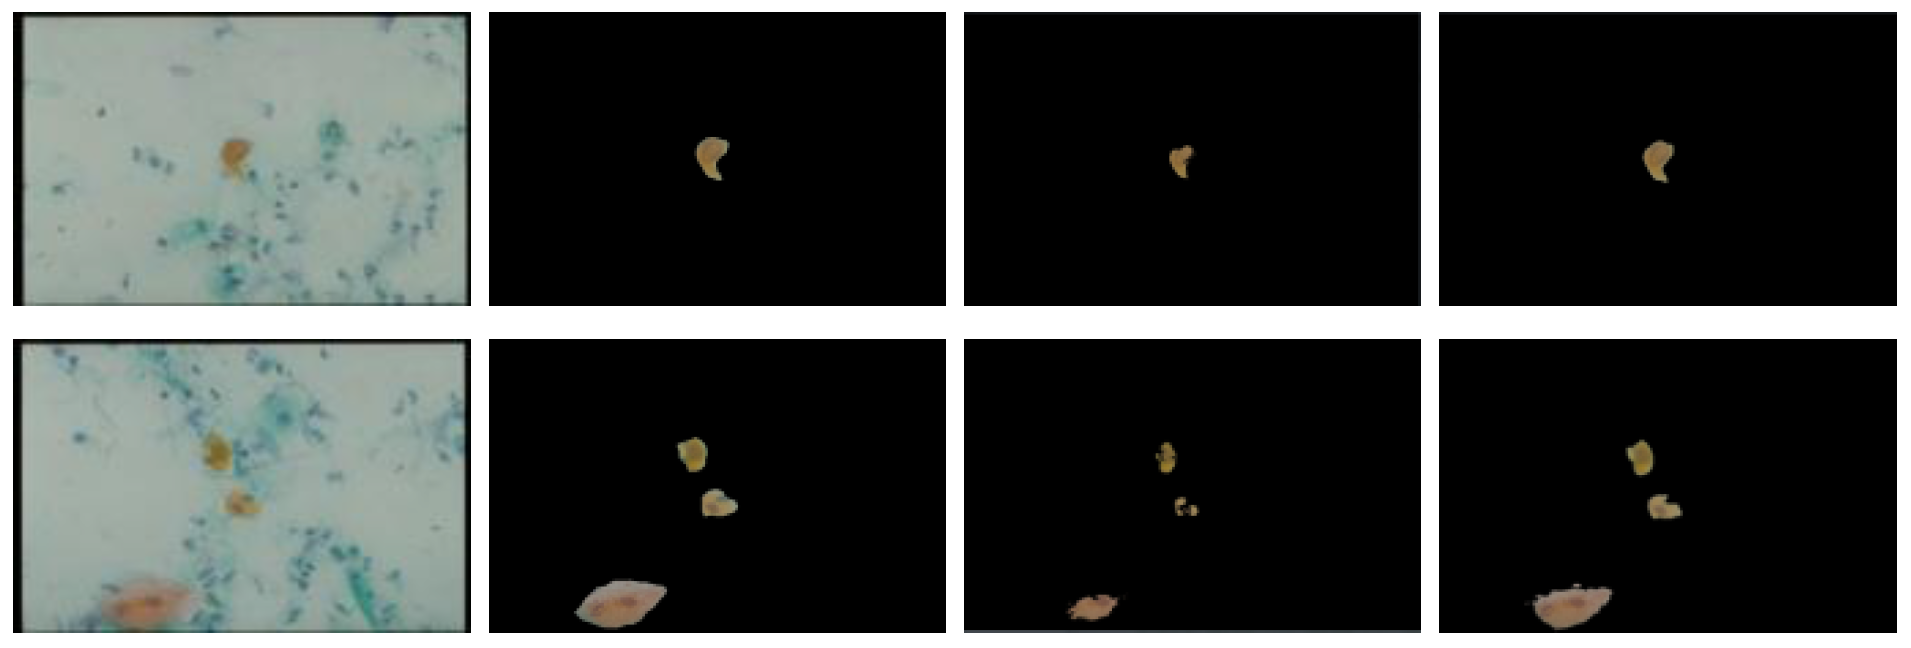
where Θ is a threshold parameter. Figure 2, shows the results of applying Equations (5–7), respectively. The results obtained with two different threshold values. From left to right depicted: the raw images, ground-truth detection, results with the faulty threshold value, and results with a correct threshold.
Figure 2. Examples of threshold segmentation results for red dye images, from the left: raw images, ground-truth data, detection obtained with a faulty threshold, detection obtained with a correct threshold.
Algorithms 06 00512 g002
The optimal value of the threshold was determined by analyzing the performance of the method across (values ranging from −35 to −15 as will be described in the Experiments section).

3.1.2. Bayesian Classification

In this approach we address the cell detection problem using a probabilistic method based on the Bayesian classification [19]. In these methods, a pixel x is considered part of the sputum region if p (bg|x) < p (sp|x) where sp and bg refer to the sputum and the background respectively. Applying the Bayesian Rule and the concept of classification cost, this inequality can be brought to:
σ = μ s p μ b g p ( b g ) p ( s p ) < p ( x | s p ) p ( x | b g )
where μ s p is the loss weight incurred if the sputum class has been selected instead of the background and μ b g is the loss weight incurred if the background class has been selected instead of the sputum, p(bg) and p(sp) are the probabilities of the background and the sputum classes respectively, and they are estimated from the total number of sputum and background pixels in the training set of images according to the following equations:
p ( s p ) = T s p T s p + T b g
p ( b g ) = T b g T s p + T b g
where Tsp and Tbg are the numbers of sputum and background color respectively.
The setting of the ratio μ s p μ b g is based on the following reasoning. In the context of cancer cell detection, false positives are usually prevailed over false negatives. Bearing in mind that cancerous cells are characterized by oversized nucleus-relatively to the cytoplasm, mistakenly selecting a background pixel as a sputum pixel, does somewhat increase the detected cytoplasm region, thus disproportioning the nucleus, and thus increasing the likelihood of assessing the cell as being a non-cancerous cell. From this prospect, the loss incurred of a false sputum cell classification should be allotted a larger weight than its counterpart in the opposite case (e.g., loss incurred if the background class has been chosen instead of the sputum). Thus, the ratio λ = μ s p μ b g should be set larger than 1.
The class-conditional pdfs p(x|sp) and p(x|bg) were estimated using the histogram technique [20]. This approach is motivated by several reasons. First, with the histogram technique, there is no need to make any assumption about the shape of the sputum and background probability density functions. In the opposite case, when a specific form of the class-conditional pdf is assumed, as in the case with the Gaussian density models, some color spaces may prevail over others. Second, with the histogram technique, the Bayesian classifier can be designed very quickly even with a large training set, as compared to other classifiers such as the Artificial Neural Network. Finally, in this application, the feature space has low dimensionality.
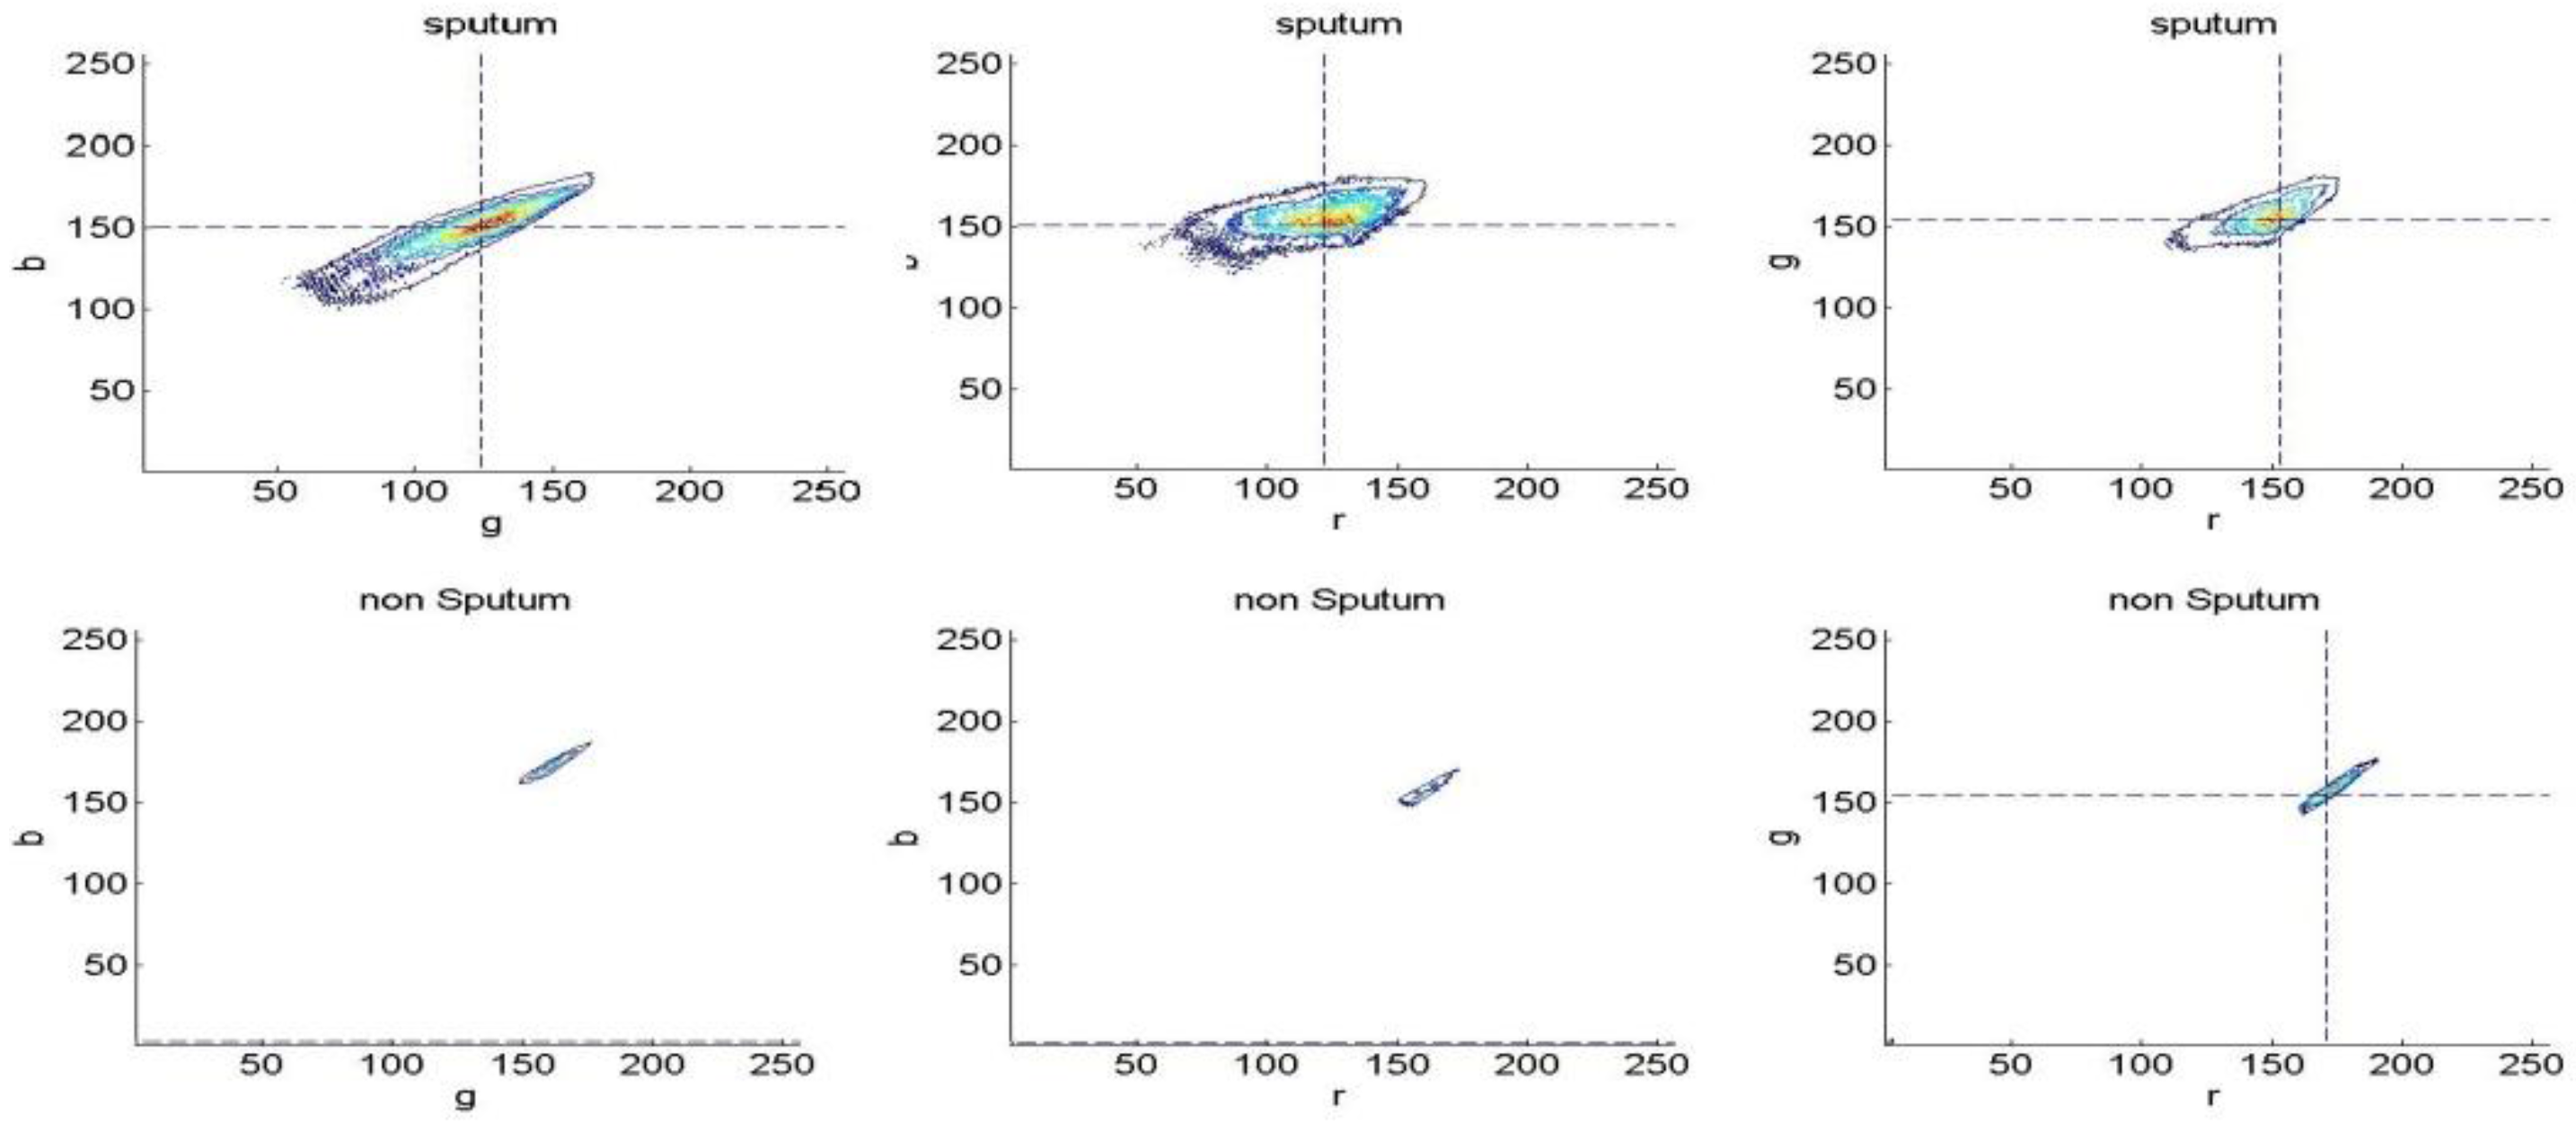
The histograms were computed for different color spaces (RGB, YCbCr, HSV, L*a*b). Each channel, in each color space is divided into bins (16, 32, 64, 128 or 256). Following this, the histograms are converted to discrete probability distributions by normalization. Figure 3 shows a visualization of the RGB histogram with 256 resolutions.
Figure 3. 256- RGB color space Histogram visualization for the sputum and non-sputum pixels.
Algorithms 06 00512 g003
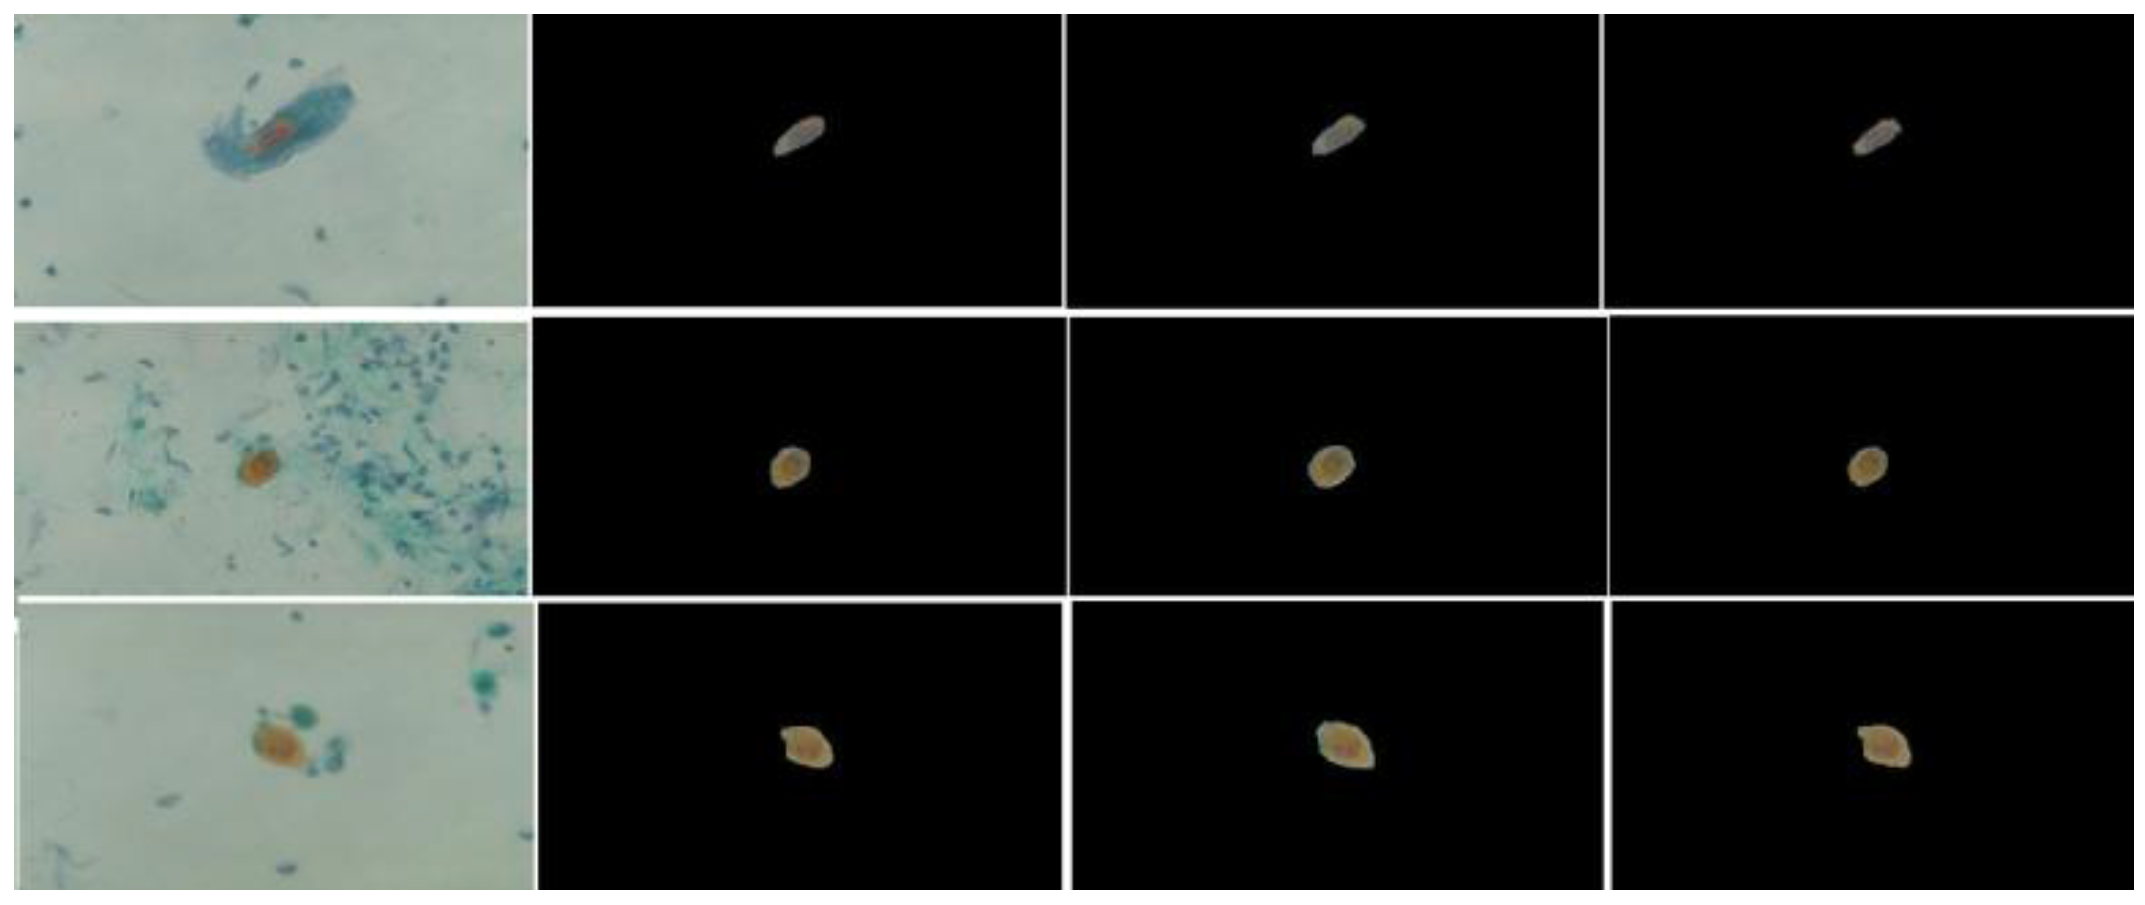
Figure 4 shows some examples of sputum cell extraction obtained with two different values of the ratio λ. We can observe that the size of the detected cell for λ = 7 is less than its counterpart for λ = 2. This observation confirms our reasoning regarding the appropriate range of this ratio.
Figure 4. Samples of sputum cell extraction results. From left to right: raw images, ground truth data, cell detection with λ = 2, and cell detection with λ = 7.
Algorithms 06 00512 g004

3.2. Experiments

A database of 100 images, collected from the Tokyo Center for lung cancer, was utilized in this study. The size of each image is 768 × 512 pixels and they were provided in the RGB space. Furthermore, for each image a mask was manually made as a ground truth data, dividing the images into sputum and non-sputum segments. These images were obtained by manually selecting the regions of interest by masking the location of the corresponding pixels in binary images. Thus, a ground truth image is a binary image where one and zero corresponds to an ROI pixel and to a background pixel, respectively. The ground truth images are used in comparison with the output images from the detection algorithms.
We conducted a comprehensive set of experiments to study the outcome of the threshold algorithm for the detection and extraction of the cells into sputum cells and background. Furthermore, we analyzed the essence of color representation and color quantization on the sputum cell detection. Then we used the cell extraction techniques (threshold classifiers and Bayesian classification). In the case of the Bayesian classifier, 10-fold cross validation was used: the dataset was randomly divided into 10 blocks; for every hold-out block, the system was trained on the remaining blocks and tested on the hold-out block; results averaged over all test blocks, thus reflect predictive performance.
For performance measurement we first computed the true positives (i.e., pixels that were correctly classified as sputum pixels TP), false positives (i.e., pixels that were erroneously classified as sputum pixels FP), true negatives (i.e., pixels that were correctly classified as non sputum pixels TN), and false negatives (i.e., pixels that were erroneously classified as non sputum pixels FN). Further measurements were based on these criteria [21].
Sensitivity = T P T P + F N
Specificity = T N T N + F P
Accuracy = T P + T N T P + T N + F P + F N
The sensitivity reflects the extent to which pixels classified as sputum pixels are actually sputum pixels. Specificity measures how well the background is classified, and the accuracy evaluates the overall correctly classified pixels. Table 1 contains the sensitivity results obtained by using 10-fold cross validation in Bayesian classification with histogram analysis. Every column contains a different color space (RGB, YCbCr, HSV and L*a*b*) and every row represents a different histogram resolution (16, 32, 64, 128 and 256). The comparative analysis focuses on the index v and the index dev, which corresponds to the average and standard deviation of the performance indicators respectively.
Table 1. The average and standard deviation of the sensitivity for each color space using 10-fold cross-validation.
RGBYCbCrHSVL*a*b
Histogram ResolutionVVVV
dev.dev.dev.dev.
160.860.850.880.81
0.140.150.120.18
320.880.820.880.87
0.120.170.120.13
640.880.880.890.87
0.120.120.110.12
1280.890.880.890.88
0.110.120.120.11
2560.890.890.890.88
0.110.110.110.11
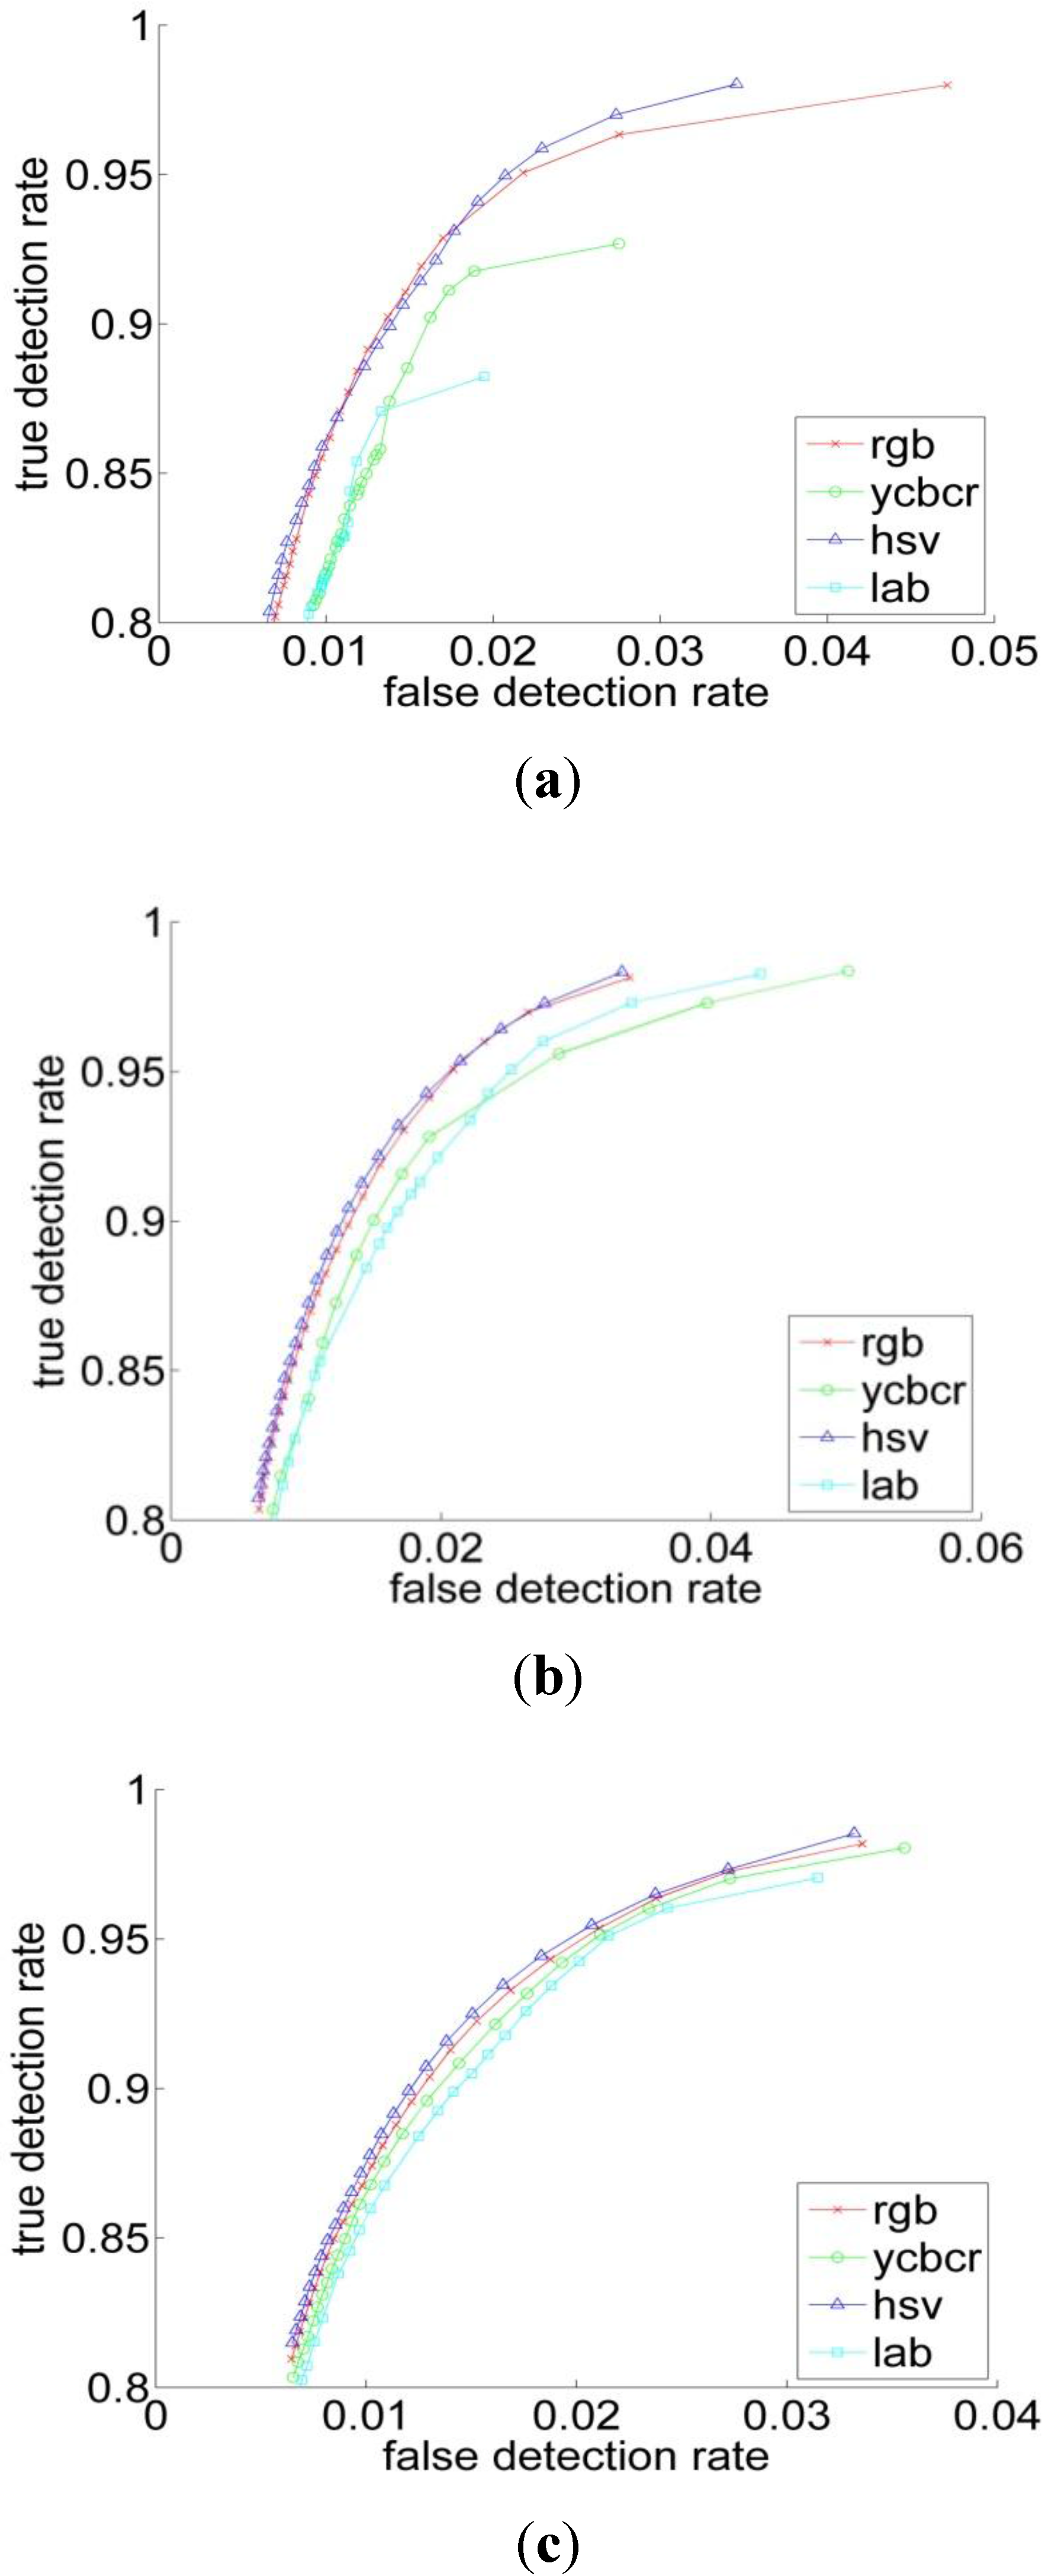
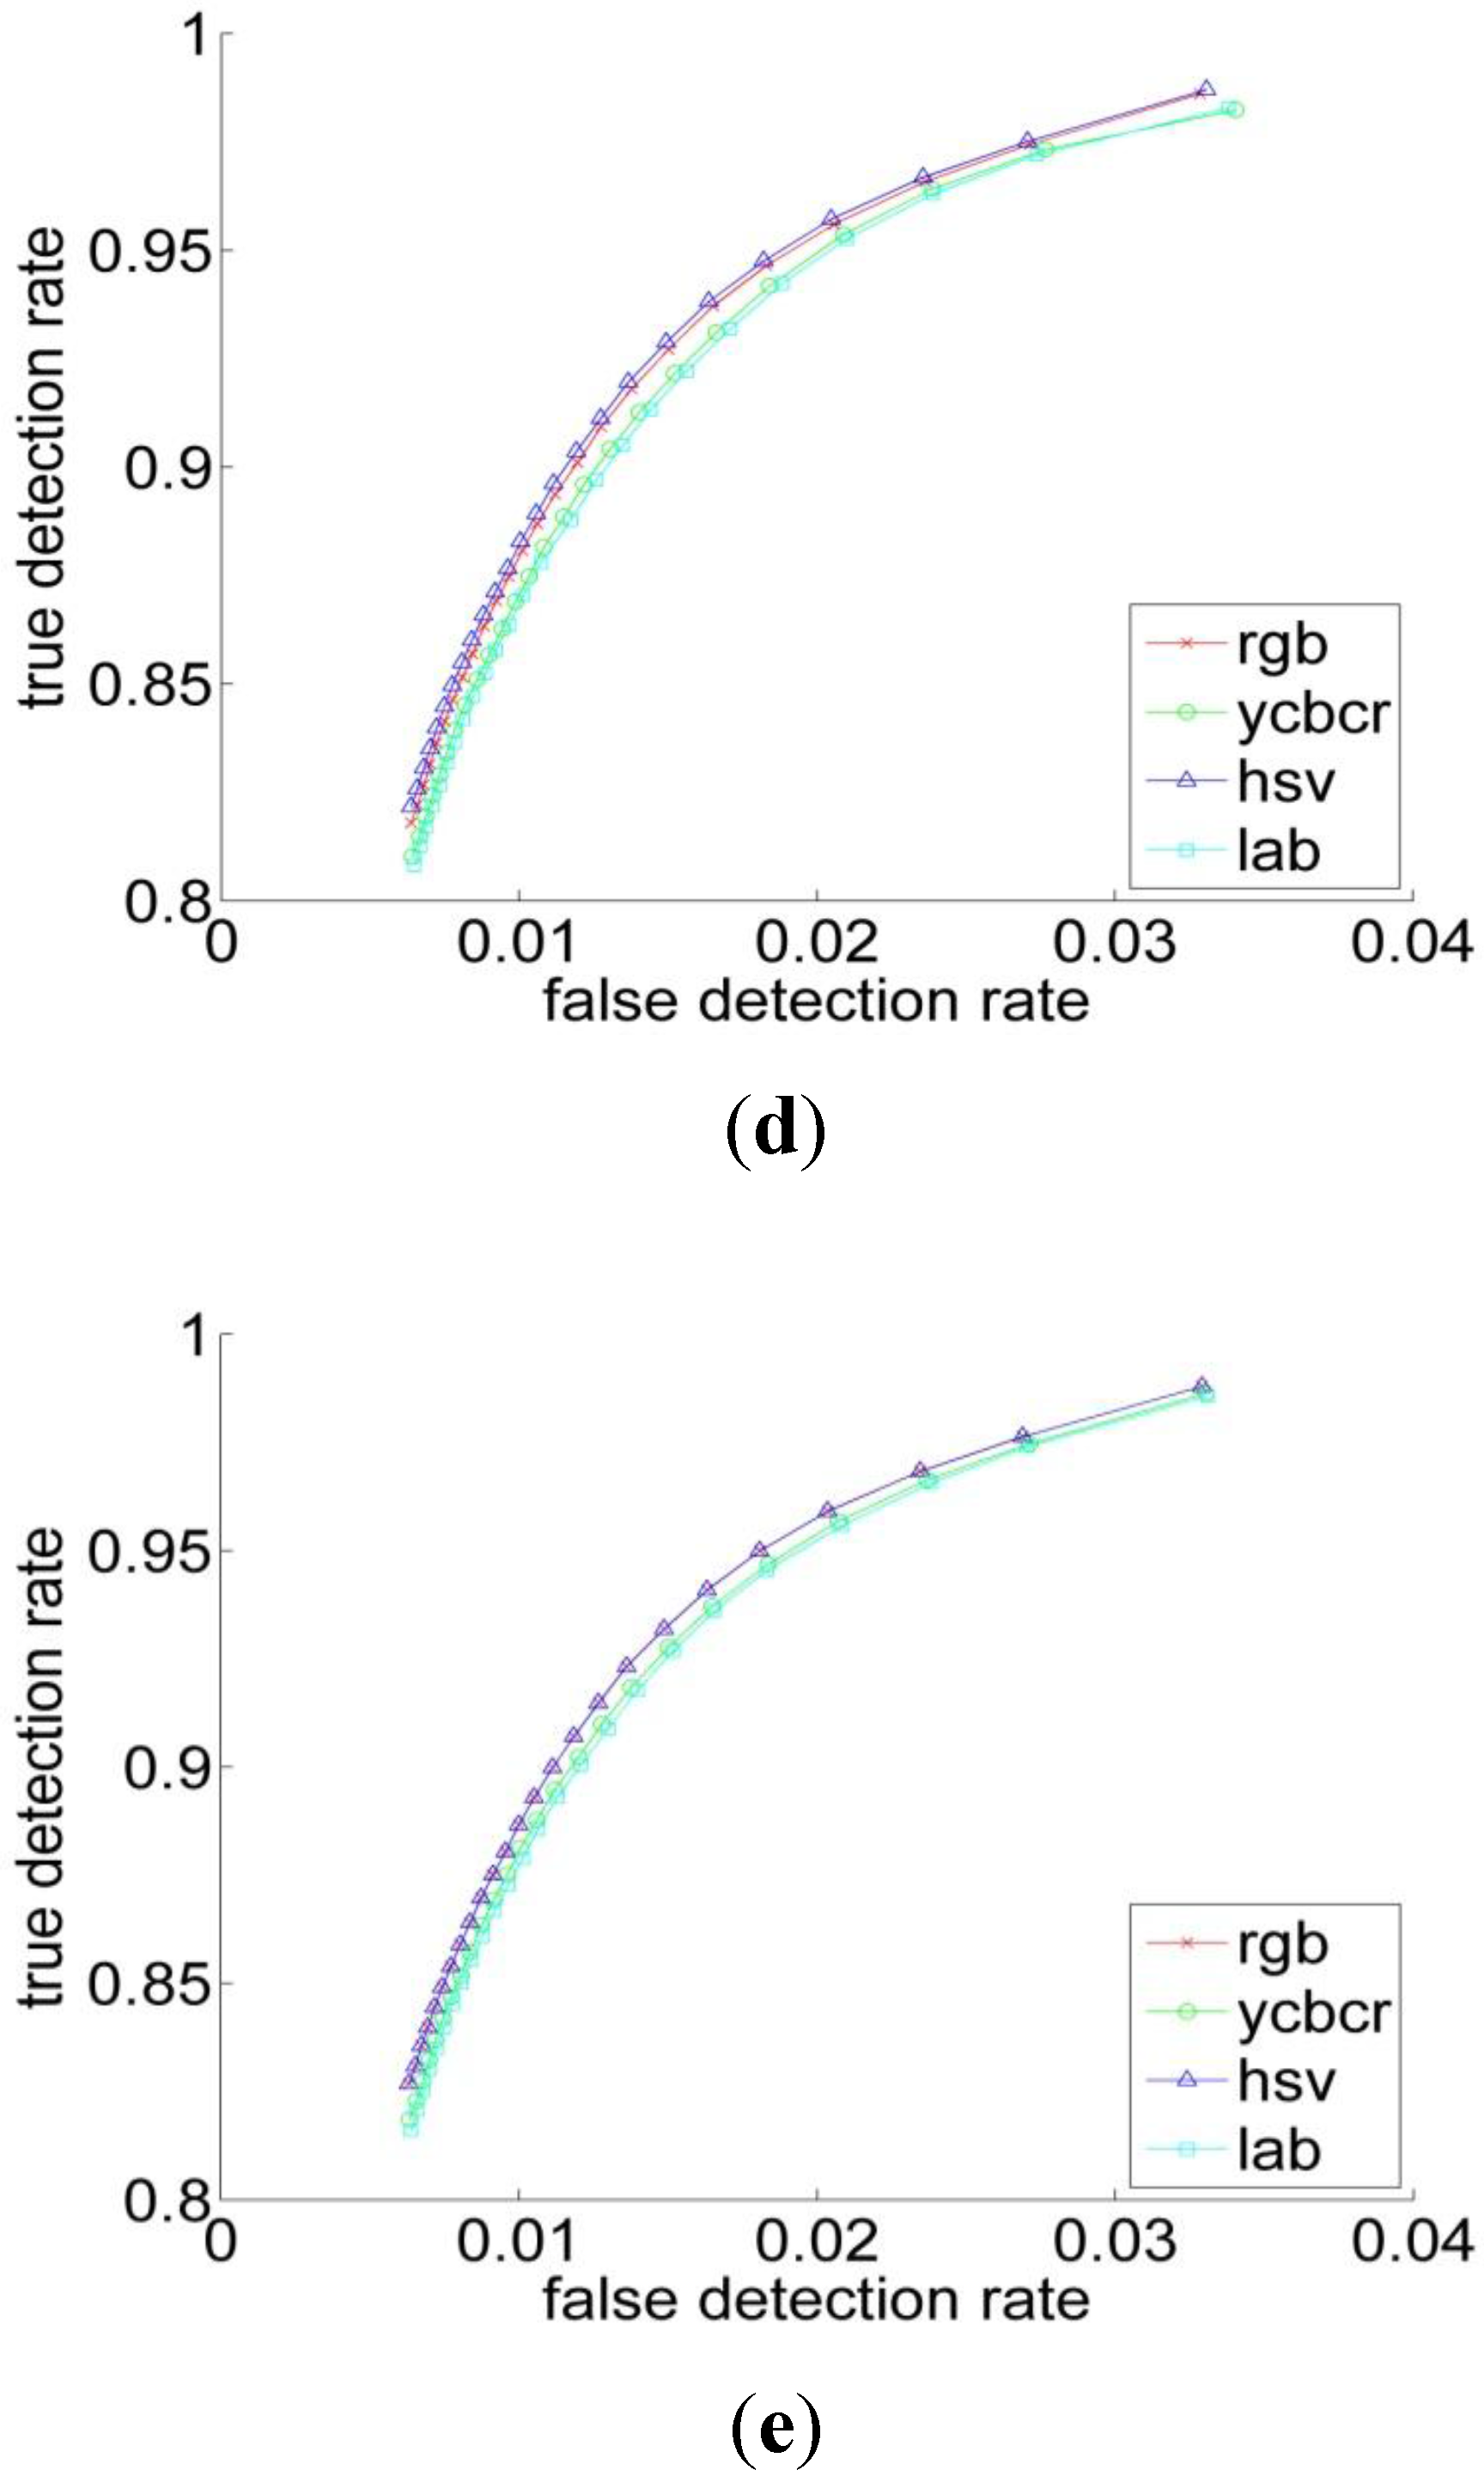
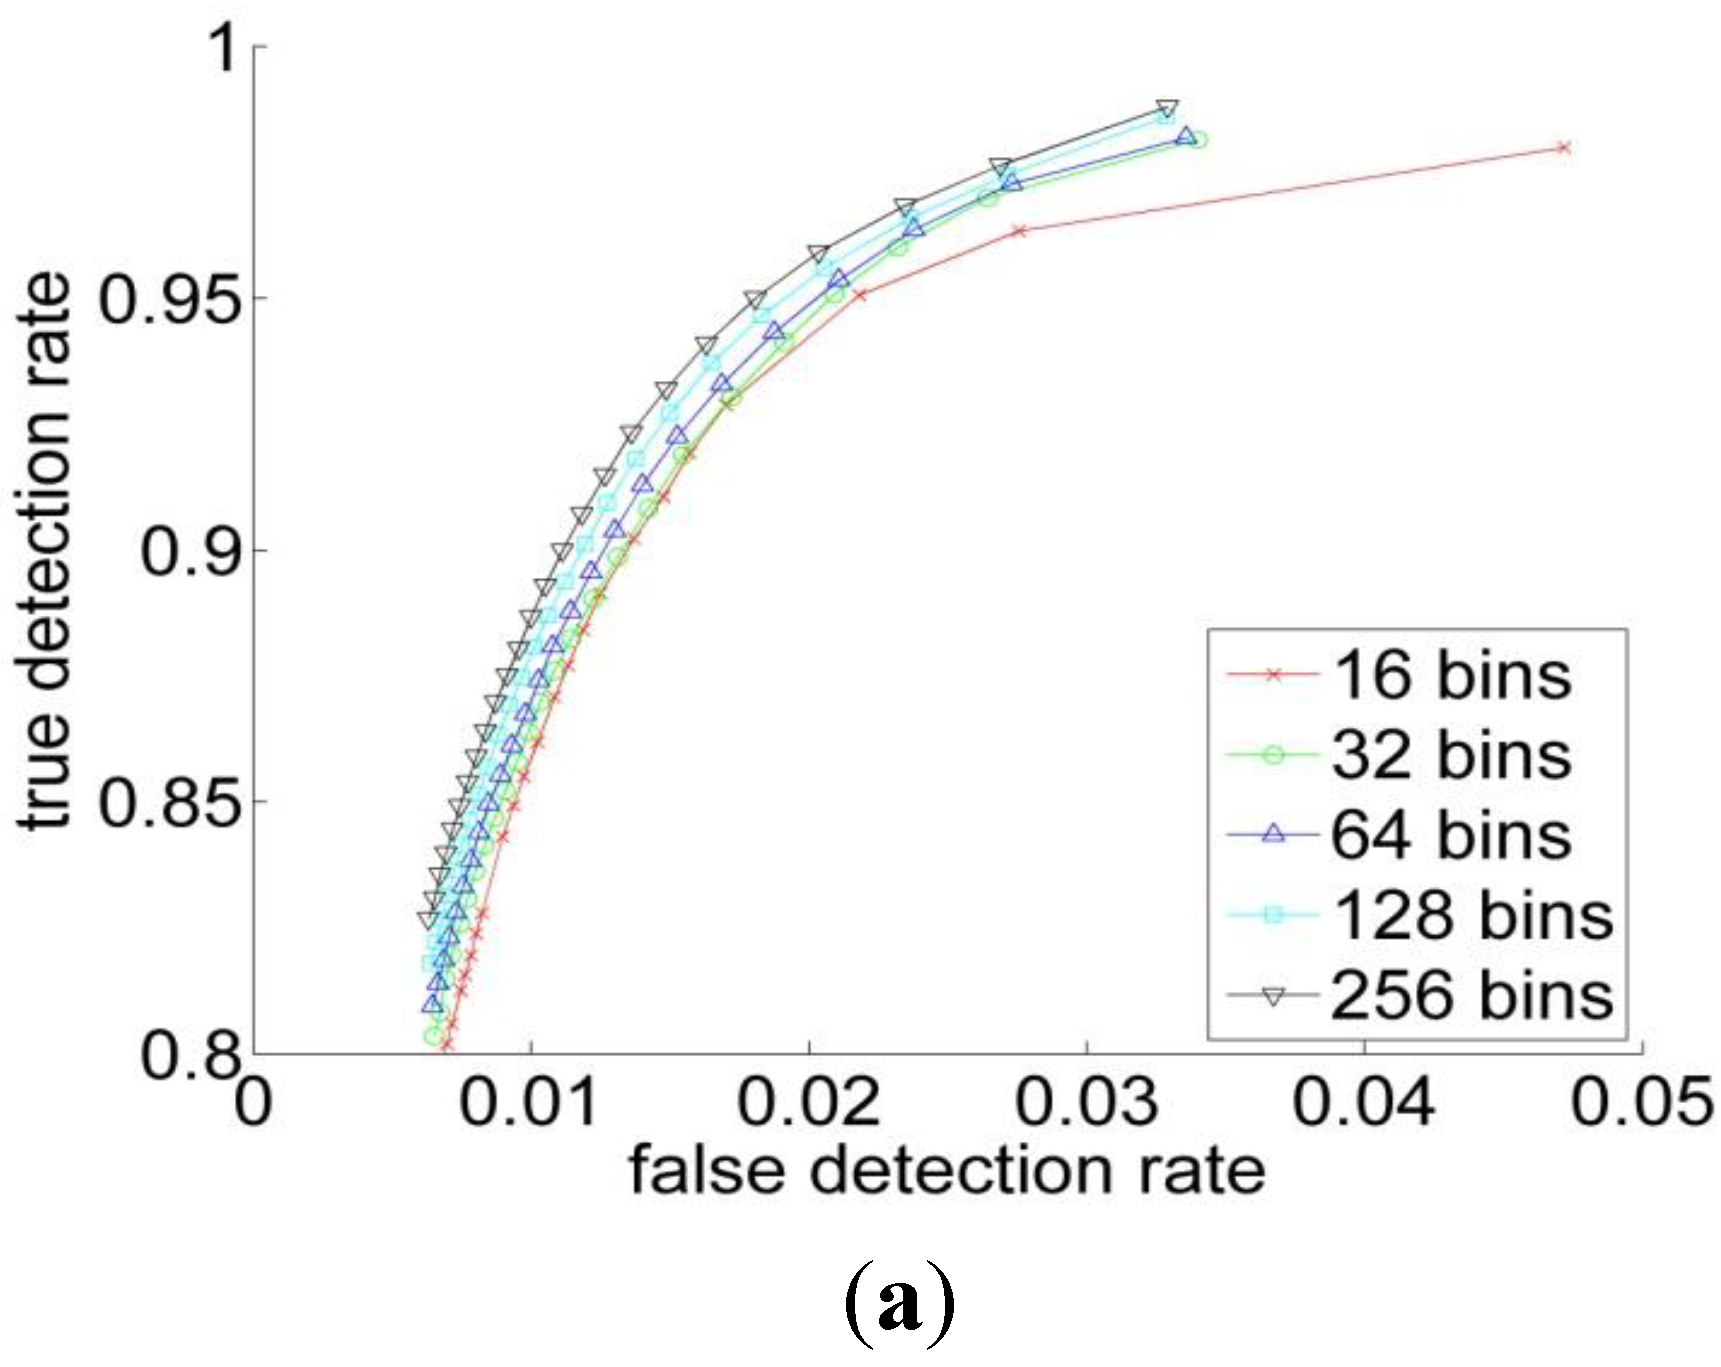
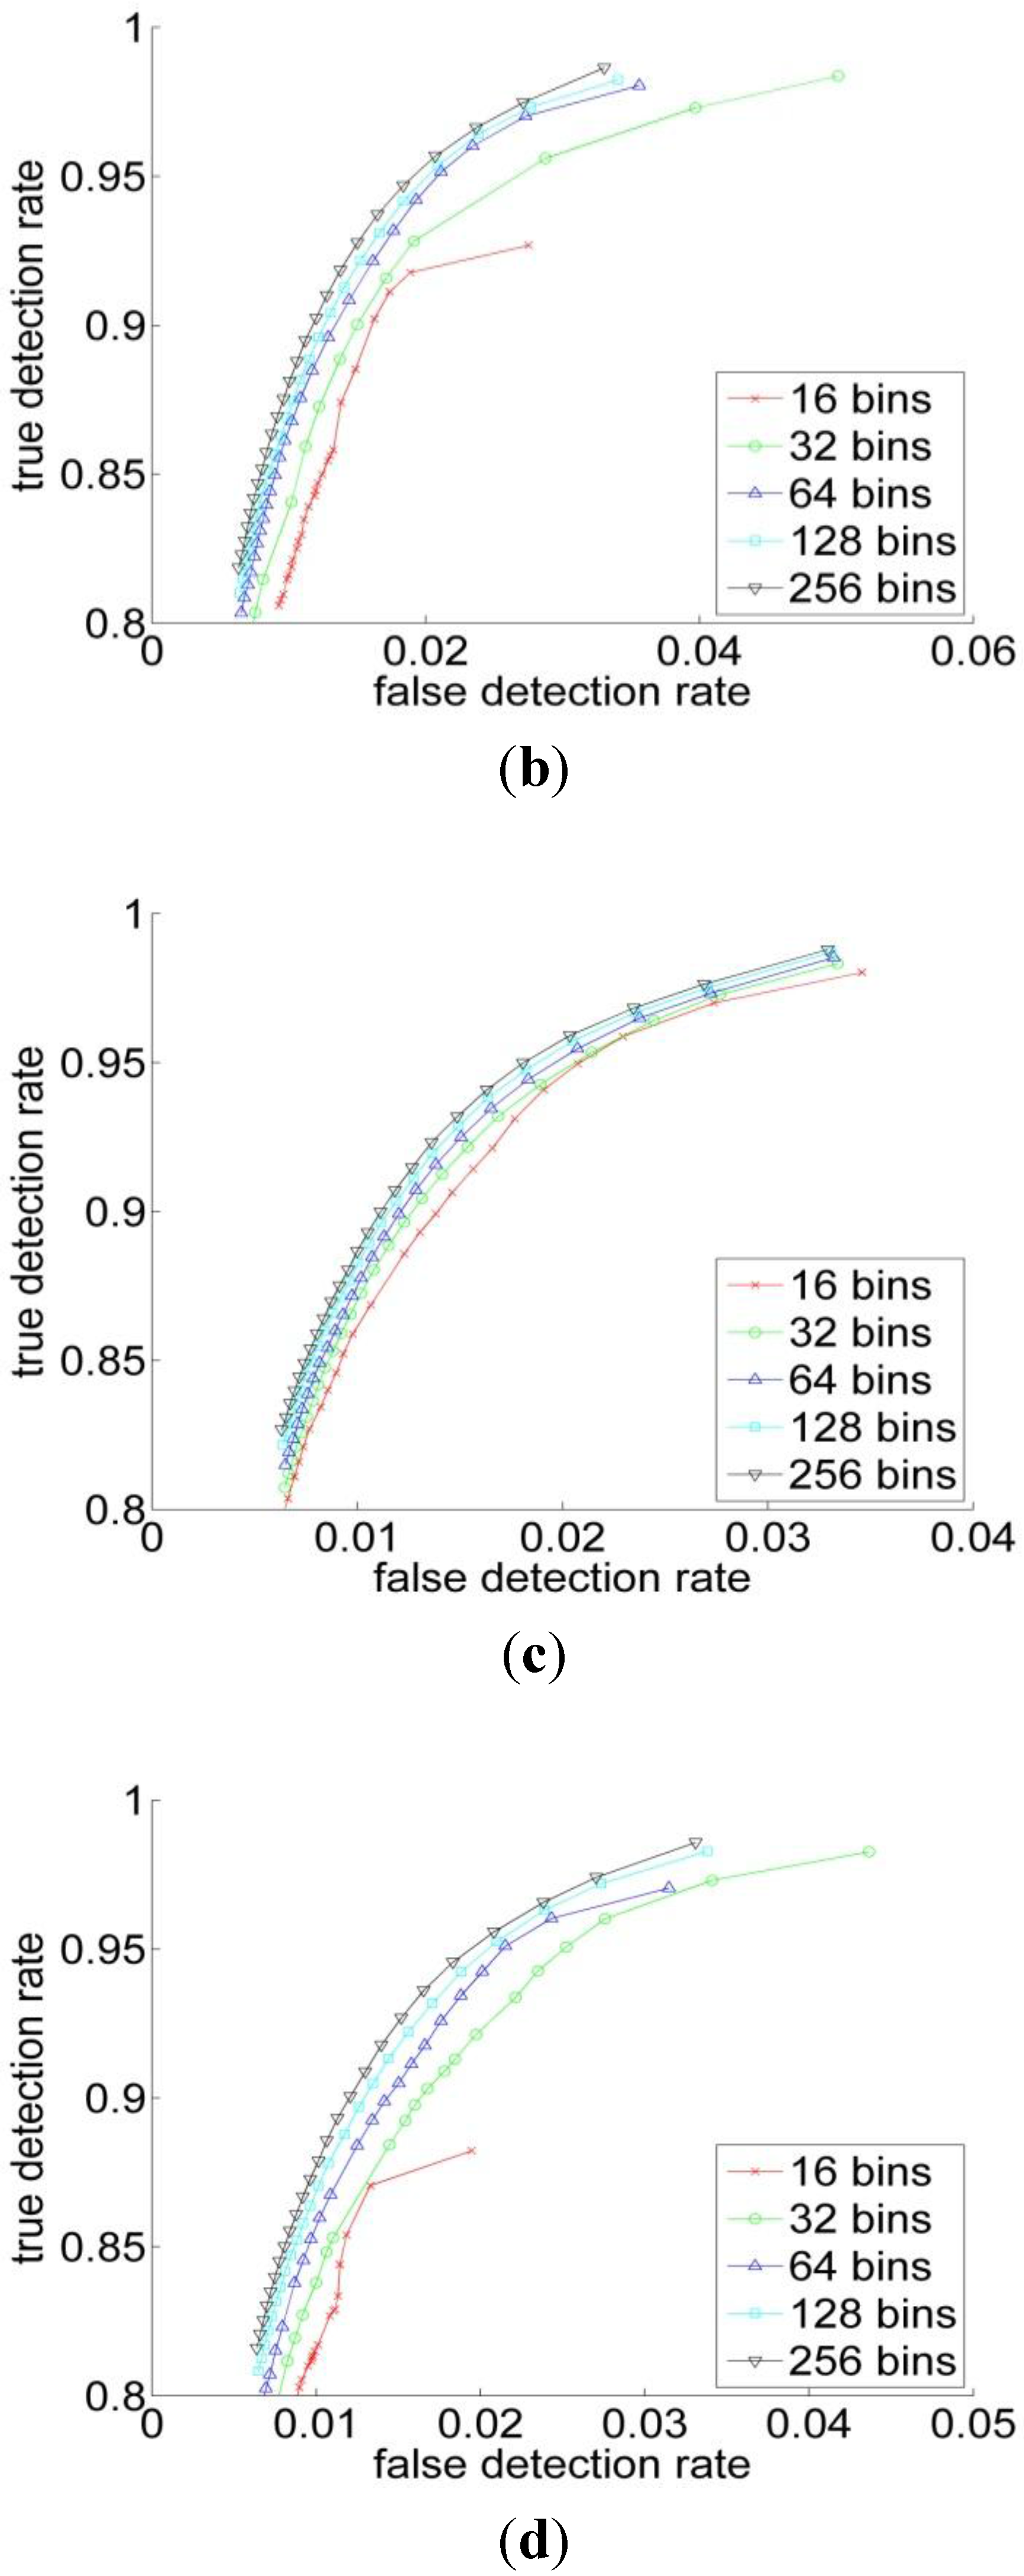
Quantitatively, for Bayesian classifier the ROC curves have been computed for four color representations for five histogram resolutions. The ROC curve is the parametric curve which contains False Detection Rate (t), and Correct Detection Rate (t) where t is a classifier parameter. The curves are depicted in Figure 5. As can be observed from Table 1 and Figure 5 that, the HSV has the best performance across all the resolutions, followed by the RGB. But overall, the different color spaces show a close performance for resolutions above 64. Figure 6 shows the ROC-curves of the different color spaces across the histogram resolutions. We clearly observe that the performance improves as the resolution increases. The RGB and the HSV maintain a strong performance across all the resolutions, whereas it degrades a bit under 64 for the YCbCr and L*a*b* spaces.
Figure 5. The ROC curves in the four color spaces for histogram resolutions of (a) 16; (b) 32 bins; (c) 64 bins; (d) 128 bins and (e) 256 bins.
Algorithms 06 00512 g005aAlgorithms 06 00512 g005b
Figure 6. The ROC curve of (a) RGB; (b) YCbCr; (c) HSV and (d) L*a*b* spaces for the different histogram resolutions.
Algorithms 06 00512 g006aAlgorithms 06 00512 g006b
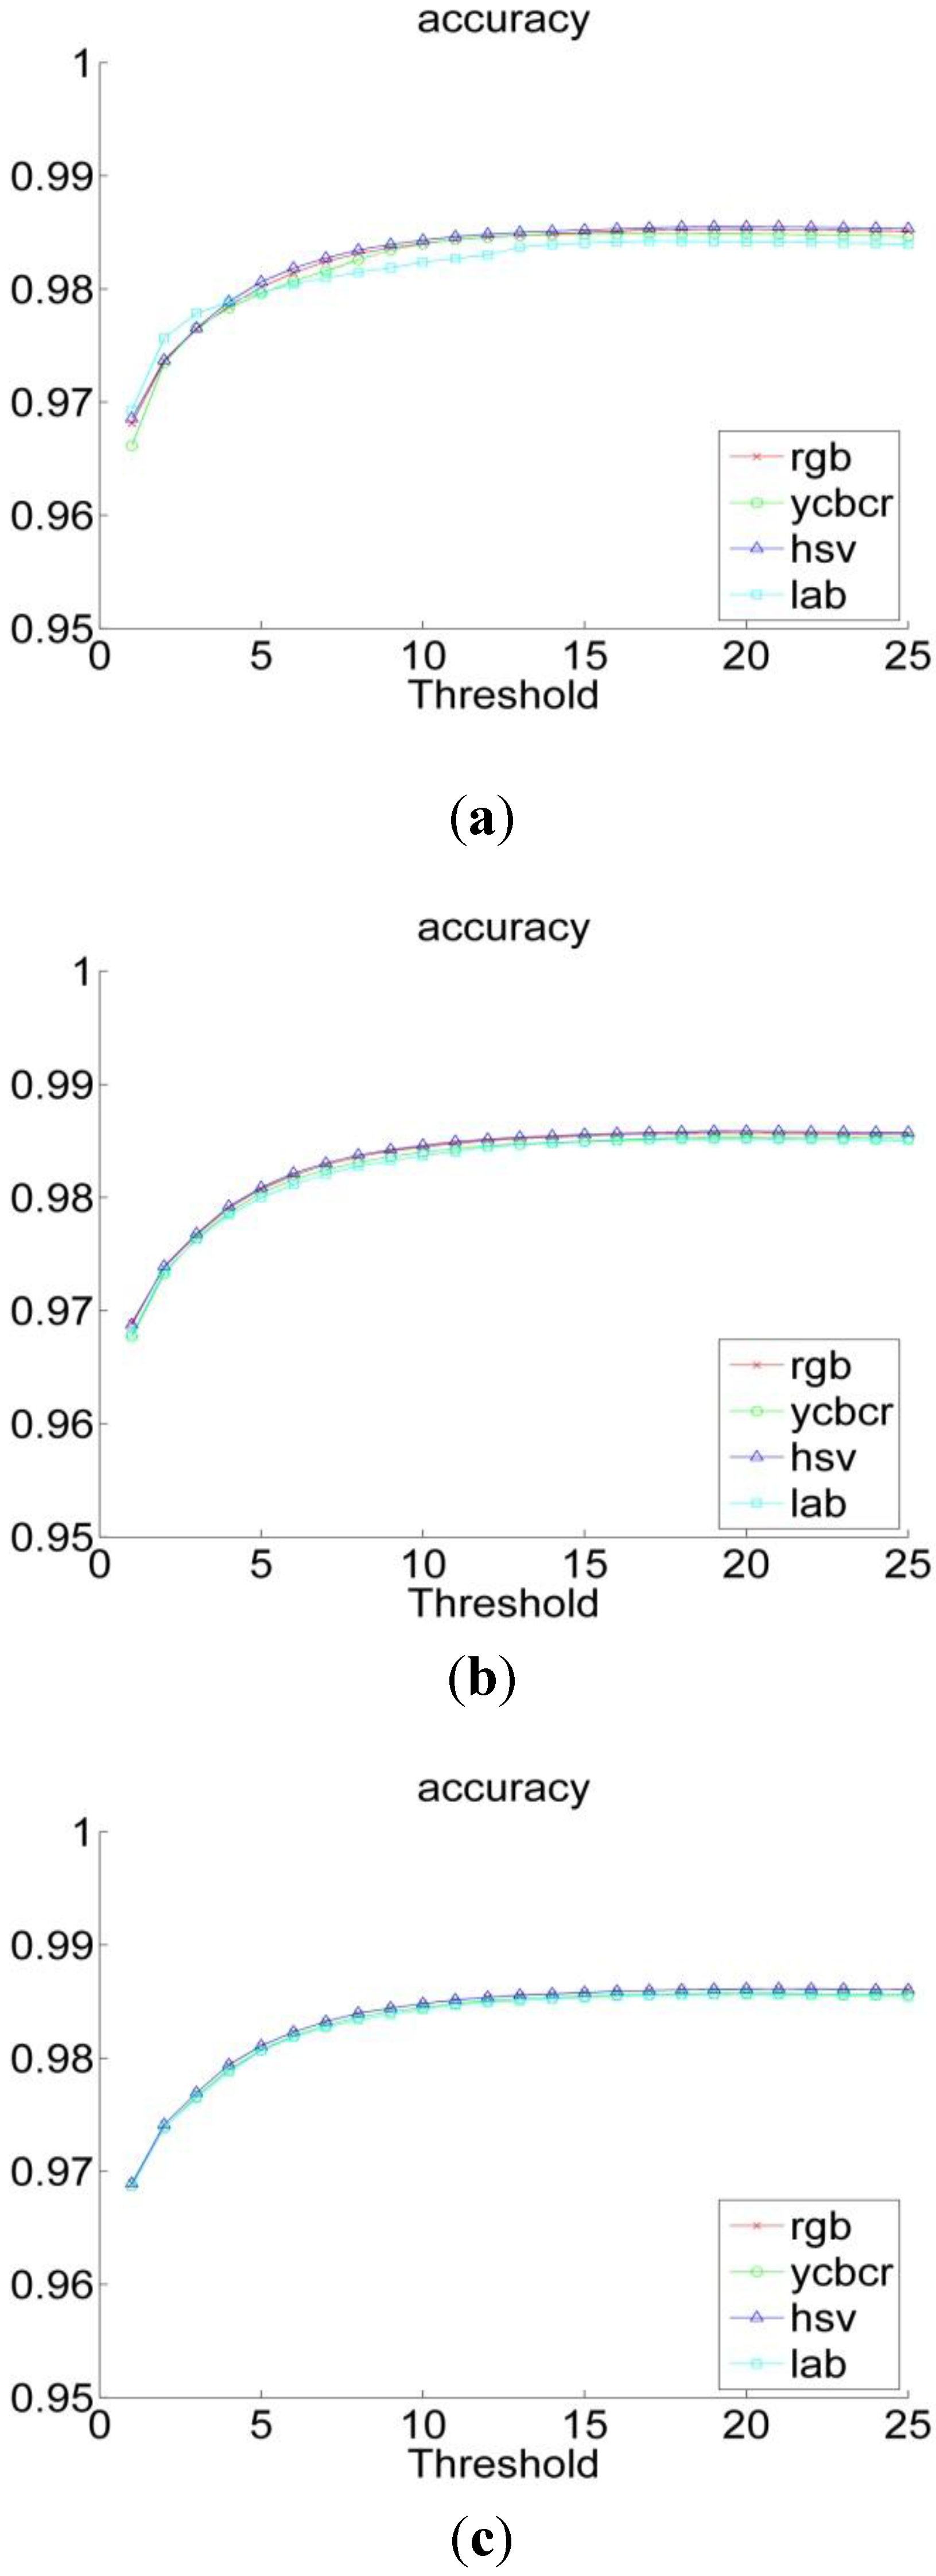
Figure 7 shows the accuracy criterion variation of the color spaces in function of the ratio λ. We can ensure that the accuracy improves as λ increases and reaches its peak around within the range 15 to 17.
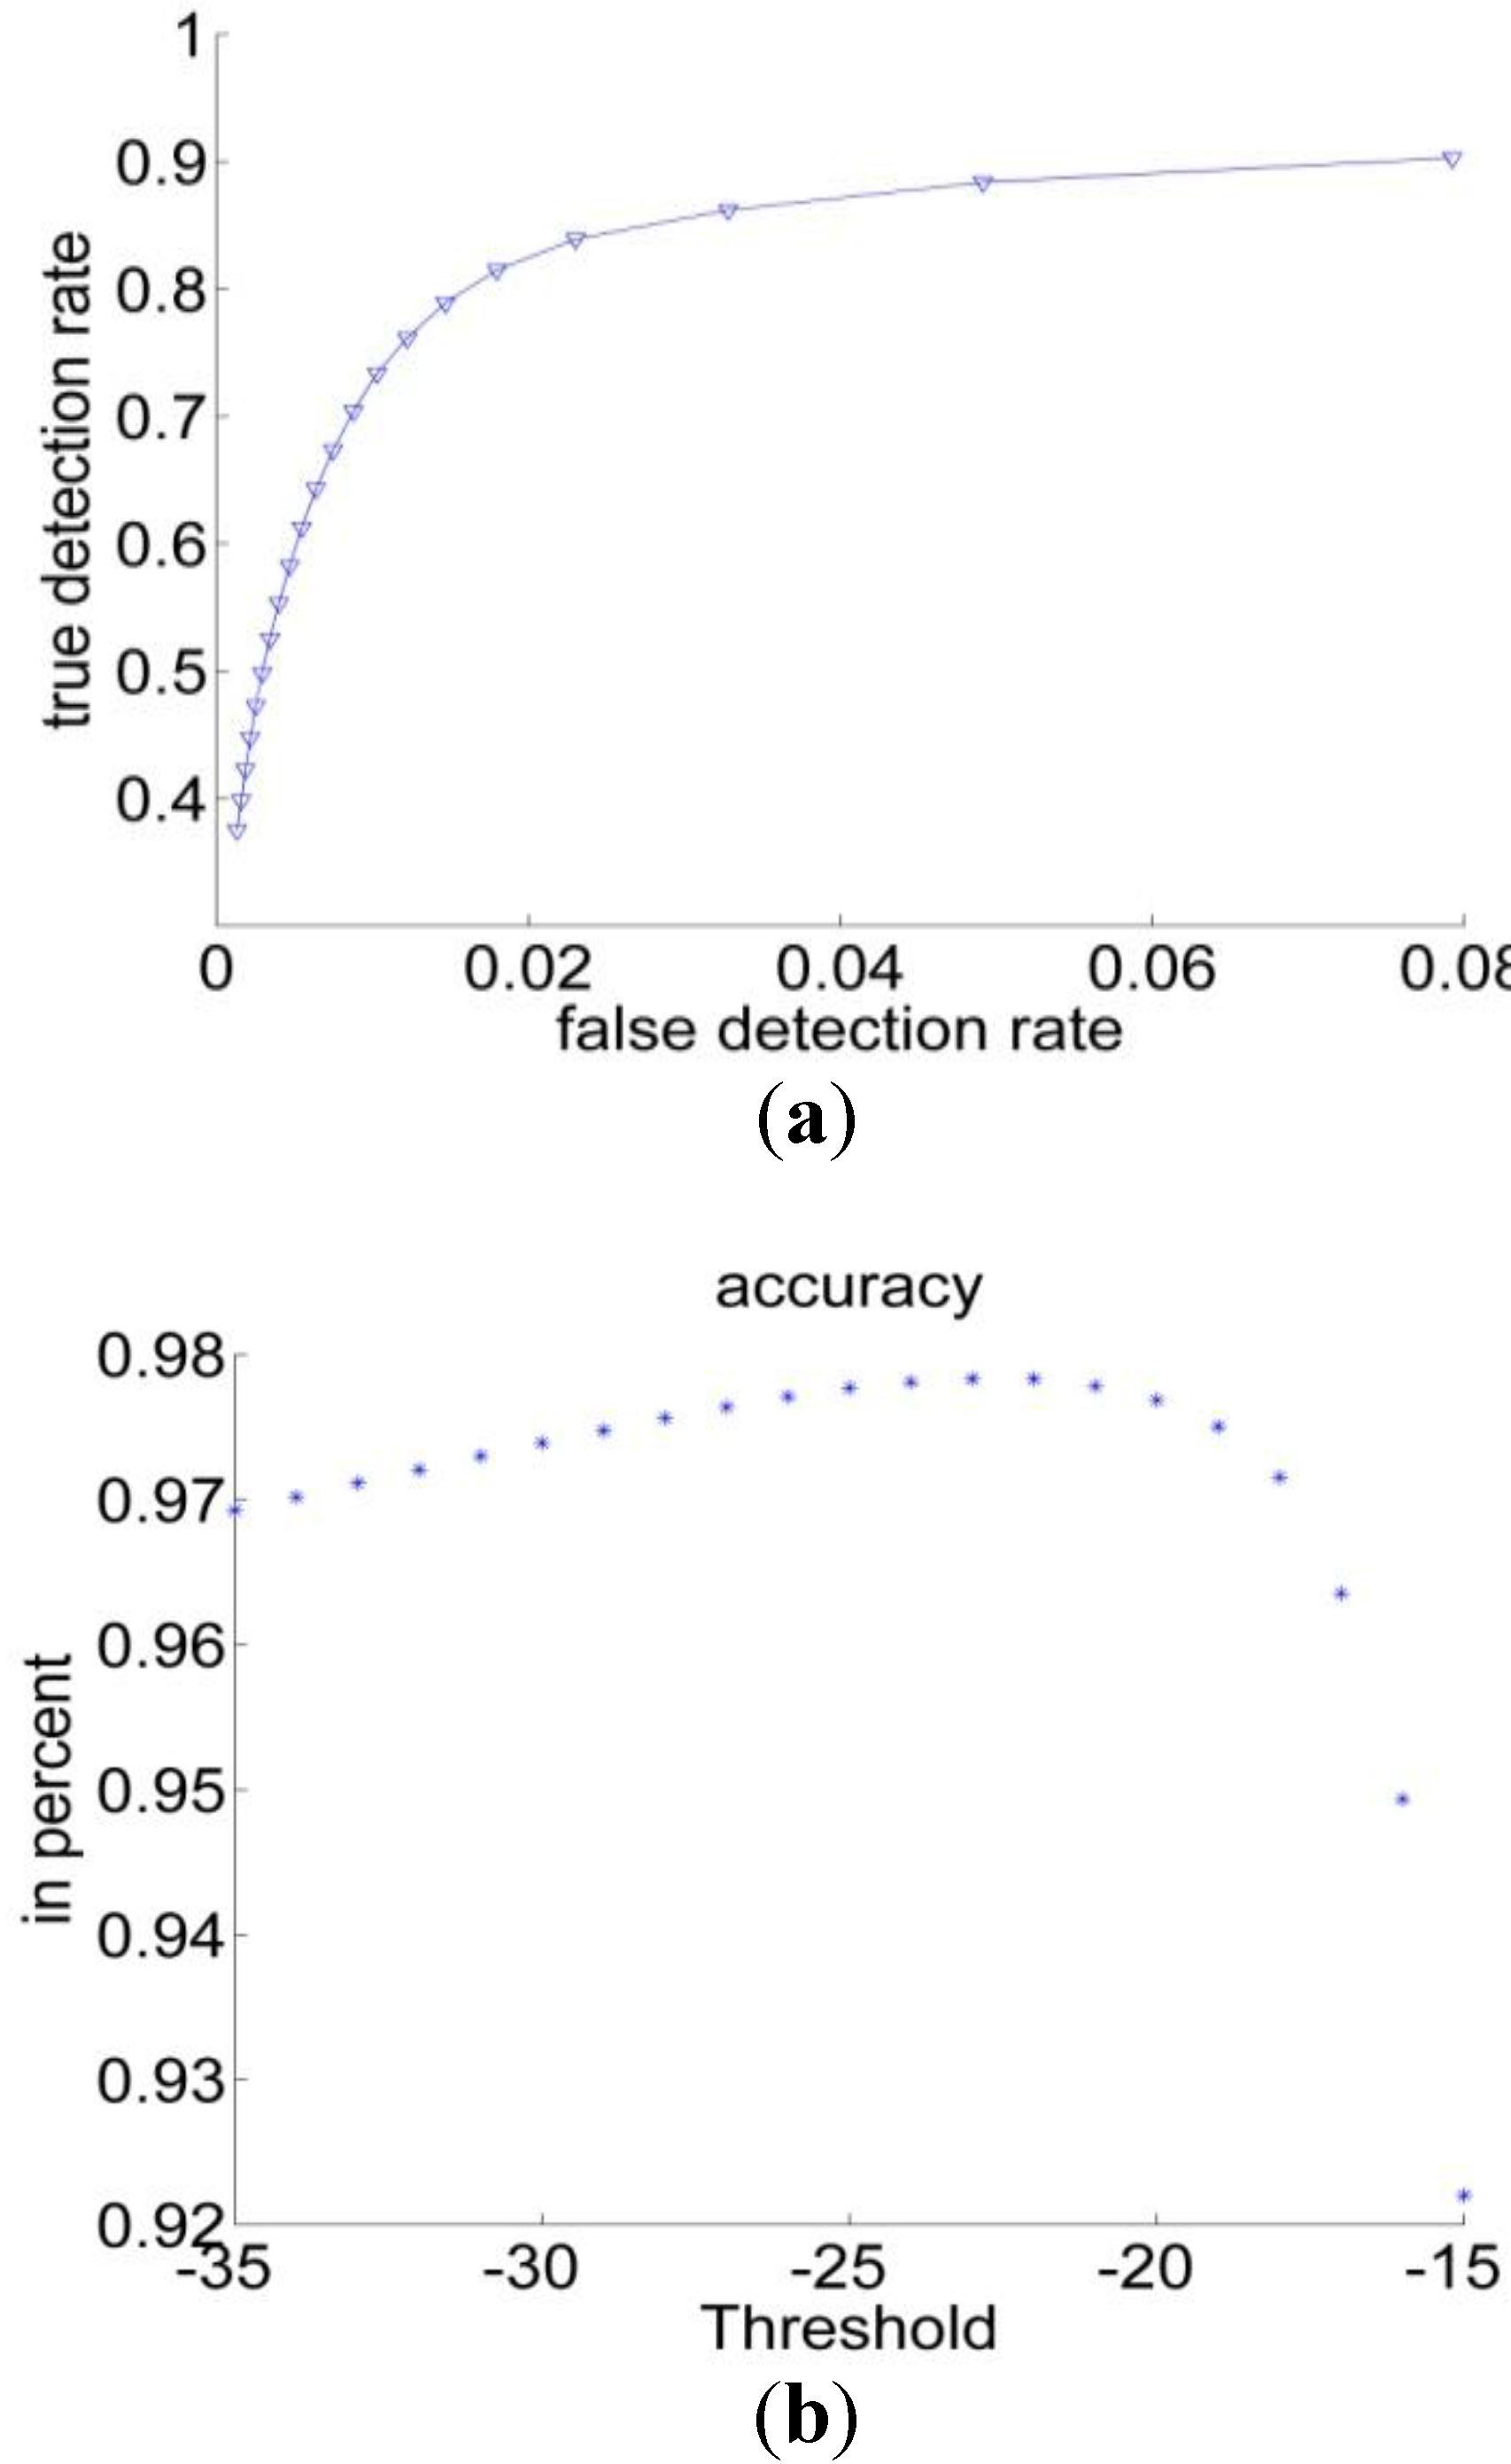
For the threshold classifier the ROC-curve has been calculated for the RGB space. The curve is depicted in Figure 8(a). Figure 8(b) shows the accuracy measurements for the threshold method, as can be seen, the extraction performance varies for different thresholds. The dots in the lower left correspond to small Θ (starting from −35) and rising to −15 in the upper right. These findings suggest an optimal value for Θ equal to −25.
Figure 7. The accuracy performance of the color spaces for a histogram resolution of (a) 64 bins; (b) 128 bins and (c) 256 bins.
Algorithms 06 00512 g007
Figure 8. (a) ROC curve of RGB space for the threshold classifier; (b) Accuracy measurements of the threshold classifier.
Algorithms 06 00512 g008
Table 2 summarizes the performances of the threshold methods and the Bayesian classification. We found that, the Bayesian classification achieved the best scores. It succeeded particularly in reducing the number of FN and improving the sensitivity. On the other hand, the specificity and accuracy are close to their counterparts in the threshold methods.
The comparison between the ROC-curve obtained in the Bayesian classification, (Figure 7) and its counterpart the threshold method (Figure 8) reveals a clear superiority of the Bayesian method.
Table 2. Performance of the extraction methods.
Performance MeasurementsPrevious Threshold MethodImproved Threshold MethodBayesian Classification
Sensitivity49%82%89%
Specificity97%99%99%
Accuracy96%98%98%

4. Cell Sgmentation

Image segmentation is the process of dividing the image into disjoint and homogenous regions. Its purpose is to extract the regions of interest based on the problem being solved [22]. Image segmentation is considered essential in computer vision, and it is the first step in image classification and clustering. It is the bottleneck of any pattern recognition process because the quality of the final results will be highly dependent on the segmentation results.
Several algorithms for medical image segmentation can be found in the literature [23]. No specific segmentation solution can be generalized, and it is entirely dependent on the problem being solved. Moreover, the segmentation algorithms are based on the detection of discontinuity and the detection of similar techniques, respectively. In the detection of discontinuity technique, the image is partitioned into sub images based on sudden changes in gray level or colors by using one of many algorithms such as point algorithms, line algorithms, and edge detection algorithms [24]. On the other hand, in the detection of similarity, the image is partitioned into sub images by using region growing, threshold, splitting and merging techniques [25].
In our contribution, we approached the cell segmentation problem using the mean shift technique. The cell segmentation aims at the partition of the sputum cell into nucleus and the cytoplasm. These regions exhibit reddish colors with different level of intensity (dark for nucleus and clear for the cytoplasm, as shown in Figure 9(a). To reduce the computing complexity we converted the sputum cell pixels to gray level. Subsequently, we performed histogram equalization in order to improve the contrast between the nucleus and the cytoplasm as in Figure 9(b). This process makes the sputum cell pixels to the next stage, namely, the segmentation using the mean shift technique [26]. Basically, the mean shift is a non-parametric iterative technique that operates on a particular density function defined in the feature space. In our application, the feature space is determined by the pixel's gray level and, if we consider the spatial information, the pixel spatial coordinates.
Figure 9. Samples of sputum cells through the different segmentation stages. (a) Sputum cells; (b) Conversion to gray level; (c) Mean shift segmentation; (d) Mode merging; (e) Region refinement.
Algorithms 06 00512 g009
The density function has the following form:
f ( x ) = 1 n i = 1 n | H | 1 / 2 K H ( x x i )
where n is the number of cell pixels, xi is the feature vector, corresponding to the ith pixel. KH is a kernel function, which should be bounded, symmetric, normalized and exponentially decreasing. The parameter H represents the bandwidth matrix which we set to the diagonal matrix having the diagonal terms (hc; hs; hs), where hc and hs represent the chromatic (gray level) and the spatial bandwidths. H is reduced to the scalar hc if only the chromatic level is considered. By choosing as kernel function the normal function (11) becomes:
f ( x ) = 1 n i = 1 n ( 2 π ) 3 / 2 | H | 1 / 2 e ( x x i ) T H 1 ( x x i )
Starting at an initial point, the mean shift algorithm searches for point of maximum density (also called modes) through successive shifting of the initial point in hill-climbing fashion. The sequence of the different locations of the mode across the convergence path is given by:
y j + 1 = i = 1 n x i g ( ( y j x i ) T H 1 ( y j x i ) ) i = 1 n g ( ( y i x i ) T H 1 ( y j x i ) ) j = 1 , 2 , .....
where g is the derivative of the Kernel function.
Practically the mean shift segmentation is composed of the following steps:
  • Segment the feature space into a region.
  • Choose the initial location of the mode in each region.
  • Compute the new locations of the modes by updating them using the shift step.
  • Repeat step 3 and 4 until convergence.
  • Merge the neighboring modes and their associated pixels.
The convergence is reached when the shift step approaches zero.
Figure 9(c), shows the mean shift segmentation outcome for some cells considering both the gray level and spatial information. We observe that the segmentation produces several non-compact regions that do not fit the desired target (e.g., The nucleus and cytoplasm). Statistically, we found that the number of regions varies between 3 and 6. However, one case of the under-segmentation is depicted in Figure 10(a). This is because the gray level distribution does not exhibit distinctive peaks as in Figure 10(b), thus causing the pixels inside the cell area to converge into a single style.
Figure 10. (a) An under-segmentation result produced by the mean shift using only the gray level information; (b) In this case, the gray level distribution of the cell pixels does not show distinctive peaks.
Algorithms 06 00512 g010
In the next phase we perform a rule-based region merging. First from each region, represented as a binary image, we extract the largest connected patches (excluding the isolated and tiny ones). Afterwards, we perform the region merging as in Figure 9(d) subject to the following constraints:
a:
The darkest region is part of the nucleus.
b:
The clearest region is part of the cytoplasm.
c:
Regions on the borders are part of the cytoplasm.
d:
The final number of regions must be equal to 2.
In the final phase, we performed basic hole-filling morphological operations to get the fully compact regions corresponding to the nucleus and cytoplasm as in Figure 9(e).
In the experiment we compared the performance of two variants of the mean shift method (with and without spatial component) with the Hopfield Neural Network (HNN) employed in [7,15]. We used the same assessment procedure as in the sputum extraction that is we compare the effect of the segmentation of the ground truth data composed of the manually segmented nucleus and cytoplasm in the set of test images.
Table 3 summarizes the performances of the three methods. We can see that the mean shift clearly outperforms the HNN technique. In addition, we notice that the integration of the spatial data in the mean shift boosts further the performance.
Table 3. Performance of the nucleus segmentation algorithms.
Performance/AlgorithmHNNGray mean shiftGray-Space mean shift
Sensitivity 73.77%92.7%93.40%
Specificity69.53%85.32%88.21%
Accuracy65.01%85.43%87.11%

5. Conclusions

In this paper we presented methods for extraction and segmentation of sputum cells for the purpose of lung cancer early detection. The sputum cell extraction has been addressed with threshold techniques and Bayesian classification. While our threshold method shows a great improvement compared to existing threshold method, the Bayesian classification exhibited the best performance. Moreover, the Bayesian classification allows an elegant and methodological determination of the classification parameter. The comparability of the performance with regard to the color format reveals close scores for histogram resolution above 64. Nevertheless, a slight advantage of the HSV representation has been detected. Regarding the color quantization the results indicate that the higher the color space resolution the more accurate the classification. For the sputum cell segmentation, we found that the mean shift technique significantly outperforms the HNN technique. The integration of both spatial and chromatic information improves further the segmentation performance. At the current stage, the mean shift method produces a reasonable accuracy above 87%, yet this performance can be further improved via further basic morphological processing on the segmented image. The next phase of our study will be the elaboration and extraction of appropriate descriptors of the nucleus and the cytoplasm for a cell classification process to be used in the CAD systems.

References

  1. Kennedy, T.C.; Miller, Y.; Prindiville, S. Screening for lung cancer revisited and the role of sputum cytology and fluorescence bronchoscopy in a high-risk group. Chest J. 2005, 10, 72–79. [Google Scholar]
  2. Dignam, J.; Huang, L.; Ries, L.; Reichman, M.; Mariotto, A.; Feuer, E. Estimating breast cancer-specific and other cause mortality in clinical trial and population-based cancer registry cohorts. J. Am. Cancer Soc. 2009, 115, 5272–5283. [Google Scholar] [CrossRef] [PubMed]
  3. Aravind, S.; Ramesh, J.; Vanathi, P.; Gunavathi, K. Roubust and Atomated lung Nodule Diagnosis from CT Images based on fuzzy Systems. In Proceeding in International Conference on Process Automation, Control and Computing (PACC), Tamilnadu, India, July 2011; pp. 1–6.
  4. Elbaz, A.; Gimel, G.; Falk, R.; Elghar, M. A new CAD System for Early Diagnosis of Detected Lung Nodules. In Proceeding in ICIP Conference, Louisville, KY, USA, May 2007; pp. 461–464.
  5. Gazdar, A.F.; Minna, J.D. Molecular detection of early lung cancer. J. Natl. Cancer Inst. 1999, 91, 299–301. [Google Scholar] [CrossRef] [PubMed]
  6. Hiroo, Y. Usefulness of Papanicolaou stain by rehydration of airdried smears. J. Jpn. Soc. Clin. Cytol. 2003, 34, 107–110. [Google Scholar]
  7. Sammouda, R.; Niki, N.; Nishitani, H.; Nakamura, S.; Mori, S. Segmentation of sputum color image for lung cancer diagnosis based on neural network. IEICE Trans. Inf. Syst. 1998, E81, 862–870. [Google Scholar]
  8. El-Baz, A.; Farag, A.A.; Falk, R.; La Rocca, R. Detection, Visualization and Identification of Lung Abnormalities in Chest Spiral CT Scan: Phase-I. In Proceeding of the International Conference on Biomedical Engineering, Cairo, Egypt, 2003; Volume 12.
  9. Dougherty, G. Digital Image Processing for Medical Applications, 1st ed.; Cambridge University Press: Cambridge, UK, 2009. [Google Scholar]
  10. El-Baz, A.; Beache, G.; Gimel’farb, G.; Suzuki, K.; Okada, K.; Elnakib, A.; Soliman, A.; Abdollahi, B. Computer-aided diagnosis systems for lung cancer: Challenges and methodologies. Int. J. Biomed. Imaging 2013, 2013. [Google Scholar] [CrossRef] [PubMed]
  11. Sheila, A.; Ried, T. Interphase cytogenetics of sputum cells for the early detection of lung carcinogenesis. J. Cancer Prev. Res. 2010, 3, 416–419. [Google Scholar]
  12. Kim, D.; Chung, C.; Barnard, K. Relevance feedback using adaptive clustering for image similarity retrieval. J. Syst. Softw. 2005, 78, 9–23. [Google Scholar] [CrossRef]
  13. Forero, M.G.; Sroubek, F.; Cristobal, G. Identification of tuberculosis based on shape and color. J. Real Time Imaging 2004, 10, 251–262. [Google Scholar] [CrossRef]
  14. Forero, M.; Sroubek, F.; Alvarez, J.; Malpica, N.; Cristobal, G.; Santos, A.; Alcala, L.; Desco, M.; Cohen, L. Segmentation, autofocusing and signature extraction of tuberculosis sputum images. Proc. SPIE Photonic Devices Algorithms Comput. 2002, 4788, 341–352. [Google Scholar]
  15. Taher, F.; Sammouda, R. Identification of Lung Cancer based on Shape and Color. In Proceeding of the 4th International Conference on Innovation in Information Technology, Al Ain, UAE, November 2007; pp. 481–485.
  16. Taher, F.; Sammouda, R. Morphology Analysis of Sputum Color Images for Early Lung Cancer Diagnosis. In Proceeding of the 10th International Conference on Information Science, Signal Processing and their Applications (ISSPA 2010), Kuala Lumpur, Malaysia, May 2010; pp. 296–299.
  17. Kancherla, K.; Chilkapatti, R.; Mukkamal, S.; Cousins, J.; Dorian, C. Non Intrusive and Extremely Early Detection of Lung Cancer Using TCPP. In Proceedings of the 4th International conference on Computing in the Global Information Technology ICCGI, Games/La Bocca, Franch, 23–29 August 2009; pp. 104–108.
  18. Sluimer, I. Computer analysis of computer tomography scans of lung: A survey. IEEE Trans. Med. Imaging 2006, 25, 385–405. [Google Scholar] [CrossRef] [PubMed]
  19. Duda, R.; Hart, P. Pattern Classification, 2nd ed.; Wiley-Inter-Science: New York, NY, USA, 2001. [Google Scholar]
  20. Phung, S.; Bouzerdoum, A.; Chai, D. Skin segmentation using color pixel classification: Analysis and comparison. IEEE Trans. Pattern Anal. Mach. Intell. 2005, 27, 148–154. [Google Scholar] [CrossRef] [PubMed]
  21. Margaret, H. Dunham, Data Mining Introductory and Advanced Topics, 1st ed.; Prentice Hall: Now Jersey, NY, USA, 2003. [Google Scholar]
  22. Abdollahi, B.; Soliman, A.; Civelek, A.; Li, X.-F.; Gimel’farb, G.; El-Baz, A. A Novel 3D Joint MGRF Framework for Precise Lung Segmentation. In Proceeding of the Medical Image Computing and Computer-Assisted Intervention (MICCAI) Conference, Nice, France, 1–5 October, 2012; pp. 86–93.
  23. El-Baz, A.; Gimelfarb, G.; Falk, R.; Abou El-Ghar, M.; Holland, T.; Shaffer, T. A New Stochastic Framework for Accurate Lung Segmentation. In Proceeding of the International Conference on Medical Image Computing and Computer-Assisted Intervention (MICCAI'08), New York, NY, USA, 6–10 September 2008; pp. 322–330.
  24. Saleh, S.; Kalyankar, N.; Khamitkar, S. Image segmentation by using edge detection. Int. J. Comput. Sci. Eng. 2010, 2, 804–807. [Google Scholar]
  25. Fussenegger, M.; Opelt, A.; Pinz, A.; Auer, P. Object Recognition Using Segmentation for Feature Detection. In Proceedings of the 17th International Conference on Pattern Recognition, Cambridge England, UK, 23–26, August, 2004; Volume 3, pp. 41–44.
  26. Comaniciu, D.; Meer, P. Mean shift: A robust approach towards feature space analysis. IEEE Trans. Pattern Anal. Mach. Intell. 2002, 24, 603–619. [Google Scholar] [CrossRef]