1. Introduction
Research summarized in this paper is an extension of that reported in [
1] and a conference proceeding [
2], and concerns successive standardization (or normalization) of large rectangular arrays
of real numbers, such as arise in gene expression, from protein chips, or in the earth and environmental sciences. The basic message here is that convergence that holds on all but a set of measure 0 in the paper by Olshen and Rajaratnam ([
1] is shown here to be exponentially fast in a sense we make precise. The basic result in [
1], though true, is not argued correctly in [
1]. The gap is filled here. Typically there is one column per subject; rows correspond to “genes" or perhaps gene fragments (including those that owe to different splicing of “the same" genes, or proteins). Typically, though not always, columns divide naturally into two groups: “affected" or not. Two-sample testing of rows that correspond to “affected" versus other individuals or samples is then carried out simultaneously for each row of the array. Corrections for multiple comparisons may be very simple, or might perhaps allow for “false discovery."
As was noted in [
1], data may still suffer from problems that have nothing to do with differences between groups of subjects or differences between “genes" or groups of them. There may be variation in background, perhaps also in “primers." Thus, variability across subjects might be unrelated to status. In comparing two random vectors that may have been measured in different scales, one puts observations “on the same footing" by subtracting each vector’s mean and dividing by its standard deviation. Thereby, empirical covariances are changed to empirical correlations, and comparisons proceed. But how does one do this in the rectangular arrays described earlier? An algorithm by which such “regularization" is accomplished was described to us by colleague Bradley Efron; so we call the full algorithm
Efron’s algorithm. We shall use the terms successive “normalization" or successive “standardization" interchangeably (and also point out that Bradley Efron considers the the latter term a better description of the algorithm). To avoid technical problems that are described in [
1] and repeated here, we assume there are at least three rows and at least three columns to the array. It is immaterial to convergence, though not to limiting values, whether we begin regularization to be described by row or by column. In order that we fix an algorithm, we begin by column in the computations though by row in the mathematics. Thus, we first mean polish the column, then standard deviation polish the column; next we mean polish the row, and standard deviation polish the row. The process is then repeated. By “mean polish" of, say, a column, we mean subtract the mean value for that column from every entry. By “standard deviation” polish the column, we mean divide each number by the standard deviation of the numbers in that column. Definitions for “row" are entirely analogous.
In [
1] convergence is studied with entries in the rectangular array with I rows and J columns viewed as elements of
, Euclidean IJ space. Convergence holds for all but a Borel subset of
of Lebesgue measure 0. The limiting vector has all row and column means 0, all row and column standard deviations 1. We emphasize that to show convergence on a Lebesgue set of full measure, it is enough to find a probability mutually absolutely continuous with respect to Lebesgue measure for which convergence is established with probability 1.
3. Background and Motivation
A first step in the argument of [
1] is to note that Lebesgue measure on the Borel subsets of
is mutually absolutely continuous with respect to IJ product Gaussian measure, each coordinate being standard Gaussian. Thereby, the distinction between measure and topology is blurred; arguments of [
1] as corrected here. Having translated a problem concerning Lebesgue measure to one concerning Gaussian measure, one cannot help note from graphs in [
1]
Figure 1,
Figure 2,
Figure 3,
Figure 6 and
Figure 7 that suggest with entries of
chosen independently from a common absolutely continuous distribution, and as led to these figures, almost surely ultimately, convergence is at least exponentially fast. In these graphs, the ordinate is always the difference of logarithms (the base does not matter) of squared Frobenius norm of the difference between current iteration and the immediately previous iteration; always abscissa indexes iteration. One purpose of this paper is to demonstrate the ultimately almost sure rapidity of convergence. Readers will note we assume that coordinates are independent and identically distributed, with standard normal distributions. This assumption is used explicitly though unnecessarily in [
1], but only implicitly here, and then only to the extent that arguments here depend on those in [
1]. Obviously, this Gaussian assumption is sufficient. It is pretty obviously not necessary.
For the sake of motivation we illustrate the patterns of convergence from successive normalizations on
matrices. We first describe the details of the successive normalization in a manner very similar to [
1]. Consider a simple
matrix with entries generated from a normal distribution with a given mean and standard deviation. In our case we take the mean to be 2 and variance to be 4, though the specific values the mean and variance parameter take do not matter. We first standardize the initial matrix
at the level of each by row,
i.e., first subtracting the row mean from each entry and then dividing each entry in a given row by its row standard deviation. The matrix is then standardized at the level of each column,
i.e., by first subtracting the column mean from each entry and then by dividing each entry by the respective column standard deviation. Row mean and standard deviation polishing followed by column mean and standard deviation polishing is defined as one iteration in the process of attempting to row and column standardize the matrix. The resulting matrix is defined as
. Now the same process is repeated with
and repeated until successive renormalization eventually yields a row and column standardized matrix. The successive normalizations are repeated until “convergence” which for our purposes is defined as the difference in the squared Frobenius norm between two consecutive iterations being less than
.
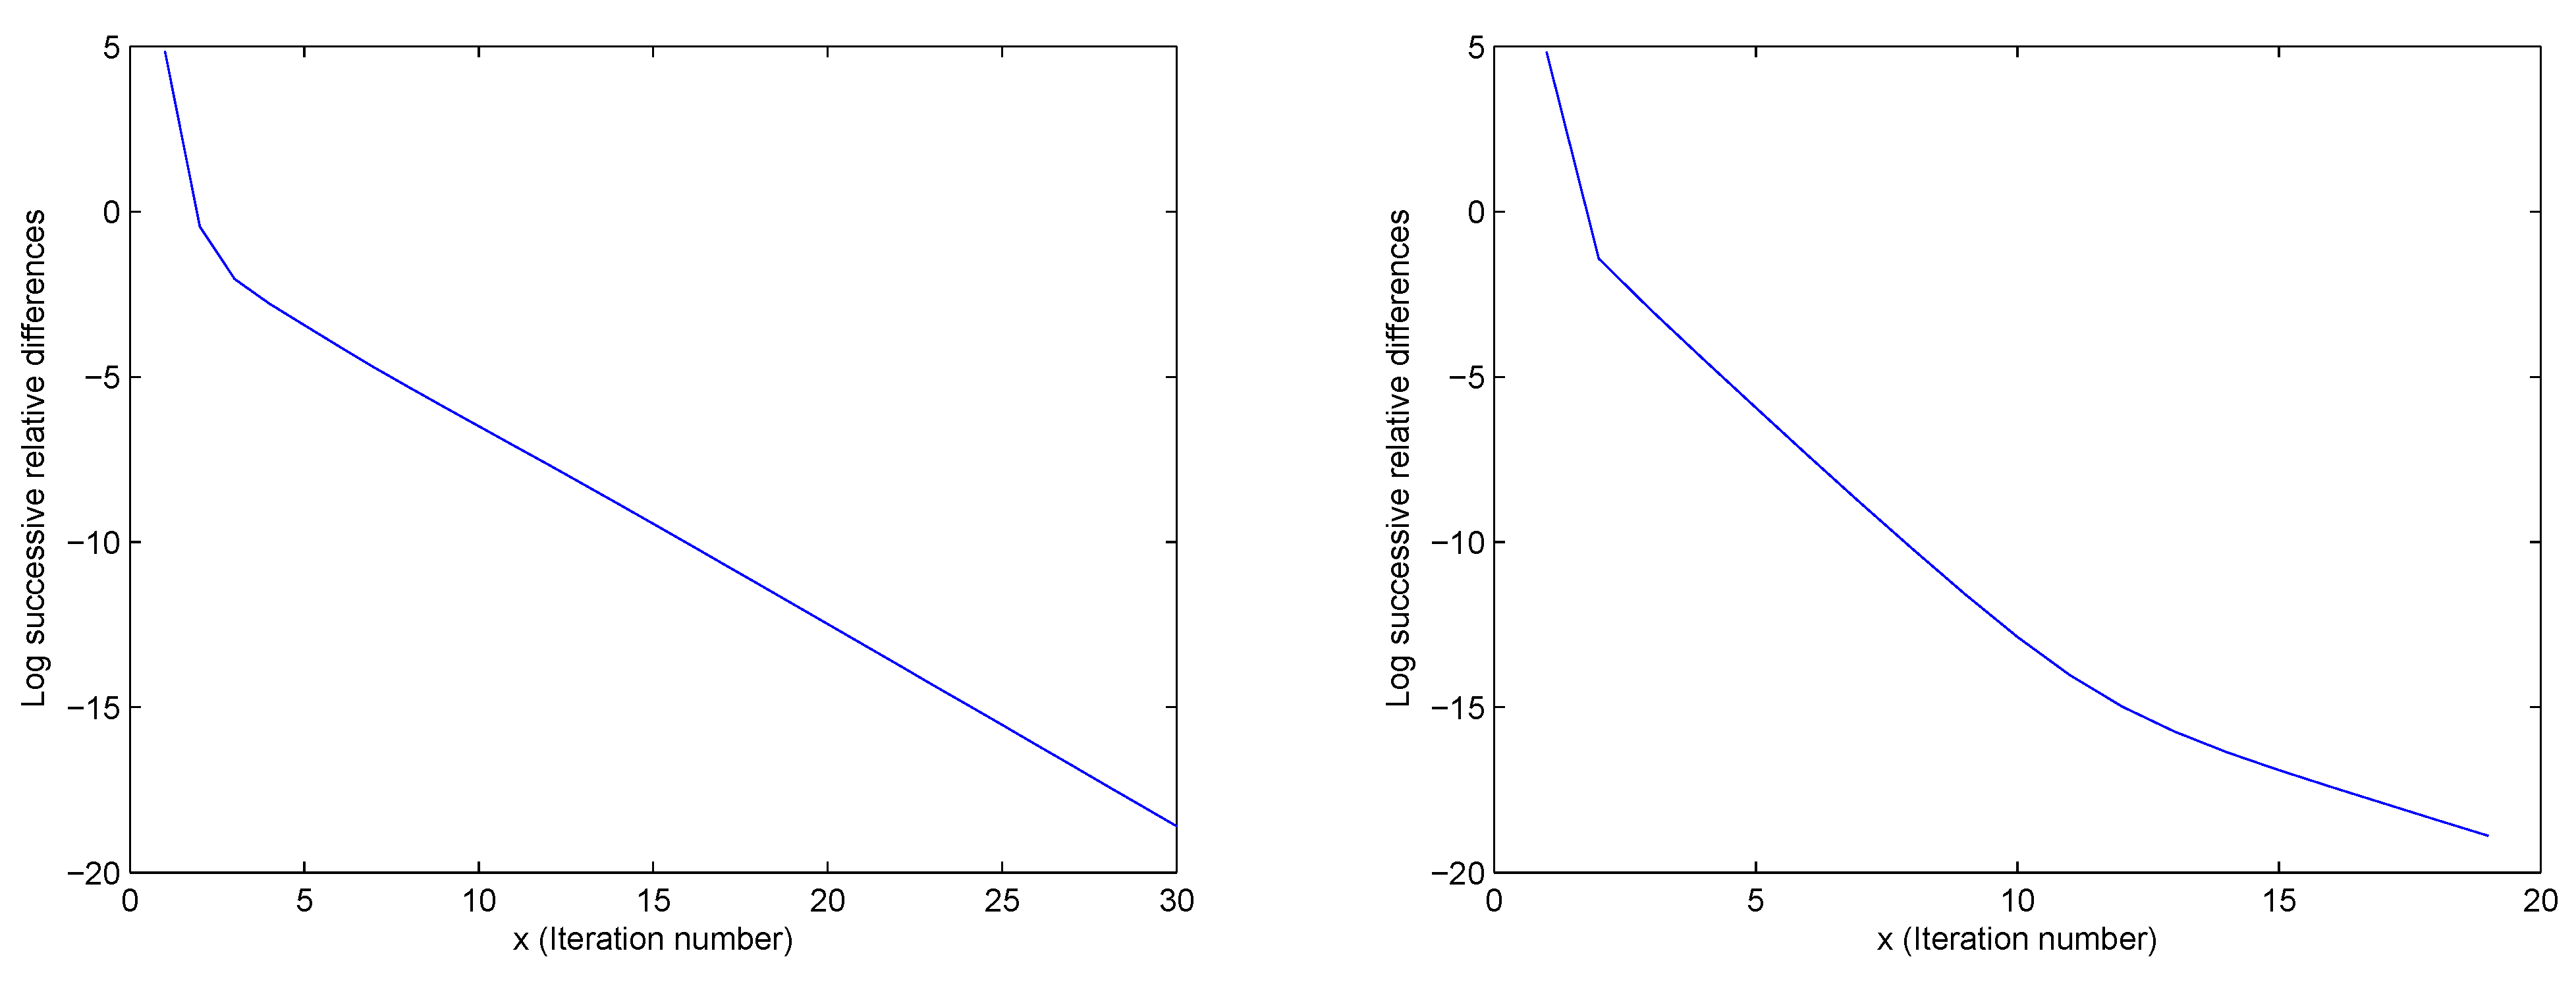
Figure 1.
Examples of patterns of convergence.
Figure 1.
Examples of patterns of convergence.
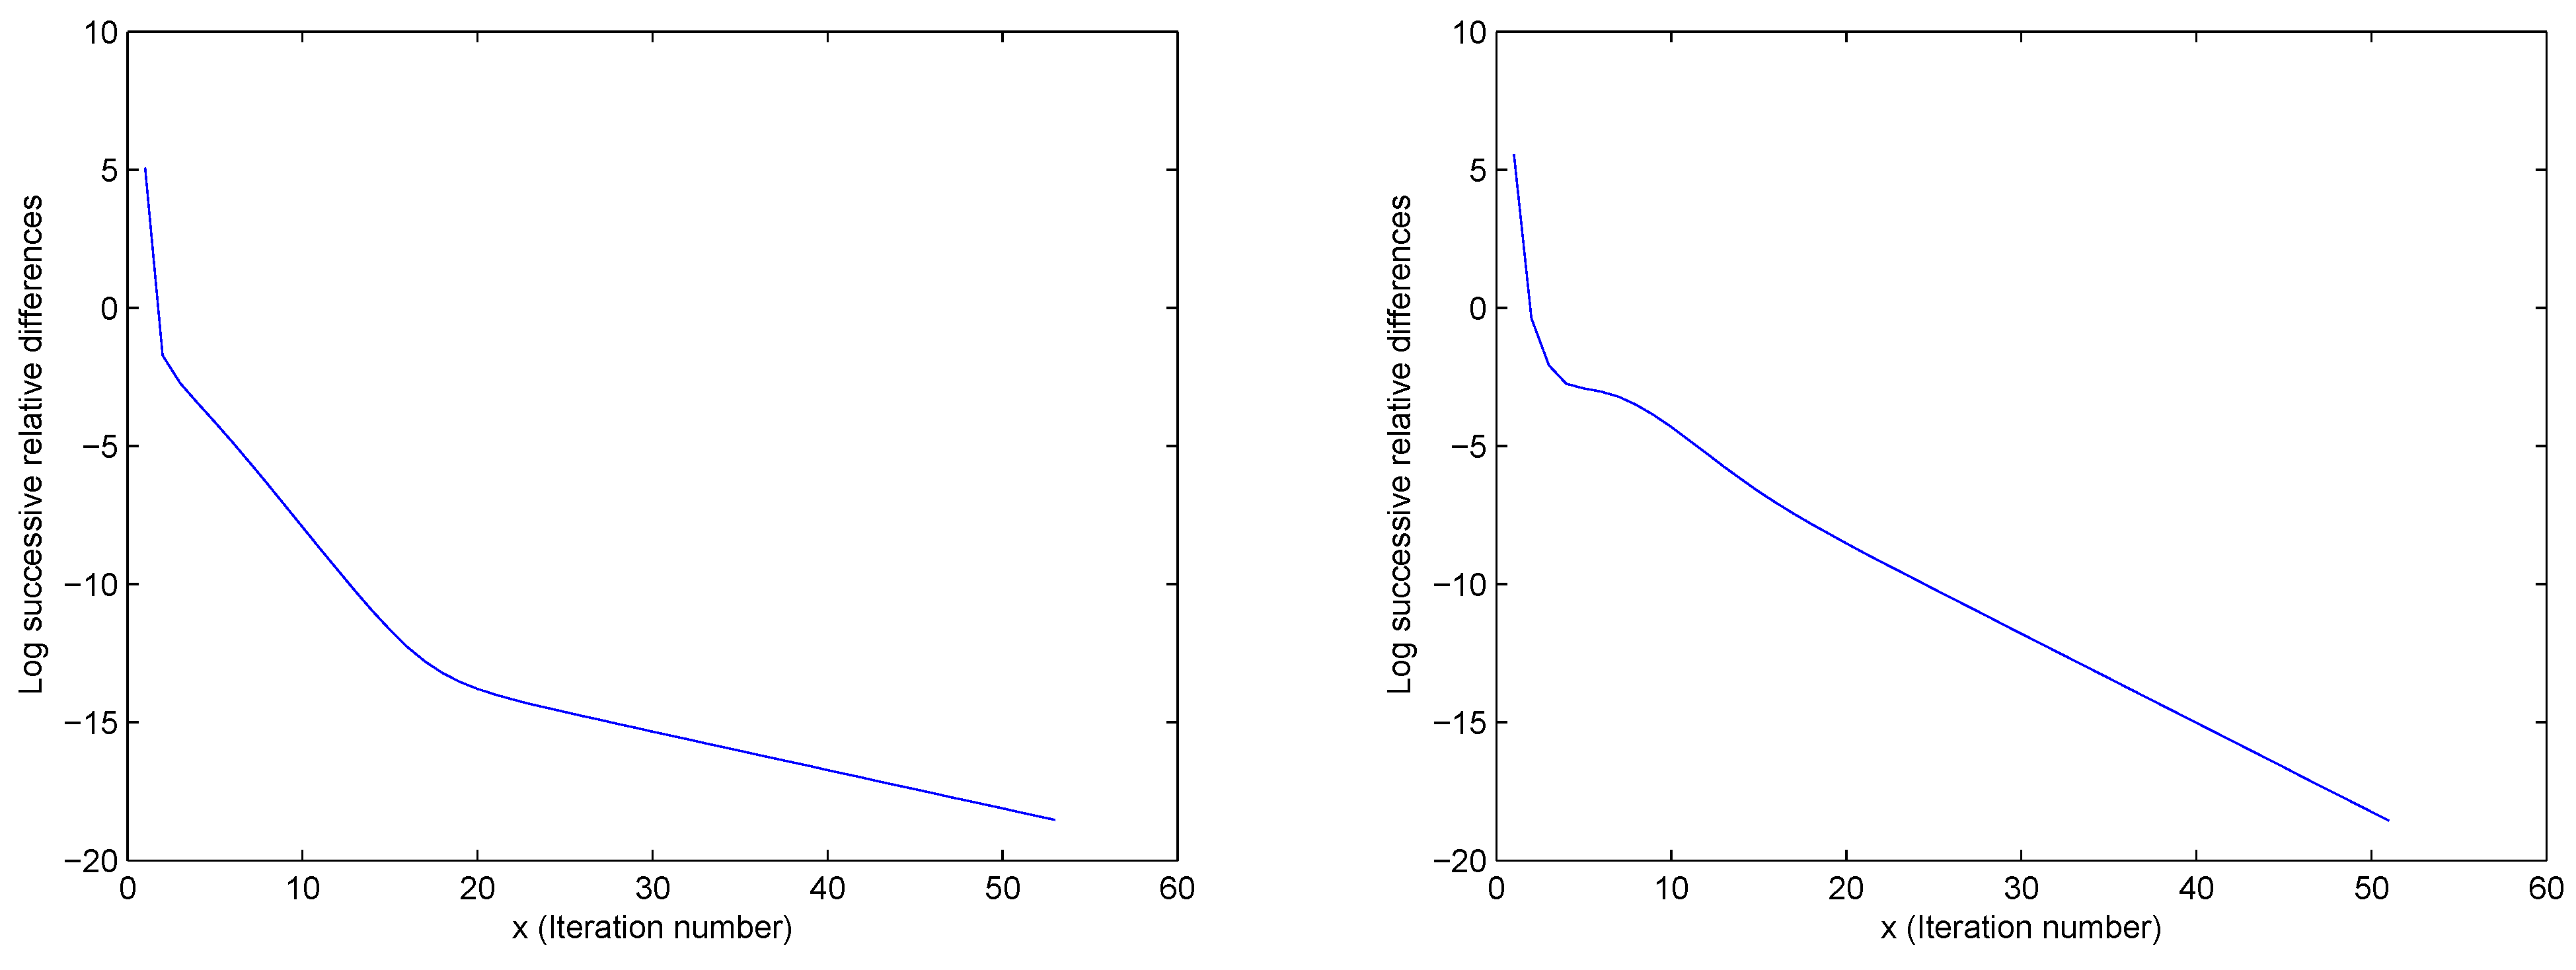
Figure 2.
Examples of patterns of convergence.
Figure 2.
Examples of patterns of convergence.
The figures (see
Figure 1 and
Figure 2) are plots of the log of the ratios of the squared Frobenius norms of the differences between consecutive iterates. In particular, they capture the type of convergence patterns that are observed in the
case from different starting values. In [
1] it was proved that regardless of the starting value (provided the dimensions are at least 3) the process of successive normalization always converges, in the sense that it leads to a doubly standardized matrix. In addition, it was noted that the convergence is very rapid. We can see empirically from
Figure 1,
Figure 2,
Figure 3,
Figure 4,
Figure 5,
Figure 6,
Figure 7,
Figure 8,
Figure 9,
Figure 10 and
Figure 11 that eventually the log of the successive squared differences tends to decay in a straight line,
i.e., the rate of convergence is perhaps exponential. This phenomenon of linear decay between successive iterations in the log scale is observed in all the diagrams. Hence, one is led naturally to ask whether this is always true in theory, and if so under what conditions. The rate of convergence of successive normalization and related questions are addressed in this paper.
Figure 3.
Two examples of simultaneous normalization: these illustrate that simultaneous normalization does not lead to convergence.
Figure 3.
Two examples of simultaneous normalization: these illustrate that simultaneous normalization does not lead to convergence.
Figure 4.
(Left) Example of simultaneous normalization, (Right) Same example zoomed in.
Figure 4.
(Left) Example of simultaneous normalization, (Right) Same example zoomed in.
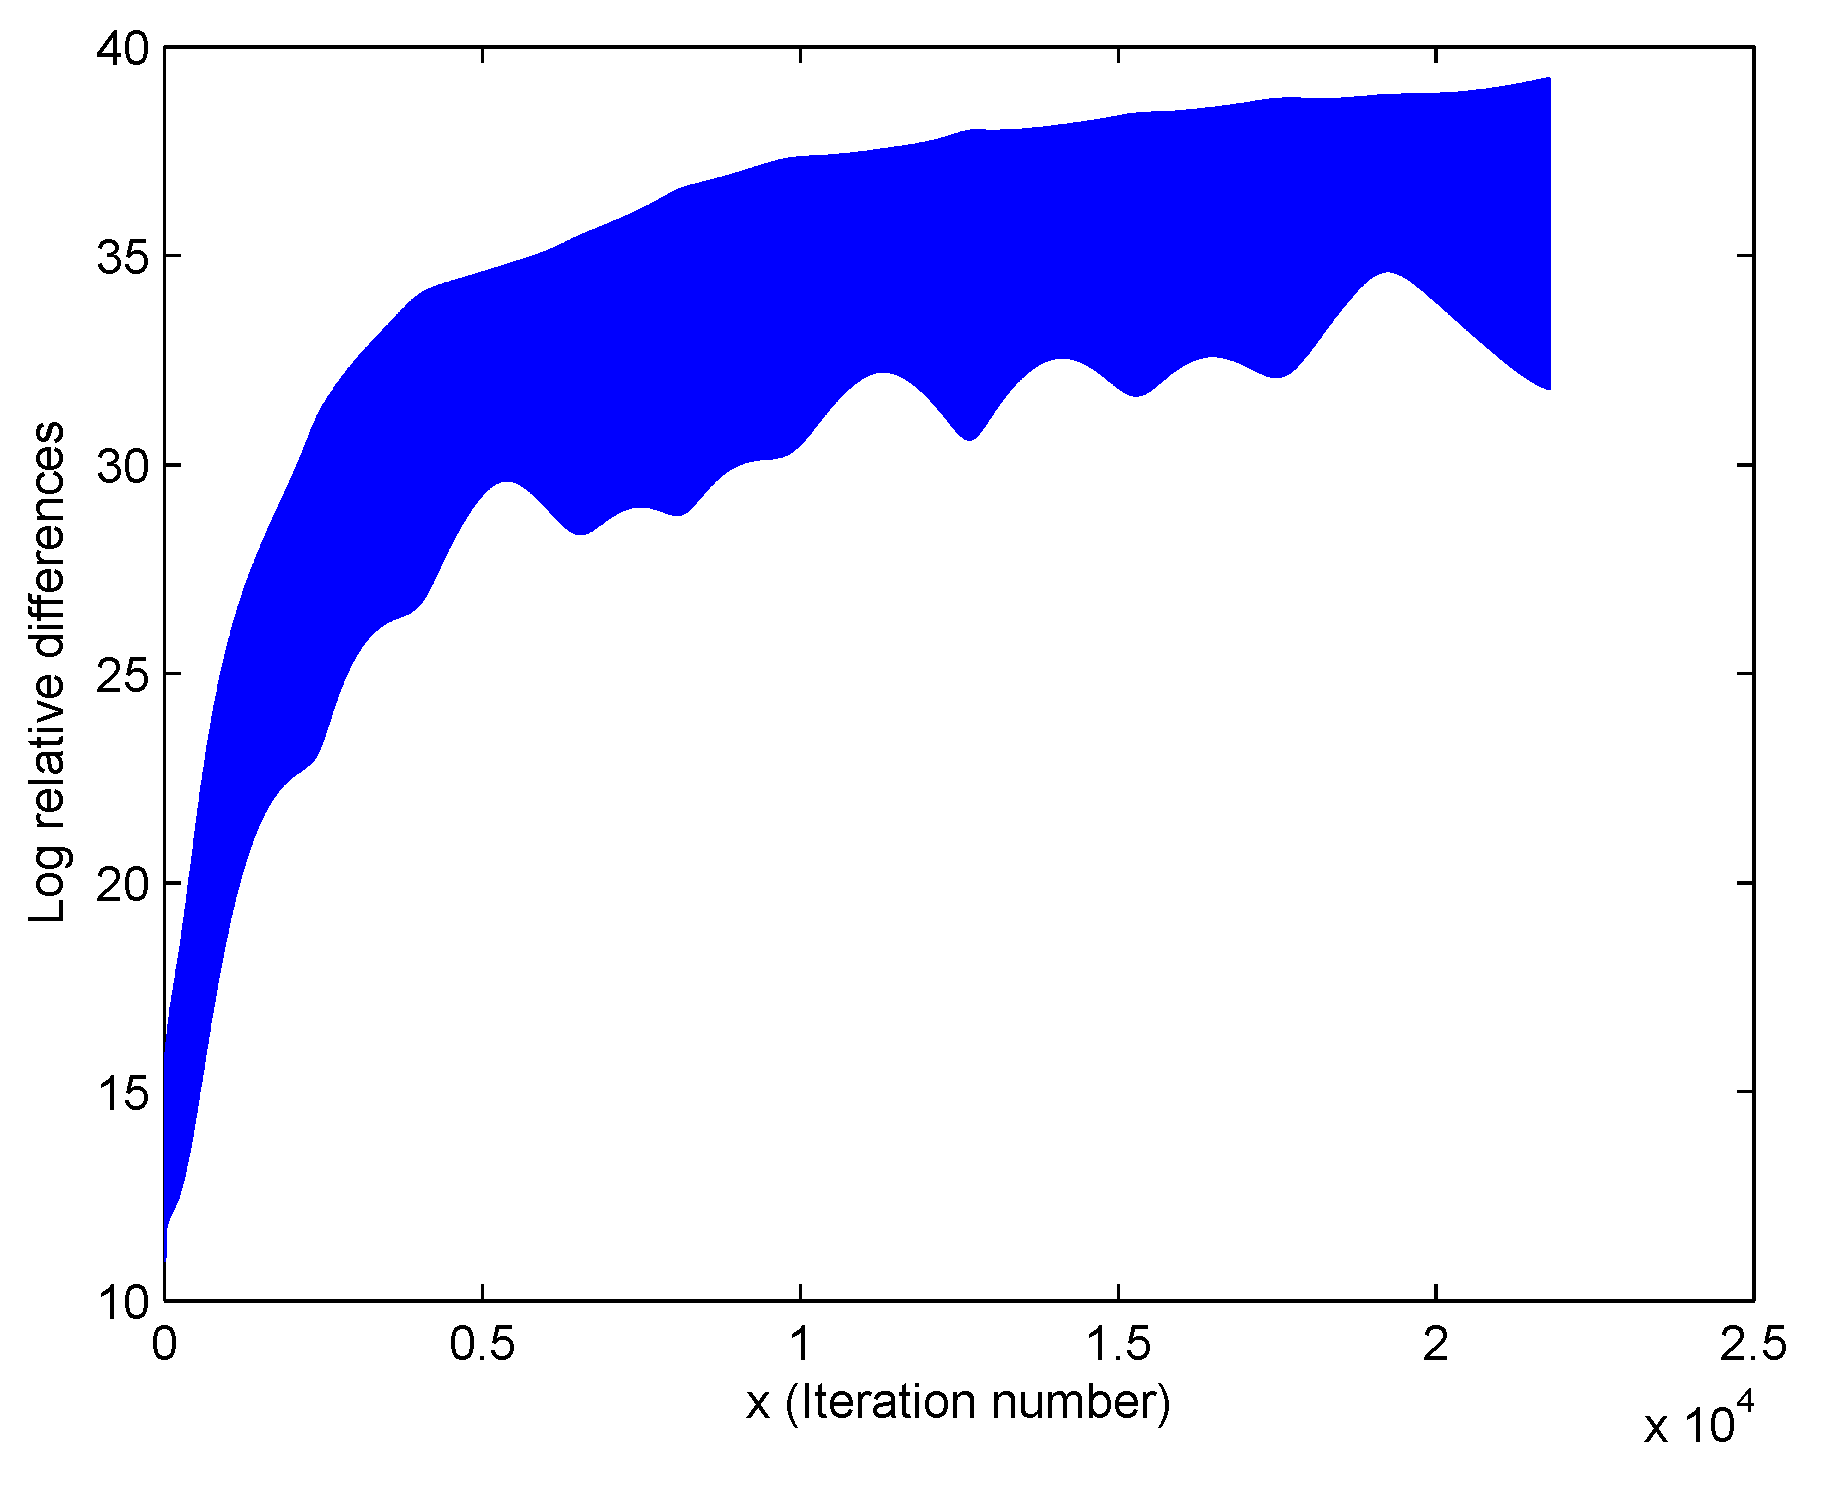
A natural question to ask is whether the convergence phenomenon observed will still occur if simultaneous normalization is undertaken as compared to successive normalization. In other words the row and column mean polishing and row and column standard deviation polishing are all done at once:
Figure 5.
(Left) Example of simultaneous normalization, (Right) Same example zoomed in.
Figure 5.
(Left) Example of simultaneous normalization, (Right) Same example zoomed in.
Figure 6.
(Left) Example of simultaneous normalization, (Right) Same example zoomed in.
Figure 6.
(Left) Example of simultaneous normalization, (Right) Same example zoomed in.
Figure 7.
Two further examples of simultaneous normalization: these illustrate that simultaneous normalization does not lead to convergence.
Figure 7.
Two further examples of simultaneous normalization: these illustrate that simultaneous normalization does not lead to convergence.
Figure 8.
Example of simultaneous normalization
Figure 8.
Example of simultaneous normalization
4. Convergence and Rates
Theorem 4.1 of [
1] is false. A claimed backwards martingale is NOT. Fortunately, all that seems damaged by the mistake is pride. Much is true. To establish what this is requires notation.
denotes an
matrix with values
. We take coordinates
to be iid
. As in [
1,
2],
. As before,
.
In view of [
1], almost surely
. By analogy, set
, where
. As in [
1],
. In general, for
m odd,
.
Likewise, for m even . Without loss, we take and to be positive for all .
In various places we make implicit use of a theorem of Skorokhod, the Heine–Borel Theorem, and this obvious fact. Suppose we are given a sequence of random variables
and a condition
that depends only on their finite-dimensional distributions. If we wish to make a conclusion
concerning
, then it is enough to find one probability space that supports
with given finite dimensional distributions for which
implies
. The theorem of Skorokhod mentioned (see pages 6–8 of [
3]) is to the effect that if the underlying probability space is (for measure theoretic purposes) the real line with measures given by, say, distribution functions
; and if
is compact with respect to weak convergence, where
converges to
G in distribution; then if each
is absolutely continuous with respect to some
H (which itself is absolutely continuous), and
, then
converges H-almost surely to a random variable
Y.
Off of a set of probability 0, for all . We assume that lies outside this “cursed” set. This is key to convergence.
Almost surely, has positive limsup as m increases without bound.
Let .
Since the entries of are independent, is row and column exchangeable. This property is inherited by for every q. Because all entries (for ) are a.e. bounded uniformly in , and exist and are finite (with fixed bound that applies to all q). Exchangeability implies that all , and all . Bounded convergence implies that if tends to 0 along a subsequence as m increases, not only is the limit bounded as a function of , but also the limit random variable has expectation 0. Necessarily every almost sure subsequential limit in m of the random variables has mean 0. Likewise, every almost sure subsequential limit in m of the random variables has expectation 1. All are bounded as functions of . One consequence of these matters is that .
The only subsequential almost sure limits of and of have expectation 1. Fix a . Let for some . Column exchangeability implies that for any pair iff . The first sentence entails that is not empty. Therefore, .
Let
. There is a subsequence of
—for simplicity write it as
—along which almost surely
If
then exchangeability implies that
. So without loss of generality, if
then
. Write
Since
a.s.((a) and the expectations of both are 1), and likewise with
replaced by
, ((b), etc..), and because
, the first expression of the immediately previous display tends to 0 on
E. So, too, does the second expression. This is possible only if
on
E (we take the positive square root). On
,
. Since
,
. Further,
As a corollary, one sees now that a.s. Since the original could be taken to be an arbitrary subsequence of , we conclude that convergence of row and column means to 0 and convergence of row and column standard deviations to 1 takes place everywhere except on a set of Lebesgue measure 0.
Theorem 4.1 Efron’s algorithm converges almost surely for on a Borel set of entries with complement a set of Lebesgue measure 0.
We turn now to a study of rates of convergence. To begin, define the following
Now let
Almost everywhere convergence and the fact that for each row and each column not every
can be of the same sign enable us to conclude that for
m large enough
Remember that for , , and analogously for .
We know that for all
a.e. To continue, we compute that
where
is the positive square root of
.
One argues that
where
A key observation is that for every
m, there exists
for which
are not of the same or all of the opposite sign as
, which, as was noted, are not, themselves of the same sign. Argue analogously regarding
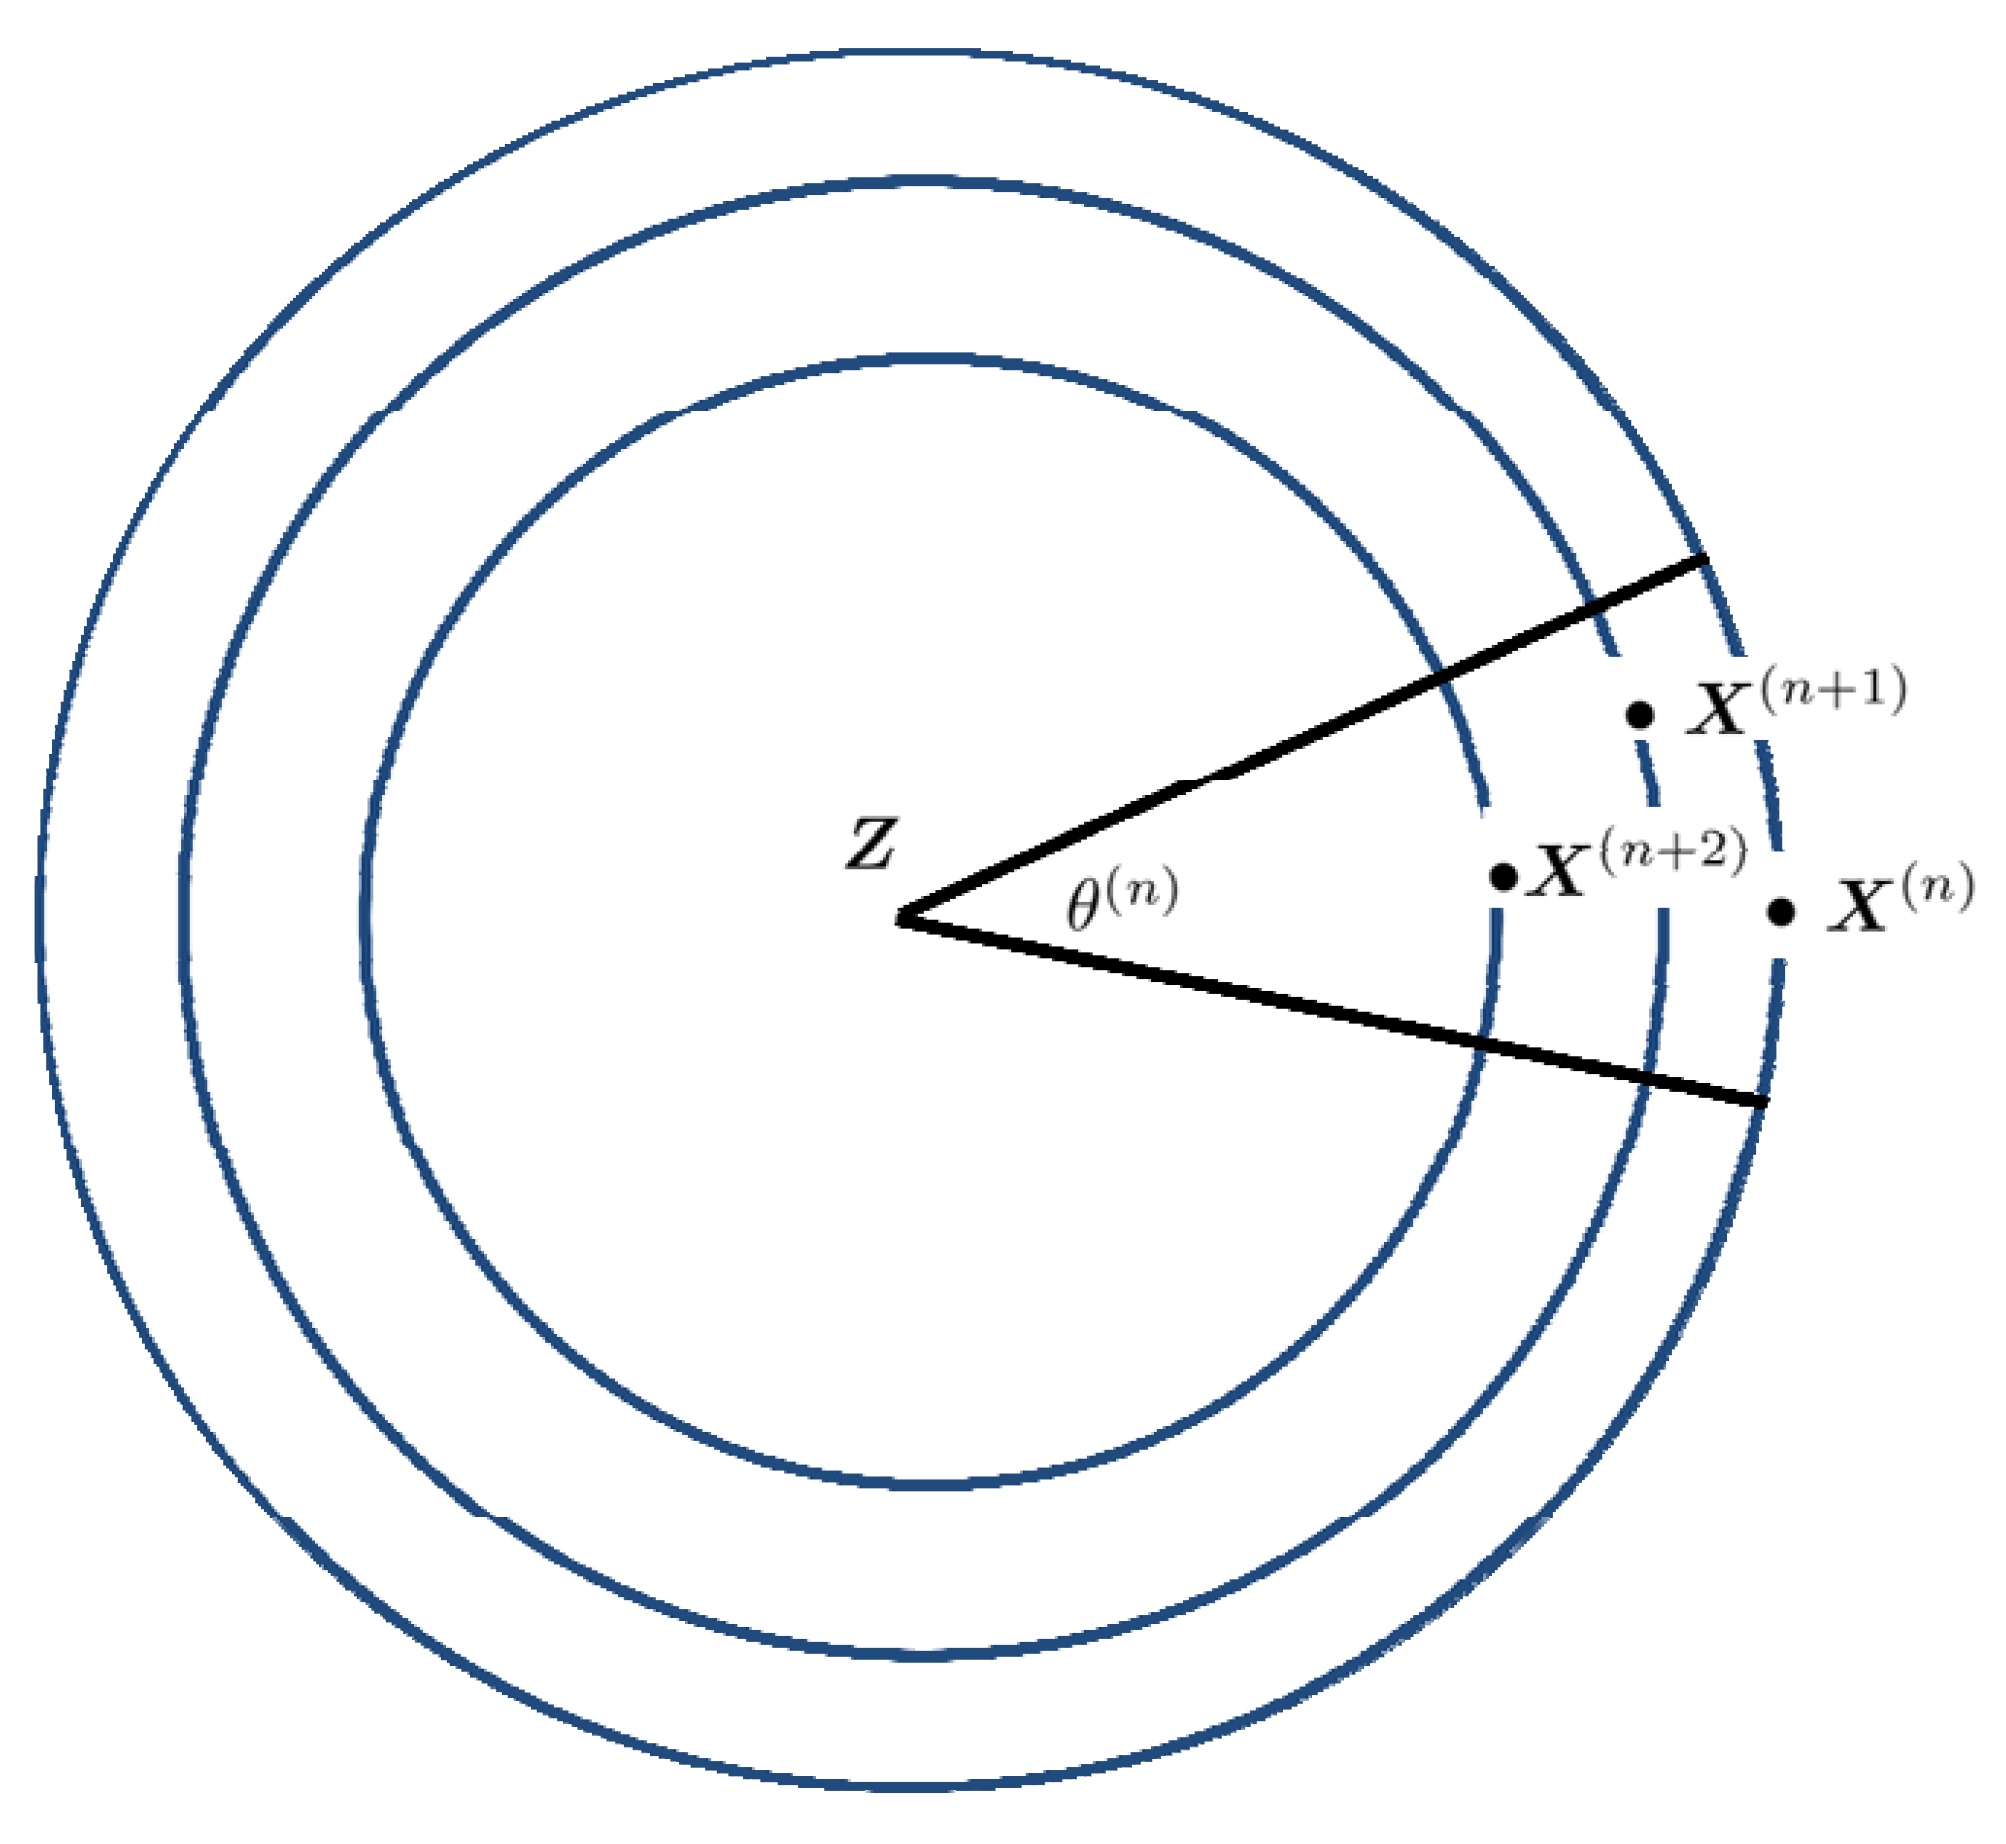
. Refer now to
Figure 9. Our arguments show the correctness of the concentric circles in
on which
ultimately lie. We conclude that to suitable approximation, the successive iterates lie on such circles with radii in geometric ratio. That ratio is uniformly
, but is
not arbitrarily close to 0. However
Figure 9 buries a key idea in our study of convergence are rates. Thus, write
for the angle between
and
Z. Obviously, the squared Frobenius norm
can be expressed as
Now rewrite . Therefore, convergence of to implies that can be taken arbitrarily close to 0. This is another way of saying that for each n, . Failure of this condition is why “simultaneous normalization" fails.
Figure 9.
For n large enough uniformly.
Figure 9.
For n large enough uniformly.
5. Illustrations of Convergence
We now illustrate the rapidity of convergence in the
case to give a geometric perspective. First note that in the
case the set of fixed points are characterized by 3 unique values. For instance, the following doubly normalized matrix which arises a result of successive normalization has only three unique elements.
Hence we can use the first column of the limit matrix to represent the fixed point arising from successive normalization. Hence the curve of fixed points can be generated by applying the successive normalization process to random starting values.
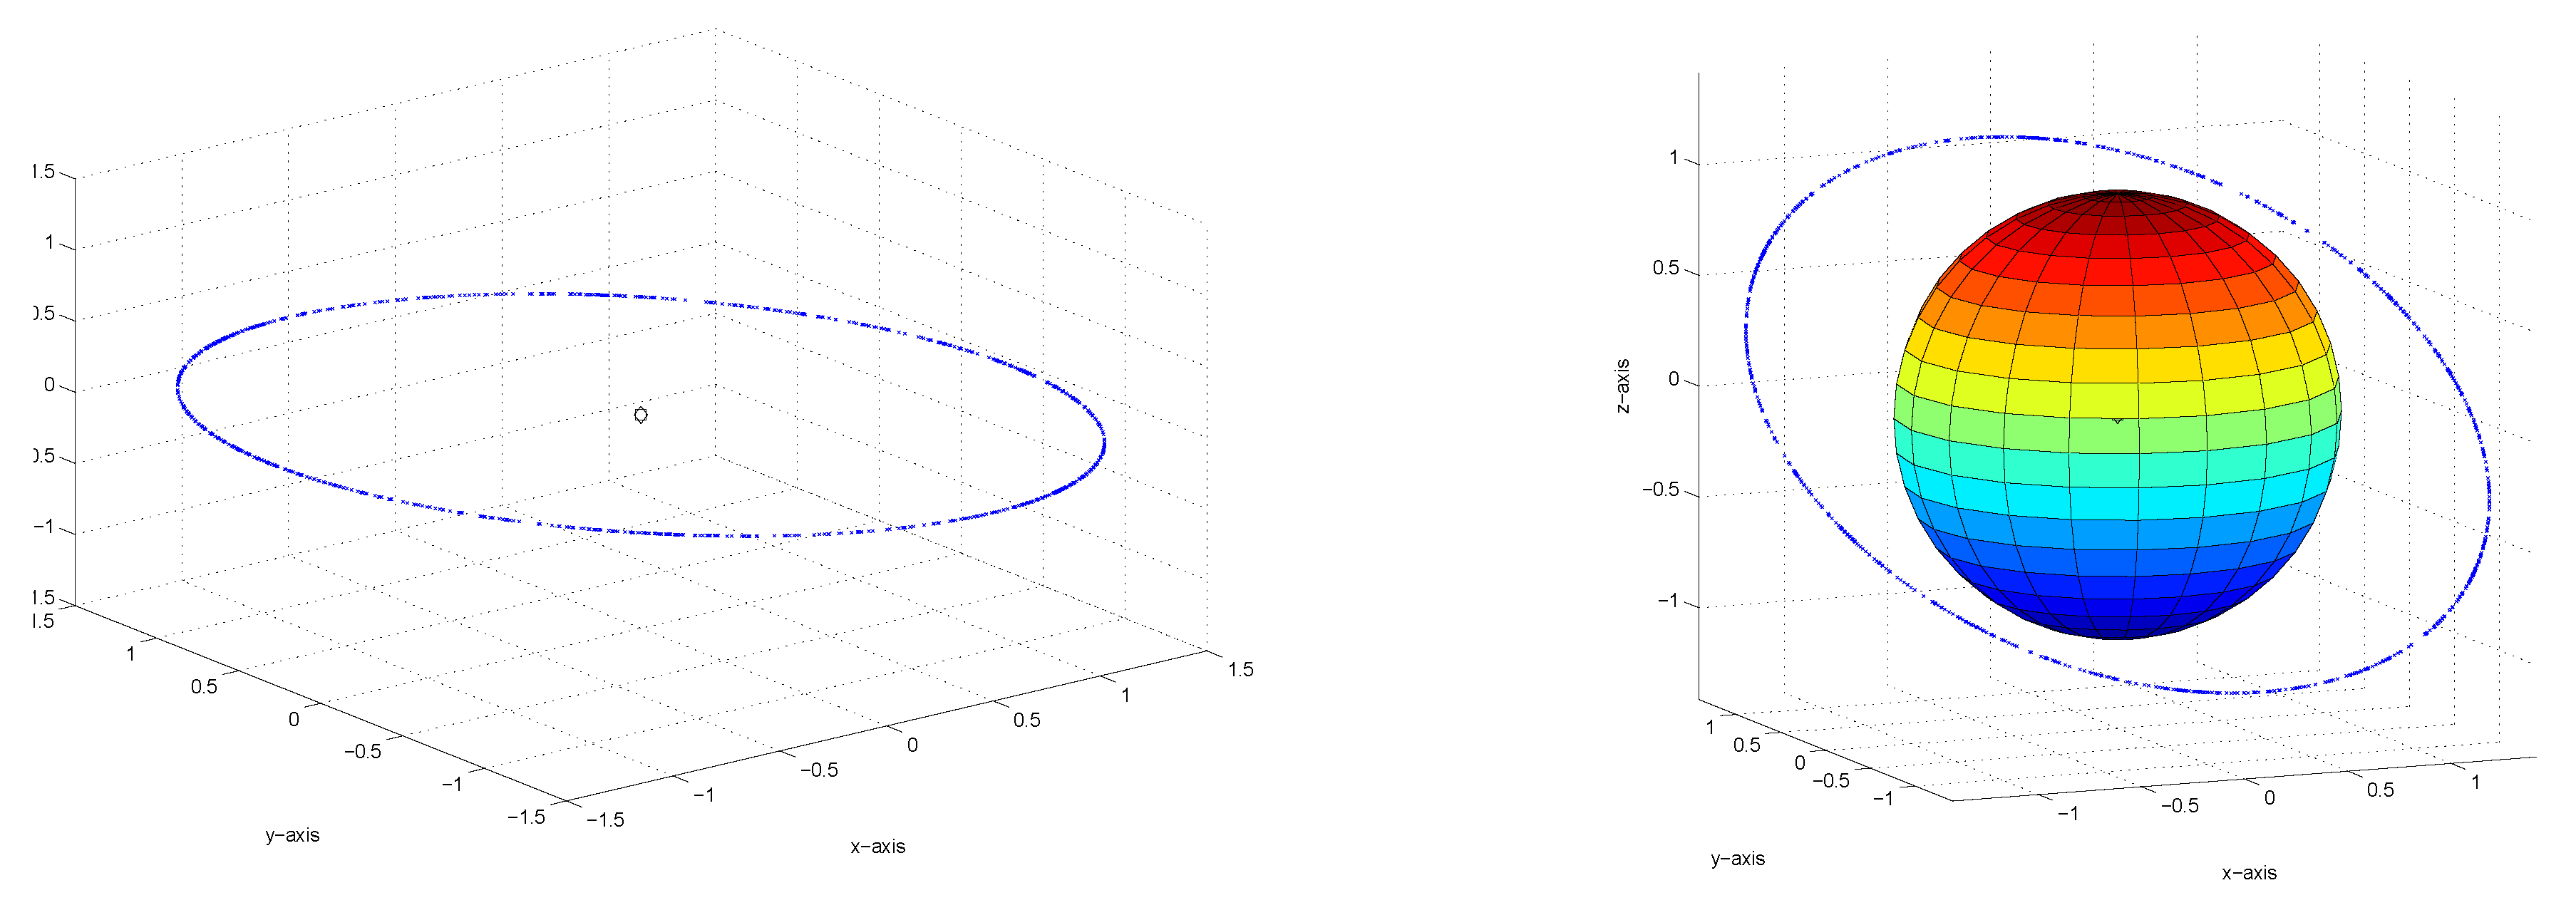
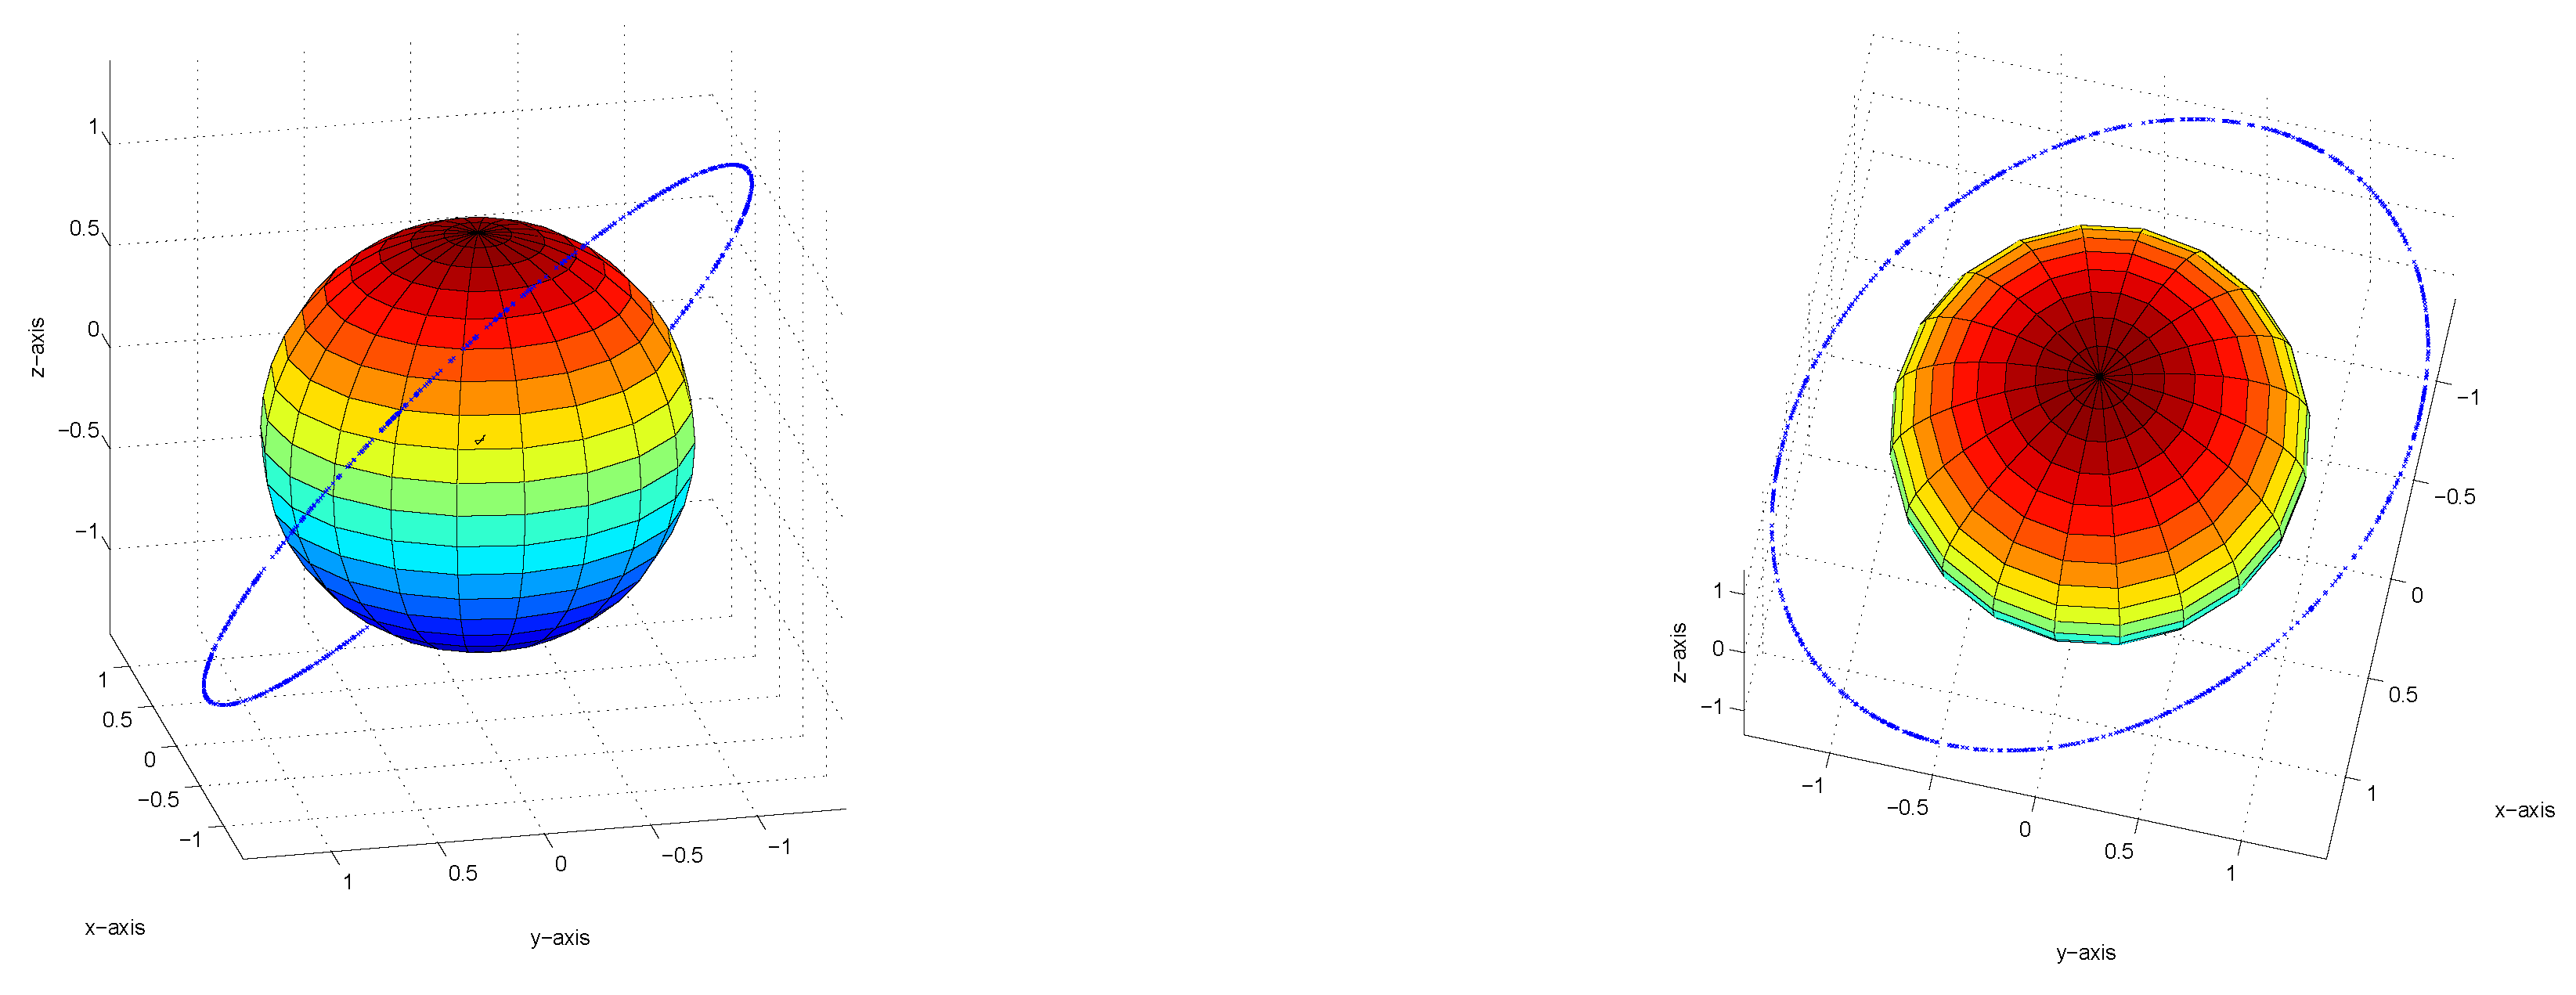
Figure 10 and
Figure 11 below illustrates the curve that characterizes the set of fixed points for the
matrix case when this numerical exercise is implemented. The origin is marked in black. The latter 3 subfigures superimpose the unit circle on the diagram in order to illustrate that the set of fixed points represent a “ring" around the unit sphere.
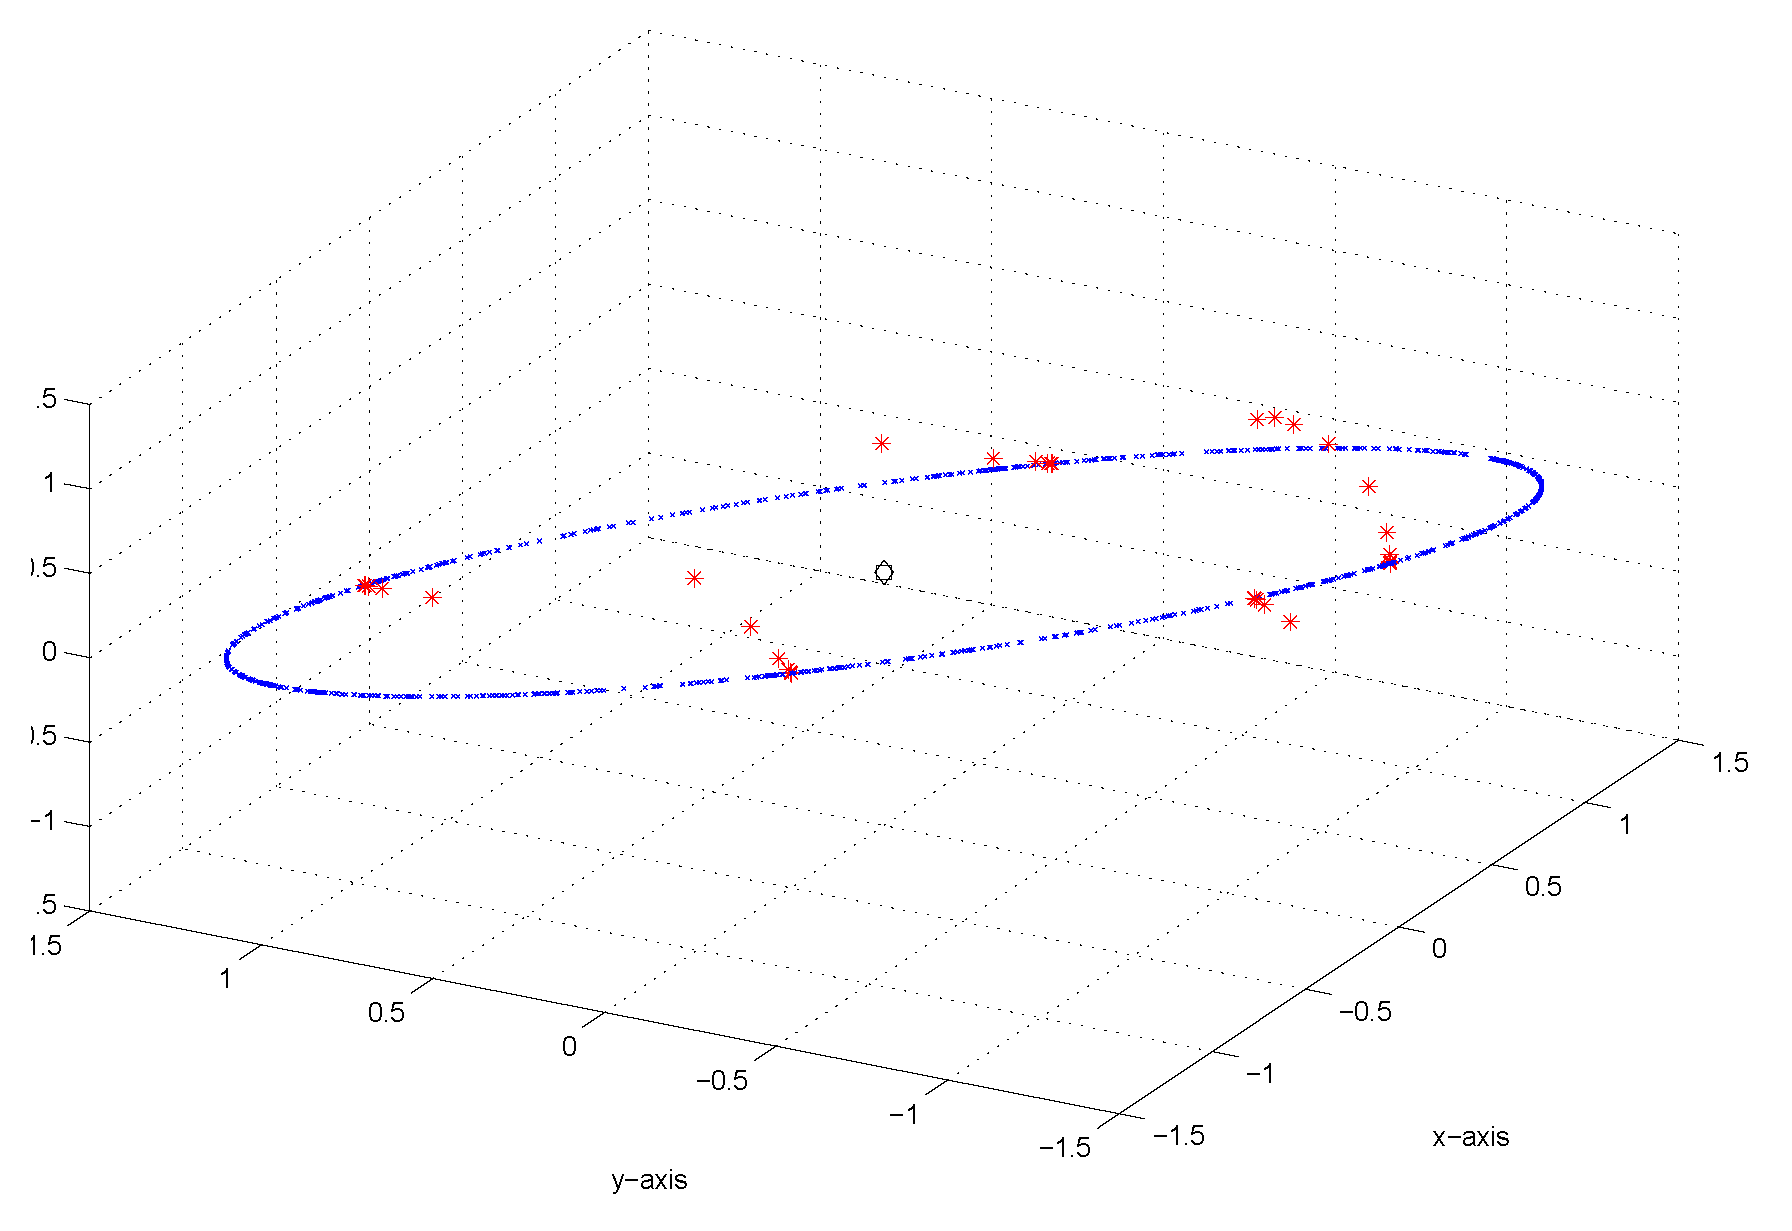
Figure 12 considers different starting values and their respective paths of convergence to the “ring" of fixed points.
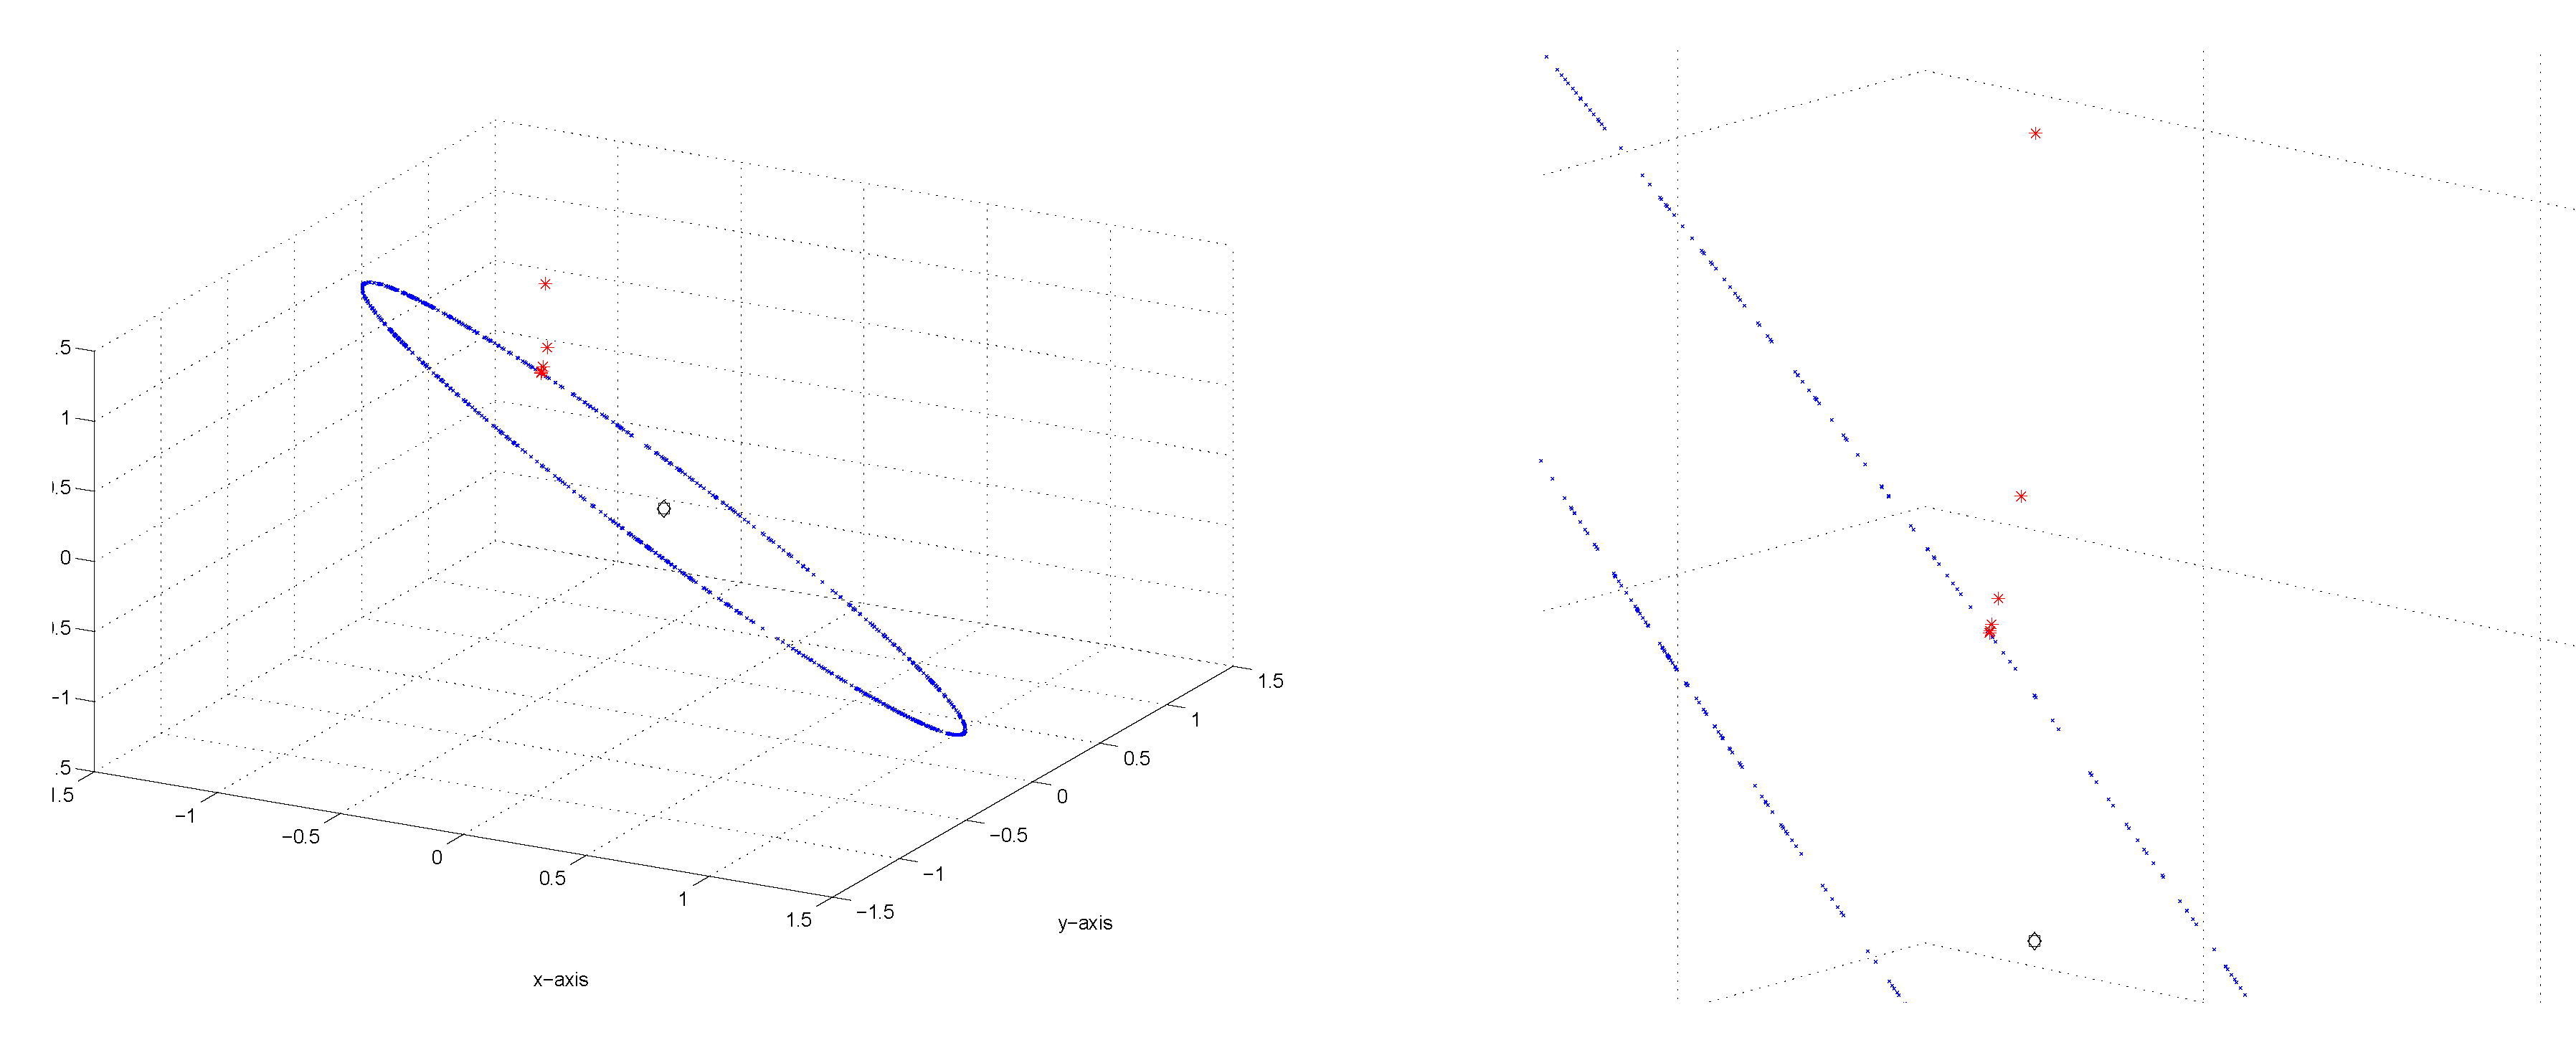
Figure 13,
Figure 14 and
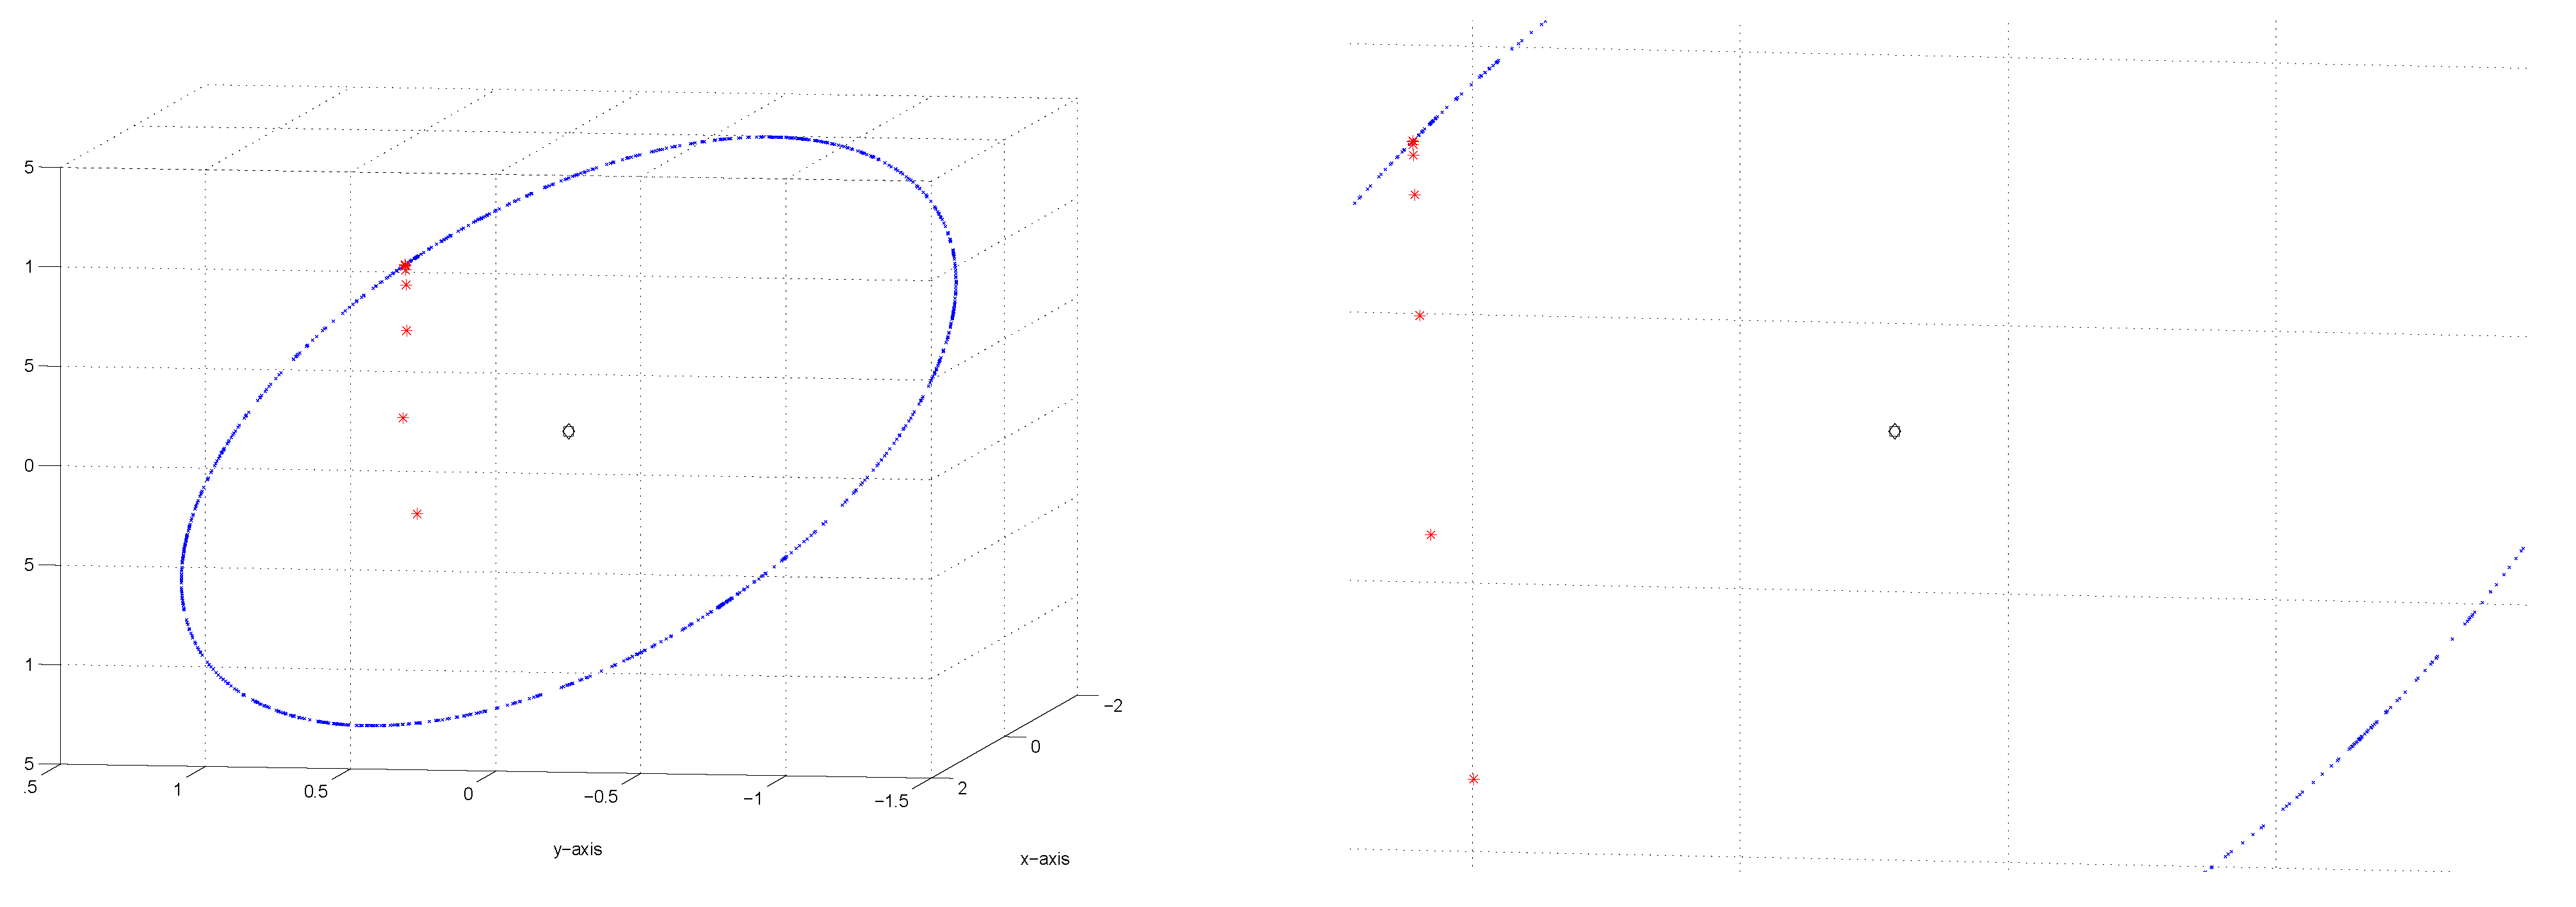
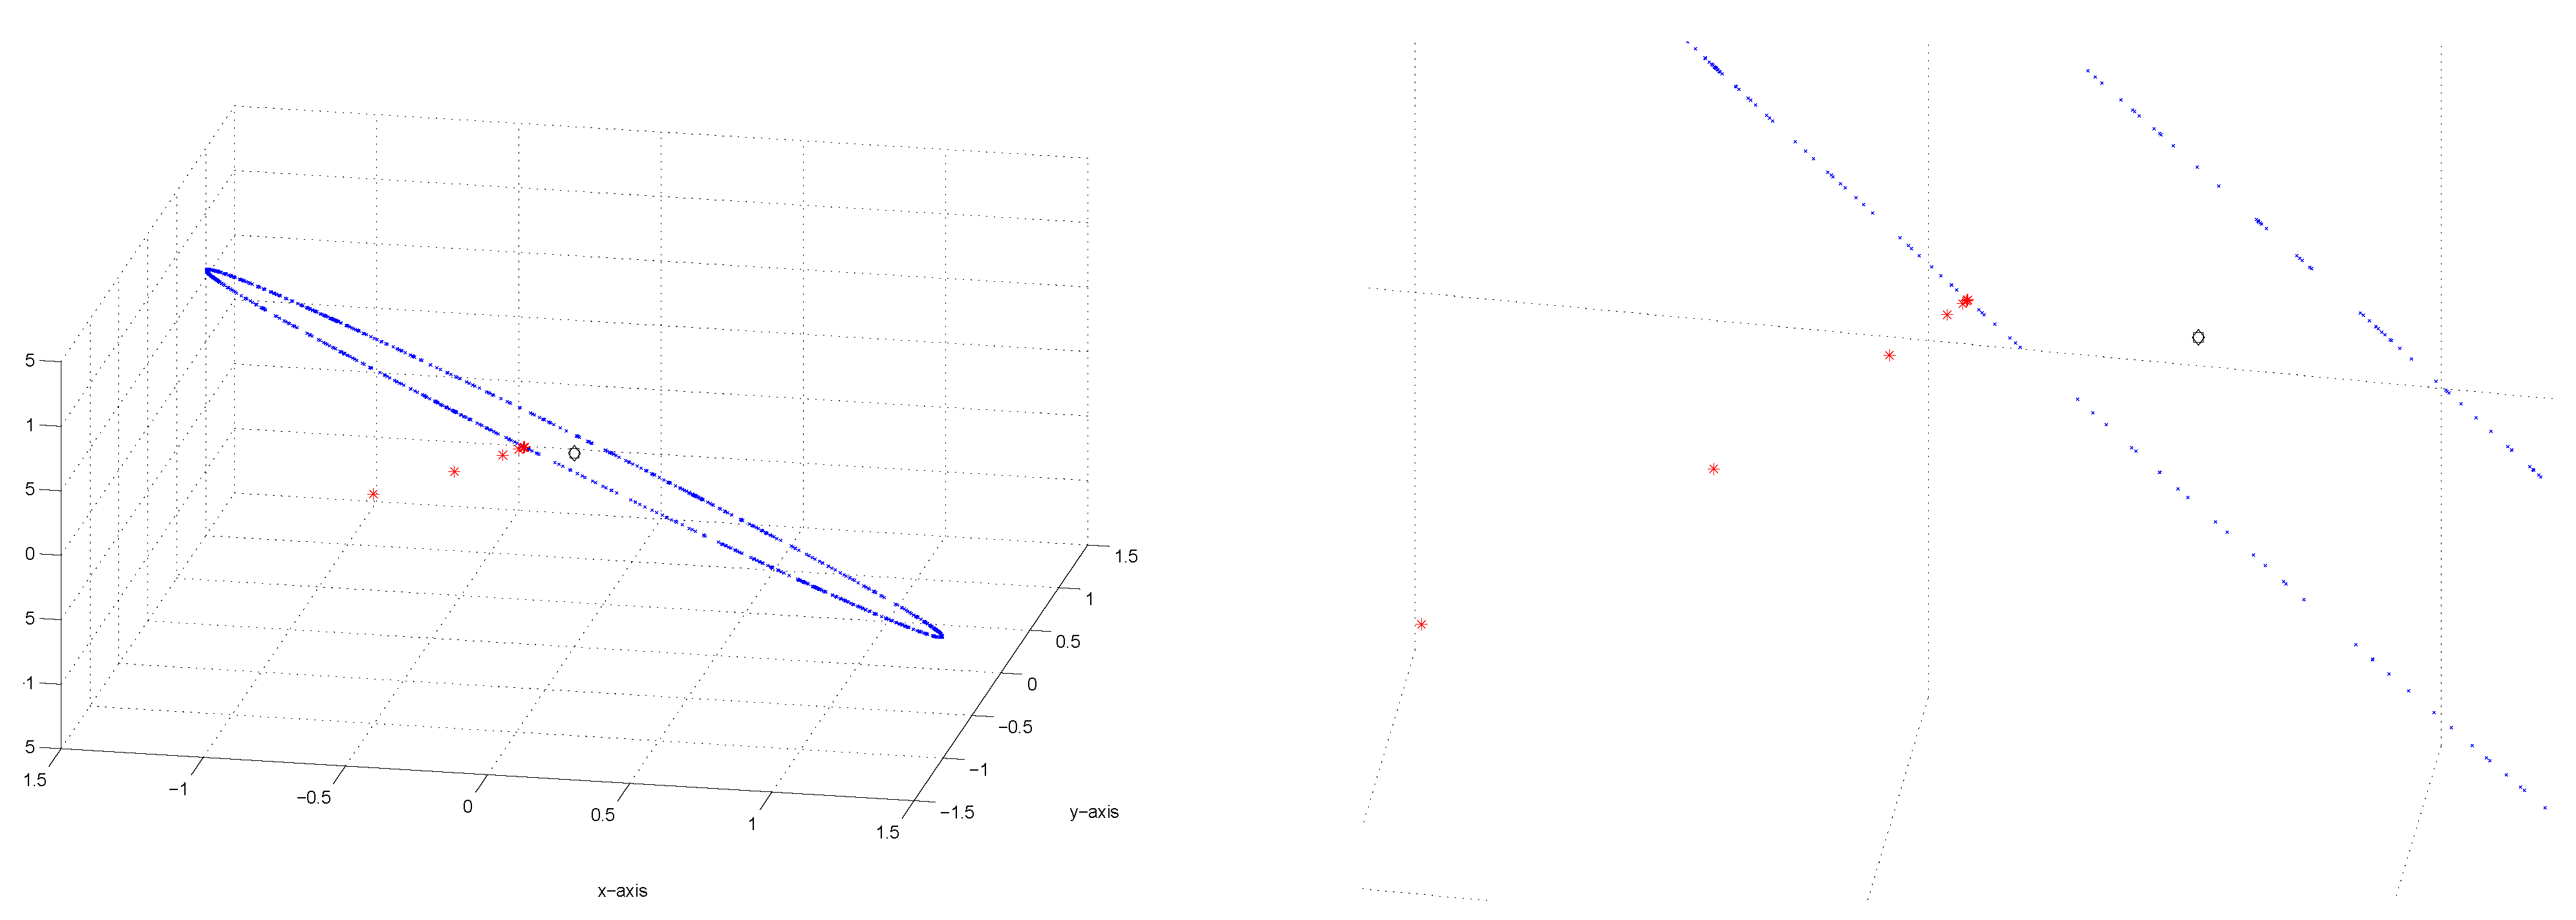
Figure 15 present 3 individual illustrations of different starting values and their respective paths of convergence to the “ring" of fixed points. For each example, a magnification or close-up of the path is provided. It is clear from these diagrams that the algorithm “accelerates" or “speeds up" as the sequence nears its limit.
Figure 10.
(Left) Set of fixed points, (Right) Set of fixed points + unit sphere.
Figure 10.
(Left) Set of fixed points, (Right) Set of fixed points + unit sphere.
Figure 11.
Set of fixed points + unit sphere from different perspectives.
Figure 11.
Set of fixed points + unit sphere from different perspectives.
Figure 12.
Illustration of convergence to fixed points from multiple starts.
Figure 12.
Illustration of convergence to fixed points from multiple starts.
Figure 13.
(Left) Example of convergence to set of fixed points, (Right) Close-up of Example.
Figure 13.
(Left) Example of convergence to set of fixed points, (Right) Close-up of Example.
Figure 14.
(Left) Example of convergence to set of fixed points, (Right) Close-up of Example.
Figure 14.
(Left) Example of convergence to set of fixed points, (Right) Close-up of Example.
