Abstract
: In this paper, we integrate a grid system and a wireless network to present a convenient computational service system, called the Semi-Preemptive Computational Service system (SePCS for short), which provides users with a wireless access environment and through which a user can share his/her resources with others. In the SePCS, each node is dynamically given a score based on its CPU level, available memory size, current length of waiting queue, CPU utilization and bandwidth. With the scores, resource nodes are classified into three levels. User requests based on their time constraints are also classified into three types. Resources of higher levels are allocated to more tightly constrained requests so as to increase the total performance of the system. To achieve this, a resource broker with the Semi-Preemptive Algorithm (SPA) is also proposed. When the resource broker cannot find suitable resources for the requests of higher type, it preempts the resource that is now executing a lower type request so that the request of higher type can be executed immediately. The SePCS can be applied to a Vehicular Ad Hoc Network (VANET), users of which can then exploit the convenient mobile network services and the wireless distributed computing. As a result, the performance of the system is higher than that of the tested schemes.
1. Introduction
The grids that prevail in recent years have proliferated the development of grid applications [1]. A large-scale grid system is often composed of hundreds to thousands of small and inexpensive computers to exploit low construction cost and high performance. Users worldwide can share grid resources through the Internet, and their submitted jobs can be accomplished by involving many geographically dispersed resources to achieve distributed computing. However, traditional grid systems are established on wired environments. Basically, a wired system often has wider bandwidth and higher security than those of a wireless environment. However, users have to access the grid resources at fixed points where wired links are available, resulting in poor network accessibility and availability [2].
Nowadays, wireless networks have been developed rapidly and equipped widely, and the scalability, bandwidth, system stability and network security all have been greatly improved [3]. Many problems of previous networks and some existing wireless networks, e.g., insufficient bandwidth for data transmission and the limited transferring distance, have been mitigated. The market and requirements due to availability of communication everywhere have unceasingly expanded and developed to satisfy modern people's needs and preferences. Many researchers have studied how to continuously raise grid efficiency and usage convenience by integrating it with wireless networks and other techniques [4,5]. The biggest shortcomings of wireless transmission are that the handover authentication is difficult [6] and messages conveyed on radio waves can be easily intercepted by hackers [7]. In fact, if we can integrate wireless networks and grids, keeping their original advantages, e.g., exploiting mobility of terminal devices, users can then conveniently access surrounding grid nodes and resources. The above-mentioned disadvantages of wireless systems can then be solved.
Therefore, in this study we propose a wireless service system, called the Semi-Preemptive Computational Service system (SePCS for short), which provides users with a wireless access environment and abundant grid computation resources, and through which users can share their own grid resources with others. In the SePCS, a node (fixed or mobile) can actively deliver a request to the resource broker. The resource broker then assigns a job corresponding to the request to the nodes with appropriate computation capability so as to accomplish the job as soon as possible where a job is a request in execution. Due to employing a wireless network environment, the SePCS covers a wider service area than that of a traditional wired grid and can be applied to vehicular communication since people who are traveling often carry handy devices. When they dynamically need a little high-complexity computation locally, e.g., a person on his/her way to visit customers by car wants to predict the trend of this morning’s stock market, the SePCS can allocate resources to do the prediction. On the other hand, the concept of the SePCS is similar to ad hoc cloud computing [8]. Users in these two systems can perform their jobs remotely, and do not need to carry high-performance devices so that the SePCS can be a part of the ad hoc cloud computing architecture.
In the SePCS, requests of higher priority that need to be served in real time, e.g., people are watching internet protocol TV (IPTV) or talking with others through the internet which has limited bandwidth and inefficient transmission, are allocated to the resources of higher performance. To achieve this, the resource broker reserves a part of its high-performance resources for the requests so that the requests can be served immediately and quickly without waiting in a service queue for a long time. When the resource broker cannot find suitable resources for the requests of higher type, it preempts the resource that is now executing a lower type request. That is why we call the SePCS the Semi-Preemptive Computational Service system. With the SePCS, the requests of higher type can be executed immediately so as to increase the performance of the system.
The key contributions of this study are as follows:
- (1) In the SePCS, user requests are served by grid resources geographically dispersed in different areas as a wireless distributed system to speed up the corresponding services and exploit wireless convenience.
- (2) Our algorithm is a semi-preemptive approach in which, when available resources are insufficient to service requests, the resource broker will preempt suitable resources that are serving low priority requests so that a high priority request can be served as soon as possible.
- (3) The SePCS can help vehicular passengers to access local and/or remote resources for their computation needs.
The rest of this article is organized as follows: Chapter 2 briefly describes the background and related research of this study. Chapters 3 and 4 introduce the proposed system architecture and the resource-brokering algorithm, respectively. Experimental results are presented and discussed in Chapter 5. Chapter 6 concludes this paper and addresses our future work.
2. Background and Related Work
2.1. Related Work
A wireless grid is a system that integrates a traditional grid with a wireless system to provide users with various services that can be conveniently accessed through wireless devices. Many researchers have studied this subject. Leu et al. [9] proposed a wireless grid service system, RWGSP, which employs a grid, mobile agents and wireless networks to create a wireless-device accessible grid environment. In the RWGSP system, messages can be ultimately delivered to their destinations, even though connectivity of the sender and the receiver is intermittent. However, the transmission quality of network connections in a wireless grid environment changes frequently, which will largely decrease the efficiency of data delivery.
The Interleaved Resource Status Monitoring algorithm (IRSM for short), proposed by Manvi and Birje [10] for a wireless grid, monitors important resources more frequently to achieve higher monitoring accuracy so that it can allocate the most suitable resources of the grid environment to satisfy different users’ needs. For example, for a computation task, CPU capability is more important than the amount of available memory in a grid node. Therefore, the IRSM monitors CPU more frequently than the amount of available memory. Higher accuracy of the monitored CPU load will lead the grid system to allocate more appropriate resources to serve user tasks. Consequently, the result is better system performance. In addition, three algorithms were proposed in [10], but the authors did not effectively compare their performance with that of the state-of-the-art algorithms proposed in their related articles.
Birje et al. [11] introduced an agent-based wireless grid in which mobile agents are classified into five categories, including Job Processing Agents, Job Mobile Agents, Resource Monitoring Agents, Actual Organization Resource Agents, and Virtual Organization Resource Manager. After the resource broker determines how to allocate resources to a task, mobile agents are employed to notify the requesting side and the service side. Moreover, the system calculates the service costs for each node so that the total cost of the whole system can be dramatically reduced. The basic criteria being considered for resource allocation include system load, the number of competitive resources, the previous accessing history of the visiting user, and the status of demand for the resources. However, the authors did not consider the network bandwidth, which is a key issue in evaluating the transmission efficiency of a wireless system.
Zeng et al. [12] designed a storage system for a wireless grid, which stores data in the nodes with higher computation capability, and uses proxies to manage devices. Nodes in different districts can communicate with each other through their own proxies and keep the data in different districts. However, the system has only one crawler server, which might be a bottleneck.
Du et al. [13] proposed a scheduling algorithm to schedule jobs and allocate resources in a mobile grid environment. The main ideas are rescheduling and replication, which make use of resources sufficiently when resources are active. But the authors did not consider capacity and capability difference among the resources.
In a wireless grid, we also consider multi-path routing that can avoid congestion, and improve throughput and security [14,15].
2.2. System Development Tools
Two network information collection tools, Ganglia [16,17,18] and Network Weather Service (NWS) [19,20], are employed in this study.
(1) Ganglia is a resource monitoring system that monitors the grid nodes of a system, and transmits data with XML format. With Ganglia, users can determine current cluster conditions through Web pages. Ganglia, adopting TCP/IP as its communication protocol and supporting the unicast/multicast transferring mode, comprises the Gangia Monitoring Daemon (gmond), Ganglia Meta Daemon (gmetad) and Ganglia PHP Web Frontend, in which the gmond installed in user nodes employs a simple listen/announce method to share its own information, including CPU capability, memory capability, disk storage, network status and process information, with servers and other nodes through XDR (XML-Data reduced), where XDR is a trimmed and improved version of the XML-Data schema syntax. The gmetad, installed in a server as a query conducting mechanism, can collect other nodes’ gmond and other servers’ gmetad information, and stores the information in an indexed round-robin database that not only holds data, but also displays the time sequence data to the system’s manager. The Ganglia PHP Web Frontend is a web-based sub-system that dynamically queries all nodes and shows the result to users.
(2) NWS is a distributed system that employs different kinds of sensors to periodically gather nodes’ current status and the network status of a grid system. For example, the CPU sensor checks CPU availability, and the network sensor monitors small-message round-trip time, large-message throughput, TCP socket connection/disconnection time, and the efficiency of TCP/IP protocol (e.g., bandwidth and latency).
3. The Proposed Architecture
The SePCS system architecture as shown in Figure 1 is composed of four subsystems, including Data Center, Information Managers, Resource Broker and Mobile Nodes. The first three together are called the Monitoring/Collection Information Server (MCI Server for short), and are associated with each of the others through a backbone network. Data Center is a database system that records resource information for the system. Information Manager is responsible for collecting, computing and classifying resources. Resource Broker takes charge of allocating resources to user requests. Mobile nodes connect themselves to the MCI Server through access points (APs for short) to acquire and provide grid resources. The relationship between Resource Broker and Information Manager is shown in Figure 2 in which we can see that Resource Broker consists of three global queues that are used to keep different types of user requests, and Scheduler, which allocates grid resources to the corresponding jobs. Information Manager comprises Collector, Front Unit, Calculator and Mobile Agents. Their functions will be defined and described later.
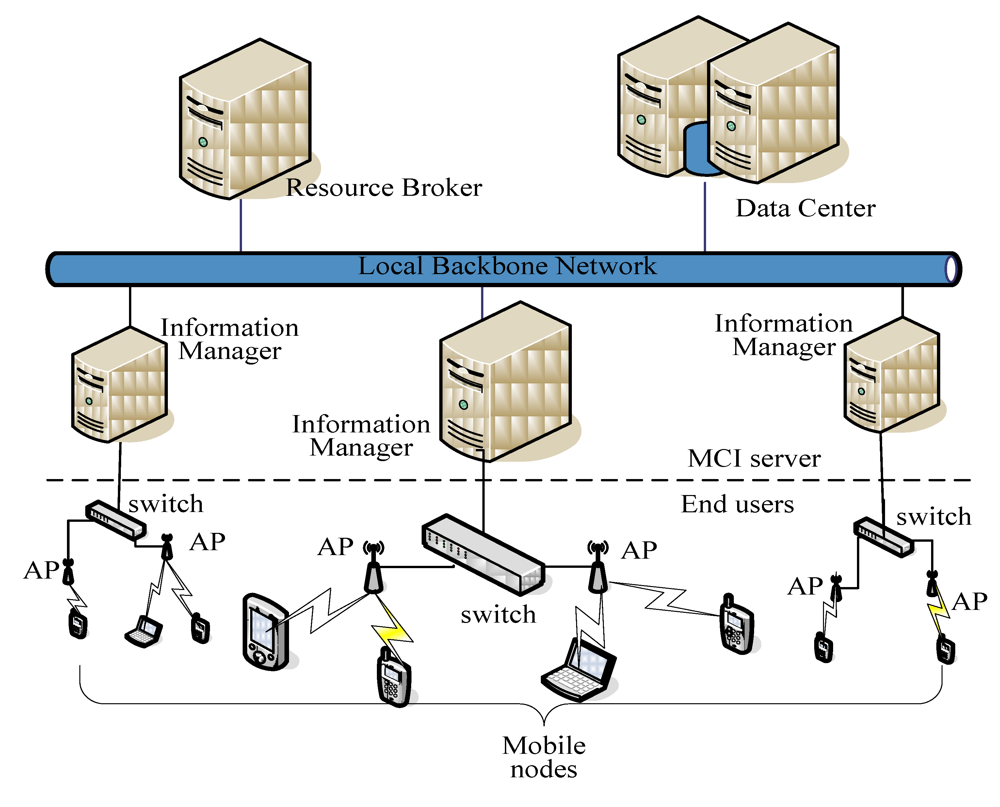
Figure 1.
The SePCS system architecture.

Figure 2.
The components of the MCI server.
3.1. Data Center
Data Center maintains a table, called the performance table, which records network status and node information collected by Information Manager, and several score tables that list the features of a node and their scores. Here, a request node is a node from which users submit their user requests, whereas a resource node is a node that serves users with its own resources. Request nodes and resource nodes together are called user nodes, and a request node may also be a resource node.
3.1.1. Performance Table and Score Tables
The performance table as shown in Table 1 has eleven fields, including Node IP, CPU Level, Available Memory Size (AMS), Current Length of Waiting Queue (CLWQ), CPU Utilization Rate (CUR), Network Bandwidth, Status, Performance Score, Performance Level, Original-Performance Level, and Information Manager ID.

Table 1.
An example of the performance table.
| Node IP | CPU Level | AMS | CLWQ | CUR | Network Bandwidth | Status | Performance Score | Performance Level | Original-Perf-Level | Infor. Manage.No. |
|---|---|---|---|---|---|---|---|---|---|---|
| 172.xxx.xxx.xxx. | 4 | 4 | 3 | 3 | 3 | Busy | 17 | 1 | 1 | A |
| 172.xxx.xxx.xxx. | 1 | 2 | 2 | 4 | 1 | Idle | 10 | 2 | 2 | A |
| 172.xxx.xxx.xxx. | 4 | 4 | 2 | 4 | 2 | Idle | 16 | 1 | 1 | A |
| 172.xxx.xxx.xxx. | 1 | 2 | 1 | 3 | 1 | Isolated | 8 | 0 | 0 | A |
| ….. | … | … | … | … | … | … | … | … | … | … |
The Node IP field records the IP of a node, e.g., N, which is unique and is given by Information Manager when N enters the SePCS system. CPU Level keeps the value obtained by multiplying N’s CPU clock rate and the number of CPU cores. The score table illustrating the classification of CPUs (see Table 2) classifies CPUs info four levels. When the multiplication P is greater than or equal to 10 GHz, the score is 4. When 8 GHz ≤ P< 10 GHz, 5 GHz ≤ P < 8 GHz and P < 5 GHz, the corresponding scores are 3, 2 and 1, respectively. AMS is also classified into 4 levels (see Table 3). When 3 GB ≤ AMS, the score is 4. When 2 GB ≤ AMS < 3 GB, the score is 3, and so on. CLWQ, used to evaluate how many requests are waiting to be served by N, is also classified into 4 levels (see Table 4). When the length L is greater than or equal to 0 and less than or equal to 25, the score is 4. When 25 < L ≤ 50, the score is 3, and so on. CPU Utilization Rate is also classified into 4 levels (see Table 5). When the CPU utilization rate U is greater than or equal to 0% and less than or equal to 25%, the score is 4. When 25% < U ≤ 50%, the score is 3, and so on. Network Bandwidth is classified into 3 levels. The details are listed in Table 6. The last five fields of the performance table will be described later.

Table 2.
The score table of CPU levels.
| CPU Level (no. of cores*clock rate) | Score |
|---|---|
| 10 GHz ≤ CPU level | 4 |
| 8 GHz ≤ CPU level < 10 GHz | 3 |
| 5 GHz ≤ CPU level < 8 GHz | 2 |
| CPU level <5 | 1 |

Table 3.
The score table of available memory sizes.
| Available memory size (AMS) | Score |
|---|---|
| 3 GB ≤ AMS | 4 |
| 2 GB ≤ AMS < 3 GB | 3 |
| 1 GB ≤ AMS < 2 GB | 2 |
| AMS < 1 GB | 1 |

Table 4.
The score table of current length of a waiting queue.
| Current length of waiting queue (CLWQ) | Score |
|---|---|
| 0 ≤ CLWQ ≤ 25 | 4 |
| 25 < CLWQ ≤ 50 | 3 |
| 50 < CLWQ ≤ 75 | 2 |
| 75 < CLWQ | 1 |

Table 5.
The score table of CPU utilization rates.
| CPU utilization rate | Score |
|---|---|
| 0 ≤ CUR ≤ 25 | 4 |
| 25 < CUR ≤ 50 | 3 |
| 50 < CUR ≤ 75 | 2 |
| 75 < CUR ≤ 100 | 1 |

Table 6.
The score table of bandwidths.
| Bandwidth | Score |
|---|---|
| 11 Mbps ≤ Bandwidth | 3 |
| 5 Mbps ≤ Bandwidth < 11 Mbps | 2 |
| Bandwidth < 5 Mbps | 1 |
3.1.2. Node and Request Classification
The entry values in the performance table are collected with different methods, e.g., the available memory size, CLWQ and CPU utilization rate, are gathered by Ganglia by actively polling resource nodes. The bandwidth is gathered by the TCP/IP network sensor in the NWS. The Information Manager periodically retrieves the performance table to calculate the performance scores, i.e., the fourth from last column of Table 1, for all resource nodes in the system. The score of a node x, denoted by Score(x), is defined as:

which was proposed by Leu et al. in [21] where p (= 5) is the number of resource features collected in the performance table, i.e., columns 2 to 6, and SCxk is the score of the kth resource feature (1 ≤ k ≤ p). With Score()s, the nodes in the underlying grid system are classified into three performance levels (i.e., the third from last column of Table 1). Those with Score() ≥ belong to level 1, those with 16 ≥ Score() ≥ 15 (Score() ≤ 14) are level 2 (level 3). Each level has its corresponding serving user requests, e.g., IPTV due to its tight time constraint belongs to level 1.
Furthermore, at any moment each resource node can be in one of the three states: idle, busy and isolated. A node N in idle state means that it is currently executing no jobs. As stated above, when Resource Broker/Scheduler allocates a resource node to a request, the request becomes a job to be served by the node. N in its busy state means that N is executing a job. The isolated state indicates that N does not share its resources with others, and a node in isolated state cannot send requests to acquire resources. N in its isolated state may occur in two cases: when N is executing some particular jobs, e.g., processing private information, and when it is temporarily inconvenient for the user of N to share his/her own resources with others. To isolate N from the system, we can terminate N’s Gmond tool [8]. Then Resource Broker will not allocate N to serve user requests.
User requests are also classified into three types.
- (1) Type 1: Real-time requests which will become time-constrained jobs, e.g., requesting a video TV program through IPTV.
- (2) Type 2: Normal processes, e.g., ordinary applications.
- (3) Type 3: Non-real-time data transmission and data storage, e.g., FTP and email delivery.
A type-i request when sent to Resource Broker will be enqueued in a type-i global queue, i = 1, 2, 3.
3.1.3. Semi-Preemptive Mode Resource Allocation
Before sending a request to Resource Broker, a user has to describe which type the request is. Note that a node’s performance score is dynamic, e.g., an originally level-1 resource node may become level-2 or level-3 if its load is now heavy, AMS is not huge enough and CLWQ is long.
Generally, there are at least two methods that can be employed to allocate different levels of resource nodes to different types of requests.
- (1) Level-i resource nodes can only be allocated to serve type-i requests.
- (2) Level-i resource nodes can only be allocated to serve type-j requests where i ≤ j, e.g., level-1 resource nodes can serve type-1, type-2, and type-3 requests, and level-3 nodes can only be allocated to serve type-3 requests.
However, with the first method, when many type-i requests and few type-j requests, i ≠ j, arrive, but currently no level-i resource nodes are available, many type-i requests have to wait in the type-i global queue for a long time, leaving many level-j resource nodes idle. When a few type-i and many type-j requests are submitted at the same time, i≤ j, the second method can solve the type-j’s long waiting-time problem since level-i resource nodes can be allocated to serve the remaining type-j requests.
Nevertheless, the second method may introduce another problem, e.g., many type-1 requests are submitted, but currently insufficient level-1 resource nodes can serve them immediately. The reason is that many originally level-1 resource nodes are now serving type-2 and type-3 requests and become level-2 or level-3 resource nodes where originally level-i resource nodes (o-level-i resource nodes for short) are those nodes belonging to level-i when they are idle, i = 1, 2. Hence, some of these type-1 requests have to wait for a long time in the type-1 global queue.
One may always point out that preemptive allocation can solve this problem, i.e., an o-level-1 resource node, e.g., N, which is now serving a type-2 or type-3 request may be preempted so that it can recover to level-1 immediately. This is true. But this also means that the resources consumed to serve the preempted job are wasted.
(1) Resource Allocation
To solve these problems, in this study, we propose a semi-preemptive approach, which reserves R1% of o-level-1 (R2% of o-level-2) resource nodes to serve type-1 (type-2) requests. The purpose is to compensate for the above-mentioned cases. Let Ri be the reserved percentage of level-i resources for type-i request, i = 1, 2, then

The denominators and numerators of Equation (2) are acquired, based on periodical statistics. In other words, at most R2’ (= 100 − R2)% of the o-level-2 (R1’ (= 100 − R1) %, of o-level-1) resource nodes can be dynamically allocated to serve type-3 (type-2 and type-3) requests.

Table 7.
The percentages of o-level-i resource nodes that can serve type-j requests, 1 ≤ i, j ≤ 3.
| Req.\Nodes | O-level-1 resource nodes of R1 % | O-level-1 resource nodes of R1’% | O-level-2 resource nodes of R2% | O-level-2 resource nodes of R2’% | Level-3 resource nodes |
|---|---|---|---|---|---|
| Type-1 | 1 | 2 | - | 3 | 4 |
| Type-2 | - | 4 | 1 | 2 | 3 |
| Type-3 | - | 3 | - | 2 | 1 |
Percentages of o-level-i resource nodes that can serve type-j requests, 1 ≤ i, j ≤ 3, are summarized in Table 7 in which the numbers in a row represent the order in which the resource nodes are allocated to the corresponding types of requests. When the percentage of o-level-1 resource nodes assigned to serve type-1 requests reaches R1%, and now new type-1 requests arrive, Resource Broker will allocate o-level-1 resource nodes belonging to the R1’% to serve them. If no more o-level-1 is now available, then o-level-2 resource nodes that belong to the R2’% will be allocated to the new type-1 requests. R2% of o-level-2 resource nodes are reserved to serve type-2 requests only. As the R2’% of resource nodes is also used up, level-3 resource nodes will be allocated to these type-1 requests.
Similarly, when a type-2 request arrives, Resource Broker will first allocate o-level-2 resource nodes belonging to R2 % to serve the request. If no more o-level-2 resource nodes belonging to R2 % are available, those belonging to R2’% will be allocated. When no more o-level-2 resource nodes are available, level-3 resource nodes will be allocated. The fourth choice for a type-2 request is the R1’% of o-level-1 resource nodes. The chosen priorities of resource nodes for type-3 requests are level-3 (see type-3 row of Table 7), R2’% of o-level-2 and then R1’% of o-level-1 resource nodes.
(2) Resource Preemption
There are two cases in which preemption is required. The first is that when a type-1 request arrives, no resource nodes of all levels that can serve type-1 requests are available. Maybe some of R2% of o-level-2 resource nodes are available, but due to our allocation policy, they cannot be allocated to serve type-1 requests. The second case is that when a type-2 request arrives, no level-2 (including R2% and R2’%), level-3 and R1’% of level-1 resource nodes are available.
When the first case occurs, Resource Broker first preempts an o-level-1 resource node that is serving a type-3 or type-2 request in the situation where the one serving a type-3 request will be chosen first (see Table 8). Of course, these o-level-1 resource nodes are those belonging to the R1’% portion. O-level-1 resource nodes that are serving type-1 requests will not be preempted. However, if no o-level-1 resource nodes are now serving type-3 requests, one of the o-level-1 resource nodes now serving a level-2 request will be preempted. If all o-level-1 resource nodes are serving type-1 requests, some o-level-2 resource nodes will be preempted. The row type-1 in Table 8 summarizes the preemption priorities. If no resource nodes are preempted, implying that all resources nodes are executing type-1 requests, the type-1 request will be re-enqueued in the type-1 global queue.
In the second case, only o-level-2 resource nodes that are serving type-3 requests (Of course, these resource nodes belong to the R2’% portion) will be preempted to serve the type-2 request. However, if no o-level-2 resource nodes are running type-3 requests, then one of the o-level-1 resource nodes now serving type-3 requests will be preempted. If no o-level-1 and o-level-2 resource nodes are preempted, indicating that they are all running type-1 and/or type-2 requests, one of the level-3 resource nodes currently serving type-3 requests will be preempted. If no resource nodes have been preempted, implying all resource nodes are running type-1 and/or type-2 requests, the request will be re-enqueued to the type-2 global queue.

Table 8.
The preemptive order of type-1 and type-2 requests. The lower the number, the higher the chosen priority.
| Request type | O-level-1 | O-level-2 | Level-3 | |||
|---|---|---|---|---|---|---|
| R1’% of resources currently Serving Type-3 requests | R1’% of resources currently Serving Type-2 requests | R2’% of resources currently Serving Type-3 requests | R2’% of resources currently Serving Type-2 requests | Currently Serving Type-3 req. | Currently serving Type-2 req. | |
| Type 1 | 1 | 2 | 3 | 4 | 5 | 6 |
| Type 2 | 2 | - | 1 | - | 3 | - |
When a type-3 request arrives, and no level-3, level-2 of R2’%, level-1 of R1’% nodes are available (see Table 7), the request will be re-enqueued to the type-3 global queue. No preemption will be performed.
Once a resource node N is preempted, the request that N is now serving, e.g., request y, will be re-enqueued to N’s waiting queue, instead of its global queue, as the highest priority request to be executed by N when N finishes the job of the preempting request, and those requests which are now in N’s waiting queue will stay in the queue following their original waiting sequence to wait to be served by N.
3.2. Information Manager
The Information Manager as stated above is composed of four components, including Collector, Front Unit, Calculator and Mobile Agent.
(1) Collector: This component collects user requests and network status and resource-node information. User requests are submitted to Collector through request nodes. On receiving a user request, Collector sends the request to Scheduler through Mobile Agent (see Figure 2). The resource-node information includes node IP, CPU level, current CPU utilization rate, available memory size, and the length of the waiting queue, in which node IP and CPU level, as static features, will not change during the lifetime of the system being considered. Upon receiving the status and information, e.g., I collected by the Ganglia and represented in rrd data format (*.rrd), Collector transforms I into XML data format and then sends I of the new format to Calculator. The information collected by NWS on each collection is stored as a log file that is represented in text format and can be saved in Data Center directly without data transformation.
(2) Front Unit: Due to collecting data/information periodically for resource nodes, the SePCS’s database access frequency is high. Front Unit, as a front-end unit of Data Center, is employed to unify the data access interfaces and avoid redundant data storage, implying that Front Unit on receiving duplicate data, for example, due to a missing ACK, will only keep one and send the one to Data Center.
(3) Calculator: Calculator, on receiving the dynamic features periodically collected by Ganglia and NWS and delivered through Collector, stores the features in its local buffer. It also periodically retrieves the performance table through Front Unit, and then calculates the performance score by invoking Equation (1) for each node currently under the wireless coverage of the underlying system. After that, Calculator classifies the nodes into the corresponding performance levels by calculating their performance scores, based on the score tables mentioned above (see Table 2, Table 3, Table 4, Table 5, Table 6). Further, it assigns a unique ID to a newly arriving node, and creates a tuple for the node. For the nodes that leave the system, their resource-node information will no longer appear in Calculator’s buffer, and their corresponding tuples in the performance table will be deleted. Of course, the requests assigned to them will be re-enqueued to the global queues. Lastly, it stores the newly updated performance table into Data Center, and sends a performance-table-newly-updated message to Resource Broker.
(4) Mobile Agent: It is the contact window of the Information Manager. When Resource Broker receives a performance-table-newly-updated message from Calculator during its resource allocation or it would like to allocate resources to user requests, it sends a search request to Mobile Agent, which on receiving the request moves to Front Unit to retrieve the performance table from Data Center, and then delivers the table to Resource Broker. Resource Broker chooses the suitable resource nodes, informs the nodes to take over the requests, and sends the IPs of the resource nodes to the request nodes, all through Mobile Agent. After that, the requests become jobs, and request nodes start communicating with the resource nodes to receive the corresponding services.
A MCI server may have more than one Information Manager, depending on how large its serving area is and how many requests the system may service simultaneously. Each Information Manager at any moment has its own user nodes, i.e., resource nodes and request nodes. But the information of all the resource nodes under an MCI server, e.g., Server A, is collected in Server A’s Data Center. A system may consist of several MCI servers. Each has its own Data Center. All the Data Centers are organized as a logical tree in which a lower level Data Center periodically reports its performance table to its immediate parent MCI server, e.g., MCI server P, through Front Unit (see Figure 2). MCI server P collects all its children’s performance tables and integrates them with the performance table of its own as P’s performance table. When an Information Manager, e.g., Information Manager A (the Information Manager of server A), has insufficient resource nodes to serve its requests, it allocates resource nodes belonging to its sibling Information Managers to serve A’s user requests. The data transmitted among Data Center, Information Manager and Resource Broker are all delivered through a backbone network so that the delivery delays are short enough and can be ignored.
3.3. Resource Broker
Resource Broker as shown in Figure 2 consists of Scheduler and global queues. Scheduler, on receiving user requests, schedules the requests following their types and priorities. All user requests in a global queue are served by a priority method. The first time a request enters a global queue, it has the lowest priority, i.e., priority 0, regardless of what type the request is, i.e., each type of user request has its own priorities. Each time when a request of type i due to some reason is re-enqueued to type-i global queue, i = 1, 2 or 3, its priority will be increased by one (i.e., one step higher). When a request with priority = 3 is re-enqueued, the priority will not change. The purpose of priority change is to avoid request starvation. The chance that a request R is re-enqueued includes that Scheduler cannot find a resource node for R, and the resource nodes allocated to R for some reason, e.g., leaving, or failure, unable to accomplish R’s corresponding job.
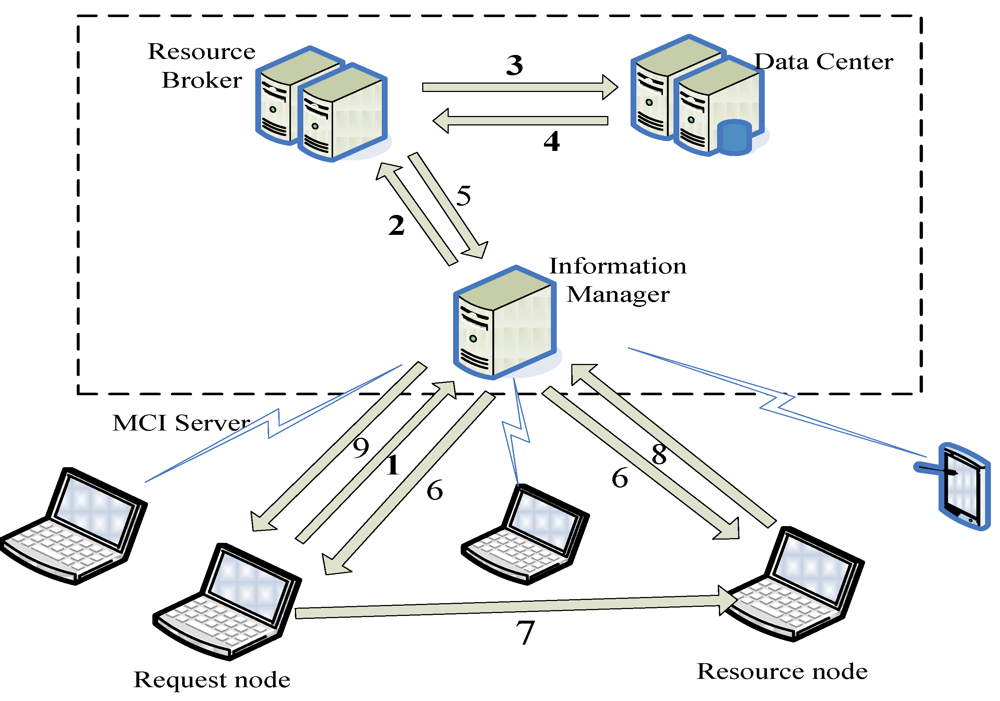
Figure 3.
The procedure of the system execution.
When a user would like to submit a request R to Resource Broker, the procedure is as follows (see Figure 3).
- (1) R’s request node N sends R to Collector.
- (2) Collector dispatches Mobile Agent to deliver R to Scheduler that will insert R into the corresponding global queue, based on the type specified by the user and approved by the Resource Broker.
- (3) Scheduler periodically, or on receiving a performance-table-newly-updated message from Calculator, delivers Mobile Agent to Front Unit to retrieve the performance table from Data Center.
- (4) Data Center sends the performance table to Front Unit. Front Unit dispatches Mobile Agent to transfer the table to Scheduler.
- (5) Scheduler checks the requests which are now in the global queues and the requests’ priorities, and finds the suitable resource nodes for these requests, based on current levels of the resource nodes recorded in the performance table and the rule with which local resource nodes are allocated first, e.g., when the scores of two nodes are the same, the one with smaller ID (note that node ID is not shown in Table 1) will be allocated first. If no local resource nodes are available, Scheduler chooses appropriate resource nodes currently under its neighbor MCI Information Managers, or neighbor servers, e.g., resource nodes X, for R. After that, Resource Broker sends Mobile Agent to inform Collector of the nodes.
- (6) Collector delivers the IPs of X to N and notifies X to service N.
- (7) N on receiving the IPs sends the jobs’ data to X through Collector.
- (8) When the jobs are finished, X transfers the results to Collector, retrieves the request with the lowest type (i.e., type-1 requests go first) and the highest priority from its waiting queue, and executes the corresponding job. The step repeats until the waiting queue is empty. Then, X changes its status to idle.
- (9) Collector on receiving the result forwards the results to N.
4. Algorithms
In a wireless system, at any moment nodes may leave or join a system and the Ganglia and NWS periodically collect network and node statuses, making the network connections between nodes and the MCI server very dynamic. Hence, the SePCS periodically, or on receiving a message issued by Calculator, updates the performance table to avoid Scheduler from using out-of-date information to allocate resource nodes to user requests. Figure 4, Figure 5, Figure 6, Figure 7, Figure 8 respectively list the algorithms of Collector, Front Unit, Calculator, and Resource Broker (named Semi-preemptive allocation algorithm, SPA algorithm for short) where SPA is run by Scheduler. The parameters and functions used in the following are defined below.
- (1) Rx: Type of the request x, x= 1, 2 or 3.
- (2) S: A set of the resource-node candidates.
- (3) Size(x): The number of elements in set x.
- (4) HS: The candidate with the highest score in S.
- (5) Priority(x): priority of x in its global queue.
- (6) GBQ(Rx): The function returns the global queue of Rx type, Rx may be 1, 2, or 3.
- (7) enqueueRequest(x,GBQ(Rx)): This function first increases x’s priority by one if priority(x) < 3, and then enqueues request x to the corresponding global queue GBQ of Rx type where Rx = 1,2 or 3, and priority 0 (3) is the lowest (highest) priority.
- (8) Type(x): The function checks the type of request x.
- (9) chooseCandidates(y,Rx): It chooses those resource-node candidates that can serve the request of Rx type from the designated set of resource nodes y.
- (10) getMaxScoreCandidate(S): It returns the ID of the resource node with the highest score in S. If several candidates are of the same score, the one with the smallest ID will be returned.
- (11) allocateRequest(x,A): It allocates request x to resource node A. In a global queue, the highest priority user request will be chosen by Scheduler for allocating resource nodes.
- (12) accessRequestType(i): Accessing the type of the request being executed by node i.
- (13) job: The corresponding job of a request to be executed.
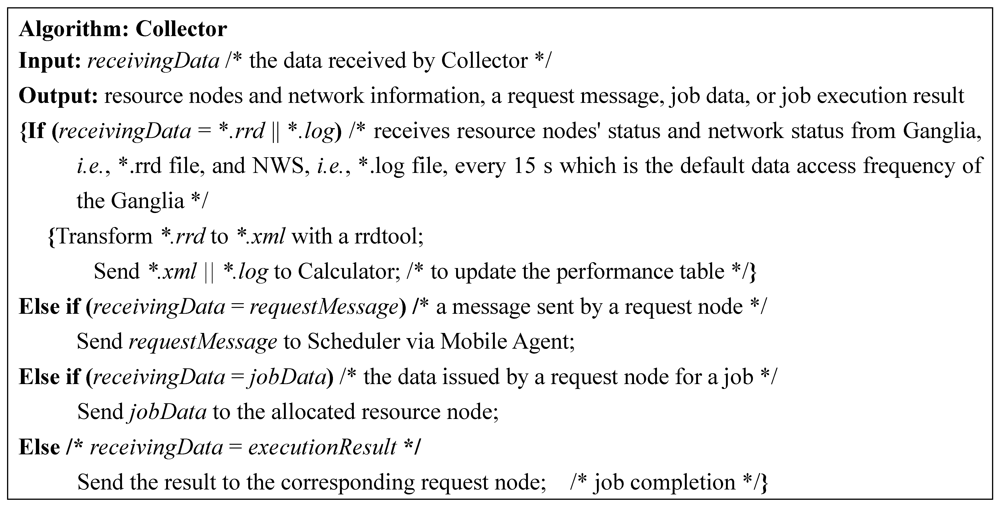
Figure 4.
The algorithm performed by Collector on receiving a message or data from other components.
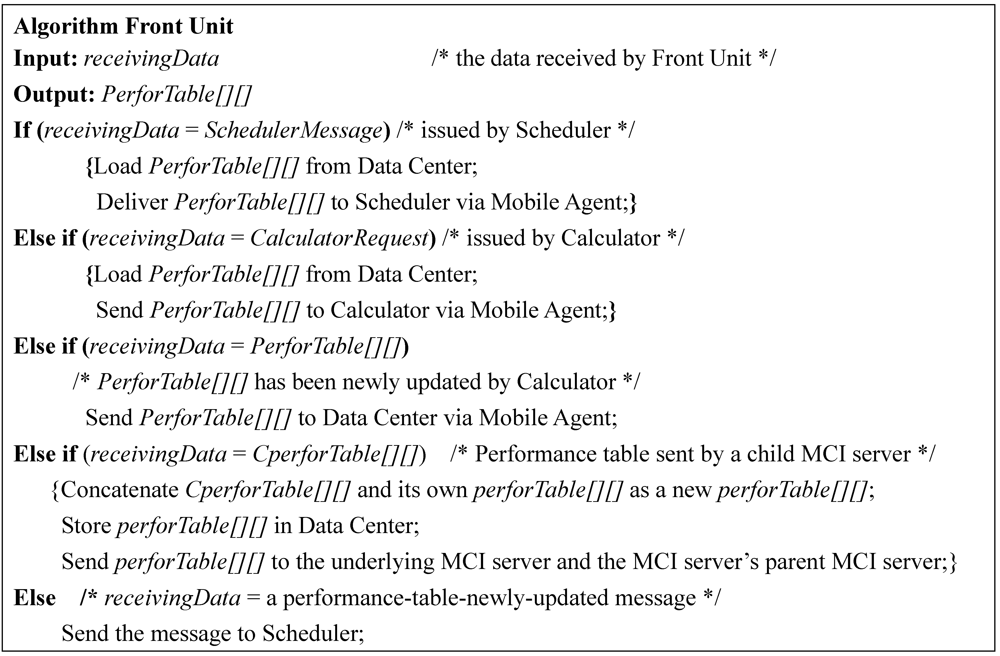
Figure 5.
The algorithm performed by Front Unit.
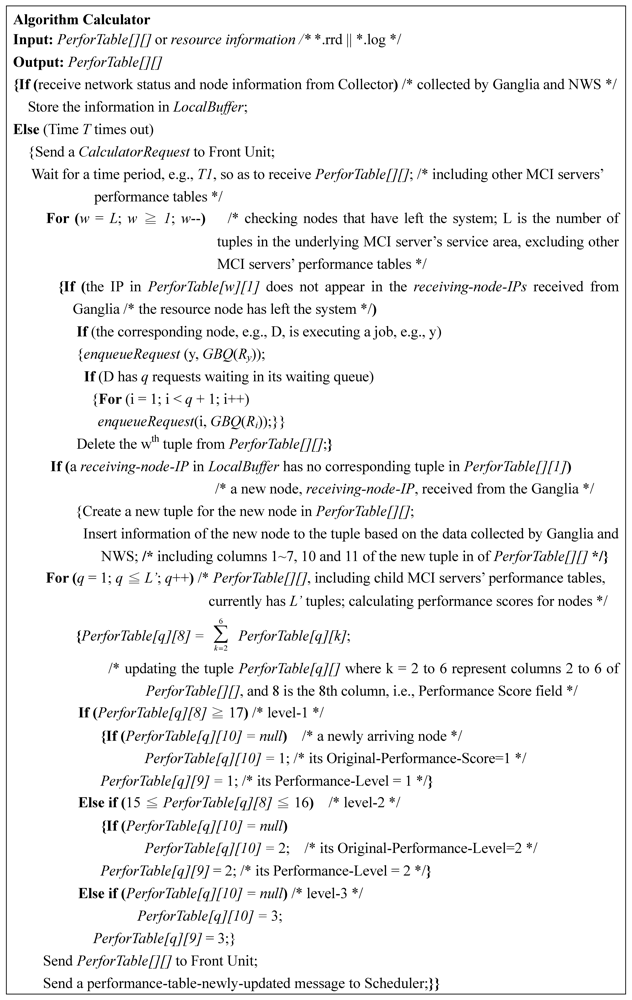
Figure 6.
The algorithm performed by Calculator periodically.
Figure 7 (Figure 8) shows the allocation part (semi-preemption part) of the algorithm, i.e., SPA() (i.e., PreemptiveSPA()), performed by Scheduler. As stated above, Scheduler periodically or on receiving a performance-table-newly-updated message from Calculator invokes SPA() to allocate resource nodes to serve user requests. Resource preemption is only on local resource nodes.
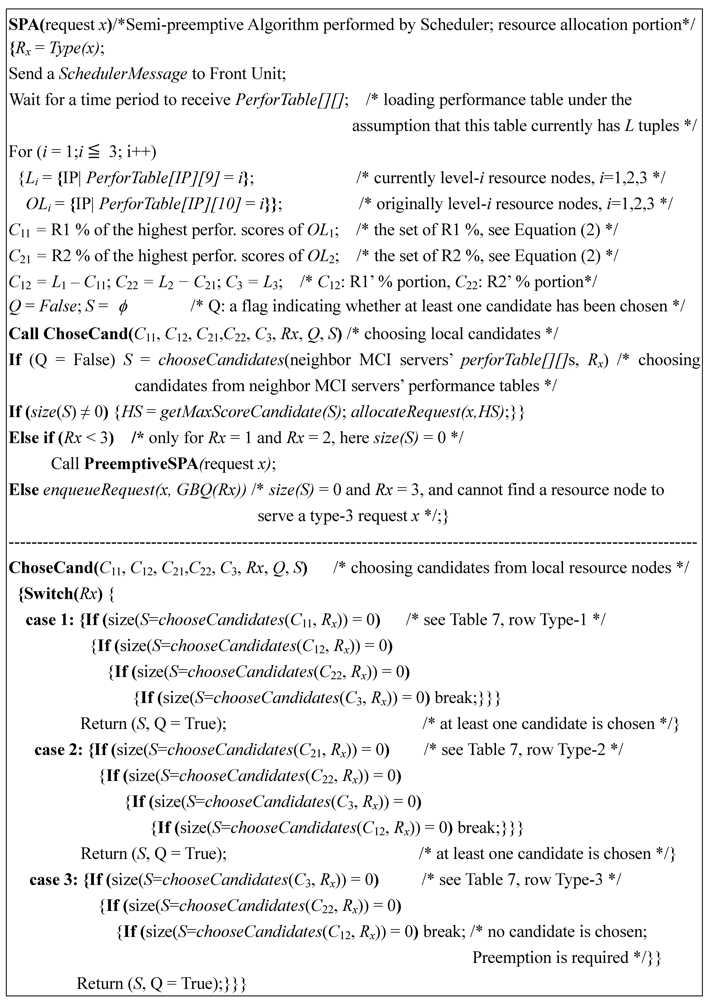
Figure 7.
The job allocation algorithm performed by Scheduler (allocation part).
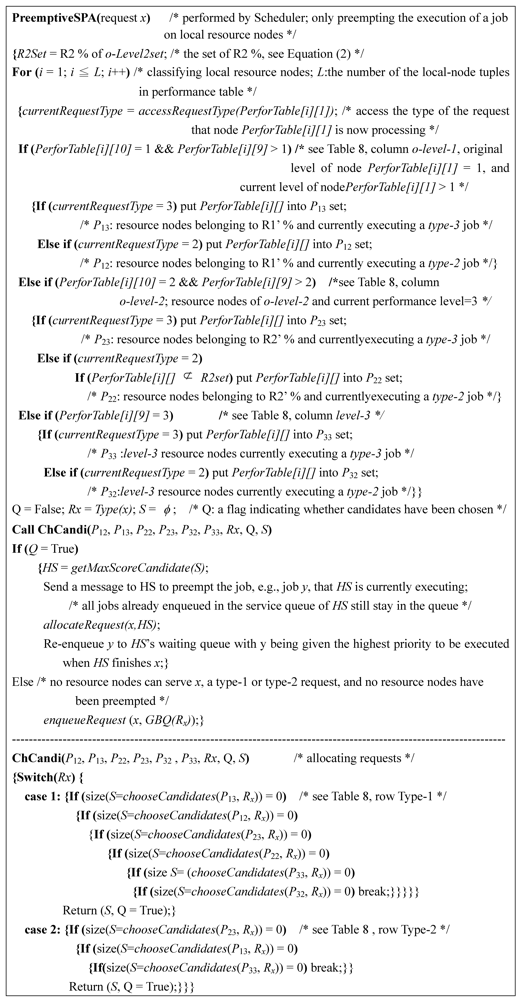
Figure 8.
The job allocation algorithm (preemptive part).
5. Experiments and Analyses
Figure 9 and Table 9, respectively, show the topology and specifications of the experimental environment of this study. The MCI server consists of three desktop computers individually acting as Information Manager, Resource Broker and Data Center. Six user nodes are currently connected to the MCI server through a wireless network. Node IDs (rather than node IP) are the sequences in which they enter the system. Their initial performance table is shown in Table 10. All user nodes run the Ubuntu 10.07 operating system [22], globus tookit 5.0.2 [23], Ganglia 3.1.7 [18] and NWS 2.13 [20]. Assume that initial CLWQs and CPU utilization rates of all nodes are zero.
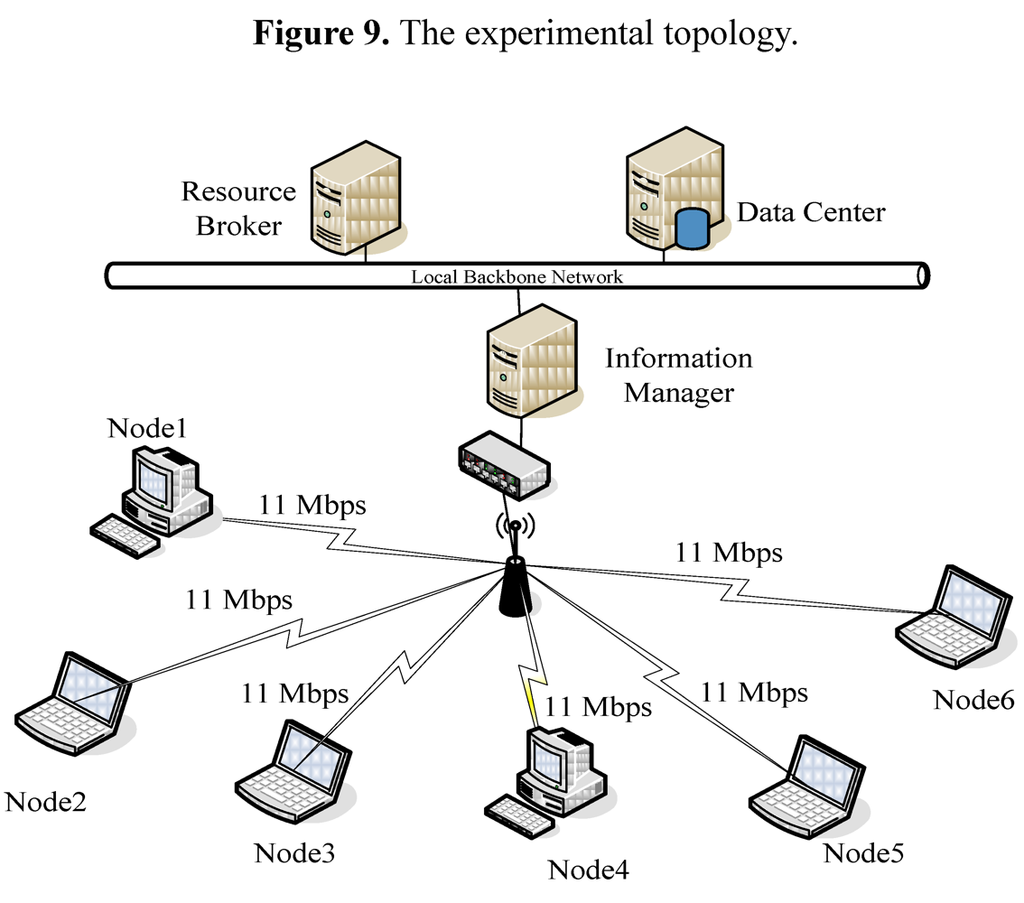
Figure 9.
The experimental topology.

Table 9.
The user nodes’ specifications.
| Node\Attribute | CPU frequency | Memory | Node IP |
|---|---|---|---|
| 1 | AMD Athlon64 X2 Dual-core 2.0 GHz | 4096 MB | 172.15.230.5 |
| 2 | Intel Centrino 1.86 GHz | 1024 MB | 172.15.230.6 |
| 3 | Intel Celeron 1.6 GHz | 512 MB | 172.15.230.7 |
| 4 | AMD Athlon64 X2Dual-core 2.0 GHz | 4096 MB | 172.15.230.8 |
| 5 | Dual-core 2.0 GHz | 1024 MB | 172.15.230.9 |
| 6 | Intel Celeron 1.6 GHz | 512 MB | 172.15.230.10 |

Table 10.
The initial performance table.
| Node IP | CPU level | AMS | CLWQ | CUR | Network bandwidth | Status | Perfor. score | Perfor. level | Origin-perf-level | Infor. Manage. No. |
|---|---|---|---|---|---|---|---|---|---|---|
| 172.15.230.5 | 1 | 4 | 3 | 3 | 4 | idle | 17 | 1 | 1 | A |
| 172.15.230.6 | 1 | 2 | 3 | 3 | 4 | idle | 15 | 2 | 2 | A |
| 172.15.230.7 | 1 | 1 | 4 | 4 | 4 | idle | 14 | 3 | 3 | A |
| 172.15.230.8 | 1 | 4 | 3 | 3 | 4 | idle | 17 | 1 | 1 | A |
| 172.15.230.9 | 1 | 2 | 4 | 4 | 4 | idle | 15 | 2 | 2 | A |
| 172.15.230.10 | 1 | 1 | 4 | 4 | 4 | idle | 14 | 3 | 3 | A |
Five experiments were performed in this study. The first evaluated the turnaround time of a user request and a number of user requests allocated to different resource nodes for different tested schemes in the situation where a user request requests a resource node to deliver a video program. The second studied the performance of the tested schemes given different packet sizes. The third and the fourth redid the second experiment given different data rates, and different numbers of requests per second, respectively. The fifth experiment redid the second experiment when different numbers of nodes leave/re-enter the system at different time points. Here, throughput is defined as the average number of bits received per second. Packet drop rate is defined as (the number of packets sent—the number of packets received)/(the number of packets sent). Turnaround time of a request, denoted by Tta, is defined as Tta = Tr + Ttra + Tex where Tr is the time required to transfer the request from the request node to the Resource Broker through the MCI server, Ttra is the time that the request spends to travel from the Resource Broker to a resource node, and Tex is the time required to execute the job on the resource nodes. According to our estimation, Tr = 0.14 ms (= 1.5 kbits/11 Mbps), Ttra = Tr and Tex = 125 + 7.27 s in which 125 s is the time for Video program initialization and 7.27 (= 10 MB/11 Mbps) s is the transmission time of the program.
5.1. Video Delivery Experiment
The first experiment consisted of four parts. The first part evaluated the numbers of jobs that the Resource Broker allocated to different resource nodes, the turnaround time of a job and CPU loads of a job execution at different time points in the situation where all requests are of the same type. The second part redid the first part, but user requests were evenly divided into type-1, type-2 and type-3, and only the SPA was employed. The third part redid the second part, but only the Random algorithm was invoked where the Random algorithm is the one randomly selecting a resource node from the performance table for a user request without considering the level to which the chosen resource node belongs. The fourth part redid the second and the third parts, but users’ requests were unevenly divided into types 1, 2 and 3.

Table 11.
The parameters of the experiment.
| Item | Specification |
|---|---|
| Packet size of a user request (i.e., a data packet) | 1.5 Kbits |
| Packet delivery protocol | TCP |
| MAC | 802.11 |
| Bandwidth of a wireless link between a user node and the MCI server | 11 Mbps |
| Experimental duration | 1500 s (the 1st part), 200 s (others) |
| Packet rate | A packet per 15 s |
| Total requests | 100 (the 1st part), 60 (the 2nd, 3rd and 4th parts) |
| Number of resource nodes | 6 |

Table 12.
Numbers of jobs allocated to resource nodes.
| Node | 1 | 2 | 3 | 4 | 5 | 6 | Total |
|---|---|---|---|---|---|---|---|
| Number of jobs allocated | 40 | 15 | 5 | 38 | 1 | 1 | 100 |
| Percentage of the allocation | 40% | 15% | 5% | 38% | 1% | 1% | 100% |
5.1.1. The Request Allocation
In the first part of the first experiment, we sent a video-code delivery request 100 times once per 15 s from a user node, i.e., a total of 100 jobs was submitted. Each delivered a 10 MB video program, and each experiment lasted 1500 s. The default parameters are listed in Table 11. We recorded which resource node was allocated to execute which job by Resource Broker. Table 12 lists the experimental results, in which 78 (= 40 + 38)% of requests were allocated to nodes 1 and 4 because the two nodes were the ones with the highest performance among the six resource nodes. Resource Broker allocated fewer jobs to nodes 3, 5 and 6 due to their relatively low performance. When two or more resource nodes are of the same score, the one with the smallest ID will be chosen. That is why even though nodes 2 and 5 and nodes 3 and 6 themselves had the same scores initially, node 2 (node 3) was chosen more frequently than node 5 (node 6).

Table 13.
Turnaround time of a job/request.
| Algorithm | Max turnaround time (s) | Min turnaround time (s) | Avg. turnaround time (s) | SD |
|---|---|---|---|---|
| SPA-NP | 260.80 | 106.49 | 151.93 | 38.76 |
| Random | 347.19 | 150.87 | 174.70 | 45.33 |
Table 13 lists the turnaround time of a request on the Random and the SPA, excluding the preemptive SPA portion (we call it the SPA with no preemption, SPA-NP for short). With the SPA-NP and Random, the average turnaround times were respectively 151.93 s and 174.70 s. Due to poor stability of wireless networks, the SPA-NP’s maximum turnaround time is 1.75 (= 260.8/151.93) times its own average turnaround time. The Random’s maximum turnaround time is 1.99 (= 347.19/174.70) times its own average turnaround time, implying stability is a very important issue for wireless transmission.
Figure 10 shows the average loads of the CPUs when the two algorithms are employed. It is clear that the loads of the SPA-NP are lower than those of the Random, indicating that balancing the loads of resource nodes can effectively reduce CPU burden. The peaks of the line with the Random appear every 15 s which is the frequency of submitting requests, i.e., every time a request is submitted, due to job initialization which is 125 s, the average CPU load of the six resource nodes is higher than those sometime later but before the start of the next request. On the other hand, the SPA-NP algorithm’s line is relatively smooth. The reason is stated above.
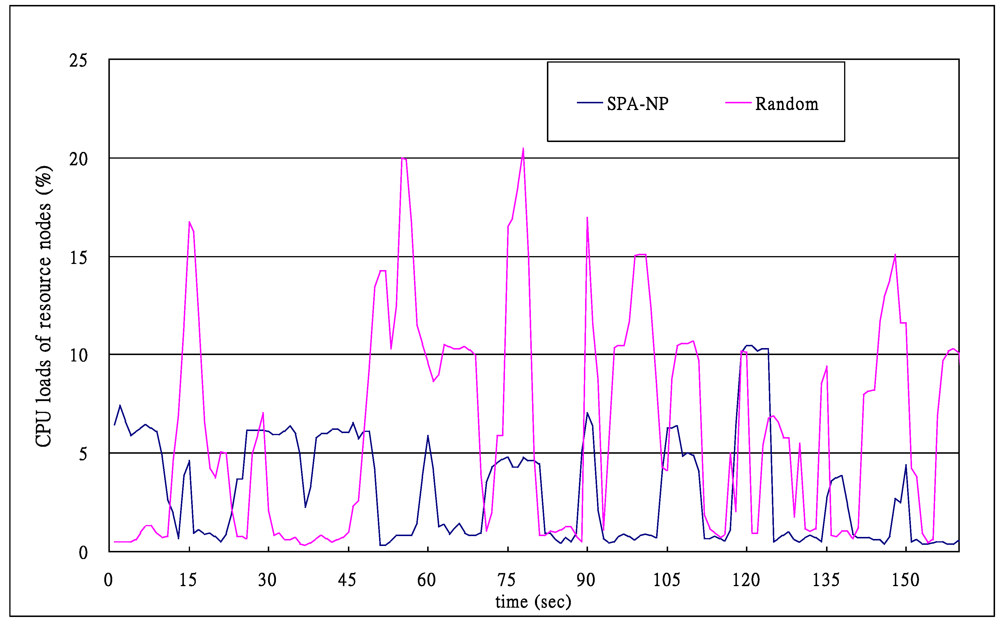
Figure 10.
CPU loads of the SPA-NP and Random algorithms (150th–1500th s are not shown since they are similar to the shown portion).
5.1.2. Ratio of the Three Types of Requests: 1:1:1 on the SPA-WP
In the second part, 200 type-i requests, i = 1, 2, and 3, were sent to Resource Broker. We recorded how many requests of type-i were assigned to node j and the average turnaround time of node j, j = 1, 2…6. This time, the SPA algorithm with preemption (SPA-WP for short) was invoked. The 600 submitted requests were identical. Each requested a 10 MB video program. We evenly assigned them to three different request types, i.e., 200 for each type. Due to the requirement of identifying the type of a request, type-1, type-2 and type-3 requests asked for transferring the video data in DVD, mp4 and flv formats, respectively, to the request nodes.
The experimental results are illustrated in Table 14 (see the X portion of data values in X/Y format which represents the values produced by the SPA-WP/Random), in which the percentages of the requests assigned to different nodes (see percentage-of-requests column) are not significantly different from those listed in Table 11. The turnaround time of the type-1 requests (see column Type-1) was the shortest among the three types, since the priority with which type-1 requests were executed by level-1 resource nodes was the highest, and up to 95 (= (96 + 94)/200)% of this type of requests were executed by level-1 resource nodes. The turnaround times of type-2 and type-3 requests were longer because they were preempted up to 46 and 69 times respectively (see No.-of-preemption row), and 40.5 (= (36 + 32 + 8 + 5)/200)% of type-2 requests and 41.5 (= (44 + 22 + 9 + 8)/200)% of type-3 requests were executed by the four low level nodes, i.e., nodes 2, 3, 5 and 6. Also, the average turnaround times of the level-1 resource nodes, i.e., 157.47 s on node 1 and 157.36 s on node 4, were shorter than those of the other two levels’ resource nodes, i.e., 168.90, 169.03, 167.46 and 168.77 s. The average turnaround time of the 600 requests was 164.83 s.

Table 14.
The numbers of requests allocated and their turnaround times when 200 type-i requests were submitted, i = 1, 2, 3, and SPA-WP and Random algorithms were employed.
| Items | Type-1 requests | Type-2 requests | Type-3 requests | Total No. of requests | Percentage of requests | Average turnaround time |
|---|---|---|---|---|---|---|
| Node 1 | 96/35 | 60/36 | 60/35 | 216/106 | 36/18(%) | 157.47/159.63 |
| Node 2 | 5/36 | 36/37 | 44/35 | 85/108 | 14/18(%) | 168.90/168.92 |
| Node 3 | 2/31 | 32/33 | 22/32 | 56/96 | 9/16 (%) | 169.03/178.34 |
| Node 4 | 94/33 | 59/31 | 57/32 | 210/96 | 36/16(%) | 157.36/159.95 |
| Node 5 | 2/31 | 8/29 | 9/34 | 19/94 | 3/15 (%) | 167.46/178.30 |
| Node 6 | 1/34 | 5/34 | 8/32 | 14/100 | 2/17 (%) | 168.77/178.36 |
| No. of preemptions | 0/0 | 46/0 | 69/0 | - - | - | |
| Total | 200 | 200 | 200 | 600 100% | 164.83/170.58 | |
| Turnaround time/SD | (146.27/34.44)/(172.49/31.14) | (174.41/31.04)/(172.98/31.16) | (173.81/31.05)/(166.28/31.03) | 164.83/170.58 - | - | |
5.1.3. Ratio of the Three Types of Requests: 1:1:1 on the Random
In the third part of this experiment, we redid the second part but the invoked algorithm was the Random. The experimental results are listed as the Y portion of X/Y in Table 14. The turnaround time of type-i was longer than that of the SPA-WP, i = 1, 2, 3 (see Turnaround-time row). The average turnaround time of a node, except that of node 2, was also longer than that of the node when the SPA-WP algorithm was invoked (see Average-turnaround-time column), because without load balancing, the number of requests/jobs that a lower performance node receives/executes was similar to the number of request/jobs received/executed by a high performance node, (see percentage-of-requests column which are 18, 18, 16, 16, 16 and 17). When given many more requests/jobs, the turnaround time of a low performance node will be longer. Furthermore, when the SPA-WP is employed, even nodes 1 and 4 execute less numbers of jobs, their turnaround times are similar to those of themselves since the queuing delay of a job in any one of the two nodes’ queues is relatively shorter than the execution time of the job. The total average turnaround time was 170.58 s.
5.1.4. Ratios of the Three Types of Requests: 2:1:1 and 1:1:2 on the SPA-WP and Random
In the fourth part of this experiment, we redid the second and third parts, i.e., with the SPA-WP and Random, but 300 type-1, 150 type-2 and 150 type-3 requests were submitted, i.e., the ratio of the three types is 2:1:1. Table 15 shows the experimental results. Lastly, 150 type-1, 150 type-2 and 300 type-3 requests were submitted, i.e., the ratio is 1:1:2. Table 16 shows the results.
By comparing Table 14 and Table 15 we can see that when the SPA-WP is employed, the average turnaround time of type-i requests in Table 15 is longer than that of type-i in Table 14, i = 1, 2 and 3, i.e., 153.58 > 146.27 (type-1), 178.81 > 174.41 (type-2), and 180.48 > 173.81 (type-3), because when many more type-1 requests are submitted, their waiting delays in type-1 global queue will be consequently longer (but not significantly), and the execution of the other two types of requests may be preempted, no matter whether the requests are now being executed by level-1, level-2 or level-3 resource nodes. The latter is also the reason why the numbers of preempted type-2 and type-3 requests are higher than those listed in Table 14, i.e., 59 > 46 (type-2) and 75 > 69 (type-3). For the same reasons, the average turnaround time of the 600 requests shown in Table 15, i.e., 166.61 s, is also longer than that illustrated in Table 14, i.e., 164.83 s.

Table 15.
The numbers of allocated requests and their turnaround times when 300 type-1, 150 type-2, and 150 type-3 requests were submitted, and the SPA-WP/Random were employed.
| Items | Type-1 requests | Type-2 requests | Type-3 requests | Total No. of requests | Percentage of requests | Avg. turnaround time (s) |
|---|---|---|---|---|---|---|
| Node 1 | 116/52 | 46/26 | 51/27 | 213/105 | 35/18 (%) | 162.95/176.91 |
| Node 2 | 46/51 | 29/24 | 36/26 | 111/101 | 18/17 (%) | 166.68/176.89 |
| Node 3 | 17/51 | 14/25 | 20/24 | 51/100 | 9/17 (%) | 169.11/177.01 |
| Node 4 | 110/50 | 49/24 | 30/25 | 189/99 | 31/16 (%) | 161.47/176.93 |
| Node 5 | 7/51 | 7/20 | 7/25 | 21/96 | 4/16 (%) | 168.68/176.84 |
| Node 6 | 4/45 | 5/31 | 6/23 | 15/99 | 3/16 (%) | 170.77/177.14 |
| No. of preemptions | 0/0 | 59/0 | 75/0 | - - | - | |
| total | 300 | 150 | 150 | 600 100% | 166.61/176.95 | |
| Turnaroundtime/SD | (153.58/32.81)/(177.98/31.12) | (178.81/31.08)/(179.44/31.17) | (180.48/31.19)/(172.40/31.03) | 166.61/176.95 - | - | |

Table 16.
The numbers of requests allocated and their turnaround times when 150 type-1, 150 type-2, and 300 type-3 requests were submitted, and the SPA-WP/Random were employed.
| Items | Type-1 requests | Type-2 requests | Type-3 requests | Total No. of requests | Percentage of requests | Avg. turnaround time (s) |
|---|---|---|---|---|---|---|
| Node 1 | 65/26 | 59/27 | 109/53 | 233/106 | 40/18 (%) | 163.35/175.56 |
| Node 2 | 19/26 | 18/27 | 49/52 | 86/105 | 16/18 (%) | 165.06/175.59 |
| Node 3 | 9/25 | 11/24 | 24/51 | 24/100 | 4/17 (%) | 166.32/175.49 |
| Node 4 | 53/23 | 52/26 | 93/46 | 198/95 | 34/15 (%) | 163.34/175.68 |
| Node 5 | 2/25 | 4/25 | 14/49 | 20/99 | 3/17 (%) | 169.72/175.89 |
| Node 6 | 2/25 | 6/21 | 11/49 | 19/95 | 3/15 (%) | 163.45/175.43 |
| No. of preemptions | 0/0 | 10/0 | 98/0 | - - | - | |
| total | 150 | 150 | 300 | 600 100% | 163.21/175.61 | |
| Turnaround time/SD | (152.53/32.86)/(176.15/31.05) | (161.55/31.74)/(177.91/31.09) | (173.38/31.06)/(174.19/31.03) | 165.21/175.61 - | - | |
The turnaround time of type-2 requests shown in Table 16 (X portion of X/Y) is shorter than those listed in Table 14 and Table 15, i.e., 161.55 < 174.41 (Table 14) and 161.55 < 178.81 (Table 15), because when the number of type-1 requests is smaller, the type-2 requests have lower probability of being preempted (no. of preemptions in the column of type-2 request in Table 16 is 10), consequently shortening type-2 requests’ average turnaround time. When many more type-3 requests were submitted, their queuing delays in the type-3 global queue were longer, and the probability that their execution is preempted was also higher. That is why the number of preemption of type-3 requests was higher (98 in Table 16, and 75 and 69 in Table 14 and Table 15, respectively). However, many more type-3 requests were allocated to high-performance nodes, so the turnaround time of type-3 requests was improved (173.38 in Table 16, and 173.81 and 180.48 respectively in Table 14 and Table 15). Now, we can conclude that with the SPA-WP algorithm, when the total number of requests is fixed, it will be better with the numbers of requests of the three types distributed as evenly as possible. Hence, in the following experiments, the ratio 1:1:1 was used. Further, the SPA-WP is better than the Random since no matter what the ratio of the three types of requests is, the total turnaround time of the SPA-WP is lower than that of the Random.
5.2. Performance on Different Packet Sizes
In the second experiment, we wished to check the impact on performance of different packet sizes, including 500, 1000, 1500, 2000, 2500, and 3000 bits rather than 1.5 Kbits per packet listed in Table 11. The packet rate was also changed from a packet per 15 s to a packet per 10 s, i.e., 6 pkts/min. In other words, the request rates range from 300 bps (= 6 pkts/min × 500 bits/pkt × 6) to 1800 bps (= 6 pkts/min × 3000 bits/pkt × 6). Four schemes, including SPA-WP, Random, FCFS and SPA-Multipath, are tested, given the type ratio = 1:1:1, where FCFS is the algorithm with which Scheduler allocates resource nodes to requests, based on the sequence in which the resource nodes enter the system, and SPA-Multipath is a SPA-WP algorithm with a multipath routing approach [14]. On each test, the sizes of a user request and a data packet were the same. Each experiment lasted 100 s rather than 200 s listed in Table 11, implying a total of 60 (= 10 requests*6 nodes) requests were submitted. Also, in the following experiments, we did not transform the format of a video program. Thus, the time required to transmit a 10 MB video data is about 12 s (= 10 MB/11 Mbps + wireless channel contention time) where 11 Mbps is the wireless bandwidth. Since six nodes contend for the only wireless channel, a node on average needed about 72 s (= 12 × 6) to wait to be transmitted again, and the average waiting time was 42 (=  ) s. A node was allocated 10 requests by Resource Broker in average, and the turnaround time of first request was 42 s on average, the second request needed to wait for 42 s and the 10th request waited 420 s. So the ideal average turnaround time was 231 (=
  ) s.
) s.
 ) s. A node was allocated 10 requests by Resource Broker in average, and the turnaround time of first request was 42 s on average, the second request needed to wait for 42 s and the 10th request waited 420 s. So the ideal average turnaround time was 231 (=
  ) s.
) s.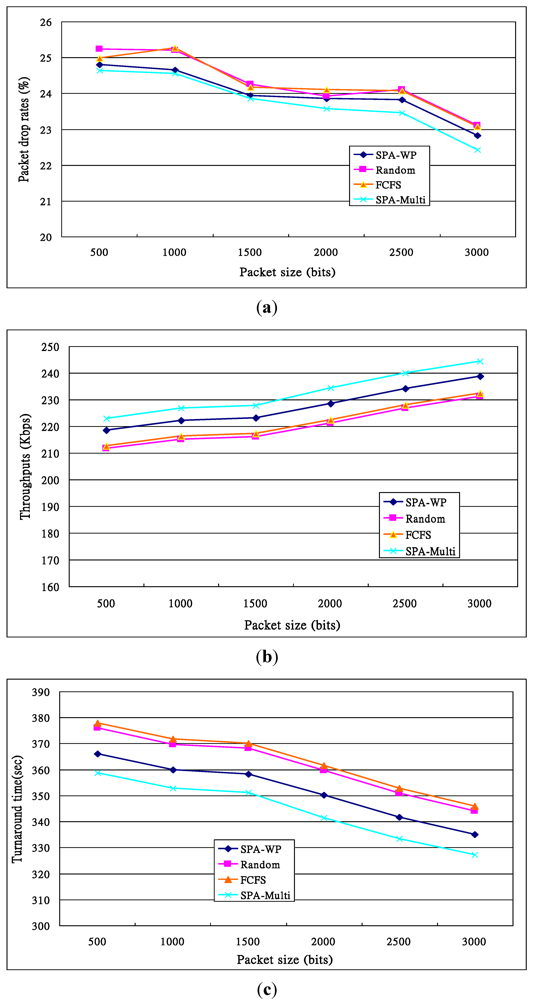
Figure 11.
Performance of the second experiment given different packet sizes. (a) Drop rates measured at the Resource Broker; (b) Throughputs measured at the Resource Broker; (c) Turnaround times measured at the Resource Broker.
The experimental results are shown in Figure 11. Figure 11a illustrates that the drop rates were higher when packet size = 500 bits since with a shorter packet, we need more packets to transmit a fixed-length video program, leading to a higher probability of packet collision. The Random’s and the FCFS’s drop rates were higher than those of the other two because when receiving a request, due to using simple algorithms with lower overheads, the two algorithms pass the requests to the destination more quickly than the others do. Hence, packets have a higher probability to collide or be dropped. The reason for the high probability of packet dropping is that their queues were full much earlier than the queues in the nodes when the SPA-WP or SPA-Multipath was employed.
As shown in Figure 11b, the throughputs increase when packet sizes are higher, since a longer packet can carry many more bits than a shorter packet can when a node’s packet rate is fixed, and relatively fewer packets are generated to transmit a video program, leading to less channel contention.
The turnaround times of these four algorithms are illustrated in Figure 11c in which, due to having more transmitted packets (i.e., Data size/packet size), higher drop rates and more channel contention, the shorter packet sizes’ turnaround times were longer. The turnaround times of the SPA-WP and the SPA-Multipath were shorter than those with the Random and the FCFS. The reasons are mentioned above. The SPA-Multipath transfers packets with multiple paths, so its turnaround times were shorter than those with the SPA-WP. Now we can conclude that a high density of user requests will result in long turnaround time. In fact, the transmission delay of a 10 MB video program was only 7.3 s, but the turnaround time was up to 360 to 378 s when packet size = 500 bits, implying most of the packets were congested to contend for the only wireless channel before they were delivered by the AP.
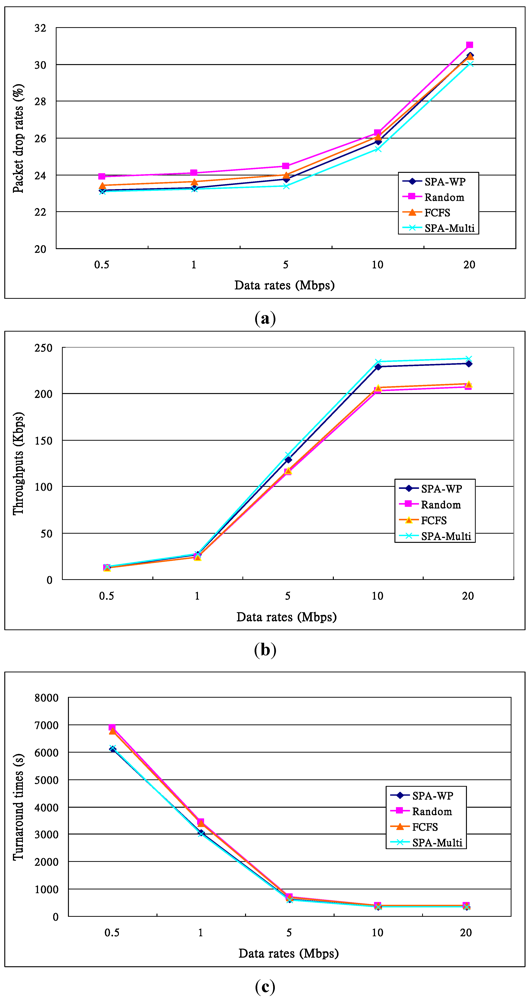
Figure 12.
Performance of the third experiment given different packet rates. (a) Drop rates; (b) Throughputs; (c) Turnaround time.
5.3. Performance on Different Data Rates
The third experiment redid the second given different data rates, including 0.5, 1, 5, 10 and 20 Mbps, rather than 11 Mbps listed in Table 11, for each node. The experimental time was 100 s. In other words, like those in the second experiment, each node delivered 10 requests and a total of 60 requests were submitted. The experimental results are illustrated in Figure 12, in which Figure 12a shows the drop rates, which are higher when data rates increase. When data rate = 1 Mbps, six nodes totally send 6 Mbps which do not congest the AP. When data rate = 5 Mbps, packet drop rates sharply increase. The reasons are also packet congestion and long channel contention time since the total data rate = 30 Mbps, which congests the wireless channel. When data rates are higher, congestion and contention are serious.
The throughputs of these four algorithms are shown in Figure 12b, in which we can see that the difference among them is significant when data rate ≥ 5 Mbps. Basically, a higher data rate means that higher numbers of requests are submitted in a second, thus generating a huge amount of data packets by the resource nodes and leading to higher packet collision and channel contention at the AP. A better scheme will raise the throughputs. Figure 12c illustrates the turnaround times for the four algorithms. When the data rates increase, the bandwidth of a link is more fully used, resulting in shorter turnaround times. The turnaround times of SPA-WP and SPA-Multipath are shorter than those of Random and FCFS. The turnaround times on 10 and 20 Mbps are very similar because the bandwidth is almost or already saturated. The transmission time on data rate = 0.5 Mbps is longer than those on other data rates. Theoretically, the turnaround time on the 0.5 Mbps data rate is  . Others can be calculated by a similar method.
 . Others can be calculated by a similar method.
5.4. Performance on Different Numbers of Requests
In the fourth experiment, different numbers of requests were submitted to Resource Broker, including 30, 60, 90, 120, and 150 rather than 60, and each experiment lasted 10 s rather than 200 s listed in Table 11. The experimental results are shown in Figure 13, in which Figure 13a illustrates the drop rates. The greater the number of submitted user requests, the higher the drop rates. The reason is mentioned above. Due to establishing multiple routing paths to deliver packets, the SPA-Multipath drop rates are lower than those of the SPA-WP.
As illustrated in Figure 13b, when the number of user requests increases, the throughputs are lower, since generating a huge number of packets will contest the wireless AP and the wireless channel contention will be serious. The Random’s and FCFS’s throughputs are lower than those of the SPA-WP and the SPA-Multipath. This is because the former two do not balance the loads of resource nodes, and their drop rates are higher.
Figure 13c shows their turnaround times. When more requests were sent, due to higher probabilities of channel contention, job preemption (with the SPA-WP and the SPA-Multi), packet collision, job re-enqueue (with Random) and longer global queue, the turnaround times were longer. Theoretically, the turnaround time when number of requests = 30 is 186 s ((=  )). Others’ theoretical values can be calculated in the same way. With the FCFS, the performance of nodes 1 and 4 was better than that of nodes 5 and 6 so that the FCFS’s turnaround times were shorter than those of the Random, since about 66% of requests were served by the two nodes. However, if nodes 1 and 4 were the latest two nodes entering the system, the turnaround times, denoted FCFS’ in Figure 13c, were longer than those of the Random. The turnaround times with the SPA-WP and the SPA-Multipath were shorter than those with the Random and FCFS. The reason is described above.
 )). Others’ theoretical values can be calculated in the same way. With the FCFS, the performance of nodes 1 and 4 was better than that of nodes 5 and 6 so that the FCFS’s turnaround times were shorter than those of the Random, since about 66% of requests were served by the two nodes. However, if nodes 1 and 4 were the latest two nodes entering the system, the turnaround times, denoted FCFS’ in Figure 13c, were longer than those of the Random. The turnaround times with the SPA-WP and the SPA-Multipath were shorter than those with the Random and FCFS. The reason is described above.
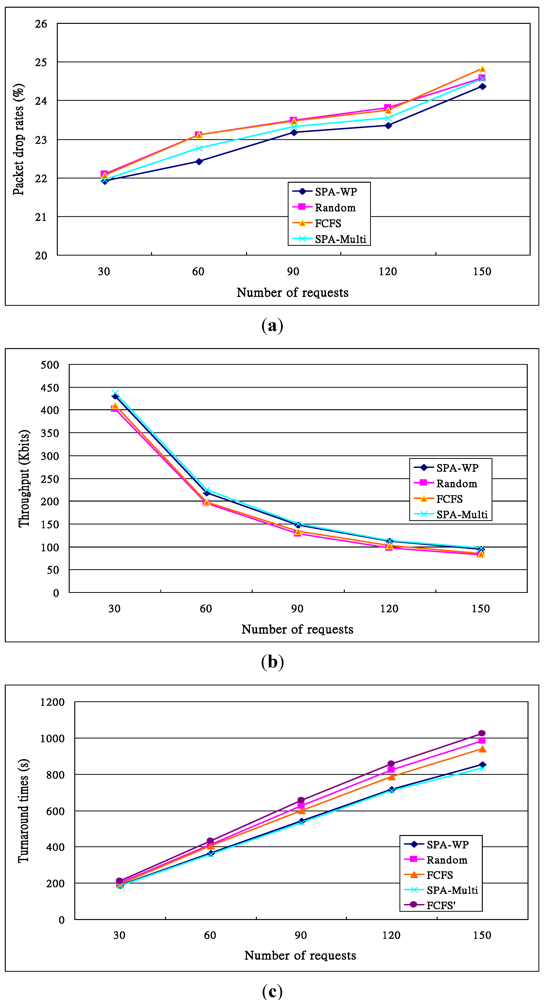
Figure 13.
Performance of the fourth experiment given different numbers of requests per second. (a) Drop rates; (b) Throughputs; (c) Turnaround times.
5.5. Performance of Nodes on Entering/Leaving the System
The fifth experiment estimated the SePCS’s system performance when different numbers of nodes enter or leave the system. The parameters used were the same as those listed in Table 11. However, the experiment duration was 110 s, packet rate = 6 requests/s, and the scenario was that one node left the wireless system at the 20th s and came back at the 30th s, two nodes left the system at the 50th s and returned at the 60th s, and three nodes went away at the 80th s and re-entered the system at the 90th s. The purpose was to simulate the handover behavior of nodes [24].
The experimental results are illustrated in Figure 14, in which Figure 14a illustrates the drop rates. When many more nodes dynamically left the system, packets sent to the nodes could not reach their destination, thus raising the drop rates. Figure 14b shows the throughputs. When one node (three nodes) left and came back again, the throughputs were the highest (lowest), because if many more nodes can serve user requests, the throughputs will be higher. Figure 14c shows the throughput distributions on different time points. When more nodes left the system, the throughputs were much lower. In fact, throughputs at time durations 81–90, 51–60 and 21–30 were respectively 123, 147 and 181. Owing to higher drop rates, the Random’s and FCFS’s throughputs were lower than those of the other two algorithms.
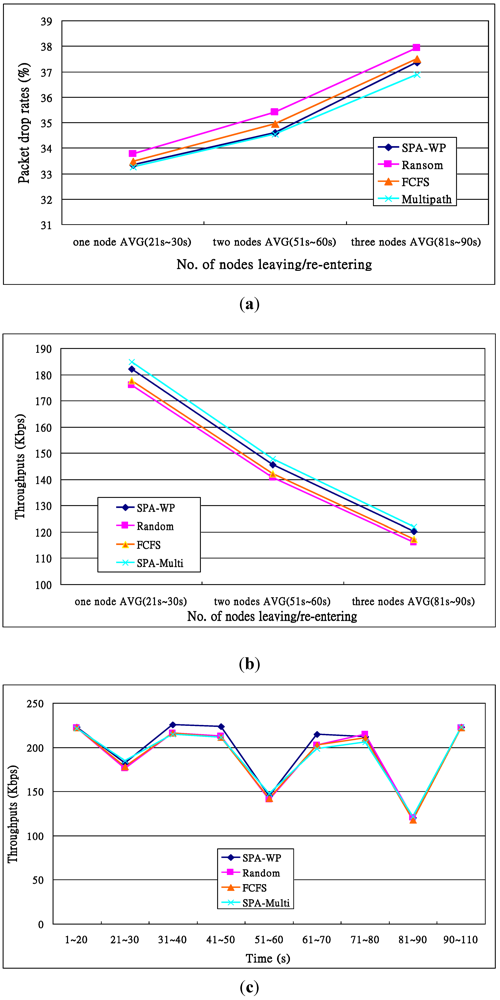
Figure 14.
Performance of the cases in which nodes leave and re-enter the tested systems. (a) Drop rates; (b) Throughputs; (c) Throughputs against time durations.
6. Conclusions and Future Work
In this paper, we propose a wireless service system that helps users to accomplish jobs under the assistance of a wireless grid, and with which users can share their own resources with others. We also reserve higher performance nodes to serve time-constrained requests, and allocate a part of the nodes to serve low-level requests to avoid the case in which some resource nodes are currently idle and some requests cannot be served immediately. The purpose is to increase the system performance and resource utilization rate, and shorten job turnaround time. The high performance resource nodes are allocated to serve more requests than low performance ones are. Type-2 and type-3 requests have longer turnaround times because of the job preemption and the relatively low performance. But without preemption, the turnaround times of type-1 requests may be longer because of long delays in the type-1 global queue. The experimental results also show that when the packet sizes and data rates increase, the turnaround times are then shorter, and the SPA-WP (SPA-Multipath) has a shorter turnaround time than other algorithms have. When the number of requests increases, the turnaround times will be longer, and the SPA (SPA-Multipath) still has the best turnaround time among the tested schemes.
In the future, we would like to study how to partition a job into sub-jobs so that they can be executed in parallel [25], and derive the behavior model and reliability model of the SePCS so that users can predict the system behavior and reliability before using it. On the other hand, the nodes may enter and leave a wireless system frequently so we would consider the job migration for a leaving node. These constitute our future research.
References
- Zhang, R.; Du, Y.; Liu, Y. New challenges to power system planning and operation of smart grid development in China. In Proceedings oftheInternational Conference on Power System Technology, Hangzhou, China, October 2010; pp. 1–8.
- Kurdi, H.; Li, M.; Al-Raweshidy, H. A classification of emerging and traditional grid systems. IEEE Distrib. Syst. Online 2008, 9, 1. [Google Scholar]
- Dahlman, E.; Parkvall, S.; Skold, J. 4G: LTE/LTE-Advanced for Mobile Broadband; Academic Press: Oxford, UK, 2011; pp. 1–13. [Google Scholar]
- Junseok, H.; Aravamudham, P. Middleware services for P2P computing in wireless grid networks. IEEE Internet Comput. 2004, 8, 40–46. [Google Scholar]
- McKnight, L.W.; Howison, J.; Bradner, S. Guest editors’ introduction: wireless grids-distributed resource sharing by mobile, nomadic, and fixed devices. IEEE Internet Comput. 2004, 8, 24–31. [Google Scholar] [CrossRef]
- Yang, C.; Xiao, J. Location-Based pairwise key establishment and data authentication for wireless sensor networks. In Proceedings of Information Assurance Workshop, June 2006; IEEE: : West Point, NY, USA; pp. 247–252.
- Yan, F.; Zhang, H.; Shen, Z.; Zhang, L.; Qiang, W. An improved wireless grid security infrastructure based on trusted computing technology. In Networking and Mobile Computing, Proceedings of the International Conference on Wireless Communications, Wuhan, China, September 2006; pp. 1–4.
- Grossman, R.L. The case for cloud computing. IT Prof. 2009, 11, 23–27. [Google Scholar] [CrossRef]
- Leu, F.Y.; Wang, T.S. A wireless grid service platform using SIP and agents. In Artificial Intelligence, Proceedings of ACIS International Conference on Software Engineering, Networking, and Parallel/Distributed Computing, Las Vegas, NV, USA, June 2006; pp. 139–144.
- Manvi, S.S.; Birje, M.N. Device resource monitoring system in wireless grids. In Control & Telecommunication Technologies, Proceedings of International Conference on Advances in Computing, Trivandrum, Kerala, December 2009; pp. 260–264.
- Birje, M.N.; Manvi, S.S.; Prasad, B. Agent based resource brokering and allocation in wireless grids. In Proceedings of the IEEE International Conference on Services Computing, Chicago, IL, USA, September 2006; pp. 331–334.
- Zeng, W.; Zhao, Y.; Song, W.; Wang, W. Wireless grid and storage system design. In Proceedings ofthe International Conference on Intelligent Information Hiding and Multimedia Signal Processing, Harbin, China, August 2008; pp. 508–511.
- Du, L.J.; Yu, Z.W. Scheduling algorithm with respect to resource intermittence in mobile grid. In. In Proceedings of theInternational Conference on Wireless Communications Networking and Mobile Computing, Chengdu, China, September 2010; pp. 1–5.
- Gharavi, H.; Bin, H. Multigate communication network for smart grid. Proc. IEEE 2011, 99, 1028–1045. [Google Scholar] [CrossRef]
- Multi-Path Routing. Available online: http://en.wikipedia.org/wiki/Multipath_routing (accessed on 13 January 2012).
- Massie, M.L.; Chun, B.N.; Culler, D.E. The ganglia distributed monitoring system: design, implementation, and experience. Parallel Comput. 2004, 30, 817–840. [Google Scholar] [CrossRef]
- Sacerdoti, F.D.; Katz, M.J.; Massie, M.L.; Culler, D.E. Wide area cluster monitoring with ganglia. In Proceedings of the IEEE International Conference on Services ComputingChicago, IL, USA, December 2003.
- Ganglia. Available online: http://ganglia.sourceforge.net/ (accessed on 10 December 2011).
- Wolski, N.S.R.; Hayes, J. The network weather service: A distributed resource performance forecasting service for metacomputing. Future Gener. Comput. System 1999, 15, 757–768. [Google Scholar] [CrossRef]
- Network Weather Service. Available online: http://nws.cs.ucsb.edu/ewiki/ (accessed on 10 December 2011).
- Leu, F.Y.; Li, M.C.; Lin, J.C.; Yang, C.T. Detection workload in a dynamic grid-based intrusion detection environment. J. Parallel Distrib. Comput. 2008, 68, 427–442. [Google Scholar] [CrossRef]
- Ubuntu. Available online: http://www.ubuntu-tw.org/ (accessed on 15 December 2011).
- Globus Toolkit. Available online: http://www.globus.org/toolkit/ (accessed on 1 December 2011).
- Leu, F.Y. A novel network mobility handoff scheme using SIP and SCTP for multimedia applications. J. Netw. Comput. Appl. 2009, 32, 1073–1091. [Google Scholar] [CrossRef]
- Cooper, I.; Walker, C. The design and evaluation of MPI-Style web services. IEEE Trans. Serv.Comput. 2009, 2, 197–209. [Google Scholar]
© 2012 by the authors; licensee MDPI, Basel, Switzerland. This article is an open-access article distributed under the terms and conditions of the Creative Commons Attribution license (http://creativecommons.org/licenses/by/3.0/).